

Abstract
Genome‐wide association studies (GWAS) have identified multiple gastric cancer risk loci and several protein‐coding susceptibility genes. However, the role of long‐noncoding RNAs (lncRNAs) transcribed from these risk loci in gastric cancer development and progression remains to be explored. Here, we functionally characterize a lncRNA, lncPSCA, as a novel tumor suppressor whose expression is fine‐regulated by a gastric cancer risk‐associated genetic variant. The rs2978980 T > G change in an intronic enhancer of lncPSCA interrupts binding of transcription factor RORA, which down‐regulates lncPSCA expression in an allele‐specific manner. LncPSCA interacts with DDX5 and promotes DDX5 degradation through ubiquitination. Increased expression of lncPSCA results in low levels of DDX5, less RNA polymerase II (Pol II) binding with DDX5 in the nucleus, thus activating transcription of multiple p53 signaling genes by Pol II. These findings highlight the importance of functionally annotating lncRNAs in GWAS risk loci and the great potential of modulating lncRNAs as innovative cancer therapy.
Keywords: DDX5, gastric cancer, lncPSCA, Pol II, risk variant
Subject Categories: Cancer, RNA Biology, Signal Transduction
The long non‐coding RNA lncPSCA is a tumor suppressor encoded at the 8q24.3 gastric cancer risk locus. LncPSCA promotes DDX5 degradation, reduces RNA polymerase II interactions with DDX5, and activates transcription of multiple p53 signaling genes.

Introduction
According to the GLOBOCAN estimates, gastric cancer (GC) is the fifth most frequently diagnosed malignancy (n = 1,089,103 new cases, 5.6% of the total cancer cases) and the fourth leading cause of cancer death worldwide (n = 768,793 deaths, 7.7% of the total cancer deaths) in 2020 (Sung et al, 2021). Incidence rates of GC are markedly elevated in Eastern Asia including China. H. pylori infection, foods preserved by salting, low fruit intakes, alcohol consumption and active tobacco smoking are established risk factors for GC (Sung et al, 2021). Among them, H. pylori infection is predominantly important (Plummer et al, 2015). However, only a small portion of individuals infected by H. pylori eventually developed GC, elucidating that the genetic makeup also plays a crucial part in GC etiology.
Genome‐wide association studies (GWASs) have identified multiple GC risk loci, such as 1q22, 1p35.2, 3q13.31, 3q11.2, 4q28.1, 5p13.1, 5q14.3, 6p21.1, 6p22.1, 8q24.3, 9q34.2, 10q23.33, 11q22.3, 12q24.11‐12 and 20q11.21 (Sakamoto et al, 2008; Abnet et al, 2010; Saeki et al, 2011; Shi et al, 2011; Helgason et al, 2015; Hu et al, 2016; Wang et al, 2017; Zhu et al, 2017; Tanikawa et al, 2018; Yan et al, 2020). Several genes in these risk loci have been functionally confirmed as GC‐susceptibility genes, including MUC1 at 1q22 (Saeki et al, 2015), SPOCD1 at 1p35.2 (Hu et al, 2016), PSCA at 8q24.3 (Sakamoto et al, 2008; Sung et al, 2016; Yan et al, 2020), PRKAA1 at 5p13.1 (Yan et al, 2020), BTN3A2 at 6p22.1 (Hu et al, 2016), and NOC3L at 10q23.33 (Yan et al, 2020). For example, down‐regulation of PSCA at 8q24.3 was reported in GC specimens compared to normal tissues. Consistently, the growth efficiency of GC cells stably overexpressing PSCA was slower than that of GC cells with low PSCA expression, which supports its role as a tumor suppressor (Sakamoto et al, 2008). The GC‐susceptibility rs2294008 T allele in PSCA 5’‐UTR generates a consensus binding sequence for transcription factor Yin Yang 1 (YY1), recruits YY1 to PSCA promoter and significantly suppresses PSCA expression in vivo, which eventually predisposes gastric epithelial cells to GC development (Sakamoto et al, 2008; Saeki et al, 2015; Sung et al, 2016).
Long noncoding RNAs (lncRNAs) are a class of long transcripts which are more than 200 nucleotides and mostly cannot be translated into proteins (Leucci et al, 2016; Leucci, 2018; ICGC/TCGA Pan‐Cancer Analysis of Whole Genomes Consortium, 2020; Statello et al, 2021). Although originally considered as transcriptional noise of human genome, lncRNAs have been implicated in development of cancers with varying levels of evidences (Leucci, 2018; Statello et al, 2021). Recent studies indicated that several lncRNAs, which are transcribed from genome intervals surrounding cancer risk signals, are involved in tumorigenesis (Guo et al, 2016; Betts et al, 2017; Cho et al, 2018; Gao et al, 2018; Hua et al, 2018; Leucci, 2018; Moradi Marjaneh et al, 2020; Statello et al, 2021). However, the role of lncRNAs transcribed from the GC‐susceptibility loci in disease development and progression remains to be explored.
In the current study, we fine‐mapped the PSCA locus (chr8:143,757,626–143,758,499) in our previous meta‐analysis of four Chinese ancestry GWASs, and found that one functional GC risk rs2978980 SNP located within an intronic enhancer of lncPSCA (NR_033343.1, the noncoding transcript of PSCA). Interestingly, the rs2978980 genetic variant interrupts binding of transcription factor RORA and regulates lncPSCA expression in vivo and in vitro. In particular, the protective T allele‐activated lncPSCA suppresses GC proliferation and metastasis through interacting with DDX5 and reprogramming RNA polymerase II (RNA Pol II)‐regulated transcriptional activation of downstream tumor suppressor genes.
Results
The SNP rs2978980 is located at a functional enhancer in the 8q24.3 GC‐susceptibility locus
To identify functional GC‐susceptibility SNPs in the 8q24.3 locus (chr8:143,749,715–143,766,143), we systematically evaluated seventy‐five SNPs using our previous meta‐GWASs including 3,771 GC cases and 5,426 controls from four Chinese ancestry datasets (Yan et al, 2020). Among these genetic polymorphisms, forty‐two SNPs are significantly associated with GC risk after Bonferroni correction (P < 6.7 × 10⁻⁴), including rs2294008 and rs2976392 which were reported previously (Appendix Table S1; Sakamoto et al, 2008; Lochhead et al, 2011; Shi et al, 2011; Wang et al, 2012; Mocellin et al, 2015; Sung et al, 2016; Cui et al, 2019). Interestingly, two GC‐risk SNPs rs2978980 and rs2920282, which are in complete linkage disequilibrium (LD) (r 2 = 1) are located in an enhancer region in gastric tissues according to the Roadmap Epigenomics and ENCODE projects (Fig 1A and Appendix Fig S1). Notably, in situ Hi‐C assays indicated that the enhancer region is close to the transcription start site (TSS) of lncPSCA, but not the TSS of the protein‐coding PSCA (GenBank: NM_005672.4), in 3D architecture of human genome (Appendix Fig S2; Rao et al, 2014), suggesting that it might be an intronic enhancer of lncPSCA. Transcription factor binding prediction indicated that the rs2978980 T allele shows transcription factor RORA binding but the G allele does not (Fig 1B). Consistent to our data in Chinese populations, the rs2978980 SNP was also significantly associated with GC risk in a European population‐based on a GWAS including 2,500 population‐based GC patients and 205,652 controls (P = 1.7 × 10⁻⁷; Helgason et al, 2015).
Figure 1. Gastric cancer risk SNP rs2978980 alters the enhancer activity of a novel lncRNA lncPSCA in the 8q24 locus.
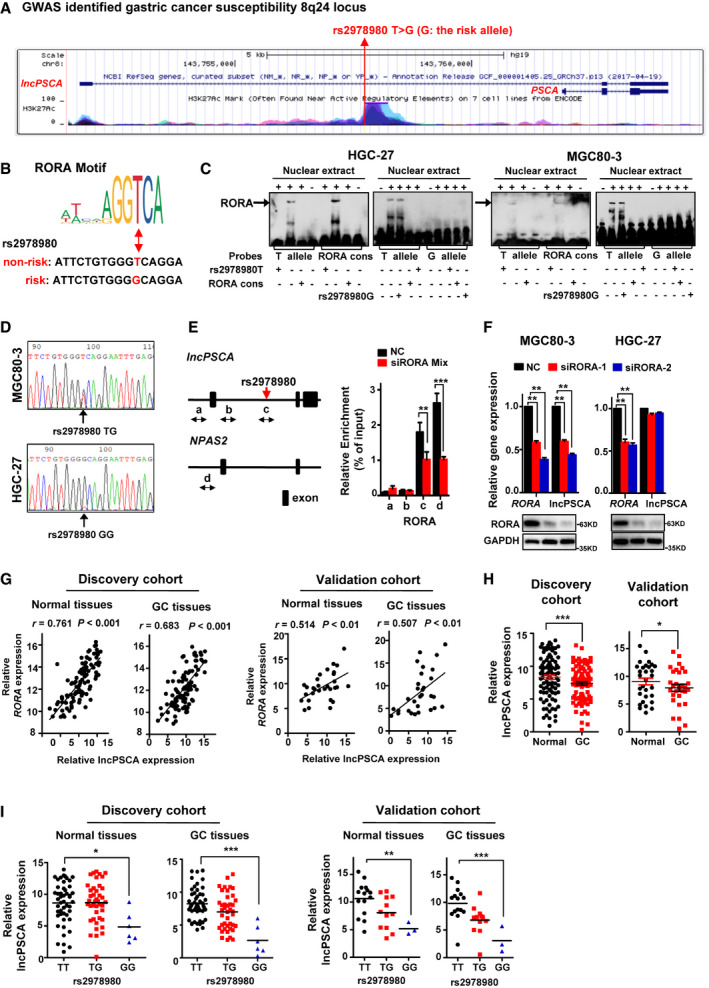
- A schematic view of the lncPSCA and PSCA loci. The risk‐associated SNP rs2978980 is shown as the red vertical line. Data from the UCSC Genome Browser, including epigenetic marks for histone H3 lysine 27 acetylation (H3K27ac), are shown.
- Abolishment of a RORA binding site in the lncPSCA intronic enhancer by the rs2978980 T > G SNP. The risk allele G of rs2978980 disrupts a RORA binding motif.
- Electrophoretic mobility‐shift assay (EMSA) with biotin‐labeled RORA consensus, rs2978980T or rs2978980G probes and HGC‐27 or MGC80‐3 nuclear extracts. HGC‐27 or MGC80‐3 left panel: EMSA with RORA consensus or rs2978980T probes. Lane 1–8: from the first lane at the left side to the right side. Lanes 4 and 8, probe only; lanes 2 and 6, probe and nuclear extracts; lanes 1, 3, 5, and 7, probe and nuclear extracts plus 100× unlabeled rs2978980T (lanes 1 and 5) or RORA consensus probes (lanes 3 and 7). HGC‐27 or MGC80‐3 right panel: EMSA with rs2978980T or rs2978980G probes. Lanes 1 and 6, probe only; lanes 2 and 7, probe and nuclear extracts; lanes 3–5 and 8–10, probe and nuclear extracts plus 100× unlabeled rs2978980T (lanes 5 and 8), rs2978980G (lanes 3 and 10), or RORA consensus probes (lanes 4 and 9).
- Sanger sequencing chromatograms of the SNP region indicated that the MGC80‐3 cell line carries the TG genotype and HGC‐27 has the GG genotype.
- ChIP‐qPCR assays using MGC80‐3 cells carrying the rs2978980TG genotype. The presence of RORA‐binding lncPSCA enhancer region was verified by qPCR with NPAS2 as the positive control. Region a and b: the negative control regions of lncPSCA promoter and intron 1; region c: the lncPSCA enhancer region around rs2978980 SNP; region d: the positive control NPAS2 promoter region. Left subpanel: RORA ChIP‐qPCR fragments on lncPSCA (a, b, and c) and NPAS2 (d) genes; right subpanel: RORA ChIP‐qPCR results of lncPSCA (a, b, and c) and NPAS2 (d) genes. Data show one representative example of three biological replicates.
- Suppression of RORA using siRNAs (siRORA‐1 and siRORA‐2) could markedly down‐regulate lncPSCA expression in MGC80‐3 cells but not in HGC‐27 cells. In details, MGC80‐3 and HGC‐27 cells were transfected with siRORA‐1 and siRORA‐2, lncPSCA and RORA expression levels were measured by RT–qPCR and Western blot.
- In gastric cancer or normal tissues of discovery cohort (n = 96) and validation cohort (n = 30), there were significantly positive expression correlations between RORA and lncPSCA.
- Expression levels of lncPSCA were quantified using RT–qPCR in tumor‐normal pairs of both cohorts, respectively. All data of lncPSCA expression were normalized to GAPDH expression levels.
- In gastric cancer or normal tissues of both cohorts, there was a significant allele‐differential expression between rs2978980G‐allele carriers or T‐allele carriers.
Data information: The difference between two groups was calculated using Student’s t test. One‐way ANOVA analysis with Dunnett’s test was used for multiple comparisons. The significance of association between gene expression and rs2978980 genotypes was calculated using Spearman’s correlation. *P < 0.05; **P < 0.01; ***P < 0.001.
Source data are available online for this figure.
Since rs2978980 SNP is located in the RORA consensus binding sequence, we conducted electrophoretic mobility‐shift assays (EMSA) to distinguish the differences in binding ability between the rs2978980T and G alleles to RORA (Fig 1C). We found that RORA‐containing HGC‐27 nuclear extracts bound only to the biotin‐labeled oligonucleotide probe with the T allele or the RORA consensus sequence but not the G allele probe (Fig 1C). A 100‐fold excess of unlabeled T allele oligonucleotides or unlabeled RORA consensus oligonucleotides efficiently competed for the binding activity of the T allele probe (Fig 1C). However, unlabeled G allele oligonucleotides did not affect the binding activity of the T allele probe. Similar results were observed when using RORA‐containing MGC80‐3 nuclear extracts (Fig 1C). We also performed the EMSA competition assays using the RORA antibody (Appendix Fig S3). Interestingly, although the super‐shift bands were not found, we did observe gradually attenuated RORA binding bands with increased amount of RORA antibody used for the rs2978980T probes in both GC cell lines (Appendix Fig S3A–C). Sanger sequencing indicated the MGC80‐3 cell line carries the TG genotype and HGC‐27 has the GG genotype (Fig 1D). As a result, we further confirmed that the binding of RORA to the lncPSCA intronic enhancer region occurred in vivo in MGC80‐3 cells using ChIP assays with NPAS2 as the positive control. The lncPSCA enhancer region around rs2978980 SNP (region c), but not negative control regions (regions a and b), could be specifically precipitated with the RORA antibody (Fig 1E). Consistently, the positive control NPAS2 promoter region (region d) could also be precipitated with the RORA antibody (Fig 1E). Silencing of RORA expression with siRNAs (siRORA mix) significantly reduced lncPSCA enhancer DNA or NPAS2 promoter DNA precipitated compared to the NC RNA group (both P < 0.01; Fig 1E).
We further examined impacts of transcription factor RORA on lncPSCA expression. In MGC80‐3 cells, suppression of RORA using siRNAs (siRORA‐1 and siRORA‐2) could markedly down‐regulate lncPSCA expression (P < 0.01) (Fig 1F). However, silencing of RORA did not obviously change lncPSCA expression in HGC‐27 cells with the rs2978980 GG genotype (Fig 1F). After detecting RORA and lncPSCA expression in GC tissues and adjacent normal tissues from patients of the discovery cohort (n = 96) and validation cohort (n = 30) (Appendix Table S2 and S3), we observed significantly positive expression correlations between RORA and lncPSCA in these specimens (both P < 0.001; Fig 1G). There was an evident lncPSCA down‐regulation in GC tissues compared to normal tissues in discovery cohort or validation cohort (both P < 0.05; Fig 1H). Importantly, we found a significantly allele‐differential lncPSCA expression between rs2978980G‐allele carriers or T‐allele carriers in either GC or normal tissues from both cohorts (all P < 0.05; Fig 1I), which is in support of the regulatory role of rs2978980 via differential binding of RORA.
Identification of lncPSCA as a novel GC‐susceptibility gene
The CPAT tool (https://wlcb.oit.uci.edu/cpat/index.php) predicts that lncPSCA may have an open read frame (ORF) (Appendix Fig S4). To test this, we generated two GFP fusion protein constructs (pEGFP‐N1‐ORF and pEGFP‐N1‐5’UTR‐ORF) as reported previously (Huang et al, 2017; Appendix Fig S4A). The pEGFP‐N1‐ORF construct includes the CPAT‐predicted ORF (435–1,004 nt of NR_033343.2) and the pEGFP‐N1‐5’UTR‐ORF construct includes the “so‐called” 5’UTR (1–434 nt of NR_033343.2) plus ORF. These two constructs and pEGFP‐N1 were transfected into HEK293T cells. After 48 h, obvious GFP was found in pEGFP‐N1‐transfected cells; however, expression of the fusion protein was not observed in pEGFP‐N1‐ORF or pEGFP‐N1‐5’UTR‐ORF‐transfected cells (Appendix Fig S4B). Similarly, the PhyloCSF prediction results indicated that lncPSCA does not have coding potential (Appendix Fig S4C). Taken together, these data revealed that lncPSCA does not encode a peptide.
Considering the role of lncPSCA in GC development is still unclear, we firstly studied whether silencing or overexpression of lncPSCA could modulate cell proliferation. Down‐regulation of lncPSCA by siRNAs significantly accelerated proliferation of GC cells compared to cells transfected with NC RNA (all P < 0.05) (Appendix Fig S5A and B). On the contrary, elevated expression of lncPSCA significantly suppressed cell growth in different GC cells (all P < 0.01) (Appendix Fig S5C and D). To gain insight into the functional relevance of lncPSCA, we developed the CRISPR/Cas9‐engineered lncPSCA‐knockout GC cells (MGC80‐3: KO‐C1 and KO‐C3; HGC‐27: KO‐C14 and KO‐C40) (Fig 2A and B; Appendix Fig S6–S8) and the stably lncPSCA‐overexpression GC cells (MGC80‐3: lncP‐C5 and lncP‐C7; HGC‐27: lncP‐C1 and lncP‐C10). As shown in Fig 2C, stable lncPSCA‐knockout resulted in significantly enhanced proliferation of GC cell lines compared to the control cells (P < 0.05) (Fig 2C). Stable lncPSCA overexpression could obviously inhibit viability of GC cells (P < 0.01) (Fig 2C). Colony formation assays also supported the tumor suppressor role of lncPSCA in GC (Fig 2D and Appendix Fig S9). Considering that PSCA and lncPSCA share common exons and that both are tumor suppressor, we detected mRNA and protein expression levels of PSCA in the lncPSCA‐knockout GC cells. We found that there were no evident PSCA expression changes in stable lncPSCA‐knockout GC cells (Appendix Fig S10A and B).
Figure 2. lncPSCA suppresses gastric cancer cell proliferation in vitro and in vivo .
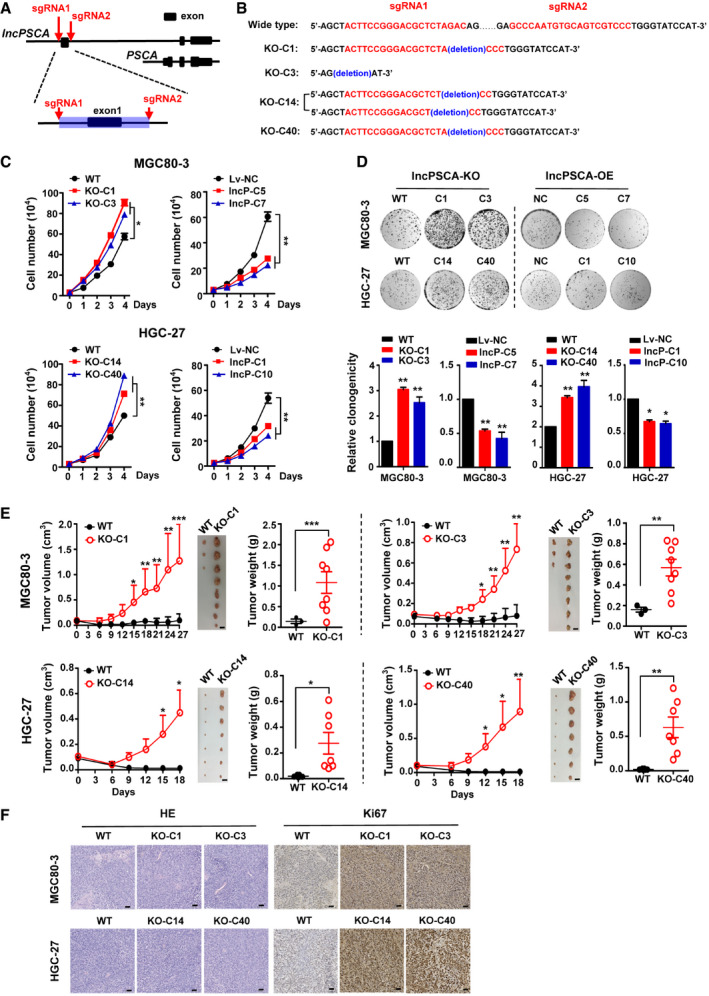
- A diagram of sgRNA locations for development of the CRISPR/Cas9‐engineered lncPSCA‐knockout gastric cancer cells.
- The detailed information of deleted sequences in various lncPSCA‐knockout clones (MGC80‐3: KO‐C1 and KO‐C3; HGC‐27: KO‐C14 and KO‐C40).
- In MGC80‐3 and HGC‐27 cells, lncPSCA‐knockout resulted in significantly enhanced cell proliferation comparing with the control cells. Stably lncPSCA overexpression could obviously inhibit viability of gastric cancer cells. Data show one representative example of three biological replicates.
- Colony formation assays. Upper subpanel: photos of cell clones in each well; lower subpanel: numbers of cell clones in each well. Data show one representative example of three biological replicates.
- lncPSCA‐knockout significantly promoted growth of MGC80‐3 (n = 8) or HGC‐27 (n = 7) xenografts compared with control xenografts after 27 or 18 days.
- HE and Ki67 staining of MGC80‐3 or HGC‐27 xenografts. Scale bar = 100 μm.
Data information: Each value represents mean ± SD. The difference between two groups was calculated using Student’s t test. *P < 0.05; **P < 0.01, ***P < 0.001.
We then evaluated the anticancer capability of lncPSCA in vivo. We found that the growth of the lncPSCA‐knockout MGC80‐3 or HGC‐27 xenografts in mice was significantly accelerated compared with that of control xenografts after 27 or 18 days (Fig 2E). Evidently increased tumor weights were also observed in the lncPSCA‐knockout group compared to the control group (Fig 2E). Ki67 protein levels in xenografts of the lncPSCA‐knockout group were higher than those in control xenografts (Fig 2F).
LncPSCA inhibits GC invasion and metastasis in vitro and in vivo
We next examined whether lncPSCA could influence migration, invasion and metastasis of GC cells. The wound‐healing assays demonstrated that lncPSCA knockdown with siRNAs or stable lncPSCA knockout with the CRISPR/Cas9 system promoted migration of MGC80‐3 and HGC‐27 cells (Appendix Fig S11A–C and S12A–D; Fig 3A). In contrast, overexpression of lncPSCA impaired cell motility (Appendix Fig S11A–C and S12A–D; Fig 3A). The impact of lncPSCA on invasiveness of MGC80‐3 and HGC‐27 cells was determined using the Matrigel invasion assays. Silencing or knockout of lncPSCA can enhance invasion of MGC80‐3 and HGC‐27 cells (Appendix Fig S11A–C and S12A–D; Fig 3B). In line with this observation, reduced invasion capability of GC cells was observed after elevated lncPSCA expression (Appendix Fig S11A–C and S12A–D; Fig 3B). To investigate the mechanistic rationale, we measured the expression of four markers of epithelial‐to‐mesenchymal transition (EMT) in GC cells. Intriguingly, lncPSCA could significantly promote expression of β‐catenin and ZO‐1 and inhibit expression of SNAIL and VIMENTIN. Knockout of lncPSCA reduced β‐catenin and ZO‐1 expression and stimulated expression of SNAIL and VIMENTIN (Fig 3C and Appendix Fig S13A–C). These results suggested that lncPSCA may inhibit EMT of GC cells and result in decreased cell migration and invasion.
Figure 3. lncPSCA reduces migration, invasion, and metastasis capabilities of gastric cancer cells.
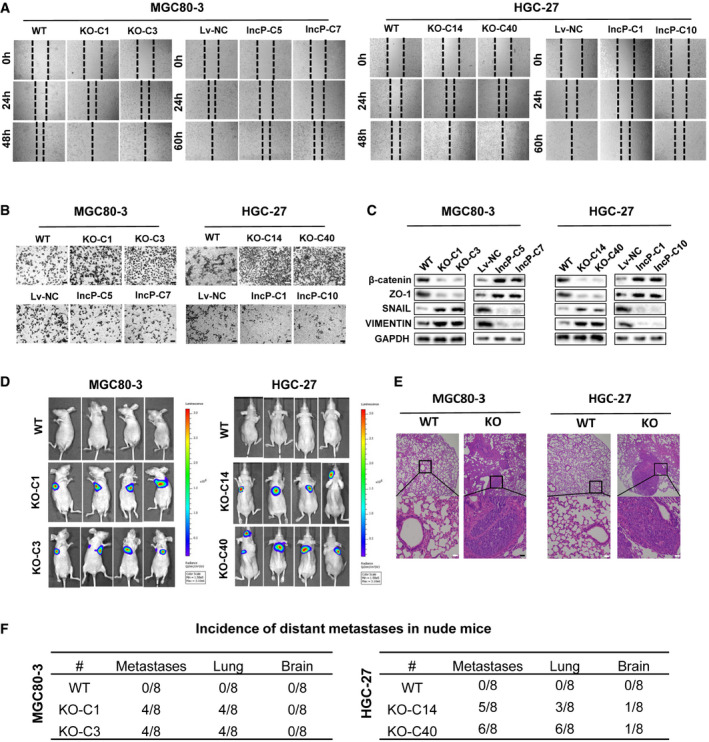
- In MGC80‐3 and HGC‐27 cells, lncPSCA‐knockout accelerates wound‐healing and the stably enforced lncPSCA expression inhibits wound‐healing. The dashed lines indicate the edges of the cell layers.
- lncPSCA inhibits invasion abilities of MGC80‐3 and HGC‐27 cells. Cells on the lower surface of the chamber were stained by crystal violet. Scale bar = 100 μm.
- In MGC80‐3 and HGC‐27 cells, expression changes of different markers (β‐catenin, ZO‐1, SNAIL, and VIMENTIN) of epithelial‐to‐mesenchymal transition were examined after overexpression or knockout of lncPSCA.
- Fluorescent images of tumors in nude mice with tail vein injected MGC80‐3 and HGC‐27 cells with or without knockout of lncPSCA.
- Representative images of hematoxylin and eosin‐stained slides of lung metastatic nodules of MGC80‐3 and HGC‐27 with or without knockout of lncPSCA. Scale bar = 100 μm.
- Incidence of distant metastases in nude mice (n = 8 per group).
Source data are available online for this figure.
We then explored the biological significance of lncPSCA during in vivo metastasis of GC cells. The tail vein injection mouse model further proved that knockout of lncPSCA can remarkably accelerate lung metastasis and brain metastasis of GC cells (Fig 3D). These results were confirmed by histological analyses of the metastasis tumors (Fig 3E). Incidence of distant metastases in nude mice was showed in Fig 3F. Collectively, these findings indicated that lncPSCA suppresses GC metastasis in vitro and in vivo.
LncPSCA promotes DDX5 degradation
Since lncRNAs could function through interacting with various proteins, we speculated that lncPSCA may interact with certain protein(s) to impact GC development. To test this hypothesis, we firstly examined cellular localization of lncPSCA and found that it is predominantly in the nuclear fraction of GC cells (Fig 4A). Using RNA pull‐down assays with HGC‐27 nucleus extracts, we observed multiple proteins which could be pulled‐down by lncPSCA (Fig 4B). Mass spectrometry proteomics indicated that the most abundant protein among these proteins was DDX5 (Appendix Table S4). We then validated seven candidate proteins through independent RNA pull‐down assays and successfully verified DDX5 (Fig 4C). RNA immunoprecipitation (RIP) assays also confirmed more than 100‐fold enrichment of lncPSCA in RNA‐protein complexes precipitated with antibody against DDX5 as compared with the IgG control in GC cells (P < 0.001) (Fig 4D). During RIP, HOTTIP was used as the negative control and SRA as the positive control (Fig 4D).
Figure 4. lncPSCA interacts with DDX5 and promotes DDX5 degradation.
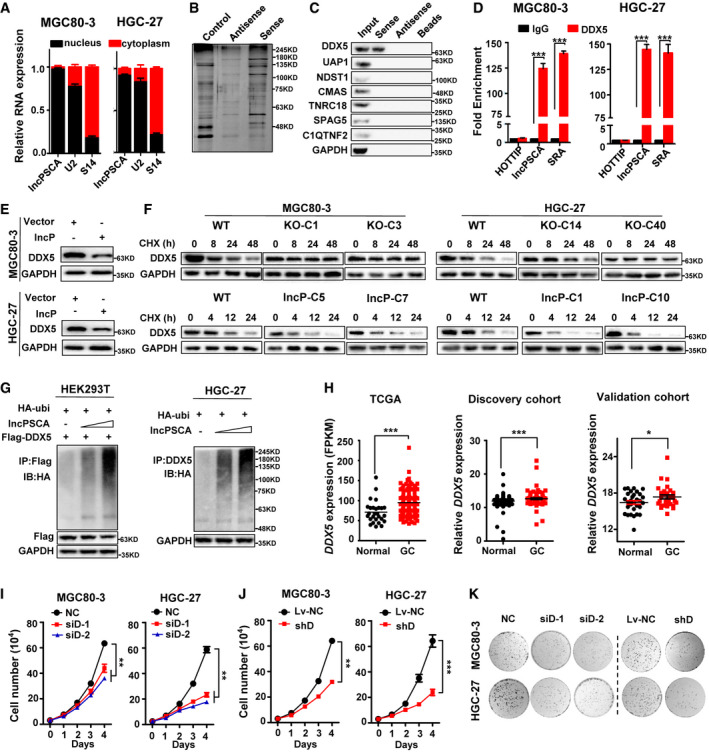
- lncPSCA predominantly locates in the nuclear fraction of gastric cancer cells. In detail, the cytosolic and nuclear fractions of HGC‐27 or MGC80‐3 cells were separately isolated. RNA was isolated from either the cytosolic fraction or the nuclear fraction. Expression of lncPSCA in the cytosolic and nuclear RNA was measured. Data show one representative example of three biological replicates.
- Silver staining of lncPSCA pull‐down nuclear proteins of gastric cancer cells.
- lncPSCA pull‐down followed by Western blot validated its interaction with DDX5 and other candidate proteins identified by mass spectrometry. GAPDH served as the control.
- RIP assays show association of DDX5 with lncPSCA in MGC80‐3 and HGC‐27 cells. Relative enrichment (means ± SD) represents RNA levels associated with DDX5 relative to an input control from three independent experiments. IgG served as the control. HOTTIP was used as the negative control and SRA as the positive control during RIP. Data show one representative example of three biological replicates.
- Western blot analyses of DDX5 protein in gastric cancer cells with the enforced expression of lncPSCA.
- Gastric cancer cells after lncPSCA‐knockout or stably overexpressing lncPSCA and control cells were treated with cycloheximide (CHX) or vehicle for the indicated periods of time. DDX5 levels were analyzed by Western blot.
- Western blot to detect the ubiquitination of DDX5 in HEK293T cells cotransfected with pcDNA‐lncPSCA, HA‐Ubiquitin and Flag‐DDX5 (left panel) or in HGC‐27 cells cotransfected with pcDNA‐lncPSCA and HA‐Ubiquitin (right panel).
- Expression of DDX5 was compared between normal and gastric cancer samples in TCGA cohort (left), Shandong discovery cohort (middle) and Shandong validation cohort (right).
- Knockdown of DDX5 with siRNA (siD‐1 and siD‐2) substantially reduced the proliferation of gastric cancer cells. Data show one representative example of three biological replicates.
- Silencing of DDX5 with shRNA (shD) significantly reduced the proliferation of gastric cancer cells. Data show one representative example of three biological replicates.
- Effects of DDX5 knockdown on the colony formation of gastric cancer cells. HGC‐27 or MGC80‐3 were seeded into a 6‐well cell culture plate and transfected with DDX5 siRNAs (siD‐1 and siD‐2). The HGC‐27 or MGC80‐3 cells stably transfected with the DDX5 shRNA (shD) were seeded into a 6‐well culture plate. When colonies were visible after 14 days, cells were washed with cold PBS twice and fixed with the fixation fluid. Cells were stained with crystal violet, and photographs were taken.
Data information: The difference between two groups was calculated using Student’s t test. *P < 0.05, **P < 0.01, ***P < 0.001.
Source data are available online for this figure.
We then examined the molecular consequences of the interaction between lncPSCA and DDX5. Although the expression levels of DDX5 mRNA were not changed (Appendix Fig S14A–E), the expression levels of DDX5 protein were markedly suppressed when lncPSCA was overexpressed (Fig 4E and Appendix Fig S14A–E). Treatment of the lncPSCA‐knockout GC cells with the protein synthesis inhibitor CHX increased expression of endogenous DDX5 protein compared to wild‐type GC cells (Fig 4F and Appendix Fig S14A–E). Conversely, treatment of GC cells overexpressing lncPSCA with CHX resulted in a notably shorter half‐life of DDX5 protein than in control cells (Fig 4F and Appendix Fig S14A–E), suggesting that lncPSCA may be involved in regulating degradation of DDX5 protein through the ubiquitin‐proteasome pathway. As expected, the ubiquitination of DDX5 was strikingly increased in cells overexpressing lncPSCA in comparison with control cells (Fig 4G). After exogenous DDX5 was immunoprecipitated in HEK293T cells transfected with HA‐ubi and FLAG‐DDX5, evidently increased ubiquitin signals of DDX5 protein were found in cells after lncPSCA overexpression (Fig 4G). Consistent with this, obviously elevated ubiquitin signals of endogenous DDX5 protein were detected in HGC‐27 cells overexpressing lncPSCA compared to the control GC cells (Fig 4G). Taken together, these data elucidated that lncPSCA accelerates degradation of DDX5 through ubiquitination. Consistent to the TCGA STAD data, evidently increased DDX5 expression was found in our GC patient cohorts (all P < 0.05) (Fig 4H). Silencing of DDX5 expression with siRNAs or shRNA impaired viability and clonogenic capacity of GC cells (Fig 4I–K; Appendix Fig S15A–C), suggesting a strong oncogenic potential of DDX5 in GC.
Silencing DDX5 activates the Pol II‐controlled gene transcription program
DDX5 is a multifunctional RNA binding protein and RNA Pol II has been identified as a DDX5 partner in nucleus of prostate cancer cells (Clark et al, 2013; Nyamao et al, 2019). Considering the importance of RNA Pol II in controlling the gene transcription program, we firstly examined whether DDX5 is also a partner protein of RNA Pol II in GC cells. Co‐IP assays showed that endogenous RNA Pol II precipitated with DDX5 and, in contrast, endogenous DDX5 also precipitated with RNA Pol II in GC cells under physiological conditions (Fig 5A). As a result, we performed ChIP‐seq of total RNA Pol II to investigate impacts of DDX5 on the genome‐wide gene transcription program in HGC‐27 cells after silencing of DDX5 (lv‐shD). We plotted the normalized tag counts from the RNA Pol II ChIP‐seq data. Intriguingly, when normalized to the same sequencing depth, the RNA Pol II signals were much stronger in GC cells with silenced DDX5 expression compared to those in negative control cells (lv‐NC) (Fig 5B). We observed prominently enriched RNA Pol II signals along the genome and increased RNA Pol II enrichment in HGC‐27 cells after silencing of DDX5 compared to the control group (Fig 5C). Together, the results indicated that that silencing of DDX5 dramatically enhances RNA Pol II enrichment along human chromatin in GC.
Figure 5. lncPSCA‐induced degradation of DDX5 releases RNA Pol II from the DDX5‐Pol II complex in nucleus.
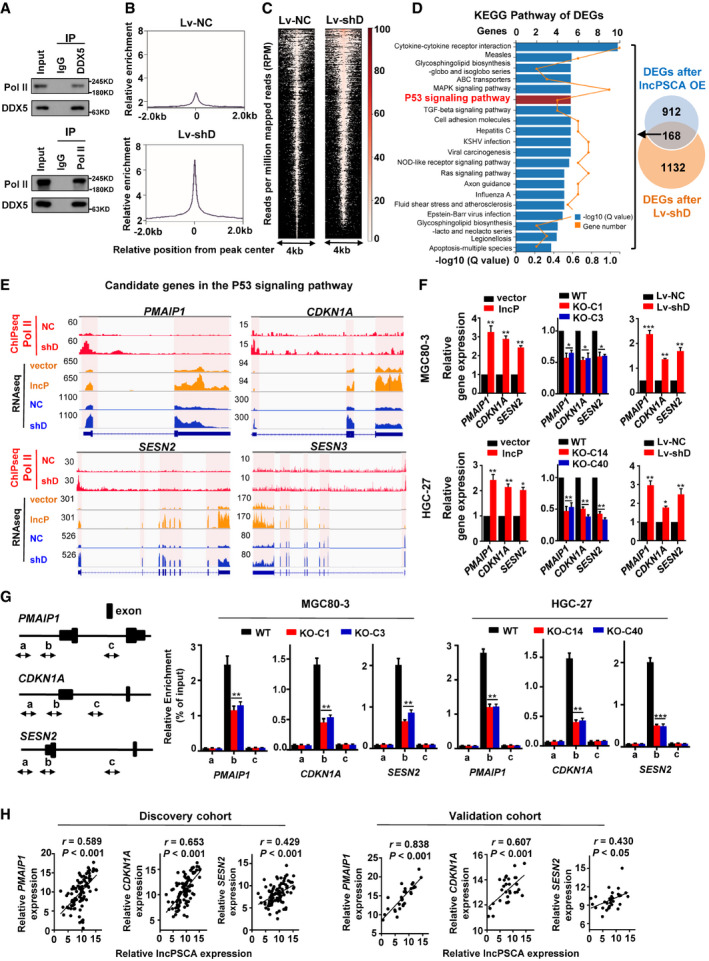
- Western blot for RNA Pol II among proteins pulled down with anti‐DDX5 (up) and for DDX5 among proteins pulled down with an anti‐Pol II antibody (down).
- Global increase in RNA Pol II signals after silencing of DDX5 (lv‐shD) in HGC‐27 cells. Average RNA Pol II ChIP‐seq signal at all RNA Pol II peak regions. Upper subpanel: negative control, Lv‐NC; lower subpanel: silencing of DDX5, lv‐shD.
- Reads per million mapped reads (RPM) of RNA Pol II ChIP‐seq signals of genes in human genome.
- KEGG Pathway analyses of overlapped differential expressed genes (DEGs) in both lncPSCA‐overexpression cells and the DDX5‐konckdown cells identified multiple pathways involved in cancer biology, with the P53 and MAPK signaling pathways as two of the most markedly changed pathways.
- RNA Pol II ChIP‐seq and RNA‐seq signals of PMAIP1, CDKN1A, SESN2, and SESN3 in HGC‐27 cells. Red bars represent the RNA Pol II ChIP‐seq signal. Orange or blue bars represent the RNA‐seq signals of HGC‐27 cells overexpressing lncPSCA (lncP) or with silenced DDX5 (shD), respectively.
- Validation of candidate downstream genes of the lncPSCA‐DDX5 axis identified through the integrated analyses. RT–qPCR was performed for PMAIP1, CDKN1A, and SESN2 genes upon overexpression of lncPSCA (lncP), silencing of DDX5 (shD) or lncPSCA knockout. Error bars indicate the SEM. Data show one representative example of three biological replicates.
- ChIP‐qPCR assays were performed for PMAIP1, CDKN1A, and SESN2 genes and demonstrated that significantly decreased RNA Poll II enrichment around TSS of PMAIP1, CDKN1A and SESN2 in various stable lncPSCA knockout GC cell lines. Left subpanel: RNA Pol II ChIP‐qPCR fragments a, b, and c on PMAIP1, CDKN1A, and SESN2 genes; middle and right subpanels: RNA Pol II ChIP‐qPCR results of PMAIP1, CDKN1A, and SESN2 genes in MGC80‐3 (middle) and HGC‐27 cells (right). Data show one representative example of three biological replicates.
- Correlations between lncPSCA levels and the mRNA levels of the P53 signaling PMAIP1, CDKN1A, and SESN2 genes in gastric cancer tissues discovery cohort (n = 96) and validation cohort (n = 30). RNA levels were determined by RT–qPCR relative to GAPDH. The r values and P values are from Pearson’s correlation analyses.
Data information: The difference between two groups was calculated using Student’s t test. The significance of expression association between different genes was calculated using Spearman’s correlation. *P < 0.05, **P < 0.01, ***P < 0.001.
Source data are available online for this figure.
Next, we identified significantly differential expressed genes (DEGs) in HGC‐27 cells after overexpression of lncPSCA or silencing of DDX5 (Fig 5D). There were 863 significantly up‐regulated genes and 217 down‐regulated genes after overexpression of lncPSCA (Fold change > 1.5, P < 0.05). Silencing of DDX5 resulted in 894 significantly up‐regulated genes and 452 down‐regulated genes. A total of 168 overlapped DEGs were identified in cells after overexpression of lncPSCA or silencing of DDX5. KEGG pathway analyses of these overlapped DEGs revealed that they were enriched for multiple pathways involved in cancer biology, with the P53 and MAPK signaling pathways as two of the most markedly changed pathways (Fig 5D). To further explore impacts of altered lncPSCA levels on the P53 or MAPK signaling, we plotted the histogram of RNA Poll II ChIP‐seq and RNA‐seq read counts for four P53 signaling candidate genes (PMAIP1, CDKN1A, SESN2, and SESN3) (Fig 5E) and nine MAPK signaling candidate genes (JUN, VEGEA, FGF21, ANGPTL1, NGFR, RASGRP3, MAPT, HSPA8, and HSPA1B) (Appendix Fig S16). Notably, PMAIP1, CDKN1A, and SESN2 showed increased RNA Poll II enrichment around gene TSS as well as elevated RNA‐seq signals in GC cells when lncPSCA was overexpressed or DDX5 expression was silenced (Fig 5E). However, no such consistent ChIP‐seq and RNA‐seq results were observed for the MAPK signaling candidate genes (Appendix Fig S16). To verify the ChIP‐seq and RNA‐seq data, we examined mRNA levels and RNA Poll II enrichment of PMAIP1, CDKN1A and SESN2 in stable lncPSCA‐overexpression, lncPSCA‐knockout and DDX5‐knockdown cells via RT‐qPCR and ChIP‐qPCR (Fig 5F and G). In line with the RNA‐seq data, lncPSCA‐overexpression and DDX5‐knockdown evidently up‐regulated expression of these genes; whereas, lncPSCA‐knockout suppressed mRNA levels of the genes. Consistent to the ChIP‐seq data, ChIP‐qPCR assays demonstrated that significantly decreased RNA Poll II enrichment around TSS of PMAIP1, CDKN1A, and SESN2 in stable lncPSCA‐knockout GC cells. In support of these, the expression levels of PMAIP1, CDKN1A, and SESN2 was significantly down‐regulated in the GC samples compared to normal tissues in discovery cohort and validation cohort (Appendix Fig S17A), supporting their tumor suppressor nature. Importantly, we observed significantly positive expression correlations between lncPSCA and PMAIP1, CDKN1A, or SESN2 in either GC tissues or normal gastric tissues in both cohorts (Fig 5H and Appendix Fig S17B). Collectively, these results suggested that lncPSCA‐mediated DDX5 degradation activates the RNA Pol II‐controlled transcription program of multiple tumor suppressor genes.
Discussion
The chromosome 8q24.3 is the first GWAS‐reported GC‐susceptibility locus in Japanese populations and this association has been replicated in populations of different ethnicities, including Chinese (Abnet et al, 2010; Shi et al, 2011; Wang et al, 2017; Zhu et al, 2017), Korean (Wang et al, 2017), American (Wang et al, 2017; Zhu et al, 2017), and European (Helgason et al, 2015) populations. Protein‐coding PSCA gene was previously considered as the GC‐susceptibility gene accounting for the lead variant rs2294008 (Sakamoto et al, 2008; Saeki et al, 2015; Sung et al, 2016). However, the biological mechanisms of the noncoding transcript of PSCA (lncPSCA) at 8q24.3 in GC development have not been investigated. In the present study, we found that the protective T allele of GC risk SNP rs2978980 may promote activities of a lncPSCA intronic enhancer by binding transcriptional factor RORA and increase the tumor suppressive lncRNA expression. Additionally, significantly lower lncPSCA levels have been found in GC specimens as compared with normal tissues. We also demonstrated that lncPSCA can interact with DDX5 and facilitate ubiquitination and degradation of DDX5. Increased expression of lncPSCA in cells resulted in low levels of DDX5, less RNA Pol II binding with DDX5, and, thus, activated transcription of multiple P53 signaling tumor suppressors by Pol II. These results provide new evidences for our understanding on the genetic basis of GC risk and highlight importance of lncRNA‐mediated controlling of transcription programs involved in tumorigenesis (Fig 6).
Figure 6. Graphical representation of the regulation and function of lncPSCA in gastric cancer.
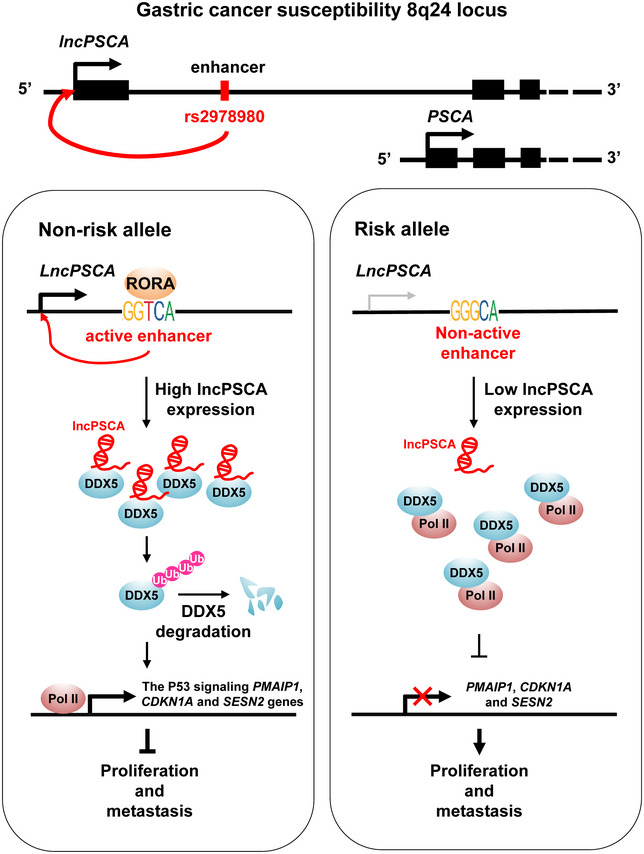
The gastric cancer risk‐associated rs2978980 T > G genetic variant disrupts RORA binding to the intronic enhancer region of lncPSCA and down‐regulates lncPSCA expression in cells. LncPSCA is a tumor suppressive lncRNA that acts by controlling DDX5 degradation through ubiquitination, resulting in released RNA Pol II from the DDX5‐Pol II complex and activated transcription and expression of the P53 signaling genes that are important for gastric cancer progression.
In recent years, tens of thousands of lncRNAs have been found in human via high‐throughput sequencing technologies. Accumulated amount of evidences has expanded our perception of lncRNAs from “transcriptional junk” to functional biological molecules regulating cellular processes including post‐transcriptional modifications, transcription, chromatin remodeling, and signal transduction (Leucci, 2018; Statello et al, 2021). In GC, several lncRNAs have been shown to be differentially expressed in cancerous tissues and are implicated in malignant transformation and metastasis (Liu et al, 2018; Zhang et al, 2018a,b,c; He et al, 2019; Sakai et al, 2019; Wang et al, 2019; Xu et al, 2019; Zhuo et al, 2019). However, the regulation of expression and functions of most lncRNAs in GC remains to be elucidated. Genetic variations in lncRNA gene enhancer sequences have the potential to create novel binding motifs of transcription factor(s) that may be selected in cancer cells (Pan et al, 2016; Gao et al, 2018; Hua et al, 2018). One such example is a prostate cancer risk‐associated SNP rs11672691 and its LD SNP rs887391, which decrease binding of transcription factors NKX3.1 and YY1 to the promoter of lncRNA PCAT19‐short, resulting in weaker promoter but stronger enhancer activity that subsequently activates oncogenic lncRNA PCAT19‐long (Hua et al, 2018). Our study, for the first time, demonstrated that GC risk SNP rs2978980 T > G could down‐regulate lncPSCA expression via interrupting RORA binding to its enhancer and increase cancer susceptibility. Our results, along with findings in previous reports (Guo et al, 2016; Betts et al, 2017; Cho et al, 2018; Gao et al, 2018; Hua et al, 2018; Leucci, 2018; Moradi Marjaneh et al, 2020; Statello et al, 2021), highlight the understanding of functional impotence of the regulatory mechanisms of lncRNAs transcribed from GWAS‐identified risk loci during tumorigenesis and progression.
In this study, we also demonstrated that lncPSCA can interact with DDX5 protein and promote proteasome‐mediated degradation of DDX5. Human RNA helicase DDX5 is a member of a highly conserved protein family involved in gene expression regulation (Nyamao et al, 2019). DDX5 shows profound implications for cancer development and has been reported to be aberrantly expressed in many tumors (Nyamao et al, 2019). In line with this, we found that DDX5 exhibited oncogenic activity and was significantly up‐regulated in GC tissues. Our study showed that DDX5 is a partner of RNA Pol II in nucleus of GC cells. DDX5 degradation caused by elevated lncPSCA expression resulted in more Pol II released from the DDX5‐Pol II complex and promoted transcription of P53 signaling genes, which thereby inhibiting tumor growth and metastasis.
The P53 signaling serves as one of the most crucial tumor suppressive pathways in the development and progression of multiple malignancies (Kruiswijk et al, 2015; Cheok & Lane, 2017). We found that, in GC cells, up‐regulated lncPSCA decreased DDX5 levels, which thus may potentially have promoted RNA Pol II‐controlled stimulation of the P53 signaling, leading to elevated PMAIP1, CDKN1A, and SESN2 expression and subsequently suppressed proliferation of GC cells. Moreover, we observed positive correlations between lncPSCA levels and the mRNA levels of PMAIP1, CDKN1A, and SESN2 in both GC and normal tissues. These results suggested the activation effect of lncPSCA on the P53 signaling via DDX5. PMAIP1, also known as NOXA, is a primary P53‐response gene and appears to be crucial in fine‐tuning cell death decisions by targeting the pro‐survival protein MCL1 for proteasomal degradation (Ploner et al, 2008). As one of BCL2 homology domain 3 (BH3)‐only proteins, activation of PMAIP1 appears critical for the cellular response to anticancer treatment regimens, such as γ‐irradiation and chemotherapeutic drugs (i.e., Venetoclax/ABT‐199) (Ploner et al, 2008). CDKN1A (P21/WAF1), is a universal cell‐cycle inhibitor directly controlled by P53 and acting to restrain tumor proliferation (El‐Deiry, 2016). Another important molecule downstream of the lncPSCA‐DDX5 axis is SESN2 which is an antioxidant gene activated by P53. SESN2 is critical for suppression of reactive oxygen species and protection from oxidative stress, transformation, and genomic instability in a P53‐dependent manner. SESN2 knockout cells are more susceptible to Ras+E1A‐induced transformation than their wild‐type counterparts (Budanov, 2011). Because PMAIP1, CDKN1A, and SESN2 are all critical P53‐dependent tumor suppressors, decreased levels of these genes by lncPSCA may contribute to cell transformation and tumorigenesis.
In summary, by fine‐mapping the 8q24.3 GC risk locus and functional characterization, we have identified a lncRNA, lncPSCA, as a novel susceptibility gene that acts through regulation of DDX5 stability and RNA Pol II‐controlled transcriptional programs, leading to inhibited proliferation and metastasis of cancer cells. The enhancer rs2978980 T > G genetic variant impairs expression and anti‐neoplasm effect of lncPSCA and confers susceptibility to GC. These findings shed new light on the importance of functionally annotating lncRNAs in GWAS risk loci and further declaration of aberrantly expressed lncRNA in the etiology of human malignancies. Given that the majority of lncRNAs display remarkable cell and tissue‐specific expression, understanding the function of these lncRNAs therefore holds great potential for innovative cancer therapies.
Materials and Methods
Cell culture
Human GC HGC‐27 cells were cultured in RPMI 1640 medium (Gibco, C11875500BT). Human MGC80‐3 and HEK293T cells were cultured in DMEM medium (Gibco, C11995500BT). All media were supplemented with 10% fetal bovine serum (FBS; Gibco, 1347575). Cells were maintained at 37°C in a 5% CO2 incubator and periodically tested mycoplasma negative.
Electrophoretic mobility‐shift assays
Synthetic double‐stranded and 3’ biotin‐labeled DNA oligonucleotides corresponding to the RORA consensus binding sequence, rs2978980T or rs2978980G sequences were synthesized by Thermo Fisher (Beijing, China) (Appendix Table S5). HGC‐27 or MGC80‐3 cell nuclear extracts and these DNA oligonucleotides were incubated at 25°C for 20 min using the Light Shift Chemiluminescent EMSA Kit (Pierce, 20148). The reaction mixture was separated on 6% PAGE and detected by Stabilized Streptavidin‐Horseradish Peroxidase Conjugate (Pierce, SA10001). In competition assays, unlabeled DNA probes at 100‐fold molar excess were added to the reaction mixture before the addition of biotin‐labeled oligonucleotides.
Cell transfection
Small interfering RNA (siRNA) duplexes for lncPSCA, RORA, or DDX5 were products of Genepharma (Shanghai, China) (Appendix Table S5). The negative control RNA duplex (NC) for siRNAs (Genepharma) was nonhomologous to any human genome sequence. All small RNAs were transfected with the INTERFERin reagent (Polyplus, 409‐10) as reported previously (Zhang et al, 2020). All plasmids were transfected with the jetPRIME reagent (Polyplus, 114‐07) or Lipofectamine 2000 (Thermo Fisher, 11668019).
Quantitative reverse transcription PCR (RT–qPCR)
Total RNA was isolated from culture cells or tissue specimens with TRIzol reagent (Invitrogen, 94402). To remove genomic DNA, each RNA sample was treated with DNase I (RNase‐free) (Thermo Fisher, 18068015). Each RNA sample was then reverse transcribed into cDNAs using PrimeScript™ RT Master Mix (TaKaRa, RR036A). The relative expression of lncPSCA, RORA, DDX5, CDKNIA, PMAIP1, and SESN2 were calculated by using the 2−ΔΔ C t method. Indicated primers are listed in Appendix Table S5. Each sample was examined at least in triplicate. PCR product specificity was confirmed by a melting‐curve analysis.
Western blot
Western blot was performed following the standard protocol as previously reported (Zhang et al, 2020). In brief, total cellular proteins were separated with SDS–PAGE gel and transferred to a polyvinylidene fluoride (PVDF) membrane (Millipore, ISEQ00010). The PVDF membrane was then incubated with various antibodies (Appendix Table S6) overnight at 4°C. Target proteins were visualized with ECL Western Blotting Substrate (Pierce, 32106).
Chromatin Immunoprecipitation Sequencing (ChIP‐seq) and ChIP‐qPCR
For ChIP assays, 2.5 × 10⁷ HGC‐27 or MGC80‐3 cells were cross‐linked using 1% formaldehyde for 10 min at 25°C. Reactions were quenched by addition of 250 mmol/l glycine for 5 min. Cells were lysed with the cell lysis/wash buffer (150 mmol/l NaCl, 5 mmol/l EDTA [pH7.5], 50 mmol/l Tris–HCl [pH7.5], 0.5% NP‐40) plus protease inhibitor for 10 min on ice. Each sample was solved in the shearing buffer (1%SDS, 10 mmol/l EDTA [pH8.0], 50 mmol/l Tris–HCl [pH8.0]) plus protease inhibitor. Chromatin fragmentation was performed using a Diagenode BioruptorPlus sonicator (30 s on and 30 s off for 12 cycles) to achieve a DNA shear length of 200–500 bp. Solubilized chromatin was incubated with 15 μg anti‐RORA antibody (Abcam, ab60134), anti‐Pol II antibody (Millipore, 05‐623), or IgG control (Invitrogen, 02‐6102) (Appendix Table S6) overnight at 4°C on a rotating wheel. Antibody‐chromatin complexes were subsequently pulled‐down by incubating with Dynabeads® Protein G beads at 4°C for 4 h on a rotating wheel. Immune complexes were then washed for six times with the cell lysis/wash buffer at 4°C and then washed twice with the cold TE buffer (Invitrogen, 12090015). Elution and reverse‐crosslinking were performed in the elution buffer (100 mmol/l NaHCO3 and 1%SDS) on a shaker at 25°C for 15 min. After repeating the elution with the elution buffer, antibody‐bound chromatin complexes were reversed cross‐linked at 65°C with 5 mol/l NaCl overnight. After reversal of crosslink, each sample was treated with 50 ng/μl RNase A at 37°C for 30 min and, then, 10 mmol/l Proteinase K at 45°C for 1 h. Immunoprecipitated DNA was extracted with the Min‐Elute PCR purification kit (Qiagen, 28004), followed by DNA library preparation and sequencing on the BGISEQ‐500 platform (BGI, Shenzhen, China). For ChIP‐qPCR assays, the fold enrichment of purified ChIP DNA relative to input DNA at a given genomic site was determined using TB Green® Premix Ex Taq™ I (Tli RNaseH Plus) (TaKaRa, RR820A). As previously described (Pan et al, 2018), ChIP‐qPCR reactions were conducted with ChIP‐qPCR primers in Appendix Table S5.
Patients and tissue specimens
There were two GC cohorts, discovery cohort (n = 96) and validation cohort (n = 30) recruited in the current study. All patients received curative surgical resection for GC in Shandong Cancer Hospital and Institute between August 2012 and October 2019 (discovery cohort) or between November 2019 and December 2020 (validation cohort). Prior to the surgery, no patients received any local or systemic anticancer treatments. Fresh GC specimens and matched adjacent normal stomach tissues were obtained from these patients. The normal tissues were sampled at least 2 cm away from the margin of the tumor. All subjects were ethnic Han Chinese. The detailed characteristics of all GC patients were shown in Appendix Table S2 and S3. This study was approved by the Institutional Review Board of Shandong Cancer Hospital and Institute. At recruitment, written informed consent was obtained from each subject. The methods were carried out in accordance with the approved guidelines.
LncPSCA expression constructs
The full‐length lncPSCA cDNA (NR_033343.1) was directly synthesized by Genewiz (Suzhou, Jiangsu) and cloned after the CMV promoter of the pcDNA3.1 vector. The plasmid was named as pcDNA‐lncPSCA. The full‐length lncPSCA cDNA was also cloned into the pLVX‐Puro vector (Clontech, 632164). The resultant plasmid was designated pLVX‐lncPSCA. To test the protein‐coding potential of lncPSCA, we synthesized the CPAT‐predicted ORF (435–1,004 nt of NR_033343.2) and the “so‐called” 5’UTR plus ORF (1–1,004 nt of NR_033343.2) (Genewiz) and, then, cloned them into the pEGFP‐N1 vector. The two constructs were named as pEGFP‐N1‐ORF and pEGFP‐N1‐5’UTR‐ORF. All these plasmids were sequenced to confirm the orientation and integrity.
CRISPR/Cas9‐engineered lncPSCA‐knockout cells
Considering lncPSCA shares exon 2 and exon 3 with the protein‐coding PSCA gene, we designed two guide RNAs (gRNAs) covering the entire lncPSCA specific exon1 via targeting the 5’‐flanking region (lncP‐gRNA1) and the intron 1 (lncP‐gRNA2) using Optimized CRISPR Design (Appendix Fig S6A and B and Appendix Table S5). The U6 promoter vector PX458M with two gRNA‐expressing cassettes was developed from the vector PX458 which is also known as pSpCas9(BB)‐2A‐GFP with Cas9 from S. pyogenes with 2A‐EGFP (Addgene, 48138). Firstly, lncP‐gRNA1 was cloned into BbsI digested PX458M (PX458M‐lncP‐gRNA1) and lncP‐gRNA2 was cloned into BbsI digested EZ‐GuideXH (Life science market, PVT13420) (EZ‐GuideXH‐lncP‐gRNA2). After both plasmids were digested with XhoI and HindIII, the digested DNA fragments were purified. The lncP‐gRNA2 DNA fragment from the EZ‐GuideXH‐lncP‐gRNA2 plasmid was then ligated to the digested PX458M‐lncP‐gRNA1 plasmid. The resultant plasmid with two lncPSCA gRNAs, designated PX458M‐lncP‐2gRNA, was sequenced to confirm the integrity. After transfected with PX458M‐lncP‐2gRNA or PX458M for 48 h, GFP‐positive HGC‐27 and MGC80‐3 cells were selected by flow cytometry FACSAria II (BD, US) and seeded in 96‐well culture plates. Multiple single cell clones were selected and cultured individually in separate wells. After genomic DNA was extracted from each cell clone, the deletion of lncPSCA exon1 was examined through PCR and Sanger sequencing with specific primers (Appendix Table S5).
Lentiviral transduction
Recombinant lentiviral particles were produced by transient co‐transfection of the pLVX‐lncPSCA, psPAX2 (Addgene, #12260) and pMD2.G (Addgene, #12259) plasmids into HEK293T cells. At 48 h and 72 h after transfection, viral supernatants were collected and filtered. Lentiviral particles harboring the DDX5 shRNA or negative control shRNA were products of Genechem (35605‐1, Shanghai, China) (Appendix Table S5). HGC‐27 or MGC80‐3 cells were infected with viral supernatant containing 5 μg/ml polybrene and then selected using 2 mg/ml puromycin. In these lentiviral transducted cells, expression of lncPSCA and DDX5 was examined by RT–qPCR and/or Western blot.
Cell proliferation analyses
For transient transfection, a total of 1 × 10⁴ HGC‐27 or MGC80‐3 cells were seeded in 12‐well plates and then transfected with 0.5 μg pcDNA‐lncPSCA, 0.5 μg pcDNA3.1, 20 nmol/l lncPSCA siRNAs (silncP‐1 and silncP‐2), 20 nmol/l DDX5 siRNAs (siDDX5‐1 and siDDX5‐2), or 20 nmol/l NC RNA, respectively. Cells were harvested and counted at 24, 48, and 72 h after transfection. For the CRISPR/Cas9‐engineered lncPSCA‐knockout HGC‐27 or MGC80‐3 cells or cells with lentiviral transduction of overexpressed lncPSCA or the DDX5 shRNA, 3 × 10⁴ cells were seeded in 12‐well plates. Cells were harvested and counted at 24, 48, and 72 h after seeding.
Colony formation assays
HGC‐27 or MGC80‐3 (2,000 cells per well) were seeded into a 6‐well cell culture plate and transfected with indicated small RNAs or plasmids, respectively. The CRISPR/Cas9‐engineered lncPSCA‐knockout HGC‐27 or MGC80‐3 cells or cells stably transfected with the lncPSCA plasmid and the DDX5 shRNA (2,000 cells per well) were seeded into a 6‐well culture plate. When colonies were visible after 14 days, cells were washed with cold PBS twice and fixed with the fixation fluid (methanol:acetic acid = 3:1). After cells were dyed with crystal violet, the colony number in each well was counted.
Xenograft study
To examine the in vivo anticancer role of lncPSCA, we inoculated subcutaneously a total of 5 × 10⁶ various HGC‐27 cells (WT, wild type; KO‐C14; KO‐C40) or MGC80‐3 cells (WT; KO‐C1; KO‐C3) into fossa axillaris of five‐week‐old female nude BALB/c mice (Vital River Laboratory, Beijing, China) (HGC‐27: n = 7 per group; MGC80‐3: n = 8 per group). The mice were randomly assigned to different groups. Tumor growth was measured every three days after tumor volumes equaled to or were greater than 90 mm3. During in vivo metastasis analyses, a total of 2 × 10⁶ various HGC‐27 cells with stable firefly luciferase expression (WT, wild type; KO‐C14; KO‐C40) or MGC80‐3 cells with stable firefly luciferase expression (WT; KO‐C1; KO‐C3) were given to mice via intravenous injection. Bioluminescent GC metastasis were monitored weekly via the IVIS Spectrum In Vivo Imaging System (PerkinElmer, USA). All procedures involving mice were approved by the institutional review aboard of Shandong Cancer Hospital and institute. All analysis was performed in a blinded fashion with individuals unaware of types of GC xenografts.
Immunohistochemistry (IHC)
Gastric cancer xenografts and mice lungs with metastasis tumors were formalin fixed, paraffin‐embedded and stained with hematoxylin and eosin (HE). Histological detection of DDX5 (Millipore, 05‐850) and Ki67 (Abcam, ab15580) was carried out following the standard protocol.
Wound healing and transwell assays
For wound‐healing assays, a wound was scratched by a 10 μl pipette tip when the cell layer of HGC‐27 or MGC80‐3 reached about 90% confluence. Cells were continued cultured at 37°C with 5% CO2, and the average extent of wound closure was quantified. In transwell assays, the transwell chambers were coated with 60 μl BD Biosciences Matrigel (1:20 dilution) for 12 h in a cell incubator. HGC‐27 and MGC80‐3 cells were added to upper transwell chambers (pore 8 mm, Corning). A medium containing 10% FBS (650 μl) was added to the lower wells. After 48 h, cells migrated to the lower wells through pores were stained with 0.2% crystal violet solution and counted.
Subcellular fractionation
The cytosolic and nuclear fractions of HGC‐27 or MGC80‐3 cells were separately isolated using the nuclear/cytoplasmic Isolation Kit (Biovision, K266) according to the manufacturer’s instructions.
RNA pull‐down
LncPSCA was amplified by PCR from pcDNA‐lncPSCA and cloned into a modified pMD19‐T vector (TaKaRa) with inserted T7 promoter before and after the TA cloning site to prepare a plasmid construct as the template for in vitro RNA synthesis. The constructs were linearized and transcribed with T7 RNA polymerase (MEGAscript T7 Transcript Kit, Thermo fisher, AM1330). Sense and antisense lncPSCA were biotinylated with Pierce™ RNA 3' End Desthiobiotinylation Kit (Thermo, 20163) and incubated with HGC‐27 nucleus extracts and Streptavidin magnetic beads at 4°C for 1 h. After beads were washed for three times, proteins bound were recovered with Elution Buffer following the instruction of Pierce™ Magnetic RNA‐Protein Pull‐Down Kit (Thermo, 20164). The retrieved proteins were then analyzed by Mass Spectrometry (Hoogen Biotech Co., Shanghai, China) and Western Blot. Eluted proteins were identified with the liquid chromatography–tandem mass spectrometry (LS‐MS/MS) approach. Mass spectra were analyzed using MaxQuant software (version 1.5.3.30) with the UniProtKB human database (uniport Homo sapiens 188441_20200326).
RNA immunoprecipitation (RNA‐IP)
RNA‐IP assays were performed using the Magna RIP RNA‐Binding Protein Immunoprecipitation Kit (Millipore, 17‐700) with the DDX5 antibody (Millipore, 05‐850) or IgG Isotype‐control (Invitrogen, 02‐6502). The DDX5‐RNA complexes were then recovered by Dynabeads® Protein G beads. LncPSCA RNA levels in the precipitates were measured by RT–qPCR. A total of 10% of inputs were used for RT–qPCR.
Co‐Immunoprecipitation (Co‐IP)
Co‐IP was performed between DDX5 and RNA Pol II. Gastric cancer cells were lysed in the lysis buffer containing 20 mmol/l Tris–HCl (pH 8.0), 10 mmol/l NaCl, 1 mmol/l EDTA (pH 8.0), 0.5% NP‐40, and cOmplete™ Mini protease inhibitor (Roche, 11836170001). Cell lysates were incubated with antibodies of DDX5 (Millipore, 05‐850) and RNA pol II (Millipore, 05‐623) or control IgG (Invitrogen, 02‐6502) overnight at 4°C and with Dynabeads® Protein G beads (Invitrogen, 10004D) at the next day for 2 h at 4°C. The beads were washed for five times with the lysis buffer, followed by Western blot. A total of 1% of inputs were used for Western blot.
Turnover assays
HGC‐27 and MGC80‐3 cells with stable overexpression of lncPSCA or knockout of lncPSCA were seeded in a 6 cm cell culture plate. After 24 h, cycloheximide (CHX) was added into the media at a final concentration of 60 μg/ml. The GC cells were harvested at the indicated times after CHX treatment. The DDX5 and GAPDH protein levels were analyzed by Western blot.
Ubiquitination assays
Ubiquitination assays were carried out in HEK293T and HGC‐27 cells. In HEK293T cells, HA‐ubi and Flag‐DDX5 were cotransfected with the pcDNA3.1 vector or the pcDNA‐lncPSCA plasmid as indicated. At 24 h after transfection, the cells were treated with 50 μg/ml MG132 for 6 h and then lysed with the IP lysis buffer (Beyotime, P0013). Proteins in the cell lysate were immunoprecipitated to isolate ubiquitinated DDX5, which was detected with the anti‐HA antibody (Appendix Table S6). In HGC‐27 cells, ubiquitinated DDX5 was isolated with the anti‐DDX5 antibody (Millipore, 05‐850) and endogenous ubiquitin chains on DDX5 were detected.
RNA‐seq
To gain insight into how lncPSCA or DDX5 regulate gene expression in GC cells, we performed RNA‐seq of HGC‐27 cells transfected or transduced with different expression constructs. Total RNA was isolated from cultured cells using TRIzol. RNA‐seq of HGC‐27 cells transfected with pcDNA‐lncPSCA was performed using Illumina HiSeq 2000 platform (Illumina, USA). RNA‐seq of HGC‐27 cells with stable expression of the DDX5 shRNA was performed using BGISEQ‐500 platform (BGI, Shenzhen, China). Sequenced reads were trimmed for adaptor sequence, and masked for low‐complexity or low‐quality sequence, then mapped to whole transcriptome using tophat2 or Bowtie2 with default parameters. Reads count of samples were calculated and converted to FPKM (fragments per kilobase of exon model per million reads mapped).
Statistics
The difference between two groups was calculated using Student’s t test. One‐way ANOVA analysis with Dunnett’s test was used for multiple comparisons. The significance of association between gene expression and rs2978980 genotypes or between different genes was calculated using Spearman’s correlation. The Pearson chi‐square test was employed for comparing categorical variables in various clinical parameters. A P value of < 0.05 was used as the criterion of statistical significance. All analyses were performed with SPSS software package (Version 16.0, SPSS Inc.) or GraphPad Prism (Version 5, GraphPad Software, Inc.).
Author contributions
MY conceived and designed this study. YZ and MY acquired, analyzed, and interpreted the data from experiments. YZ, TL, GJ, HG, NZ, JC, MX, YX, TW, JL, YSong, BW, and JY were responsible for patient recruitment, biospecimen sampling, clinical data collection, and analysis. TL, GJ, HG, TW, YShen, and JY provided technique supports. YZ and HG were engaged in statistical and bioinformatics analyses. YZ and MY drafted the manuscript. MY critically revised the manuscript for important intellectual content. MY and JY supervised this study.
Conflict of interest
The authors declare that they have no conflict of interest.
Supporting information
Appendix
Source Data for Appendix
Source Data for Figure 1
Source Data for Figure 3
Source Data for Figure 4
Source Data for Figure 5
Acknowledgements
This work was supported by National Natural Science Foundation of China (31671300, 31871306, 82173070, 82103291); Taishan Scholars Program of Shandong Province (tsqn20161060); Program of Science and Technology for the youth innovation team in universities of Shandong Province (2020KJL001); the Academic Promotion Program of Shandong First Medical University (2019RC001); and Natural Science Foundation of Shandong Province (ZR2017MH050). The authors would like to thank many individuals who participated in the study.
EMBO reports (2021) 22: e52707.
Contributor Information
Jinming Yu, Email: sdyujinming@126.com.
Ming Yang, Email: aaryoung@yeah.net.
Data availability
The datasets produced in this study are available in the following databases: RNA‐Seq data: Gene Expression Omnibus GSE145762 (https://www.ncbi.nlm.nih.gov/geo/query/acc.cgi?acc=GSE145762); ChIP‐seq and RNA‐seq data: Gene Expression Omnibus GSE146431 (https://www.ncbi.nlm.nih.gov/geo/query/acc.cgi?acc=GSE146431).
References
- Abnet CC, Freedman ND, Hu N, Wang Z, Yu K, Shu X‐O, Yuan J‐M, Zheng W, Dawsey SM, Dong LM et al (2010) A shared susceptibility locus in PLCE1 at 10q23 for gastric adenocarcinoma and esophageal squamous cell carcinoma. Nat Genet 42: 764–767 [DOI] [PMC free article] [PubMed] [Google Scholar]
- Betts JA, Moradi Marjaneh M, Al‐Ejeh F, Lim YC, Shi W, Sivakumaran H, Tropée R, Patch A‐M, Clark MB, Bartonicek N et al (2017) Long noncoding RNAs CUPID1 and CUPID2 mediate breast cancer risk at 11q13 by modulating the response to DNA damage. Am J Hum Genet 101: 255–266 [DOI] [PMC free article] [PubMed] [Google Scholar]
- Budanov AV (2011) Stress‐responsive sestrins link p53 with redox regulation and mammalian target of rapamycin signaling. Antioxid Redox Signal 15: 1679–1690 [DOI] [PMC free article] [PubMed] [Google Scholar]
- Cheok CF, Lane DP (2017) Exploiting the p53 pathway for therapy. Cold Spring Harb Perspect Med 7: a026310 [DOI] [PMC free article] [PubMed] [Google Scholar]
- Cho SW, Xu J, Sun R, Mumbach MR, Carter AC, Chen YG, Yost KE, Kim J, He J, Nevins SA et al (2018) Promoter of lncRNA gene PVT1 is a tumor‐suppressor DNA boundary element. Cell 173: 1398–1412 [DOI] [PMC free article] [PubMed] [Google Scholar]
- Clark EL, Hadjimichael C, Temperley R, Barnard A, Fuller‐Pace FV, Robson CN (2013) p68/DdX5 supports beta‐catenin & RNAP II during androgen receptor mediated transcription in prostate cancer. PLoS One 8: e54150 [DOI] [PMC free article] [PubMed] [Google Scholar]
- Cui H, Tang M, Zhang M, Liu S, Chen S, Zeng Z, Shen Z, Song B, Lu J, Jia H et al (2019) Variants in the PSCA gene associated with risk of cancer and nonneoplastic diseases: systematic research synopsis, meta‐analysis and epidemiological evidence. Carcinogenesis 40: 70–83 [DOI] [PubMed] [Google Scholar]
- El‐Deiry WS (2016) p21(WAF1) Mediates Cell‐Cycle Inhibition, Relevant to Cancer Suppression and Therapy. Cancer Res 76: 5189–5191 [DOI] [PMC free article] [PubMed] [Google Scholar]
- Gao P, Xia J‐H, Sipeky C, Dong X‐M, Zhang Q, Yang Y, Zhang P, Cruz SP, Zhang K, Zhu J et al (2018) Biology and clinical implications of the 19q13 aggressive prostate cancer susceptibility locus. Cell 174: 576–589 [DOI] [PMC free article] [PubMed] [Google Scholar]
- Guo H, Ahmed M, Zhang F, Yao CQ, Li SiDe, Liang YI, Hua J, Soares F, Sun Y, Langstein J et al (2016) Modulation of long noncoding RNAs by risk SNPs underlying genetic predispositions to prostate cancer. Nat Genet 48: 1142–1150 [DOI] [PubMed] [Google Scholar]
- He W, Liang B, Wang C, Li S, Zhao Y, Huang Q, Liu Z, Yao Z, Wu Q, Liao W et al (2019) MSC‐regulated lncRNA MACC1‐AS1 promotes stemness and chemoresistance through fatty acid oxidation in gastric cancer. Oncogene 38: 4637–4654 [DOI] [PMC free article] [PubMed] [Google Scholar]
- Helgason H, Rafnar T, Olafsdottir HS, Jonasson JG, Sigurdsson A, Stacey SN, Jonasdottir A, Tryggvadottir L, Alexiusdottir K, Haraldsson A et al (2015) Loss‐of‐function variants in ATM confer risk of gastric cancer. Nat Genet 47: 906–910 [DOI] [PubMed] [Google Scholar]
- Hu N, Wang Z, Song X, Wei L, Kim BS, Freedman ND, Baek J, Burdette L, Chang J, Chung C et al (2016) Genome‐wide association study of gastric adenocarcinoma in Asia: a comparison of associations between cardia and non‐cardia tumours. Gut 65: 1611–1618 [DOI] [PMC free article] [PubMed] [Google Scholar]
- Hua JT, Ahmed M, Guo H, Zhang Y, Chen S, Soares F, Lu J, Zhou S, Wang M, Li H et al (2018) Risk SNP‐mediated promoter‐enhancer switching drives prostate cancer through lncRNA PCAT19. Cell 174: 564–575 [DOI] [PubMed] [Google Scholar]
- Huang JZ, Chen M, Chen D, Gao XC, Zhu S, Huang H, Hu M, Zhu H, Yan GR (2017) A peptide encoded by a putative lncRNA HOXB‐AS3 suppresses colon cancer growth. Mol Cell 68: 171–184 [DOI] [PubMed] [Google Scholar]
- ICGC/TCGA Pan‐Cancer Analysis of Whole Genomes Consortium (2020) Pan‐cancer analysis of whole genomes. Nature 578: 82–93 [DOI] [PMC free article] [PubMed] [Google Scholar]
- Kruiswijk F, Labuschagne CF, Vousden KH (2015) p53 in survival, death and metabolic health: a lifeguard with a licence to kill. Nat Rev Mol Cell Biol 16: 393–405 [DOI] [PubMed] [Google Scholar]
- Leucci E (2018) Cancer development and therapy resistance: spotlights on the dark side of the genome. Pharmacol Ther 189: 22–30 [DOI] [PubMed] [Google Scholar]
- Leucci E, Vendramin R, Spinazzi M, Laurette P, Fiers M, Wouters J, Radaelli E, Eyckerman S, Leonelli C, Vanderheyden K et al (2016) Melanoma addiction to the long non‐coding RNA SAMMSON. Nature 531: 518–522 [DOI] [PubMed] [Google Scholar]
- Liu HT, Liu S, Liu L, Ma RR, Gao P (2018) EGR1‐mediated transcription of lncRNA‐HNF1A‐AS1 promotes cell‐cycle progression in gastric cancer. Cancer Res 78: 5877–5890 [DOI] [PMC free article] [PubMed] [Google Scholar]
- Lochhead P, Frank B, Hold GL, Rabkin CS, Ng MTH, Vaughan TL, Risch HA, Gammon MD, Lissowska J, Weck MN et al (2011) Genetic variation in the prostate stem cell antigen gene and upper gastrointestinal cancer in white individuals. Gastroenterology 140: 435–441 [DOI] [PMC free article] [PubMed] [Google Scholar]
- Mocellin S, Verdi D, Pooley KA, Nitti D (2015) Genetic variation and gastric cancer risk: a field synopsis and meta‐analysis. Gut 64: 1209–1219 [DOI] [PubMed] [Google Scholar]
- Moradi Marjaneh M, Beesley J, O’Mara TA, Mukhopadhyay P, Koufariotis LT, Kazakoff S, Hussein N, Fachal L, Bartonicek N, Hillman KM et al (2020) Non‐coding RNAs underlie genetic predisposition to breast cancer. Genome Biol 21: 7 [DOI] [PMC free article] [PubMed] [Google Scholar]
- Nyamao RM, Wu J, Yu L, Xiao X, Zhang FM (2019) Roles of DDX5 in the tumorigenesis, proliferation, differentiation, metastasis and pathway regulation of human malignancies. Biochim Biophys Acta Rev Cancer 1871: 85–98 [DOI] [PubMed] [Google Scholar]
- Pan W, Liu L, Wei J, Ge Y, Zhang J, Chen H, Zhou L, Yuan Q, Zhou C, Yang M (2016) A functional lncRNA HOTAIR genetic variant contributes to gastric cancer susceptibility. Mol Carcinog 55: 90–96 [DOI] [PubMed] [Google Scholar]
- Pan W, Zhang N, Liu W, Liu J, Zhou L, Liu Y, Yang M (2018) The long noncoding RNA GAS8‐AS1 suppresses hepatocarcinogenesis by epigenetically activating the tumor suppressor GAS8. J Biol Chem 293: 17154–17165 [DOI] [PMC free article] [PubMed] [Google Scholar]
- Ploner C, Kofler R, Villunger A (2008) Noxa: at the tip of the balance between life and death. Oncogene 27(Suppl 1): S84–S92 [DOI] [PMC free article] [PubMed] [Google Scholar]
- Plummer M, Franceschi S, Vignat J, Forman D, de Martel C (2015) Global burden of gastric cancer attributable to Helicobacter pylori. Int J Cancer 136: 487–490 [DOI] [PubMed] [Google Scholar]
- Rao S, Huntley M, Durand N, Stamenova E, Bochkov I, Robinson J, Sanborn A, Machol I, Omer A, Lander E et al (2014) A 3D map of the human genome at kilobase resolution reveals principles of chromatin looping. Cell 159: 1665–1680 [DOI] [PMC free article] [PubMed] [Google Scholar]
- Saeki N, Ono H, Yanagihara K, Aoyagi K, Sasaki H, Sakamoto H, Yoshida T (2015) rs2294008T, a risk allele for gastric and gallbladder cancers, suppresses the PSCA promoter by recruiting the transcription factor YY1. Genes Cells 20: 382–391 [DOI] [PubMed] [Google Scholar]
- Saeki N, Saito A, Choi IJ, Matsuo K, Ohnami S, Totsuka H, Chiku S, Kuchiba A, Lee YS, Yoon KA et al (2011) A functional single nucleotide polymorphism in mucin 1, at chromosome 1q22, determines susceptibility to diffuse‐type gastric cancer. Gastroenterology 140: 892–902 [DOI] [PubMed] [Google Scholar]
- Sakai S, Ohhata T, Kitagawa K, Uchida C, Aoshima T, Niida H, Suzuki T, Inoue Y, Miyazawa K, Kitagawa M (2019) Long noncoding RNA ELIT‐1 acts as a Smad3 cofactor to facilitate TGFbeta/Smad signaling and promote epithelial‐mesenchymal transition. Cancer Res 79: 2821–2838 [DOI] [PubMed] [Google Scholar]
- Sakamoto H, Yoshimura K, Saeki N, Katai H, Shimoda T, Matsuno Y, Saito D, Sugimura H, Tanioka F et al (2008) Genetic variation in PSCA is associated with susceptibility to diffuse‐type gastric cancer. Nat Genet 40: 730–740 [DOI] [PubMed] [Google Scholar]
- Shi Y, Hu Z, Wu C, Dai J, Li H, Dong J, Wang M, Miao X, Zhou Y, Lu F et al (2011) A genome‐wide association study identifies new susceptibility loci for non‐cardia gastric cancer at 3q13.31 and 5p13.1. Nat Genet 43: 1215–1218 [DOI] [PubMed] [Google Scholar]
- Statello L, Guo CJ, Chen LL, Huarte M (2021) Gene regulation by long non‐coding RNAs and its biological functions. Nat Rev Mol Cell Biol 22: 96–118 [DOI] [PMC free article] [PubMed] [Google Scholar]
- Sung H, Ferlay J, Siegel RL, Laversanne M, Soerjomataram I, Jemal A, Bray F (2021) Global cancer statistics 2020: GLOBOCAN estimates of incidence and mortality worldwide for 36 cancers in 185 countries. CA Cancer J Clin 71: 209–249 [DOI] [PubMed] [Google Scholar]
- Sung H, Yang HH, Hu N, Su H, Taylor PR, Hyland PL (2016) Functional annotation of high‐quality SNP biomarkers of gastric cancer susceptibility: the Yin Yang of PSCA rs2294008. Gut 65: 361–364 [DOI] [PubMed] [Google Scholar]
- Tanikawa C, Kamatani Y, Toyoshima O, Sakamoto H, Ito H, Takahashi A, Momozawa Y, Hirata M, Fuse N, Takai‐Igarashi T et al (2018) Genome‐wide association study identifies gastric cancer susceptibility loci at 12q24.11‐12 and 20q11.21. Cancer Sci 109: 4015–4024 [DOI] [PMC free article] [PubMed] [Google Scholar]
- Wang T, Zhang L, Li H, Wang B, Chen K (2012) Prostate stem cell antigen polymorphisms and susceptibility to gastric cancer: a systematic review and meta‐analysis. Cancer Epidemiol Biomarkers Prev 21: 843–850 [DOI] [PubMed] [Google Scholar]
- Wang X, Liang Q, Zhang L, Gou H, Li Z, Chen H, Dong Y, Ji J, Yu J (2019) C8orf76 promotes gastric tumorigenicity and metastasis by directly inducing lncRNA DUSP5P1 and associates with patient outcomes. Clin Cancer Res 25: 3128–3140 [DOI] [PubMed] [Google Scholar]
- Wang Z, Dai J, Hu N, Miao X, Abnet CC, Yang M, Freedman ND, Chen J, Burdette L, Zhu X et al (2017) Identification of new susceptibility loci for gastric non‐cardia adenocarcinoma: pooled results from two Chinese genome‐wide association studies. Gut 66: 581–587 [DOI] [PMC free article] [PubMed] [Google Scholar]
- Xu TP, Ma P, Wang WY, Shuai Y, Wang YF, Yu T, Xia R, Shu YQ (2019) KLF5 and MYC modulated LINC00346 contributes to gastric cancer progression through acting as a competing endogeous RNA and indicates poor outcome. Cell Death Differ 26: 2179–2193 [DOI] [PMC free article] [PubMed] [Google Scholar]
- Yan C, Zhu M, Ding Y, Yang M, Wang M, Li G, Ren C, Huang T, Yang W, He B et al (2020) Meta‐analysis of genome‐wide association studies and functional assays decipher susceptibility genes for gastric cancer in Chinese populations. Gut 69: 641–651 [DOI] [PubMed] [Google Scholar]
- Zhang E, He X, Zhang C, Su J, Lu X, Si X, Chen J, Yin D, Han L, De W (2018a) A novel long noncoding RNA HOXC‐AS3 mediates tumorigenesis of gastric cancer by binding to YBX1. Genome Biol 19: 154 [DOI] [PMC free article] [PubMed] [Google Scholar]
- Zhang J‐X, Chen Z‐H, Chen D‐L, Tian X‐P, Wang C‐Y, Zhou Z‐W, Gao Y, Xu YI, Chen C, Zheng Z‐S et al (2018b) LINC01410‐miR‐532‐NCF2‐NF‐kB feedback loop promotes gastric cancer angiogenesis and metastasis. Oncogene 37: 2660–2675 [DOI] [PMC free article] [PubMed] [Google Scholar] [Retracted]
- Zhang M, Weng W, Zhang Q, Wu Y, Ni S, Tan C, Xu M, Sun H, Liu C, Wei P et al (2018c) The lncRNA NEAT1 activates Wnt/beta‐catenin signaling and promotes colorectal cancer progression via interacting with DDX5. J Hematol Oncol 11: 113 [DOI] [PMC free article] [PubMed] [Google Scholar]
- Zhang N, Li Y, Xie M, Song Y, Liu J, Lei T, Shen Y, Yu J, Yang M (2020) DACT2 modulated by TFAP2A‐mediated allelic transcription promotes EGFR‐TKIs efficiency in advanced lung adenocarcinoma. Biochem Pharmacol 172: 113772 [DOI] [PubMed] [Google Scholar]
- Zhu M, Yan C, Ren C, Huang X, Zhu X, Gu H, Wang M, Wang S, Gao Y, Ji Y et al (2017) Exome array analysis identifies variants in SPOCD1 and BTN3A2 that affect risk for gastric cancer. Gastroenterology 152: 2011–2021 [DOI] [PubMed] [Google Scholar]
- Zhuo W, Liu Y, Li S, Guo D, Sun Q, Jin J, Rao X, Li M, Sun M, Jiang M et al (2019) Long noncoding RNA GMAN, up‐regulated in gastric cancer tissues, is associated with metastasis in patients and promotes translation of Ephrin A1 by competitively binding GMAN‐AS. Gastroenterology 156: 676–691 [DOI] [PubMed] [Google Scholar]