

Abstract

In this study, blue-emission carbon dots were prepared from the legumes of the vegetable Pisum sativum Linn. by one-step carbonization. The fluorescence of a carbon dot (CDs) solution can be quenched by copper ions and recovered by ethylenediaminetetraacetic acid (EDTA). In addition, two kinds of visual fluorescent filter papers were prepared. Finally, a dual-mode fluorescence and visual fluorescent test paper was employed for the detection of copper ions and EDTA. The simple synthesis method and the high safety enable this material to have more application possibilities.
1. Introduction
Copper ions are one of the common metal ions in water. In the process of mineral extraction, copper ions are always accompanied by waste water that is simply discharged into natural waters, thus polluting drinking water. Copper ions due to their extremely high toxicity may not only cause acute poisoning in humans but also accumulate slowly in the human body, causing abnormalities in muscles, bones, and other organs.1
Ethylenediaminetetraacetic acid (EDTA) is widely added to food as an antioxidant, antiseptic, and so on. The excessive use or abuse of food additives may cause serious harm to the human body. In some parts of China, EDTA is widely used in some cheap or fast foods. Overuse of EDTA may produce excessive free radicals in the body, making the body prone to obesity, but they also increase the load on the kidneys and other organs.2
As a vegetable, Pisum sativum Linn. (P. sativum L.) is cultivated over a large area in Asia, of which China has the largest area. At present, only the edible seed part of P. sativum L. is mainly used and its legumes are generally used as feed or directly discarded. With the gradual consumption of the Earth’s resources, plant resources are being considered as precious wealth, so how to further improve the utilization rate of plant resources is one of the research hotspots.
Carbon dots (CDs) are very good fluorescent probe, which has been used in drug analysis, food quality control, toxic substance monitoring, and so on. At present, there have been some reports on the synthesis of CDs by using biomass resources.3,4
The preparation of CDs from biomass has been discussed in many reports. First, biomass materials can be widely used in green organic synthesis.5 Typical examples are white light-emitting CDs,6 blue light-emitting fluorescent CDs from waste biomass sources,7 graphene CDs derived from lignin biomass,8 and so on. The CDs made from biomass materials have been reported for detecting metal ions. Typical examples are Cr(III) and Cr(VI),9 Fe(III),10 Hg(II),11 and so on. The significance of this study is to explore the synthesis of green, safe, and environmentally friendly fluorescent materials from biomass and their potential applications.
At present, there are many reports on the detection methods of copper ions and EDTA. Some copper ion detection methods, such as using gold nanorods, gold nanocluster fluorescence, and biological recognition element pyoverdine,12−14 and some EDTA detection methods, such as using zinc powder, test strips, and Zr frameworks as nanotraps, were reported.15−17 Compared with these methods, fluorescent CDs have the advantages of a simple synthesis method, low price, and accurate detection results, according to some reports.18,19
In this study, blue-emission CDs were synthesized using P. sativum L. legumes and water. It was found that copper ions can only selectively quench the fluorescence of CDs. EDTA, used as a food additive, can recover the fluorescence of CDs. In addition, two kinds of visual fluorescent test papers were prepared, which can detect copper ions and EDTA by the change of fluorescence. Based on this, a dual-mode fluorescence and visual fluorescent test paper detection was established for the analysis of copper ions and EDTA (Scheme 1).
Scheme 1. Analysis Mechanism of Copper Ions and EDTA.

2. Results and Discussion
2.1. Characterization and Optical Properties
The synthetic materials used in this study are P. sativum L. legumes and water. The plant fibers of P. sativum L. legumes are uniform, and the mechanism of carbonization is assumed to be that the plant fibers are carbonized at high temperatures to produce fluorescent nanoparticles. The average particle size of the CDs was analyzed by TEM (Figure 1a). Under an electron microscope, it can be seen that the CD particles are black, spherical, and have a similar size (Figure 1b). The average diameter of the CD particles was 1.9133 ± 0.4508 nm.
Figure 1.

(a) TEM image, (b) averge diameter, (c) FTIR spectrum, and (d) XRD pattern.
The FTIR results are shown in Figure 1c. The peak at 3380 cm–1 corresponds to the −OH stretching vibration region; that at 2941 cm–1 corresponds to the −CH2– stretching vibration region; the 1650 cm–1 peak corresponds to the C=O region; the 1424 cm–1 peak corresponds to the C–N region; and that at1033 cm–1 corresponds the C–C skeleton structure.20,21
XRD was used to determine the carbon crystal structure of the CDs (Figure 1d). A single broad peak (2θ) at 20° was observed. The synthesized material has an amorphous carbon structure (002).22
XPS is used to analyze the structural composition and elements of synthetic materials. Three peaks at 275, 405, and 535 eV correspond to C 1s, N 1s, and O 1s, respectively (Figure 2a). Figure 2b shows that C 1s has three states, which are C–N (288 eV), C–O (286 eV), and C–C (284 eV). Figure 2c presents the C–N–C structure. Figure 2d proves that the C=O group exists.23,24
Figure 2.
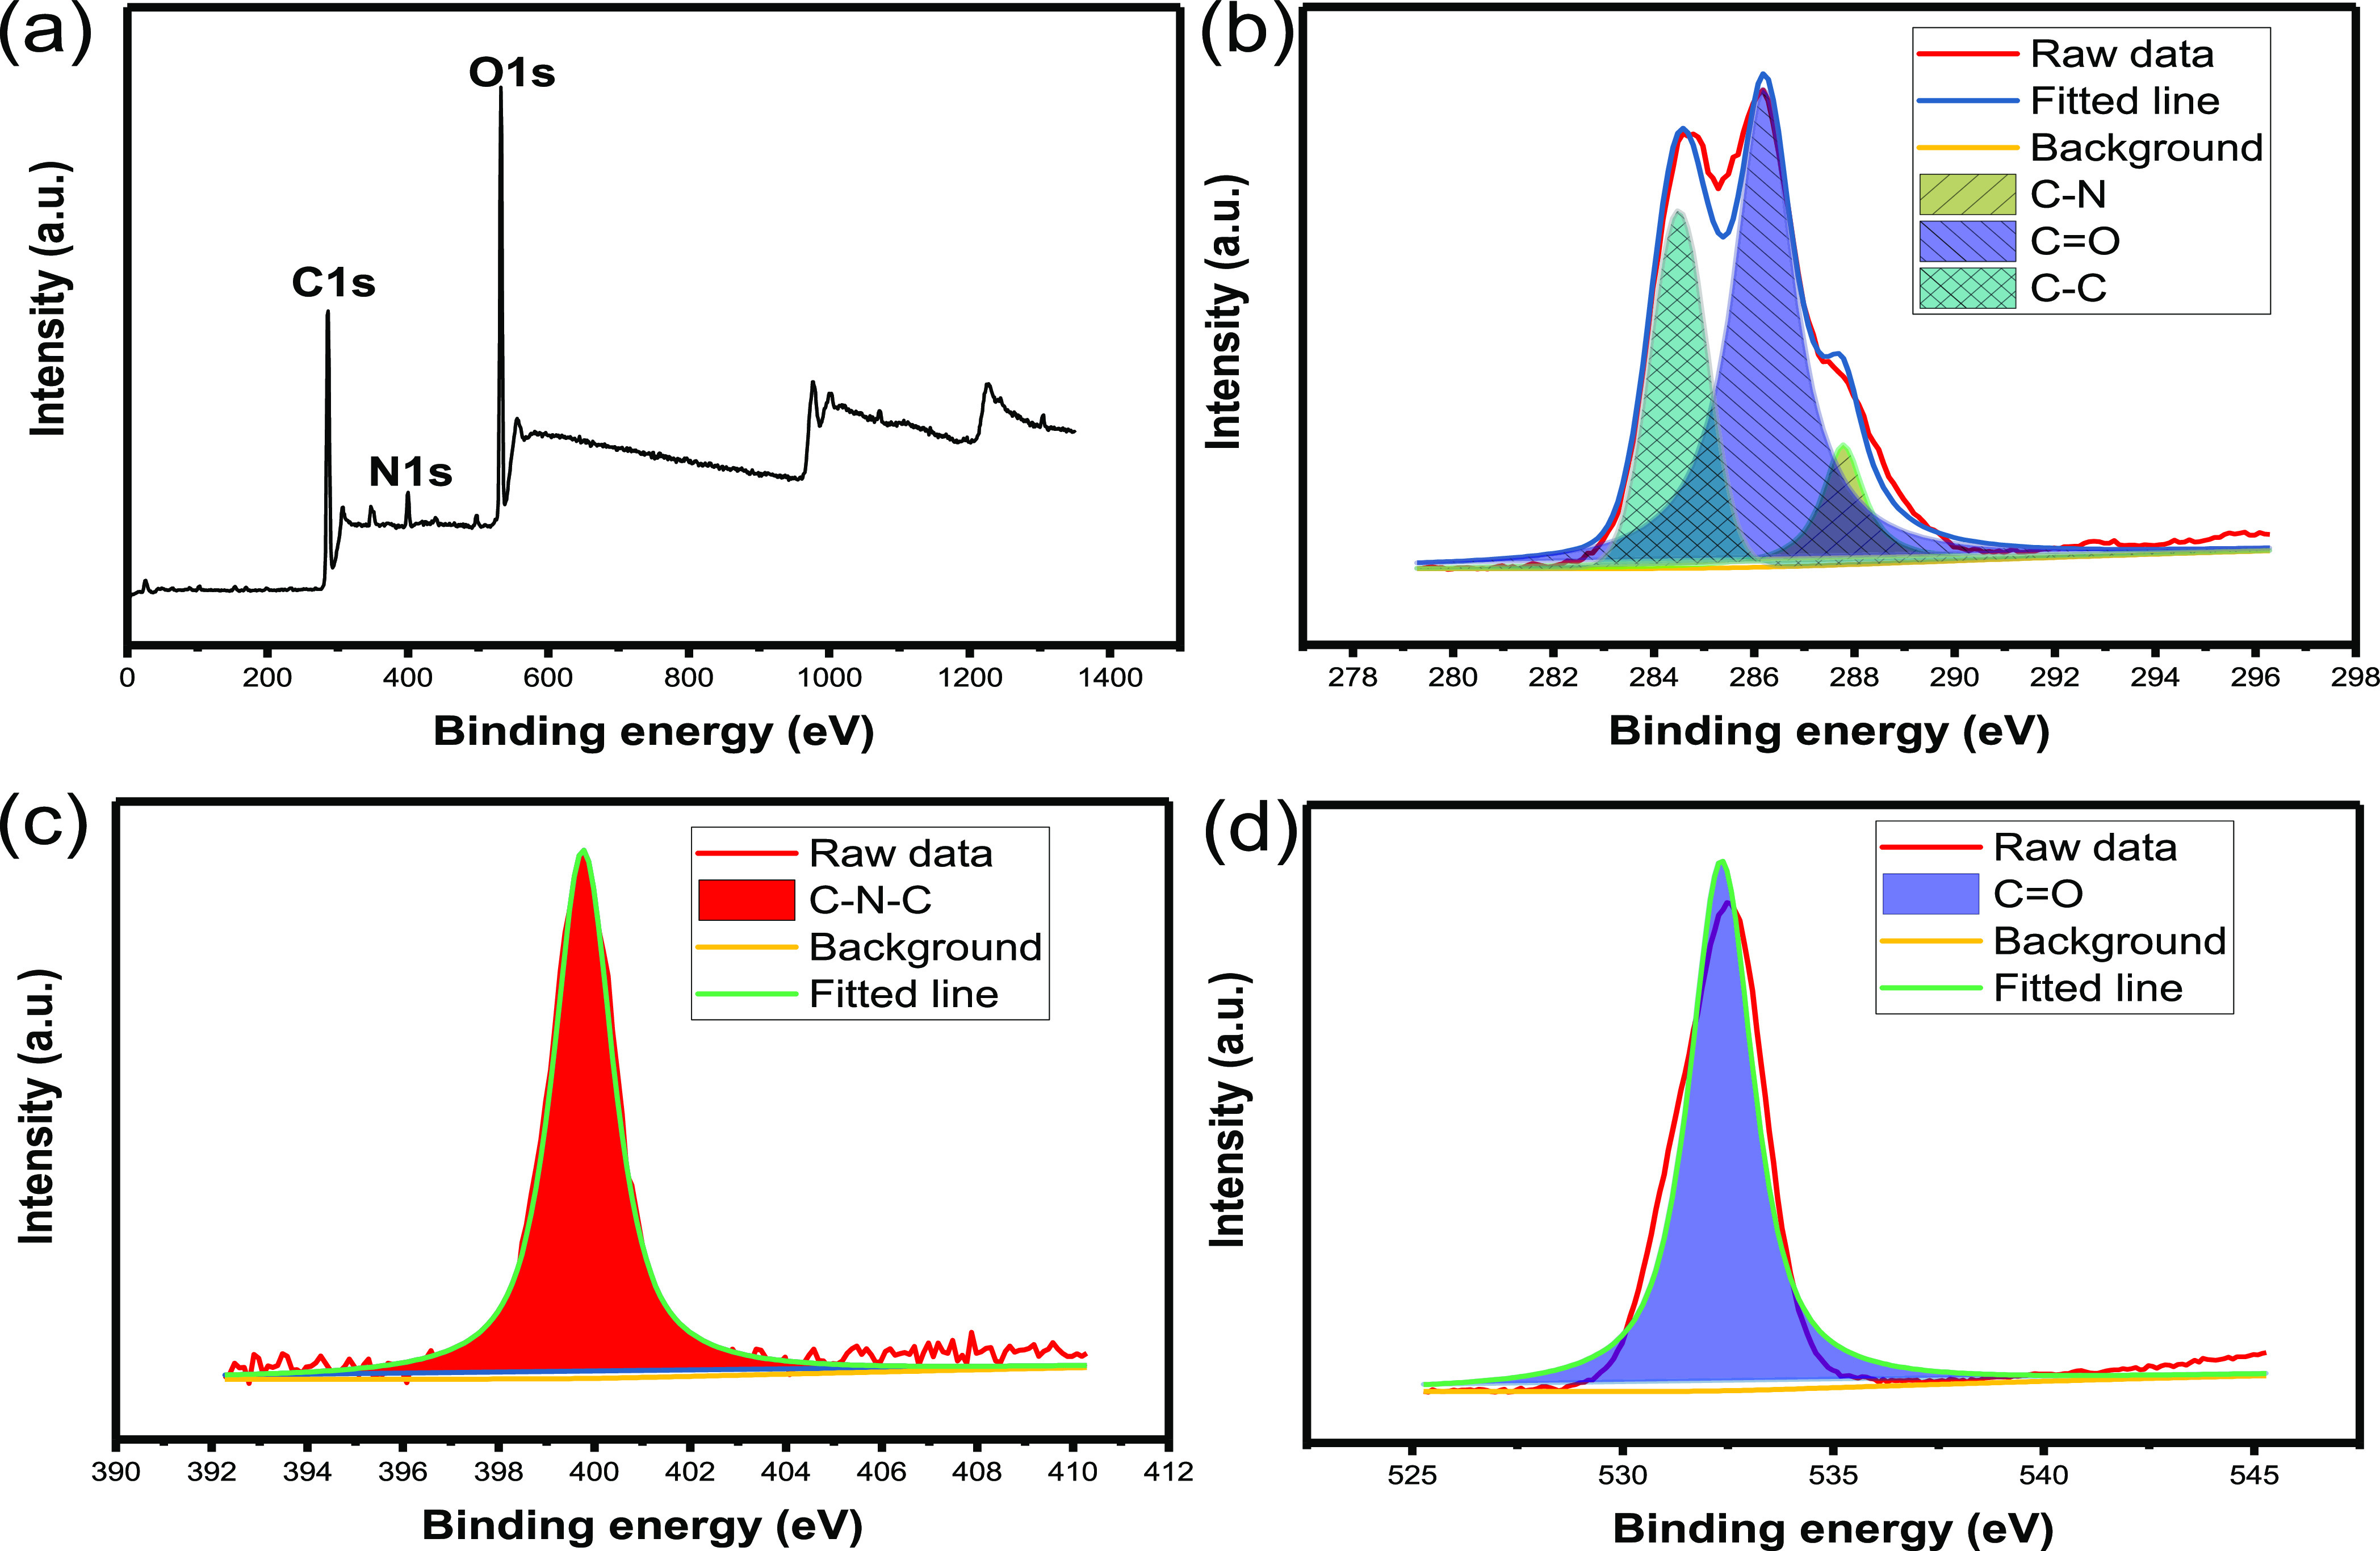
(a) XPS spectrum. The high-resolution XPS spectra of: (b) C 1s, (c) N 1s, and (d) O 1s.
The fluorescence lifetime analysis of the CDs is shown in Figure 3. The average lifetime of CDs is found to be 24.8 ns, the decay curve has attenuation characteristics, which is consistent with the properties of typical fluorescent materials. This proves that the synthesized CDs are fluorescent materials.11
Figure 3.

Time-resolved fluorescence decay profile (λexcitation = 340 nm and λemission = 414 nm) and the fitted curve.
The effect of excitation on emission in the range of 300–420 nm was studied (Figure 4a). It is found that if the excitation wavelength is 340 nm, the fluorescence intensity observed is the highest. Figure 4b shows the normalization of emission wavelengths at different excitation wavelengths. The emission wavelength appears to be equidistantly red-shifted, which shows that the material is excitation wavelength-dependent.25Figure 4c shows the optimum emission and excitation wavelengths are 414 and the 340 nm, respectively. For the CDs, the black line is the UV spectrum, and the transitions of π → π* (248 nm) and n → π* (300–500 nm) are confirmed.26 The red line and the green line are the excitation (340 nm) and emission (414 nm) spectra of the CDs, respectively. The international coordinates (x = 0.1552, y = 0.1553) depict that the CDs emit a blue fluorescence (Figure 4d). The quantum yield of the CDs is 18.6% when the excitation wavelength is 340 nm according to the method reported in ref (27).
Figure 4.

(a) Emission spectra; (b) normalized emission spectra; (c) UV spectrum (black line), excitation spectrum (red line), and emission spectrum (blue line); and (d) international coordinate.
2.2. Stability and Interference Experiments
The CDs stability was studied under the conditions of temperature, ionic strength, time, and pH. 25 °C is the room temperature, while the suitable temperature for human habitation is below 50 °C. Therefore, the range of 25–50 °C is chosen to measure the fluorescence intensity. The change of fluorescence is very small (Figure 5a). For the usual analytical work, different reagents are commonly added to the solution. Therefore, the influence of ion strength should be studied. The influence of ion strength was analyzed by adding different amounts of NaCl (0–100 mM), and it was found that the fluorescence intensity remained constant even at high salt concentrations (Figure 5b). Generally speaking, the fluorescence intensity of fluorescent materials gradually decreases after being kept for a period of time, so the effect of this time was compared. It is found that the fluorescence intensity remained almost unchanged for 2 h (Figure 5c). The fluorescence attenuation of the synthesized material was found to be less than 3%, so the synthesized material has very good stability. Very strong acids and bases are rarely used for environmental analyses; therefore, the fluorescence intensities at pH 3–10 was compared. It is found that the fluorescence intensity is the highest under neutral conditions (Figure 5d). We use neutral conditions for the analysis of samples.
Figure 5.

Stability of materials under the conditions of (a) temperature, (b) ionic strength, (c) time, and (d) pH.
As shown in Figure 5, we studied the influence of temperature, ionic strength, time, and pH value. It is found that this material is very stable under neutral conditions and has very high stability to heat, ionization, and time. This is very important for the practical analytical work. First of all, the analysis needs a certain sample separation time, sample preparation time, and detection time. Second, there are some interference impurities in the detection process. This requires that the synthesized material can be stable and has strong anti-interference. Third, because different experimental regions, different seasons, and indoor temperatures may have a certain difference, good temperature stability can ensure correct detection.
The influence of common metal ions is compared. It is found that only copper ions can quench the fluorescence (Figure 6a). Anions usually coexist with cations. The effect of common anions on the fluorescence intensity is compared. The anions had little effect on the fluorescence intensity (Figure 6b). We hope to find a reagent to recover the fluorescence of CDs by screening some of the common reagents, and luckily EDTA was found to be able to recover the fluorescence of CDs (Figure 6c). As shown in Figure 6d, the fluorescence is quenched and recovered by copper ions and EDTA, respectively.
Figure 6.

Interferences: (a) metal ions, (b) anions, (c) agent recovery, and (d) fluorescence quenching and recovery.
2.3. Mechanism of Selective Detection of Copper and EDTA
There are many reports that heavy metal ions can selectively quench the fluorescence of CDs,28−30 for example, in some reports on mercury ions, the quenching mechanism was considered to be surface oxidation due to energy transfer.31 In reports on iron ions, the mechanism is the neutralization of the negative charges of CDs by Fe3+ ions.32 The quenching mechanism of Cu2+ is static quenching or a combination of static and dynamic quenching.33
Selective detection of EDTA is mainly due to its unique properties. EDTA as a chelate can be cross-linked with metal ions, so that the metal ions cannot work, thus realizing the recovery of fluorescence.2 Most organic substances are not as strongly adsorbed or cross-linked as EDTA and thus selective testing of EDTA is achieved.
2.4. Analytic Results of Copper Ions and EDTA
2.4.1. Effect of Quenching Time
Before testing, we need to analyze the effect of time on the reaction. The fluorescence intensity decreased rapidly in the first 10 min and decreased slowly at the beginning of the next 10 min until equilibrium was reached (Figure 7a). When EDTA was added, the fluorescence intensity increased rapidly, and after 15 min, it tended to balance (Figure 7b).
Figure 7.

Quenching time for (a) copper ions and (b) EDTA.
2.4.2. Results of the Copper Ion Test
When copper ions were added, the fluorescence intensity decreased gradually (Figure 8). The inset of Fig. 8 shows the correlation between the quenching rate [(F0 – F)/F0] and the concentration of copper ions.
Figure 8.

Quenching of fluorescence intensity. Inset: correlation between the copper ion concentration and the quenching rate (F0 – F)/F0. (F0 represents the initial state of fluorescence intensity and F represents the fluorescence intensities of copper ions added at different concentrations.)
2.4.3. Results of the EDTA Test
The recovery of fluorescence by EDTA is based on the quenching of fluorescence intensity by copper ions. It was observed seen that EDTA gradually recovered the quenched fluorescence; when the addition of EDTA concentration was different, the recovery effect was also different (Figure 9).
Figure 9.

Recovery of fluorescence intensity by EDTA. Inset: linear correlations between (F – F0)/F0 and the concentration of EDTA.
2.4.4. Fluorescence Recovery Switching Experiments
First, the fluorescence was quenched by the copper ion. Second, when EDTA was added, the fluorescence was recovered. When the copper ions were added again, the fluorescence wasquenched again, and the fluorescence was recovered again upon the addition of EDTA (Figure 10). It is therefore concluded that the fluorescence quenching and recovery have good repeatability.
Figure 10.

Fluorescence switching of copper ion quenching and EDTA recovery.
2.4.5. Detection Mechanism of Copper Ions and EDTA
The detection mechanism is that copper ions can interact with the functional groups on the surface of the CDs to form complex compounds by coordination.34 The fluorescence of CDs was quenched by the change of the surface state. When EDTA was added, the chelation between copper ions and edetic acid resulted in the recovery of fluorescence.35
2.5. Recovery Rate in Real Samples
The recovery of copper ions and EDTA in real samples was between 98 and 101%, and the relative standard deviation (RSD) was very small. The limits of detection (LODs) for copper and EDTA were 0.13 and 0.07 μM, respectively (Tables 1 and 2).
Table 1. Detection Results for Copper Ions.
| sample | spiked concentration (μM) | total found (μM) | recovery (%) N = 3 | RSD (%) N = 3 |
|---|---|---|---|---|
| river water | 16 | 15.81 | 98.81 | 1.02 |
| 24 | 23.73 | 98.88 | 1.33 | |
| 32 | 31.81 | 99.41 | 0.55 | |
| tap water | 16 | 16.10 | 100.63 | 0.76 |
| 24 | 23.89 | 99.54 | 0.64 | |
| 32 | 31.92 | 99.75 | 0.58 |
Table 2. Detection Results for EDTA.
| sample | spiked concentration (μg mL–1) | total found (μg mL–1) | recovery (%) N = 3 | RSD (%) N = 3 |
|---|---|---|---|---|
| bread | 30 | 29.82 | 99.40 | 0.67 |
| 40 | 39.59 | 98.98 | 0.62 | |
| 50 | 49.48 | 98.96 | 0.48 | |
| biscuit | 30 | 29.62 | 98.73 | 0.79 |
| 40 | 39.56 | 98.90 | 0.47 | |
| 50 | 49.61 | 99.22 | 0.43 |
2.6. Results of the Visual Fluorescent Paper Test
First, we prepared different concentrations of copper ion solutions. Then, a suitable amount of copper ion solution was added to the CD solution for quenching and then the test paper was immersed in the solution. It can be seen that under sunlight, the appearance of the test paper was the same (Figure 11a). However, the fluorescence intensity under ultraviolet (UV) light decreased with the increase of the copper ion concentration (Figure 11b).
Figure 11.

Copper ion test paper: (a) under sun light and (b) under UV light (blank is the common filter paper, which is not soaked in the CD solution; the concentration of copper ions is 0–400 μM).
For the detection using the EDTA test paper, under sunlight irradiation, the appearance should be consistent (Figure 12a). Under UV light irradiation, when the amount of EDTA was different, the fluorescence intensity was different (Figure 12b). Therefore, a correlation was found between the fluorescence intensity and the concentration of EDTA, and the correlation was visible to the naked eye.
Figure 12.

EDTA test paper: (a) under sun light and (b) under UV light (blank is the common filter paper, which is not soaked in the CDs solution; the concentration of EDTA is 0–140 μM).
3. Conclusions
Biological resources are one of the precious resources for human beings. A lot of resources are wasted in our day-to-day life. For example, in this study, P. sativum L. legumes are used; because of their poor taste, their utilization rate is very low, and they are even abandoned.
Meanwhile, environmental pollution is one of the most important problems to the human society. Due to the extensive use of food additives in recent years, some food safety problems have been appearing frequently. Assessment of the content of food additives has become a key part of food safety.
P. sativum L. is very cheap and easy to obtain in China. The synthetic raw materials of this study are only P. sativum L. and water, without any chemical reagent, and the new material formed after carbonization is very safe, which can be used for the detection of metal ions in food samples and for biological applications.
Biomass is a very broad resource, and we will continue to develop more applications for biomass.
4. Materials and Methods
4.1. Materials
P sativum L. was bought from the market, whose legumes were peeled by hand and mechanically crushed to a particle size of 0.85 mm. The water used in the experiment was deionized water.
4.2. Characterization
Transmission electron microscopy (TEM, Hitachi H-7700); UV–vis absorption spectroscopy (UV-2000 UV–vis spectrophotometer, Unico China); fluorescence detection (FL-2700 fluorescence spectrometer, Hitachi Japan); X-ray diffraction (XRD) (Bruker AXS, Germany); Fourier transform infrared (FTIR) spectroscopy (Mettle, Switzerland); and X-ray photoelectron spectroscopy (XPS) (ESCALAB250Xi, Thermo Scientific) were used for the characterization of synthesized samples.
4.3. Preparation of the CDs
P. sativum L. legumes were crushed to a size of 25 μm. 0.5 g of P. sativum L. powder and 10 mL water were mixed and carbonized in an oven at 200 °C for 8 h. After cooling, the supernatant was purified using a water membrane (molecular weight cut-off, 1000 Da).
4.4. Detection of Copper Ions
The concentration of CDs used was 0.08 mg·mL–1. In the whole process of analysis, we considered the influence of the reaction time, sample order, and other factors on the reaction results.
4.5. Detection of EDTA
The order of the experiment was the preparation of the CD solution, followed by the addition of copper ions to the CD solution, and the addition of EDTA after the completion of the reaction.
4.6. Testing of Real Samples
River water and tap water were chosen as the real samples to analyze copper ions. Bread and biscuit were chosen as real samples to analyze EDTA. The river water and tap water were filtered using a filter paper. Bread and biscuit were ground into powder separately. Then, deionized water was added and sonicated, and the supernatant was used for analysis.
4.7. Preparation of Fluorescent Filter Paper
In this study, two kinds of fluorescent filter papers were prepared. One was a copper ion test paper and the other an EDTA test paper. First, a common filter paper was cut into a rectangle of 5 cm length and 1.5 cm width. Then, the filter paper was soaked in CD solution and dried naturally. This paper was called the copper ion detection paper. For the preparation of the EDTA test paper, the common filter paper was first immersed in the CD solution and dried naturally. Then, it was soaked in 50 μM copper ion solution and dried naturally.
Acknowledgments
This study was funded by the National Natural Science Foundation of China (project number: U1860112).
Glossary
Abbreviations
- carbon dots
CDs
- ethylenediaminetetraacetic acid,
EDTA
- X-ray diffraction
XRD
- transmission electron microscopy
TEM
- X-ray photoelectron spectroscopy
XPS
- Fourier transform infrared spectroscopy
FTIR
- ultraviolet
UV
- relative standard deviation
RSD
- limit of detection
LOD
The authors declare no competing financial interest.
References
- Sabouhi M.; Ali-Taleshi M. S.; Bourliva A.; Nejadkoorki F.; Squizzato S. Insights into the anthropogenic load and occupational health risk of heavy metals in floor dust of selected workplaces in an industrial city of Iran. Sci. Total Environ. 2020, 744, 140762. 10.1016/j.scitotenv.2020.140762. [DOI] [PubMed] [Google Scholar]
- Barton C.EDTA (Ethylenediaminetetraacetic Acid). Encyclopedia of Toxicology; Elsevier Science, 2014; pp 310–311. [Google Scholar]
- Zhao S. J.; Lan M. H.; Zhu X. Y.; Xue H. T.; Ng T. W.; Meng X. M.; Lee C. S.; Wang P. F.; Zhang W. J. Green synthesis of bifunctional fluorescent carbon dots from garlic for cellular imaging and free radical scavenging. ACS Appl. Mater. Interfaces 2015, 7, 17054–17060. 10.1021/acsami.5b03228. [DOI] [PubMed] [Google Scholar]
- Liu W.; Diao H. P.; Chang H. H.; Wang H. J.; Li T. T.; Wei W. L. Green synthesis of carbon dots from rose-heart radish and application for Fe3+ detection and cell imaging. Sens. Actuators, B 2017, 241, 190–198. 10.1016/j.snb.2016.10.068. [DOI] [Google Scholar]
- He W. M.; Cui X. L. Editorial: Green organic synthesis. Chin. Chem. Lett. 2021, 32, 1589–1590. 10.1016/j.cclet.2021.03.013. [DOI] [Google Scholar]
- Jagannathan M.; Dhinasekaran D.; Soundharraj P.; Rajendran S.; Vo D.-V. N.; Prakasarao A.; Ganesan S. Green synthesis of white light emitting carbon quantum dots: Fabrication of white fluorescent film and optical sensor applications. J. Hazard Mater. 2021, 416, 125091. 10.1016/j.jhazmat.2021.125091. [DOI] [PubMed] [Google Scholar]
- Boruah A.; Saikia M.; Das T.; Goswamee R. L.; Saikia B. K. Blue-emitting fluorescent carbon quantum dots from waste biomass sources and their application in fluoride ion detection in water. J. Photochem. Photobiol., B 2020, 209, 111940. 10.1016/j.jphotobiol.2020.111940. [DOI] [PubMed] [Google Scholar]
- Ding Z.; Li F.; Wen J.; Wang X.; Sun R. Gram-scale synthesis of single-crystalline graphene quantum dots derived from lignin biomass. Green Chem. 2018, 20, 1383–1390. 10.1039/c7gc03218h. [DOI] [Google Scholar]
- Feng S.; Gao Z.; Liu H.; Huang J.; Li X.; Yang Y. Feasibility of detection valence speciation of Cr(III) and Cr(VI) in environmental samples by spectrofluorimetric method with fluorescent carbon quantum dots. Spectrochim. Acta, Part A 2019, 212, 286–292. 10.1016/j.saa.2018.12.055. [DOI] [PubMed] [Google Scholar]
- Shen J.; Shang S.; Chen X.; Wang D.; Cai Y. Facile synthesis of fluorescence carbon dots from sweet potato for Fe3+ sensing and cell imaging. Acta Crystallogr., Sect. B: Struct. Sci., Cryst. Eng. Mater. 2017, 76, 856–864. 10.1016/j.msec.2017.03.178. [DOI] [PubMed] [Google Scholar]
- Hao X. L.; Dai S. J.; Wang J.; Fang Z. G. Synthesis of blue fluorescent carbon dots and their application in detecting mercury and iodine based on“off–on” mode. Luminescence 2021, 36, 721–732. 10.1002/bio.3993. [DOI] [PubMed] [Google Scholar]
- Zhang Z. Y.; Chen Z. P.; Qu C. L.; Chen L. X. Highly sensitive visual detection of copper ions based on the shape-dependent LSPR spectroscopy of gold nanorods. Langmuir 2014, 30, 3625–3630. 10.1021/la500106a. [DOI] [PubMed] [Google Scholar]
- Luo M. C.; Di J. W.; Li L.; Tu Y. F.; Yan J. L. Copper ion detection with improved sensitivity through catalytic quenching of gold nanocluster fluorescence. Talanta 2018, 187, 231–236. 10.1016/j.talanta.2018.05.047. [DOI] [PubMed] [Google Scholar]
- Yin K.; Wu Y. X.; Wang S. S.; Chen L. X. A sensitive fluorescent biosensor for the detection of copper ion inspired by biological recognition element pyoverdine. Sens. Actuators, B 2016, 232, 257–263. 10.1016/j.snb.2016.03.128. [DOI] [Google Scholar]
- He F. Q.; Deng X. H.; Chen M. Evaluation of Fe(II) EDTA-NO reduction by zinc powder in wet flue gas denitrification technology with Fe(II) EDTA. Fuel 2017, 199, 523–531. 10.1016/j.fuel.2017.03.015. [DOI] [Google Scholar]
- Scholes K. L.; Ence A. T.; Strathmann F. G.; Genzen J. R.; La’ulu S. L.; Logan H. L.; Parker R. L. Identification and characterization of EDTA test strip interfering substances using a digital color detector. Lab. Med. 2015, 61, 785–791. 10.7754/clin.lab.2015.150125. [DOI] [PubMed] [Google Scholar]
- Lou X. F.; Wu Y. N.; Kabtamu D. M.; Matović L.; Zhang Y. X.; Sun X. Y.; Schott E.; Chu W. H.; Li F. T. Exploring UiO-66(Zr) frameworks as nanotraps for highly efficient removal of EDTA-complexed heavy metals from water. J. Environ. Chem. Eng. 2021, 9, 104932. 10.1016/j.jece.2020.104932. [DOI] [Google Scholar]
- Feng F.; Miao C. F.; Zhang Y. L.; Huang Z. J.; Weng S. H. Positively charged and pH-sensitive carbon dots for fluorescence detection of copper ion. Bull. Korean Chem. Soc. 2021, 42, 227–234. 10.1002/bkcs.12178. [DOI] [Google Scholar]
- Zhao L.; Li H.; Xu Y.; Liu H.; Zhou T.; Huang N.; Li Y.; Ding L. Selective detection of copper ion in complex real samples based on nitrogen-doped carbon quantum dots. Anal. Bioanal. Chem. 2018, 410, 4301–4309. 10.1007/s00216-018-1079-6. [DOI] [PubMed] [Google Scholar]
- Kumari A.; Kumar A.; Sahu S. K.; Kumar S. Synthesis of green fluorescent carbon quantum dots using waste polyolefins residue for Cu2+ ion sensing and live cell imaging. Sens. Actuators, B 2018, 254, 197–205. 10.1016/j.snb.2017.07.075. [DOI] [Google Scholar]
- Du F. F.; Gong X. J.; Lu W. J.; Liu Y.; Gao Y. F.; Shuang S. M.; Xian M.; Dong C. Bright-green-emissive nitrogen-doped carbon dots as a nanoprobe for bifunctional sensing, its logic gate operation and cellular imaging. Talanta 2018, 179, 554–562. 10.1016/j.talanta.2017.11.030. [DOI] [PubMed] [Google Scholar]
- Chun L.; Liu W. J.; Sun X. B.; Pan W.; Yu G. F.; Wang J. P. Excitation dependent emission combined with different quenching manners supports carbon dots to achieve multi-mode sensing. Sens. Actuators, B 2018, 263, 1–9. 10.1016/j.snb.2018.02.050. [DOI] [Google Scholar]
- Li C.; Liu W. J.; Ren Y. J.; Sun X. B.; Pan W.; Wang J. P. The selectivity of the carboxylate groups terminated carbon dots switched by buffer solutions for the detection of multi-metalions. Sens. Actuators, B 2017, 240, 941–948. 10.1016/j.snb.2016.09.068. [DOI] [Google Scholar]
- Sun X. B.; Jin X. Z.; Pan W.; Guo E. M.; Liu W. J.; Li D. H.; Lu K. C.; Si S. X.; Zhang N. X.; Jia Z. Z.; Shi Y. P.; Li Q. Q.; Wang J. P. Highly Luminescent Carbon Dots Synthesized by Microwave-Assisted Pyrolysis and Evaluation of Their Toxicity to Physa acuta. J. Nanosci. Nanotechnol. 2016, 16, 648–653. 10.1166/jnn.2016.11112. [DOI] [PubMed] [Google Scholar]
- Xu P. P.; Wang C. F.; Sun D.; Chen Y. J.; Zhuo K. L. Ionic liquid as a precursor to synthesize nitrogen and sulfur-co-doped carbon dots for detection of copper(II) ions. Chem. Res. Chin. Univ. 2015, 31, 730–735. 10.1007/s40242-015-5118-y. [DOI] [Google Scholar]
- Zhao J. R.; Pan X. H.; Sun X. B.; Pan W.; Yu G. F.; Wang J. P. Detection of metronidazole in honey and metronidazole tablets using carbon dots-based sensor via the inner filter effect. Luminescence 2018, 33, 1–9. 10.1002/bio.3467. [DOI] [PubMed] [Google Scholar]
- Grabolle M.; Spieles M.; Lesnyak V.; Gaponik N.; Eychmüller A.; Resch-Genger U. Determination of the fluorescence quantum yield of quantum dots: suitable procedures and achievable uncertainties. Anal. Chem. 2009, 81, 6285–6294. 10.1021/ac900308v. [DOI] [Google Scholar]
- Liu Y. Y.; Pilankatta R.; Hatori Y.; Lewis D.; Inesi G. Comparative features of copper ATPases ATP7A and ATP7B heterologously expressed in COS-1 cells. Biochemistry 2010, 49, 10006–10012. 10.1021/bi101423j. [DOI] [PMC free article] [PubMed] [Google Scholar]
- Shao N.; Zhang Y.; Cheung S. M.; Yang R. H.; Chan W. H.; Mo T.; Li K.; Liu F. Copper ion-selective fluorescent sensor based on the inner filter effect using a spiropyran derivative. Anal. Chem. 2005, 77, 7294–7303. 10.1021/ac051010r. [DOI] [PubMed] [Google Scholar]
- Ghosh S.; Priyam A.; Bhattacharya S. C.; Saha A. Mechanistic aspects of quantum dot based probing of Cu(II) ions: role of dendrimer in sensor efficiency. J. Fluoresc. 2009, 19, 723–731. 10.1007/s10895-009-0468-9. [DOI] [PubMed] [Google Scholar]
- Fei A. P.; Hao X. L.; Wang J.; Xu W. Q.; Dai S. J.; Fang Z. G. Study on the preparation of fluorescent carbon dots from Epipremnum aureum and its application in the ions detection and bioimaging. J. Mater. Sci. Mater. Electron. 2021, 32, 20570–20582. 10.1007/s10854-021-06568-0. [DOI] [Google Scholar]
- Pang S.; Liu S. Dual-emission carbon dots for ratiometric detection of Fe(3+) ions and acid phos. Anal. Chim. Acta 2020, 1105, 155–161. 10.1016/j.aca.2020.01.033. [DOI] [PubMed] [Google Scholar]
- Fan Q.; Li J. H.; Zhu Y. H.; Yang Z. L.; Shen T.; Guo Y. Z.; Wang L. H.; Mei T.; Wang J. Y.; Wang X. B. Functional carbon quantum dots for highly sensitive graphene transistors for Cu2+ ion detection. ACS Appl. Mater. Interfaces 2020, 12, 4797–4803. 10.1021/acsami.9b20785. [DOI] [PubMed] [Google Scholar]
- Wang C. X.; Pan C. W.; Wei X. R.; Yang F.; Wu W. J.; Mao L. Q. Emissive carbon dots derivated from natural liquid fuels and its biological sensing for copper ions. Talanta 2020, 208, 120375. 10.1016/j.talanta.2019.120375. [DOI] [PubMed] [Google Scholar]
- Chang C.; Ku Y. The adsorption and desorption characteristics of EDTA-chelated copper ion by activated carbon. Sep. Sci. Technol. 1995, 30, 899–915. 10.1080/01496399508015406. [DOI] [Google Scholar]