Abstract
A coordination polymer with the composition C12H20O16Zn2 (ZnBTC) (BTC = benzene-1,3,5-tricarboxylate) was synthesized under hydrothermal conditions at 120 °C, and its crystal structure was determined using single-crystal X-ray crystallography. First-principles electronic structure investigation of the compound was carried out using the density functional theory computational approach. The highest occupied molecular orbital, the lowest unoccupied molecular orbital, the energy gap, and the global reactivity descriptors of ZnBTC were investigated in both the gas phase and the solvent phase using the implicit solvation model, while the donor–acceptor interactions were studied using natural bond orbital analyses. The results revealed that ZnBTC is more stable but less reactive in solvent medium. The larger stabilization energy E(2) indicates a greater interaction of ZnBTC in the solvent than in the gas phase. Orange peel activated carbon and banana peel activated carbon chemically treated with ZnCl2 and/or KOH were used to modify the synthesis of ZnBTC to obtain nanocomposites. ZnBTC and the nanocomposites were characterized by powder X-ray diffraction (PXRD), thermogravimetric analysis, and Fourier transform infrared. The specific surface area (SBET) and the average pore diameter of the materials were determined by nitrogen sorption measurements using the Brunauer–Emmett–Teller (BET) method, while scanning electron microscopy and transmission electron microscopy were used to observe their morphology and particle size, respectively. The PXRD of all the activated carbon materials exhibited peaks at 2θ values of 12.7 and 13.9° corresponding to a d-spacing of 6.94 and 6.32 Å, respectively. The N2 adsorption–desorption isotherm of the materials are of type II with nanocomposites showing enhanced SBET compared to the pristine ZnBTC. The results also revealed that activated carbons from the banana peel and the derived nanocomposites exhibited better porous structure parameters than those obtained from orange peel. The degradation efficiency of methyl orange in aqueous solutions using ZnBTC as a photocatalyst was found to be 52 %, while that of the nanocomposites were enhanced up to 79 %.
1. Introduction
In our environment today, agricultural wastes are becoming a problem, and access to clean water is difficult due to the constant discharge of contaminated wastewater into water bodies. This wastewater from chemicals, textiles, and paper industries contains organic dyes toxic to the environment.1−3 Complete removal or degradation of these contaminants from the water bodies is one research area that has received attention. Several techniques such as advanced oxidation process, adsorption, photocatalysis, membrane separation, and coagulation are widely used to separate the pollutants from wastewater. The adsorption process, which is the most widely used method in removing organic pollutants from aqueous solutions, requires suitable adsorbents such as activated carbons (ACs), zeolites, and metal–organic frameworks (MOFs).4 Typical MOFs that have been studied for the adsorptive removal of organic dyes include MIL-101, MIL-53,5,6 MOF-235,7 UiO-66,8 NiCuBTC,9 CuBTC-1,10 among many others. Although the adsorption method is advantageous in terms of effectiveness, efficiency, and low operating cost,11 however, complete removal of all the toxic products is difficult.12 To eliminate all the toxic products, photocatalysts are utilized in the presence of ultraviolet–visible (UV–vis) light to degrade the dyes to carbon dioxide and water molecules. Recently, MOFs used as photocatalysts in the degradation of organic dyes have received increasing attention.13−19 MOFs are known to exhibit exciting physical, chemical, and tunable porous properties, which make them useful in different areas of applications, including gas storage and separation,20 adsorption,21,22 catalysis,23−25 and drug delivery.26 MOFs’ application as photocatalysts stems from the fact that they can exhibit charge separation properties by strong absorption of UV–vis light coupled with a long lifetime of excited state and good charge mobility.27−31 The synthesis of MOFs involves the use of metal ions and organic linkers. The Zn2+ ions and 1,3,5-benzenetricarboxylic acid, H3BTC, are among the most widely studied systems in the design of MOFs. H3BTC is a versatile organic linker for its rigidity and the presence of three equally spaced COO groups, which can coordinate in different modes to the metal ions to form coordination polymers.32 The combination of Zn2+ ions with H3BTC resulted in coordination polymers with 1D, 2D, and 3D structures.33−38
To enhance the photocatalytic properties of MOFs, other active materials could be integrated during the synthetic protocols to form MOF-based composite materials.39−41 In the search for active materials for MOF-based composites, AC stands out. AC is a carbonaceous material obtained from coal or biomass by thermochemical processes. Askari et al.(41) prepared the MOF-5–AC composite for the removal of dyes. Mahmoodi et al.(42) used AC/MOF composite as a bio-based novel green adsorbent. Hasanzadeh et al.(43) used nanocomposites of AC/chromium-based MOF (AC@MIL-101) as an adsorbent to remove anionic dyes from an aqueous solution. The current research trend in AC production explores various agricultural wastes as a low-cost alternative to coal-based granular ACs owing to their abundance and availability.44−48 Köseoğlu and Akmil-Başar48 investigated the structural evaluation and adsorptive properties of low-cost AC from orange peel. Azad et al.(49) utilized AC composite with HKUST-1 MOF (AC–HKUST-1 MOF) for the removal of ternary organic dyes. Majumder et al.(32) reported the photoluminescence properties of the organic linker 1,3,5-benzenetricarboxylic acid (H3BTC) and the coordination polymer {[Zn3(BTC)2(H2O)8]·(H2O)4}n and concluded that the complex can be used as a photoactive material. Herein is a report on the electronic properties of this coordination polymer using density functional theory (DFT). The textural and photocatalytic properties of ZnBTC and AC–ZnBTC nanocomposites are also reported.
2. Experimental Procedure
2.1. Materials
The syntheses were carried out in Ace pressure tubes (15 cm3) purchased from Aldrich Chemical Co. and heated in programmable ovens. The following reagents were used: benzene-1,3,5-tricarboxylic acid (98%), [Zn(NO3)2·6H2O] (99%), methanol, dimethylformamide (DMF), ZnCl2, KOH pellets, and methyl orange (MO) were obtained from Aldrich and used without further purification.
2.2. Preparation of AC
2.2.1. Physical Activation Process
The orange and banana peels used in this investigation were sourced from markets in Calabar Municipality, Nigeria. The peels were washed with deionized water thoroughly to remove dust and all other impurities. The drying process was done in the oven for 2 days at 85 °C until a constant weight was obtained. The dried peels were milled and sieved to obtain a fine uniform particle size before drying again in the oven at 105 °C until a steady weight was obtained and were denoted as non-activated orange peel (NAOP) or non-activated banana peel (NABP). The dried samples were divided into two portions, and one portion was physically activated by heating in a furnace at 400 °C for 45 min. The product obtained was denoted as orange peel AC (OPAC) and banana peel AC (BPAC).
2.2.2. Chemical Activation Process
The chemical activation process was carried out according to the reported procedure in the literature.42,50−52 In a typical process, the second portion of the dried, milled, and sieved peels obtained in Section 2.2.1 was treated with ZnCl2 in a ratio of 1:5. The mixture was dried at 105 °C for 3 h in an oven and then divided into two portions. One portion was heated in a furnace at 400 °C for 45 min. The products obtained (chemically treated with only ZnCl2) were denoted as OPZnClAC (from the orange peel) and BPZnClAC (from the banana peel). The second portion of the dried sample obtained was mixed with KOH pellets in a ratio of 1:3 and dried at 85 °C for 2 h in an oven before heating in the furnace at 400 °C for 45 min. The final product was rinsed with dilute HCl until pH was equal to 7.0 and dried in a desiccator. The products obtained (chemically treated with both ZnCl2 and KOH) were denoted as OPZnClKOHAC (from the orange peel) and BPZnClKOHAC (from the banana peel).
2.3. Synthesis of C12H20O16Zn2 (ZnBTC)
In a typical synthesis, zinc(II) nitrate hexahydrate, Zn(NO3)2·6H2O (0.297 g, 1.0 mmol), was stirred together with benzene-1,3,5-tricarboxylic acid (H3BTC) (0.221 g, 1.0 mmol) in 20 cm3 of distilled water–methanol–DMF solvent mixture in a 3:3:4 ratio. The solution’s pH was adjusted to 6.0 by the addition of 2.0 cm3 of 0.5 M NaOH. The resultant mixture was homogenized for 30 min before transferring into Ace glass tube and heated at 120 °C for 48 h. The colorless crystalline product was filtered under vacuum, washed with distilled water, and air-dried.
2.4. Syntheses of the AC–ZnBTC Nanocomposites
In a typical synthesis of the orange peel-derived AC, the OPAC@ZnBTC nanocomposite, 1.0 g of OPAC, was added in situ to the reaction mixture to synthesize ZnBTC in Section 2.3. The product obtained was denoted as OPAC@ZnBTC. Similarly, to obtain OPZnClAC@ZnBTC, OPZnClKOHAC@ZnBTC, BPZnClKOHAC@ZnBTC, and BPZnClAC@ZnBTC nanocomposites, 1.0 g each of the agro-waste-derived AC was added to separate the reaction mixtures for the synthesis of ZnBTC.
2.5. Photocatalytic Test
The pristine ZnBTC, OPAC, BPAC, OPAC@ZnBTC, OPZnClAC@ZnBTC, OPZnClKOHAC@ZnBTC, BPAC@ZnBTC, BPZnClKOHAC@ZnBTC, and BPZnClAC@ZnBTC nanocomposites were used as photocatalysts in the degradation of the MO dye in an aqueous solution at 25 °C. In a typical photocatalytic activity test using the pristine ZnBTC, 40 mg of powdered sample was dispersed in 30 cm3 of 2.5 × 10⁻⁵ M solution of MO. The mixture was stirred in the dark for 30 min before turning on the UV-C Hg lamp (160 W) under continuous stirring for 60 min. At every 10 min interval, about 5 cm3 of the mixture was taken out from the reaction vessel into a centrifuge bottle and centrifuged at 620 rpm for 15 min to remove the catalyst. The absorption spectrum was recorded at λ = 460 nm using a UV–vis spectrophotometer. The photodegradation followed pseudo-first-order kinetics and was studied by using the equation: ln(At/Ao) = −kt, where k is the apparent rate constant, At is the absorbance at time t, and Ao is the absorbance at time t = 0 (Beer–Lambert’s law: the absorbance is directly proportional to the concentration). The degradation efficiency was calculated using the equation % degradation = [(1 – (At/Ao)) × 100]. The band gap energy Eg was determined by the Tauc plot according to the equation (αhν)2 = A(hν – Eg), where h is Planck’s constant, ν is photon’s frequency, α is the absorption coefficient, Eg is the band gap, and A is a proportionality constant. Exponent 2 is indicative of indirect allowed transitions.
2.6. Characterization
2.6.1. X-ray Crystallography
A suitable crystal of C12H20O16Zn2 (ZnBTC) was selected and mounted in a fomblin film on a micromount on a GVB diffractometer. The crystal was kept at 120(2) K during data collection. Using Olex2,53 the structure was solved with the SHELXT54 structure solution program using intrinsic phasing and refined with the SHELXL55 refinement package using least-squares minimization. Crystal data for C12H20O16Zn2 (M = 551.02 g/mol): monoclinic, space group I2 (no. 5), a = 6.49670(10) Å, b = 12.92210(10) Å, c = 16.1403(2) Å, β = 90.1460(10)°, V = 1354.99(3) Å3, Z = 3, T = 120.0(2) K, μ(Cu Kα) = 4.104 mm–1, ρcalc = 2.026 g/cm3, 9748 reflections measured (8.766° ≤ 2Θ ≤ 146.358°), 2647 unique (Rint = 0.0163, Rσ = 0.0113), which were used in all calculations. The final R1 was 0.0217 [I > 2σ(I)] and wR2 was 0.0561 (all data).
The infrared spectra of the compounds were recorded at an interval of 4000–650 cm–1 on a PerkinElmer Fourier transform infrared (FT-IR) spectrophotometer using the KBr pellets at a 2 cm–1 resolution. The crystalline nature of the samples was studied by powder X-ray diffraction (PXRD) using a Rigaku MiniFlex-600 diffractometer (Cu Kα radiation, λ = 0.1541 nm) at room temperature. The nitrogen sorption analysis was carried out using the Brunauer–Emmett–Teller (BET) method on a Micromeritics ASAP 2460 sorption system. The morphology of the materials and their particle size were checked using a JEOL-JEM-2100F electron microscope with an accelerating voltage of 200 kV. Thermogravimetric studies were carried out on a thermogravimetric analysis (TGA) PerkinElmer STA 6000 under nitrogen flow.
2.7. Computational Details
First-principles electronic structure investigation of C12H20O16Zn2 (ZnBTC) was conducted using the DFT computational approach. Geometry optimization of the structure of ZnBTC was performed with the B3LYP functional, which includes Becke’s (B3) parameter-exchange functional along with Lee, Yang Parr’s (LYP) gradient-corrected correlation functional56,57 using Gaussian 09W, and GaussView 6.0.16 computational packages.58,59 Pre-geometry optimization using the molecular mechanic optimization with the MM + force field implemented in the HyperChem program60 has been performed on model structure and output used for further geometry optimization using a general basis set of 6-31+G(d) for the H, C, and O atoms and the LanL2DZ basis set for the Zn atom. Natural bond orbital (NBO) analyses were calculated by the NBO 3.1 module embedded in Gaussian. The quantum theory of atom-in-molecule (QTAIM) investigations and all other wave function analyses were conducted by Multiwfn 3.7 dev, which is a multifunctional wave function analysis program developed by Lu’s research group.61 Unless otherwise specified, the default settings were used throughout our calculations. All molecular electrostatic (MESP) iso-surface maps were rendered by the visual molecular dynamic 1.9.3 program62 based on the outputs of the Multiwfn analyzer. The computational calculations in the solvent (water) phase was conducted at the same level of theory using the conductor-like polarization continuum model implicit solvation model available in the Gaussian software.
3. Results and Discussion
3.1. Crystal Structure of C12H20O16Zn2 (ZnBTC)
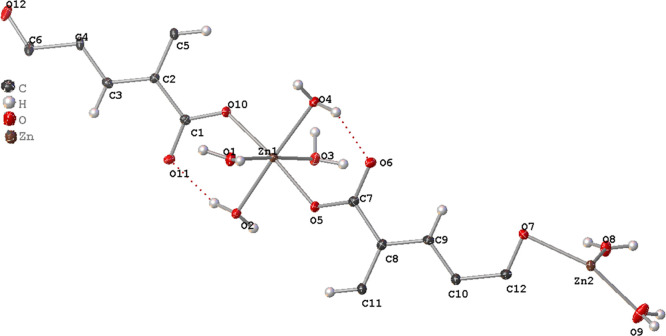
The crystal data and refinement parameters for ZnBTC are presented in Table S1, while selected bond lengths and angles are summarized in Tables S2 and S3, respectively. Fractional atomic coordinates, anisotropic displacement parameters, and hydrogen atom coordinates are given in Tables S4–S6. The asymmetric unit of ZnBTC consists of two independent Zn(II) cations (Zn1 and Zn2) in distorted octahedral coordination (Figure 1). The Zn1 cations are coordinated to two μ1-oxygen atoms from carboxylate groups (O5 and O10) in a monodentate fashion with distances of 2.040(2) and 2.041(2) Å, respectively, and four oxygen atoms from water molecules (O1, O2, O3, and O4) with bond distances of 2.142(2), 2.098(2), 2.150(2), and 2.111(2) Å, respectively, for Zn1–O1, Zn1–O2, Zn1–O3, and Zn1–O4. The O–Zn1–O bond angles are in the range 90.25(9)–177.19(10)°.
Figure 1.
Asymmetric unit of ZnBTC. Thermal ellipsoids are given at 50% probability.
The Zn2 cation is coordinated to two oxygen atoms from the carboxylate group (O7) [Zn2–O7 = 2.160(2) Å] in a chelating fashion and four oxygen atoms corresponding to water molecules (O8 and O9) with distances of 2.121(2) and 2.001(3) Å, respectively. The O–Zn2–O bond angles are in the range 60.89(12)–176.56(13)°. These bond distances and angles agree with similar compounds in the literature.32−38,63−66 There are two BTC3– anions in the structure of ZnBTC. The first BTC3– anion is a polydentate ligand, which coordinates tetradentately to two Zn1 in a monodentate fashion and one Zn2 in a chelating fashion, while the second BTC3– anion is coordinating monodentately to two Zn1 through two of its carboxylate groups (C1–O10) with the third being uncoordinated. The C–O distances are in the range 1.261(4)–1.271(3) Å, with the longest belonging to the chelating carboxylate C12–O7 group. The non-coordinating carboxylate group C6–O12 and the coordinated water molecules form multiple hydrogen bonds that result in a 3D network structure (Figure 2). The aqua ligands act as hydrogen bond donors, while the carboxylate oxygen atoms are the acceptors of the bond. The present compound is isostructural with {[Zn3(BTC)2(H2O)8](H2O)4}n,32,33 [M3(BTC)(HBTC)(OH)(H2O)11] (M = Fe2+, and Co2+),64 and [ZnNi2(BTC)2(H2O)12]n.65
Figure 2.
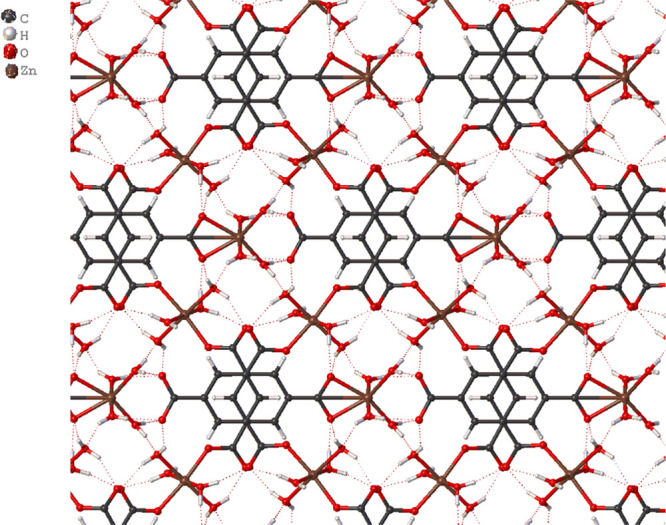
Structure of ZnBTC showing the hydrogen bonding interactions that gives a 3D network.
3.2. FT-IR Analysis
The FT-IR spectra of NAOP, the AC derived from the peel, OPAC, and the modified ZnBTC nanocomposites—OPAC@ZnBTC, OPZnClAC@ZnBTC, and OPZnClKOHAC@ZnBTC—are presented in Figure 3a. The broad absorption peaks observed at 3287 and 3388 cm–1 for NAOP and OPAC, respectively, are attributed to O–H stretching vibrations of water, cellulose, hemicellulose or lignin, and/or N–H stretching modes of the amide groups. For the composites, these bands were observed at 3313, 3365, and 3552 cm–1, respectively, for NAOP@ZnBTC, OPZnClKOHAC@ZnBTC, and OPZnClAC@ZnBTC. The peaks observed at 2922 cm–1 for NAOP and OPAC, 2907 cm–1 for NAOP@ZnBTC, and 2952 cm–1 for OPZnClAC@ZnBTC are due to C–H stretching vibrations.
Figure 3.
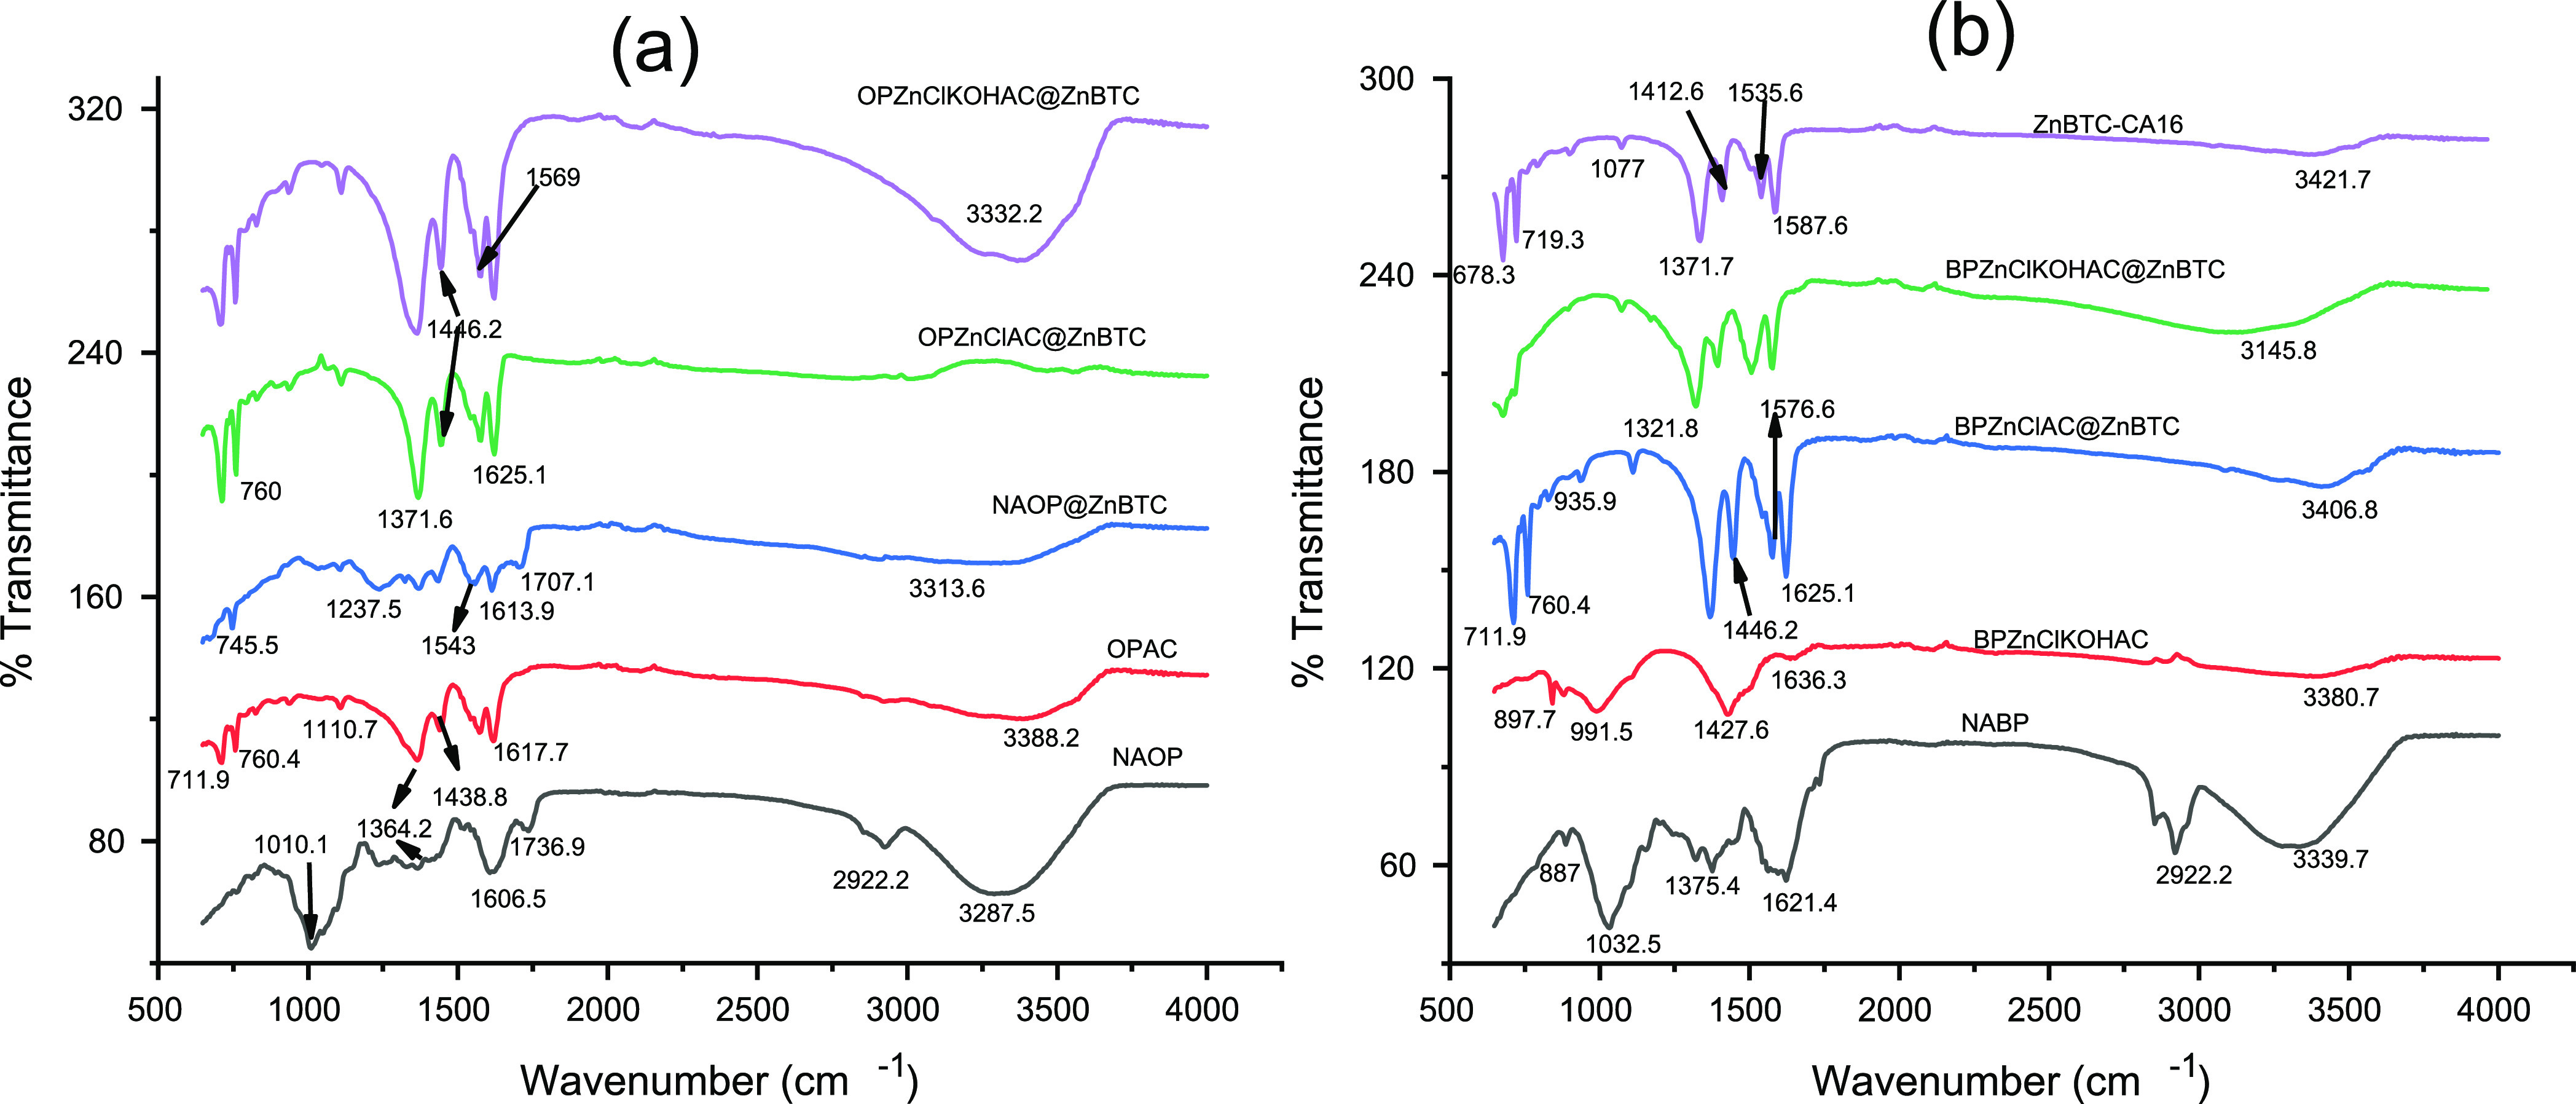
FT-IR spectra of ACs obtained from agricultural biomass and the corresponding modified ZnBTC nanocomposites: (a) samples from orange peel and (b) samples obtained from banana peel.
The vibrational bands at 1736 and 1707 cm–1, respectively, for NAOP and OPAC@ZnBTC can be attributed to the C=O stretching modes of the carboxyl groups. The peaks at 1607 cm–1 (NAOP), 1618 cm–1 (OPAC), 1614 cm–1 (OPAC@ZnBTC), and 1621 cm–1 OPZnClAC@ZnBTC and OPZnClKOHAC@ZnBTC are assigned to the C=C stretching vibrations of the aromatic rings. The asymmetric carboxylate stretching vibrational modes are observed at 1573–1439 cm–1 (OPAC), 1543–436 cm–1 (OPAC@ZnBTC), 1577–1446 cm–1 (OPZnClAC@ZnBTC), and 1577–1443 cm–1 (OPZnClKOH@ZnBTC). The higher of the two asymmetric modes could be assigned to the syn–anti bridge, while the lower bands could be assigned to the syn–syn bridge.63 These bands are missing in the raw orange peel. The C–O stretching modes of the carboxylates are observed at 1364–1010 cm–1 (NAOP), 1364–1111 cm–1 (OPAC), 1372–1036 cm–1 (OPAC@ZnBTC), 1368–1111 cm–1 (OPZnClAC@ZnBTC), and 1364–1111 cm–1 (OPZnClKOH@ZnBTC). The bands in the region of 940–828 cm–1 are associated with C–H bending vibrations of the aromatic rings, while the peaks at 760–670 cm–1 can be attributed to C–H out-of-plane deformation vibrations. In the FT-IR spectra presented in Figure 3b, the peaks at 3339.7 cm–1 (NABP), 3380.7 cm–1 (BPZnClKOHAC), 3406.8 cm–1 (BPZnClAC@ZnBTC), and 3145.8 cm–1 (BPZnClACKOH@ZnBTC) are due to the N–H stretching mode of the amide linkage, while 3421.7 cm–1 for ZnBTC is assigned to the O–H stretching vibrations of water molecules. The peaks at 2922–2825 cm–1 are assigned to the C–H aliphatic groups. The C=C stretching vibrations of the aromatic ring are observed at 1621.4, 1636.3, and 1625.1 cm–1 for NABP, BPZnClKOHAC, and BPZnClAC@ZnBTC, respectively. This band appeared at 1576.6 cm–1 for BPZnClKOHAC@ZnBTC and 1587.8 cm–1 for ZnBTC. The vibrational bands at 1375.4 cm–1 (NABP), 1371 cm–1 (BPZnClAC@ZnBTC), 1394 cm–1 (BPZnClKOHAC@ZnBTC), and 1334.1 cm–1 for ZnBTC corresponds to C–H in-plane deformation of the aromatic ring. The C–O stretching vibrational modes are observed in the region 1319.6–1032.5 cm–1 (NABP), 991.5 cm–1 (BPZnClKOHAC), and 1110.7 cm–1 for BPZnClAC@ZnBTC and BPZnClKOHAC@ZnBTC. The absorption bands at 887–760 cm–1 in all the samples in Figure 3b are due to C–H out-of-plane deformation of the benzene ring, while the C–H bending vibrations are observed in the region 716–678 cm–1. The various assignments are in agreement with similar compounds in the literature.49,65−67
3.3. Powder X-ray Diffraction
The PXRD patterns for the orange peel-derived AC chemically treated with zinc chloride, OPZnClAC, the pristine ZnBTC-MOF, and the composites OPZnClAC@ZnBTC and OPZnClKOHAC@ZnBTC are presented in Figure 4a. The patterns chemically activated banana peel, BPZnClAC and BPZnClKOHAC, and the nanocomposites, BPZnClKOKAC@ZnBTC and BPZnClAC@ZnBTC, are presented in Figure 4b. The PXRD patterns of all the AC materials exhibit peaks at 2θ values of 12.7 and 13.9° corresponding to a d-spacing of 6.94 and 6.32 Å, respectively. These peaks can be attributed to the [Zn2Cl4(H2O)5] diffraction pattern embedded in the carbon matrix.68 Peaks corresponding to the crystalline graphitic form of carbon were observed at 2θ values of 20.9, 22.1, 23.6, 24.3, 25.2, 26.6, and 28.1°. When the banana peel is treated with ZnCl2, followed by KOH modification and extensive washing with distilled water, the pentaaqua-chlorido-trichloridodizinc [Zn2Cl4(H2O)5] complex that existed in the carbon structure was removed. This is evidenced in the powder pattern of BPZnClKOHAC, where the low angle peaks disappeared leaving a peak with a 2θ value of 26.8° and an extra sharp peak at 29.6° having a d-spacing of 3.0 Å, which can be explicitly attributed to carbon. The PXRD pattern of the pristine ZnBTC MOF had peaks at 2θ values of 14.7, 21.3, 24.6 25.6, 27.0, and 28.2° corresponding to the (101), (103̅), (130), (123̅), (200), and (211̅) reflections of the ZnO2(H2O)4 octahedra. The PXRD patterns of OPZnClAC@ZnBTC, OPZnClKOHAC@ZnBTC, BPZnClKOKAC@ZnBTC, and BPZnClAC@ZnBTC were found to have similar reflection peaks along with those corresponding to the crystalline graphitic carbon structure.
Figure 4.
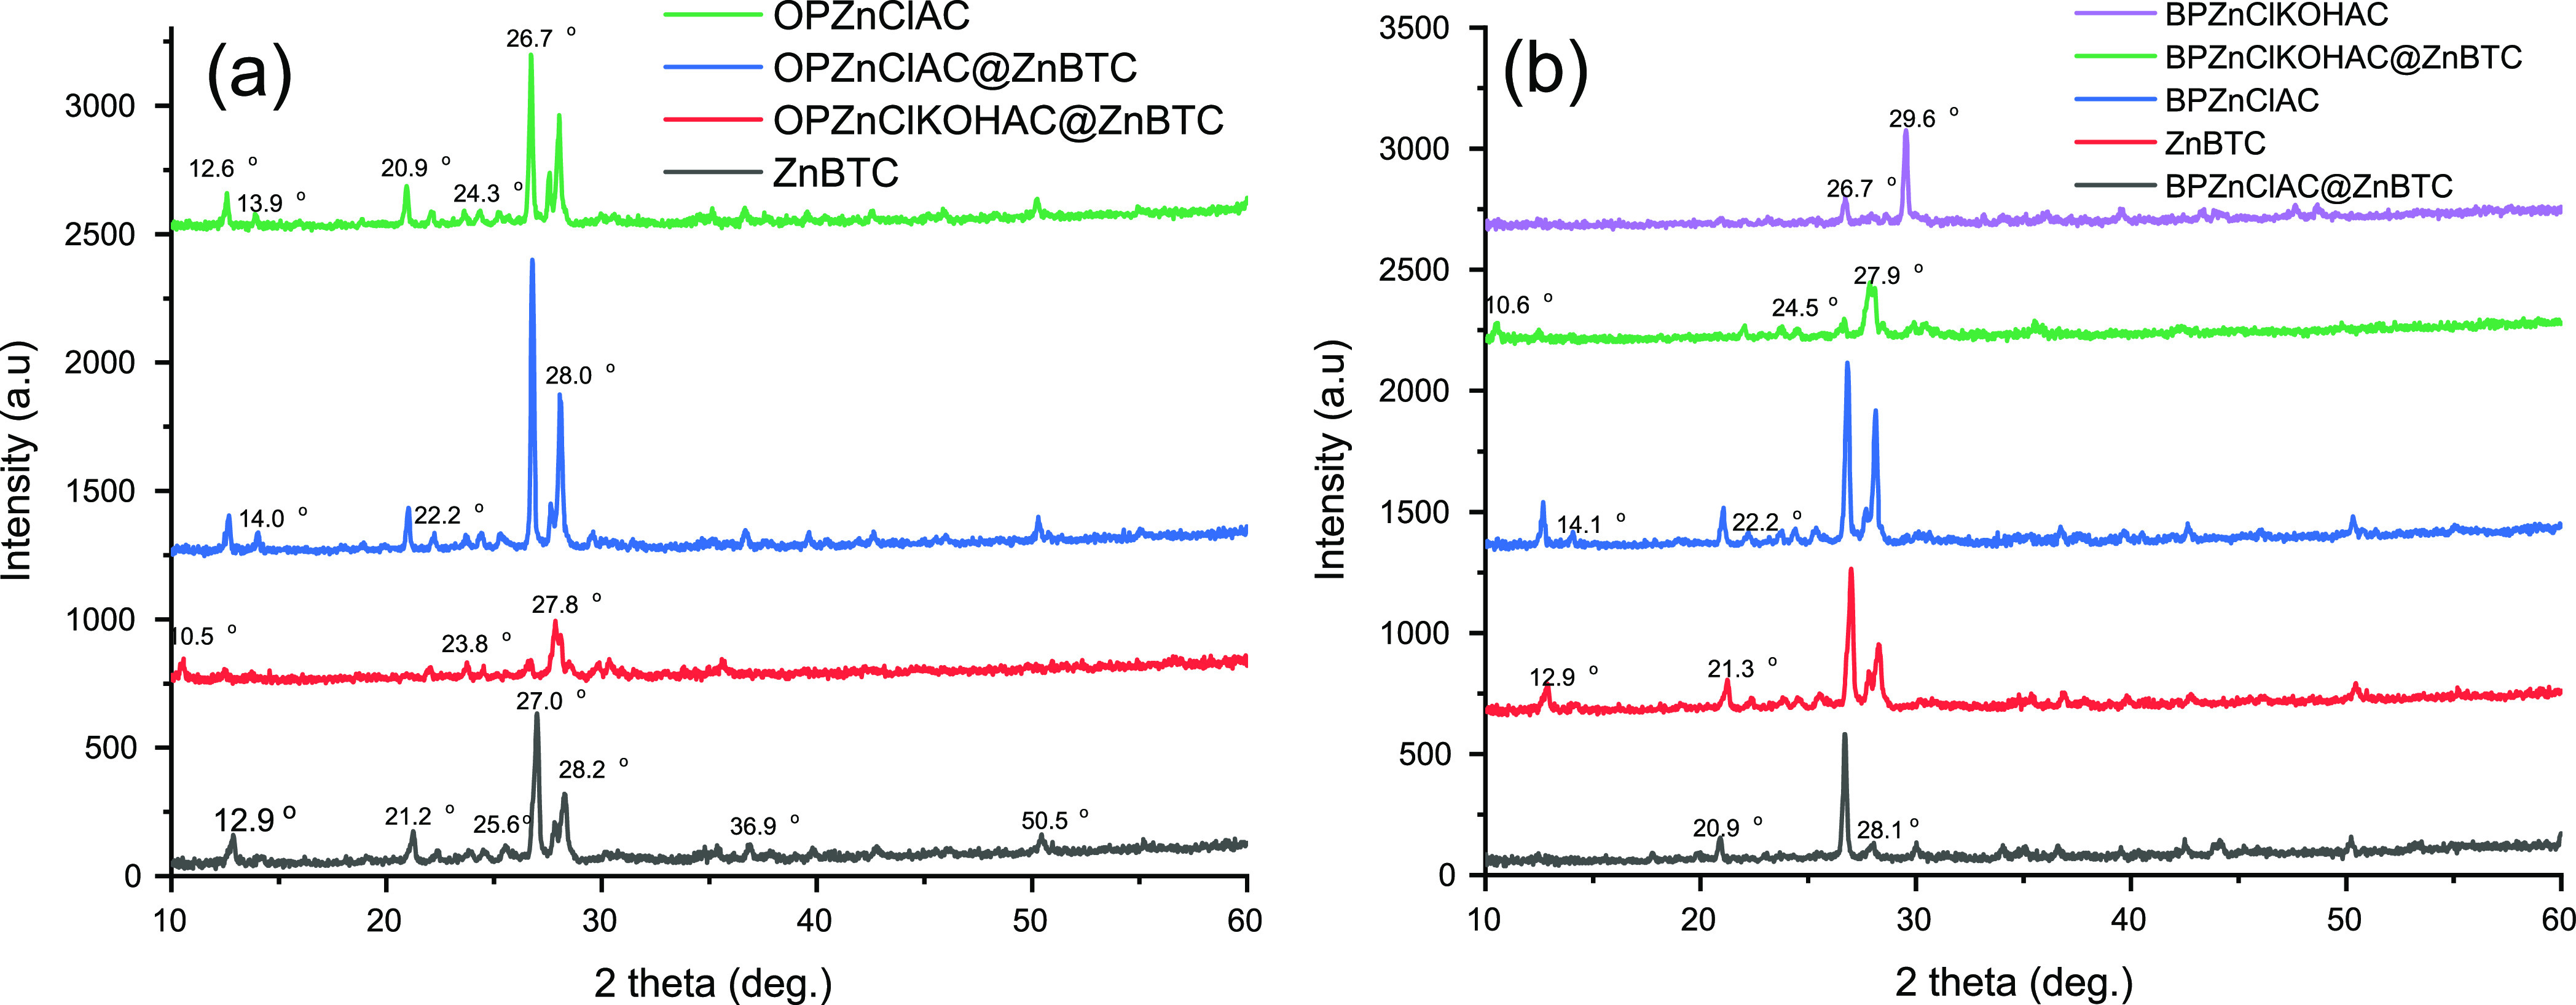
PXRD pattern of the ACs and their ZnBTC nanocomposites: (a) orange peel-derived materials and (b) banana peel-derived materials.
3.4. Porous Structure Characteristics
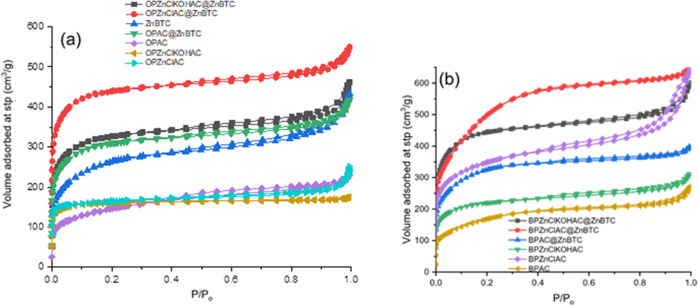
AC was prepared from both banana and orange peels by chemical activation with ZnCl2 and/or KOH, followed by physical activation at 400 °C. Pore characteristics of the AC materials, such as BET surface area, pore volume, size, and pore diameter, were determined and are presented in Table 1. The BET surface area was found to be enhanced by both chemical and physical activation. The orange peel (OPAC)- and banana peel (BPAC)-derived ACs obtained directly via physical activation of the raw agricultural waste biomass were found to have lower SBET when compared with those chemically treated with ZnCl2 or a combination of ZnCl2 and KOH. Table 1 also revealed that ACs from the banana peel and the derived MOF nanocomposites exhibited better porous structure parameters than those obtained from orange peel. Thus, modification of the surface of ZnBTC using AC enhances its textural properties. The N2 adsorption–desorption isotherm of the AC materials and ZnBTC composites are presented in Figure 5. The materials are type II with H4 hysteresis loop according to the IUPAC classification,69 representing unrestricted monolayer–multilayer adsorption. The only exemption is OPZnClKOHAC, the AC, chemically treated with both ZnCl2 and KOH, which exhibit type I adsorption isotherm.
Table 1. Porous Structure Parameters for AC and ZnBTC Composites.
| sample | SBET (m2/g) | SMIC (m2/g) | SMIC/SBET (%) | Vtotal (cm3) | pore diameter (Å) |
|---|---|---|---|---|---|
| OPAC | 510.5 | 162.6 | 31.8 | 0.3509 | 27.5 |
| BPAC | 600.5 | 100.1 | 16.7 | 0.4076 | 27.2 |
| OPZnClKOHAC | 522.3 | 455.8 | 87.2 | 0.2701 | 20.6 |
| BPZnClKOHAC | 733.4 | 585.0 | 49.2 | 0.4723 | 25.8 |
| OPZnClAC | 538.4 | 430.7 | 80.0 | 0.3642 | 27.0 |
| BPZnClAC | 1116.2 | 458.7 | 62.6 | 0.9758 | 32.8 |
| ZnBTC | 908.4 | 357.0 | 39.3 | 0.6538 | 28.7 |
| OPAC@ZnBTC | 1031.7 | 674.4 | 65.4 | 0.6347 | 24.6 |
| BPAC@ZnBTC | 1116.2 | 470.8 | 42.2 | 0.6093 | 21.8 |
| OPZnClKOHAC@ZnBTC | 1085.9 | 728.1 | 67.0 | 0.6971 | 25.6 |
| BPZnClKOHAC@ZnBTC | 1478.2 | 976.9 | 66.1 | 0.911 | 24.6 |
| OPZnClAC@ZnBTC | 1444.8 | 1099.1 | 76.0 | 0.8367 | 23.1 |
| BPZnClAC@ZnBTC | 1800.6 | 193.7 | 10.8 | 0.9924 | 22.0 |
Figure 5.
Adsorption–desorption isotherm for N2 at 77 K for (a) orange peel-derived AC and ZnBTC composites and (b) banana peel-derived AC and the ZnBTC composites.
3.5. Surface Morphology
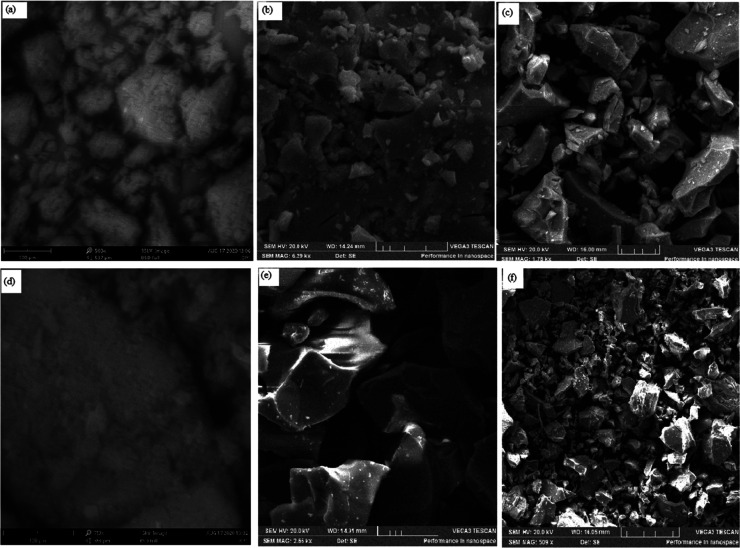
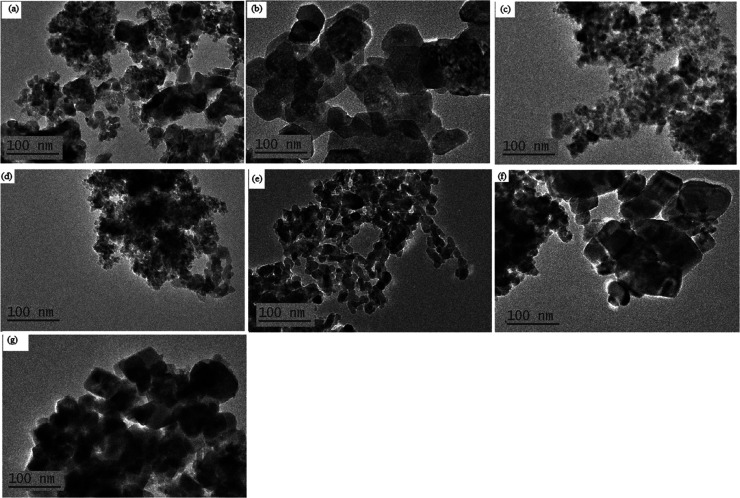
Figure 6 shows the representative scanning electron microscopy (SEM) images of selected samples under investigation. The raw untreated and non-activated peel showed soft cellulose-like surfaces. Activation via chemical treatment resulted in large crumps with irregular shapes, which also reflected in the MOF nanocomposites. The transmission electron microscopy (TEM) micrographs of the selected samples presented in Figure 7 showed a uniform particle size of 100 nm.
Figure 6.
SEM images of representative samples: (a) NAOP, (b) OPACZnCl@ZnBTC, (c) OPACZnClKOH@ZnBTC, (d) NABP, (e) BPACZnCl@ZnBTC, and (f) BPACZnClKOH@ZnBTC. Scale bars—100 (a,d) and 50 μm (b,c,e,f).
Figure 7.
TEM images of representative samples: (a) OPAC, (b)BPAC, (c) ZnBTC, (d) OPACZnCl@ZnBTC, (e) OPACZnClKOH@ZnBTC, (f) BPACZnClKOH@ZnBTC, and (g) BPACZnCl@ZnBTC.
3.6. Thermogravimetric Analyses
Figure 8 gives the TGA curves of the samples under investigations. Generally, agricultural wastes commonly consist of cellulose, hemicellulose, and lignin.49,70−72 The TGA curve of OPAC shows four decomposition peaks corresponding to the removal of moisture, hemicellulose, cellulose, and lignin with a weight loss rate of 0.11 wt %/°C at 82 °C, 0.082 wt %/°C at 257 °C, 0.17 wt %/°C at 436 °C, and 0.063 wt %/°C at 613 °C, respectively. The orange peel that was chemically activated with ZnCl2 and KOH shows some structural alteration due to volatile components’ discharge. The TGA curve for the sample treated with only zinc chloride, OPZnClAC, consists of three decomposition peaks. The moisture peak was observed around 71 °C with a loss of 0.31% and a weight loss rate of 0.19 wt %/°C. As the temperature increased, a small peak was observed around 221 °C with a weight loss rate of 0.17%/°C, corresponding to a loss of about 7.1%, which could be attributed to the decomposition of hemicellulose. In the temperature range of 222–520 °C, a weight loss rate of 5.54 wt %/°C at 328 °C corresponding to a loss of about 42.4% due to lignocellulose decomposition was observed.
Figure 8.
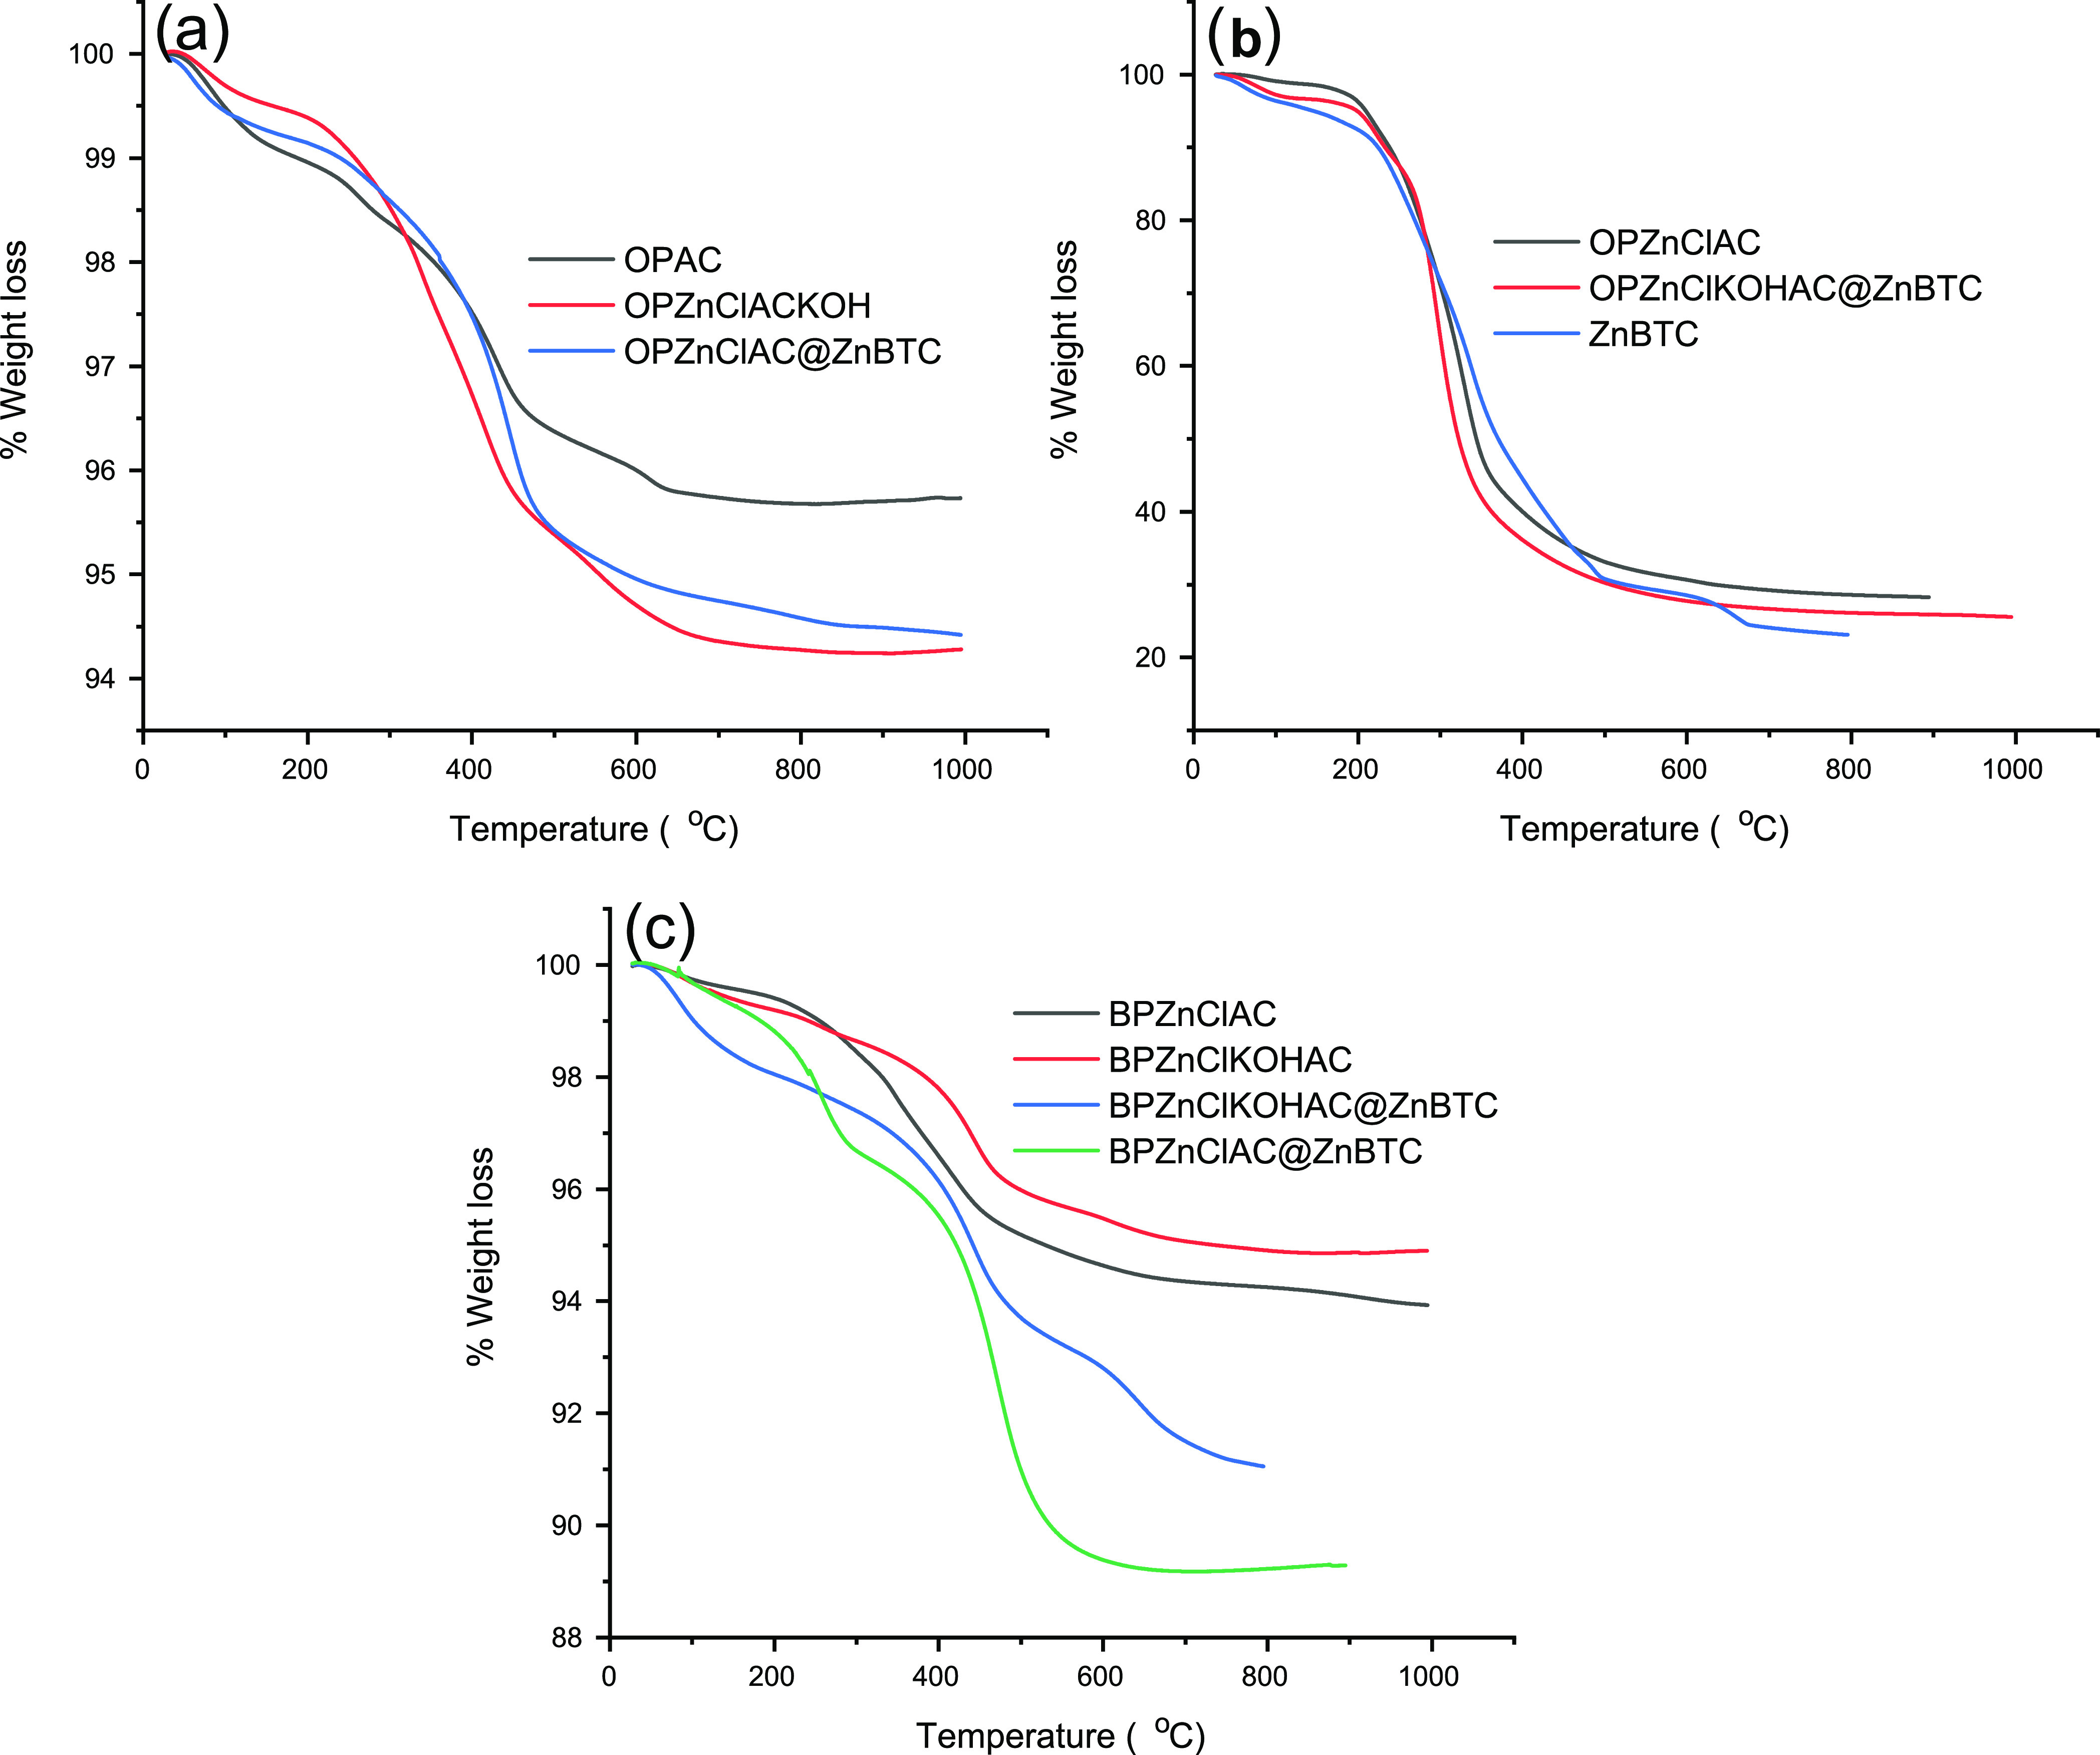
TGA curves: (a) OPAC, OPZnClKOHAC, and OPZnClAC@ZnBTC and (b) OPZnClAC, OPZnClKOHAC@ZnBTC, and ZnBTC. (c) ACs from banana peel and the derived ZnBTC nanocomposites.
The TGA curve of OPZnClKOHAC shows a decomposition pattern in which the hemicellulose peak completely disappears compared with that of OPAC. This could be due to KOH’s use results in the breakage of longer fibers and exfoliation.66 When the orange peel was treated with zinc chloride, followed by KOH and washings to neutral pH, the volatiles and hemicellulose were completely removed. The first decomposition peak in the temperature range of 40–100 °C is due to moisture removal, with a weight loss rate of 0.073 wt %/°C at 76.6 °C. Cellulose removal occurred in two steps in the temperature range of 200–420 °C, while the decomposition of lignin attained a maximum weight loss rate of 0.079 wt %/°C at 547 °C. TGA of ZnBTC indicates a three-step mass loss of about 8.77% over the temperature range 50–220 °C, which correlates with a loss of four coordinated water molecules (calculated 8.71%). The total mass loss of 69.35% in the temperature range of 220–600 °C (calculated 68.27%) corresponds to the release of the remaining coordinated water molecules and two carboxylate ligands in the compound. The weight loss value in the TGA curve of OPZnClKOHAC@ZnBTC is between 9.84 and 69.64%. The loss of about 9.84% in the temperature range of 55–210 °C corresponds to removing moisture and hemicellulose. The weight loss of 58.57% in the region of 210–352 °C is due to decomposition of cellulose and the carboxylate ligands, while the decomposition of lignin occurred in the range of 352–700 °C with a loss of 69.64%. The TGA curve of OPZnClAC@ZnBTC indicates that moisture and other volatiles are lost over the temperature range of 40–100 °C, with a mass loss rate of 0.1 wt %/°C at 60 °C. The decomposition over the temperature range 100–250 °C corresponds to the removal of the coordinated water molecules and hemicellulose with a loss of 9.2%, while the decomposition of the cellulose, carboxylate ligands, and lignin occurred in the temperature range of 250–550 °C, with a mass loss rate of 0.31 wt % at 450 °C. The thermal properties of the AC materials derived from banana peel chemically treated with ZnCl2 and KOH were investigated along with the AC–ZnBTC nanocomposites (Figure 8c). The TGA curves revealed that in all samples, moisture and other volatile components are removed below 100 °C, hemicellulose over the temperature range of 120–300 °C, and ligninocellulose in the range of 300–420 °C. The weight loss over the temperature range of 250–500 °C for the composites corresponds to the decomposition of the BTC ligands, with a maximum weight loss rate of 0.64 wt %/°C at 469 °C for BPZnClAC@ZnBTC and 0.23 wt %/°C at 416 °C for BPZnClKOHAC@ZnBTC. The decomposition pattern is in agreement with similar compounds in the literature.73,74
3.7. Optimized Structure and Electronic Properties of ZnBTC
3.7.1. Frontier Molecular Orbital Analysis
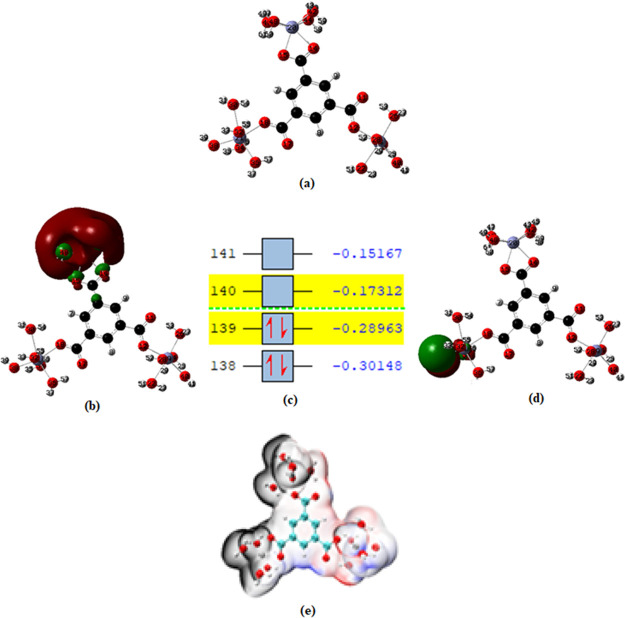
In an attempt to understand the chemical reactivity and stability of ZnBTC, frontier molecular orbital (FMO) analysis was performed on the complex to calculate the difference between the energies of the highest occupied molecular orbital (HOMO) and lowest unoccupied molecular orbital (LUMO). The HOMO and LUMO energies are very crucial in analyzing the chemical reactivity and stability of a compound.75 The difference between the energies of HOMO and LUMO called energy gap is very important as it helps in predicting the reactivity and stability of the compound. A small value of energy gap indicates a greater tendency for such compounds to be more reactive and thus less stable.75,76 The HOMO, LUMO, energy gap, and the global reactivity descriptors of ZnBTC were investigated in both the gas phase and the solvent using the implicit solvation model at the same level of theory as described in the computational details and the results are reported in Table 2 and Figure 9. The results showed the energy gap in the gas phase to be very small, indicating the transition of electrons from HOMO–LUMO to be predominant and therefore less stable in the gas phase. The HOMO and LUMO energies of ZnBTC and their energy gap in the gas phase were −7.1913, −4.8909, and 2.3004 eV, respectively, while the HOMO–LUMO and their difference in solvent medium were found to be −6.932, −1.953, and 4.985 eV, respectively. The smaller energy gap of ZnBTC in gas phase shows that the coordination polymer is more reactive in the gas phase than in solvent medium.
Table 2. Global Reactivity Descriptors.
| media | HOMO/eV | LUMO/eV | μ | η | ω | σ |
|---|---|---|---|---|---|---|
| gas | 7.1913 | 4.8909 | 6.0411 | 1.1502 | 15.8646 | 0.4347 |
| solvent | 6.9382 | 1.9531 | 4.4457 | 2.4926 | 3.9647 | 0.2006 |
Figure 9.
(a) Optimized structure of ZnBTC, (b) HOMO, (c) energy levels (a.u.), (d) LUMO, and (e) electrostatic potential (kcal/mol).
3.7.2. Global Reactivity Descriptors
Quantum chemical methods and molecular modeling techniques enable the definition of a large number of molecular and local quantities characterizing the reactivity, shape, and binding properties of a complete as well as of molecular fragments and substituents. In this work, chemical quantum descriptors such as chemical hardness (η), softness (σ), chemical potential (μ), and electrophilicity index (ω) have been estimated by an approximation method.77 According to the approximation, the ionization potential and the electron affinity are approximately equal to the negative of the HOMO and LUMO energies, respectively, as shown in eqs 1 and 2.
| 1 |
| 2 |
The chemical potential, μ, and the electronegativity, χ, were estimated using eq 3, while the chemical hardness (η), electrophilicity index (ω), and chemical softness (σ) were calculated using eqs 3–6 as reported in the literature.78
| 3 |
| 4 |
| 5 |
| 6 |
The chemical hardness (η) and softness (σ) are very important parameters used in predicting the reactivity and stability of a molecule or a complex. A molecule or a compound with greater stability and lower reactivity is characterized by a higher global hardness value. On the other hand, global softness, which is the reciprocal of global hardness, is indicative of how soft (electron density can easily change) a molecule is. The higher the value of global softness, the more reactive the molecule. The hardness and softness of ZnBTC were calculated in both the gas and solvent medium. The results presented in Table 2 show that ZnBTC is more polarized in the gas phase as compared to the solvent medium. The chemical potential and electrophilicity index of the studied complex in both medium were also estimated. The chemical potential determines the stability of chemical species in solution and their tendency to chemically react to form new substances.79 The values for both the chemical potential and electrophilicity index of the ZnBTC were found to be higher in the gas phase than in solvent.
3.7.3. NBO Analysis
NBO analyses were used to investigate the donor–acceptor interactions in the ZnBTC coordination polymer. Some of the significant donor–acceptor interactions and their stabilization energies E(2) obtained in the gas and solvent phase are presented in Table 3. The results obtained shows that the energies (E(2)) in the gas phase were higher compared to the ones in the solvent. The most significant donor–acceptor interaction for ZnBTC in the gas phase was observed from a σ bond (σC5–H9) to an anti-bonding orbital (π*C10–O11) with the highest perturbation energy of 316.26 kcal/mol, followed by the transition from lone pair (nPO17) to a σ anti-bonding (σ*C3–C4) with an energy of 247.73 kcal/mol. The least intra-molecular interaction within the ZnBTC complex was obtained from a π-bonding (πC1–C2 → n*C3) with a perturbation energy of 57.02 kcal/mol, indicating that the interaction of σC5–H9 → π*C10–C11 was more than πC1–C2 → n*C3. Consequently, the selected higher interaction energies and their donor–acceptor orbital of ZnBTC in the solvent phase was studied and the most interesting intramolecular donor–acceptor interaction was observed from nPO17 → σ*C10–C11 with 208.49 kcal/mol and its lowest energy observed from nPO17 → σC5–C6 with 36.91 kcal/mol as stabilization energy. From the analysis of the energy of interaction (E(2)), the ZnBTC coordination polymer is more stable in the solvent than in the gas phase. The stability of the complex in the solvent is also related to the dielectric constant/permittivity of the solvent. The greater the permittivity of the solvent, the larger the value of the solvation energy of the ions produced in that solvent. A larger value of solvation energy will result in a greater stabilization of the ions in the solvent.80 The intramolecular charge transfers of the NBO prescription include the motion of electron density in all orbitals, and as such, the transition of electrons from a σ bonding carbon (σC–H) to an anti-bonding of carbon (π*C–O) is more polarized as compared to the other intra donor–acceptor interactions. This higher polarization in gas from the NBO analysis was also correlated with the FMO, which is the HOMO–LUMO energy. The calculated values of NBO were estimated using eq 7
| 7 |
where qi is the donor orbital occupancy, E(i) and E(j) are the diagonal elements, and F(i, j) is the Fock matrix element. The larger stabilization energy E(2) indicates the extent of donor–acceptor NBOs along with the degree of structural perturbation.81
Table 3.
| donor | acceptor | E(2) | E(j) – E(i) | F(i, j) |
|---|---|---|---|---|
| (a) NBO Analysis in the Gas Phase | ||||
| nPO17 | π*C10–O11 | 1512.64 | 0.16 | 0.461 |
| nPO17 | σ*C3–C4 | 247.73 | 0.84 | 0.419 |
| nPO15 | n*C13 | 139.03 | 0.16 | 0.151 |
| nPO14 | n*C13 | 145.38 | 0.16 | 0.154 |
| n*C13 | nC6 | 653.01 | 0.02 | 0.117 |
| σC5–H9 | π*C10–O11 | 316.26 | 0.03 | 0.097 |
| σC1–H7 | π*C10–O11 | 185.00 | 0.04 | 0.079 |
| πC1–C2 | n*C3 | 57.02 | 0.15 | 0.094 |
| n*C3 | π*C4–C5 | 78.29 | 0.12 | 0.114 |
| n*C3 | π*C1–C2 | 64.96 | 0.13 | 0.108 |
| (b) NBO Analysis in the Solvent Phase | ||||
| πC16–O17 | π*C2–C3 | 106.38 | 0.02 | 0.069 |
| nPO17 | σ*C10–O11 | 208.49 | 0.73 | 0.358 |
| nPO15 | n*C13 | 150.46 | 0.15 | 0.152 |
| nPO14 | n*C13 | 155.15 | 0.15 | 0.154 |
| nPO12 | n*C10 | 147.76 | 0.16 | 0.154 |
| nPO11 | n*C10 | 183.35 | 0.15 | 0.161 |
| πC1–C6 | n*C13 | 53.21 | 0.13 | 0.082 |
| πC4–C5 | n*C10 | 40.25 | 0.14 | 0.074 |
| n*C13 | π*C1–C6 | 31.77 | 0.15 | 0.083 |
| nPO17 | σ*C2–C16 | 73.25 | 0.71 | 0.206 |
| nPO17 | σ*C5–C6 | 36.91 | 1.05 | 0.181 |
3.7.4. Optoelectronic Properties
The electronic transition in ZnBTC was estimated in the gas and solvent phases using the TD-DFT/B3LYP excited state electronic method and the results are presented in Table 4. The wavelength (λ), oscillator strengths (f), major contribution (MC), and energies (E) for excitation are listed in Table 4. The vertical excitation observed from the complex in the gas phase was seen to have the major contribution from 135 → 141 (45.66 eV) orbitals, λmax 262.6 nm, energy of 4.721 eV, and an oscillator strength of 0.017 eV, while the Frank–Condon excitation in the solvent phase was observed to have major contribution from an orbital transition of 137 → 140 (30.809 eV), λmax 254.95 nm, energy of 4.863 eV, and an oscillator strength of 0.0045 eV. It can be inferred from the result that the theoretical excitation wavelength of the ZnBTC complex is higher in gas than in solvent. The transition obtained corresponds to a π → π* transition. The formation of charge transfer in the complex is caused by the presence of delocalized electrons. The results obtained showed that the electron transition from the HOMO–LUMO energy levels is predominantly found within the UV region of the spectrum.
Table 4.
| excitation type | energy (eV) | λ (nm) | f | major contribution |
|---|---|---|---|---|
| (a) Excitation Energies and Oscillator Strengths of ZnBTC in the Gas Phase | ||||
| So → S1 | 4.7213 | 262.6 | 0.0173 | 135 → 141 (45.67%) |
| 143 → 141 (6.35%) | ||||
| 132 → 144 (4.30%) | ||||
| So → S2 | 5.0831 | 243.91 | 0.0066 | 139 → 140 (85.48%) |
| 139 → 145 (5.71%) | ||||
| 139 → 146 (4.30%) | ||||
| So → S3 | 5.1519 | 240.66 | 0.0274 | 133 → 141 (14.48%) |
| 135 → 144 (13.04%) | ||||
| 132 → 149 (2.66%) | ||||
| So → S4 | 5.1849 | 239.12 | 0.0731 | 132 → 144 (2.77%) |
| 133 → 141 (12.67%) | ||||
| 133 → 144 (6.20%) | ||||
| So → S5 | 5.1932 | 238.75 | 0.1169 | 134 → 144 (27.71%) |
| 133 → 141 (24.25%) | ||||
| 132 → 143 (3.44%) | ||||
| (b) Excitation Energies and Oscillator Strengths of ZnBTC in the Solvent | ||||
| So → S1 | 4.8631 | 254.95 | 0.0045 | 137 → 140 (30.81%) |
| 138 → 141 (20.58%) | ||||
| 137 → 141 (17.32%) | ||||
| So → S2 | 131 → 140 (60.36%) | |||
| 130 → 140 (13.33%) | ||||
| 131 → 152 (5.72%) | ||||
| So → S3 | 137 → 140 (30.31%) | |||
| 138 → 140 (11.94%) | ||||
| 138 → 141 (12.12%) | ||||
| So → S4 | 134 → 141 (36.88%) | |||
| 133 → 141 (12.25%) | ||||
| 133 → 140 (5.29%) | ||||
| So → S5 | 132 → 141 (19.93%) | |||
| 133 → 141 (16.84%) | ||||
| 134 → 140 (9.26%) | ||||
3.7.5. Topological Analysis Using QTAIM
To understand the nature of interaction between the donor-ligand atoms and the metal ion in the ZnBTC complex, the following characteristic properties at their bond critical point (BCP), electron density [ρ(r)], its Laplacian [∇2ρ(r)], electron potential [V(r)], kinetic energy [G(r)], and the total Hamiltonian energy [H(r)], were investigated using Bader’s QTAIM analysis with Multiwfn software version 3.782 and the results are reported in Table 5. The highest values of electron density ρ(r) in the interaction between the BTC ligand and the Zn metal for Zn21–O36, at 66 BCP, Zn19–O15, at 74 BCP, Zn19–O12 at 102 BCP, Zn19–O26 at 107 BCP, Zn20–O15 at 122, and Zn20–O14 at 125 were found to be 0.0859, 0.051, 0.0559, 0.0512, 0.0589, and 0.0547 for ZnBTC in the gas phase and 0.051, 0.051, and 0.058 at the BCP of 91, 123, and 75 in the solvent phase, respectively. It was observed from the results that the inclusion of solvent effect decreases the density of electron at the respective BCP. The electron density is found to vary from the gas and solvent in the range of 0.035 a.u. On observing both the gas and solvent phase, it was inferred that the ZnBTC complex shows a coordination bond with slight variation in their electron density at BCP and the variation is said to be 0.035. The negative values of Hamiltonian energy H(r) indicate that the interaction was not highly electrostatic. It is also worthy to note that the inclusion of solvent effect decreases the electron density at the BCP of the coordination bonds. From the results, it was also observed that the Zn21–O36 bond possesses higher electron density than the other bonds, which shows that the charge-transfer interaction between the electronegative oxygen atoms of ZnBTC in the gas phase is stronger than the interaction between the oxygen and the metal atom in the aquo medium. It is expected that the stronger bonds are associated with higher electron density.
Table 5.
| bond | BCP | ρ(r) | ∇2ρ(r) | G(r) | K(r) | V(r) | H(r) |
|---|---|---|---|---|---|---|---|
| (a) QTAIM Topological Analysis in Gas | |||||||
| Zn21–O36 | 66 | 0.0859 | 0.5476 | 0.1129 | 0.0740 | –0.1204 | –0.0740 |
| Zn21–O18 | 74 | 0.0510 | 0.2371 | 0.5522 | 0.0724 | –0.6250 | –0.0724 |
| Zn19–O12 | 102 | 0.0559 | 0.2818 | 0.6316 | 0.6316 | –0.6976 | –0.0659 |
| Zn19–O26 | 107 | 0.0512 | 0.2426 | 0.5643 | 0.0709 | –0.0635 | –0.0709 |
| Zn20–O15 | 122 | 0.0589 | 0.2745 | 0.6392 | 0.0923 | –0.7316 | –0.0923 |
| Zn20–O14 | 125 | 0.05465 | 0.2402 | 0.5768 | 0.0931 | –0.6690 | –0.0931 |
| (b) QTAIM Topological Analysis in Solvent | |||||||
| Zn21–O36 | 131 | 0.05086 | 0.2415 | 0.563 | 0.0713 | –0.6345 | –0.0713 |
| Zn21–O18 | 123 | 0.05111 | 0.2374 | 0.552 | 0.0723 | –0.6246 | –0.0723 |
| Zn19–O12 | 100 | 0.02812 | 0.2834 | 0.635 | 0.0849 | –0.7011 | –0.0663 |
| Zn19–O26 | 91 | 0.05120 | 0.2432 | 0.566 | 0.0711 | –0.6367 | –0.0711 |
| Zn20–O15 | 75 | 0.05761 | 0.2769 | 0.64 | 0.0864 | –0.7246 | –0.0849 |
| Zn20–O14 | 70 | 0.05350 | 0.2433 | 0.579 | 0.0849 | –0.665 | 0.0864 |
3.8. Photocatalytic Properties
The following samples, OPAC, OPAC@ZnBTC, ZnBTC, OPZnClKOHAC@ZnBTC, OPZnClAC@ZnBTC, BPAC, BPAC@ZnBTC, BPZnClAC@ZnBTC, and BPZnClKOHAC@ZnBTC, were selected for the photocatalytic activity test in the photodegradation of MO solution at λ = 460 nm. Figure 10 shows that the absorbance of MO decreases exponentially with time. The reaction followed pseudo-first-order kinetics, and the apparent rate constants presented in Table 6 showed that the materials derived from the banana peel are better photocatalysts compared with those obtained from orange peel.
Figure 10.
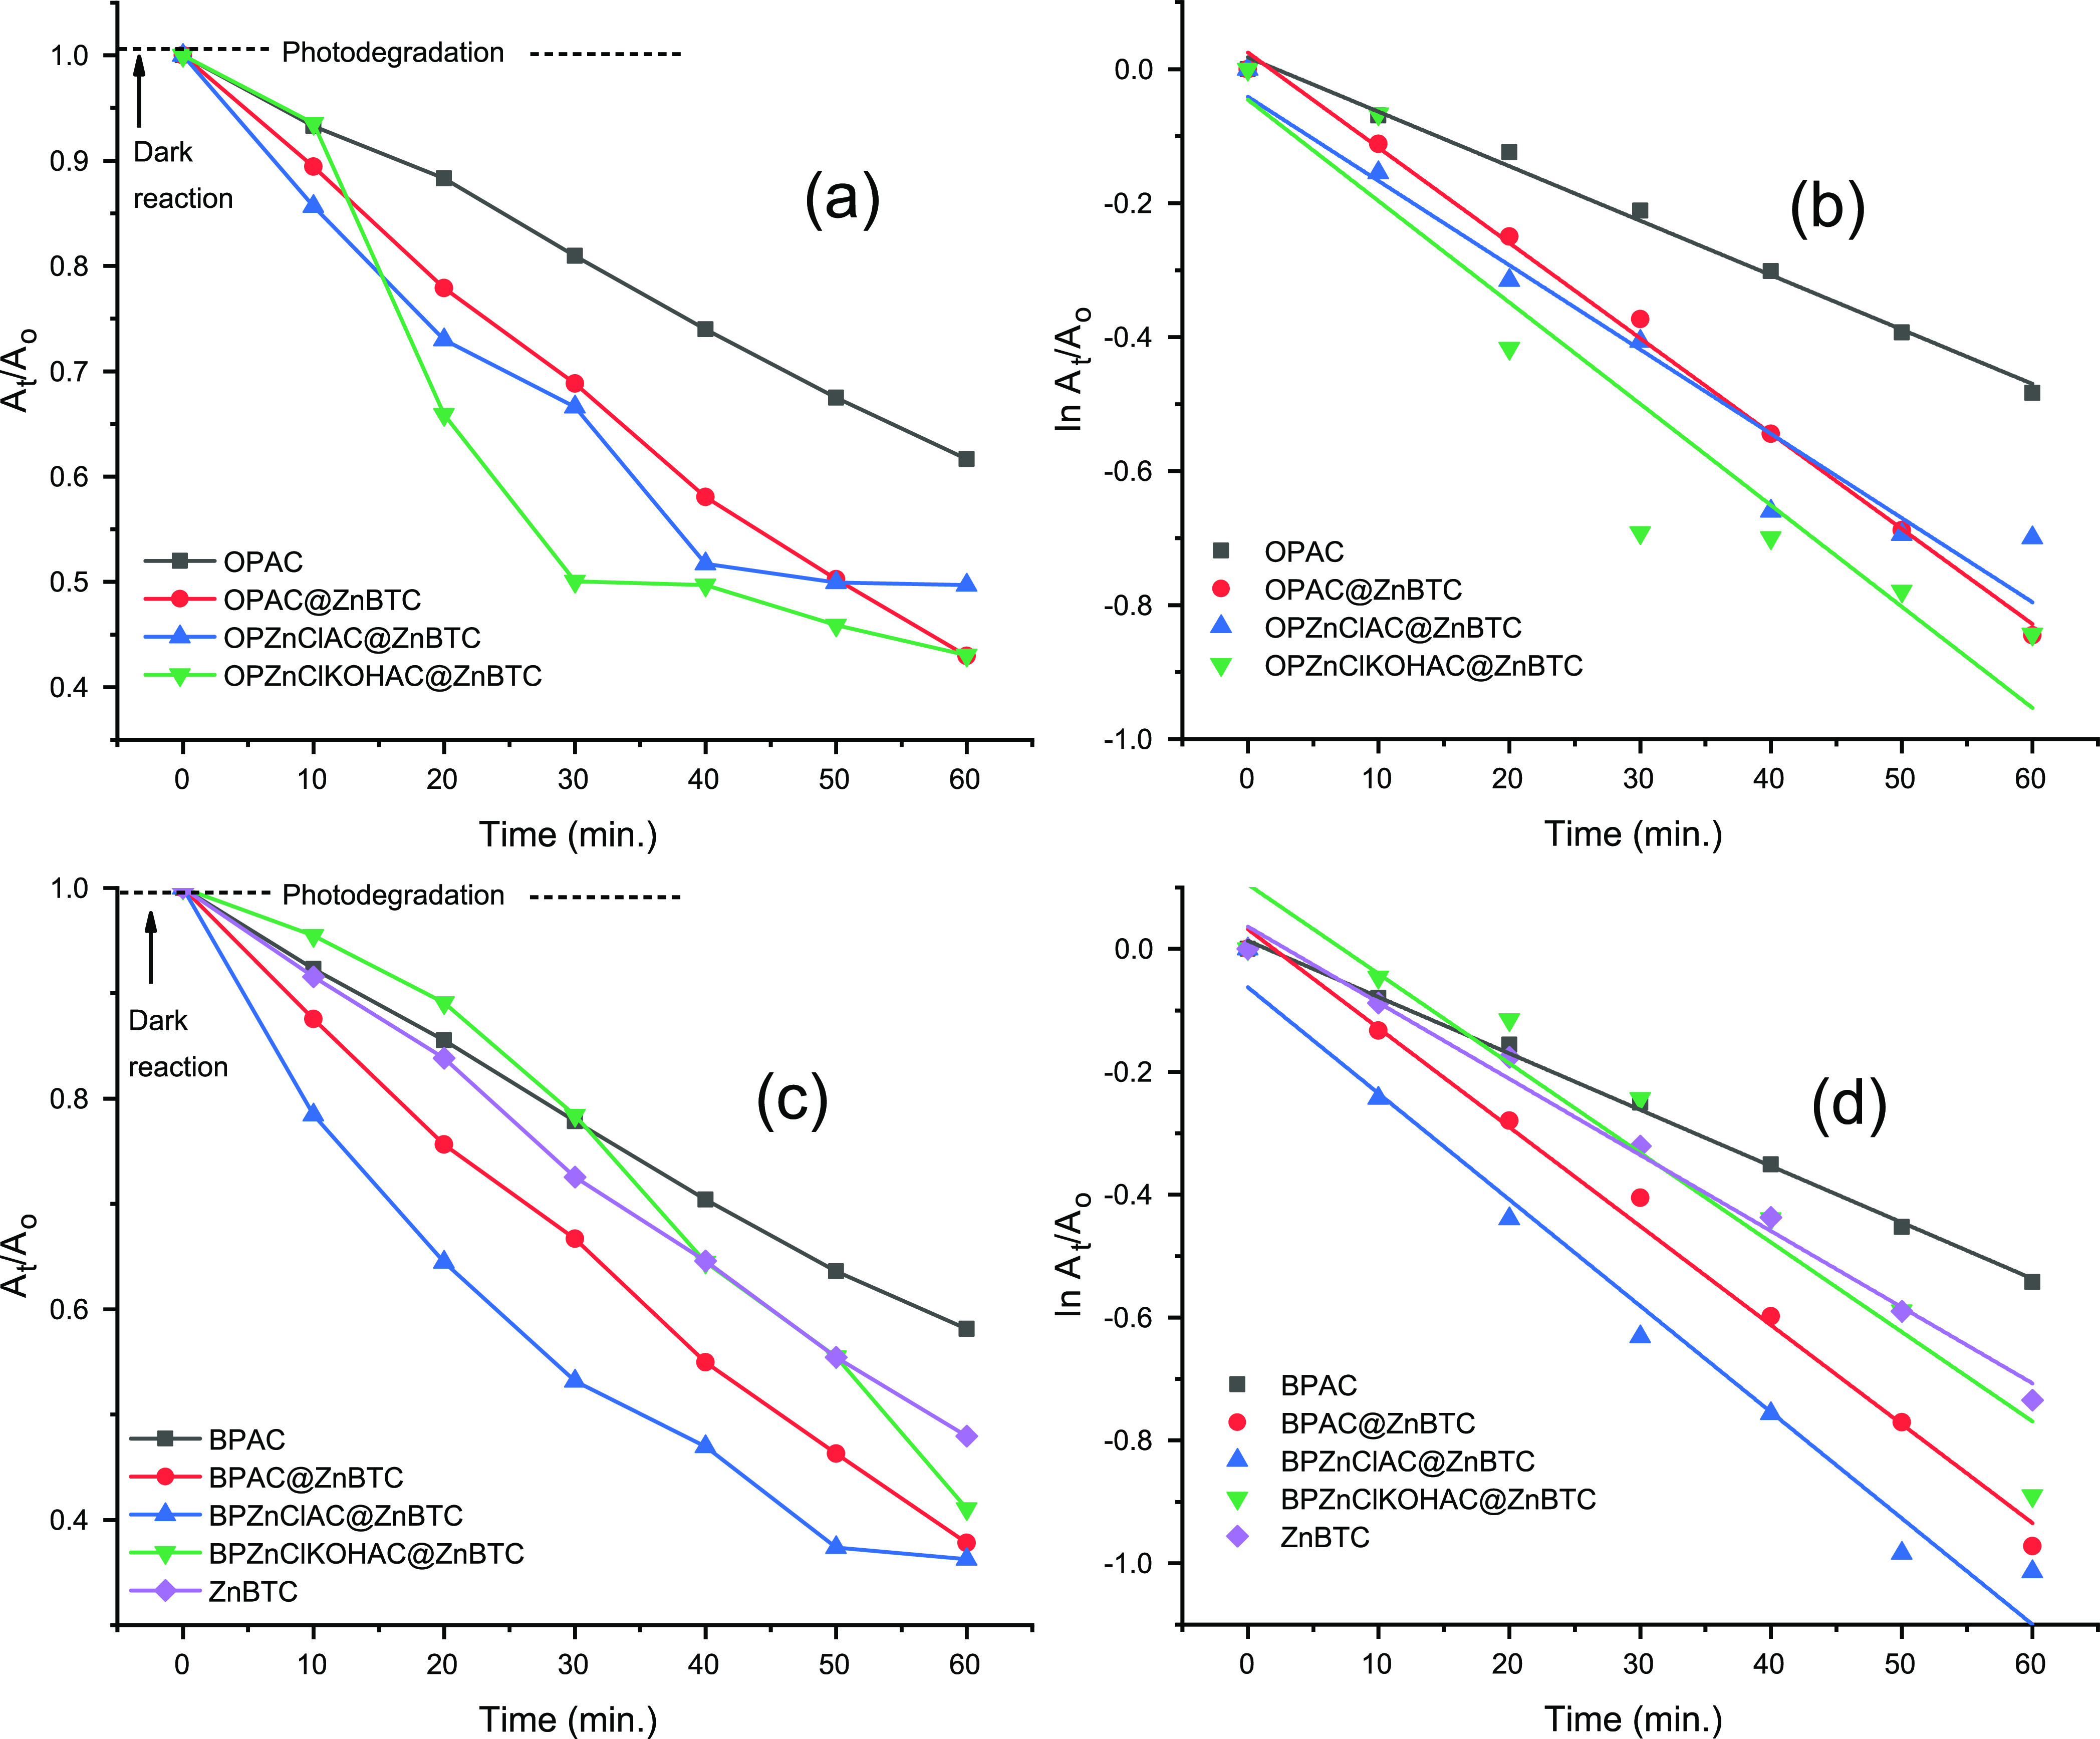
Photocatalytic degradation of MO by agro-waste-derived ACs. (a,c) Plots of At/Ao against time at λ = 460 nm and (b,d) ln(At/Ao) vs time.
Table 6. Pseudo-First-Order Kinetics for the Photodegradation of MO.
| pseudo-first-order k1 (min–1) | R2 | adj R2 | residual sum of squares (RSS) | |
|---|---|---|---|---|
| OPAC | 0.00813 | 0.99331 | 0.99197 | 1.25 × 10⁻³ |
| OPAC@ZnBTC | 0.01422 | 0.99678 | 0.99614 | 1.83 × 10⁻³ |
| ZnBTC | 0.01239 | 0.99059 | 0.98872 | 4.09 × 10⁻³ |
| OPZnClAC@ZnBTC | 0.01513 | 0.95936 | 0.97753 | 2.592 × 10⁻² |
| OPZnClKOHAC@ZnBTC | 0.01257 | 0.98128 | 0.95124 | 2.576 × 10⁻² |
| BPAC | 0.00917 | 0.99749 | 0.99698 | 5.939 × 10⁻⁴ |
| BPAC@ZnBTC | 0.01612 | 0.99331 | 0.99196 | 4.9 × 10⁻³ |
| BPZnClAC@ZnBTC | 0.01729 | 0.97888 | 0.97465 | 1.806 × 10⁻² |
| BPZnClKOHAC@ZnBTC | 0.01666 | 0.93518 | 0.92221 | 2.054 × 10⁻² |
The degradation efficiencies for materials derived from orange peel, OPAC, OPZnClKOHAC@ZnBTC, OPAC@ZnBTC, and OPZnClAC@ZnBTC, after 60 min of irradiation were found to be 38, 64, 67, and 68%, respectively. The banana peel-derived materials, BPAC, BPZnClKOHAC@ZnBTC, BPAC@ZnBTC and BPZnClAC@ZnBTC, were found to have photodegradation efficiencies of 42, 60, 72, and 79%, respectively. The percentage photodegradation by the pristine ZnBTC was found to be 52%. The modification of the surface of the pristine Zn(II) coordination polymer by the agricultural waste biomass enhances its degradation efficiency to a reasonable extent. The relative percentage degradation of MO by the selected samples could be explained based on their specific surface area, SBET, and the optical band gap, Eg. From Table 1, SBET for banana peel-derived materials followed the order BPAC < ZnBTC < BPAC@ZnBTC < BPZnClKOHAC@ZnBTC < BPZnClAC@ZnBTC, while SBET for materials obtained from orange peel followed the order OPAC < OPAC@ZnBTC < OPZnClKOHAC@ZnBTC < OPZnClAC@ZnBTC. Thus, the larger the surface area, the greater the chemical activity. The values of Eg estimated by the Tauc plot method (Figure 11) for pristine ZnBTC, OPZnClKOHAC@ZnBTC, and OPZnClAC@ZnBTC were 2.81, 2.48, and 2.45 eV, respectively. For the photocatalysts derived from the banana peel, the estimated band gaps were 2.50, 2.47, and 2.44 eV, respectively, for BPAC, BPZnClKOHAC@ZnBTC, and BPZnClAC@ZnBTC. The results showed that the smaller the band gap, the greater the photocatalytic activity.
Figure 11.
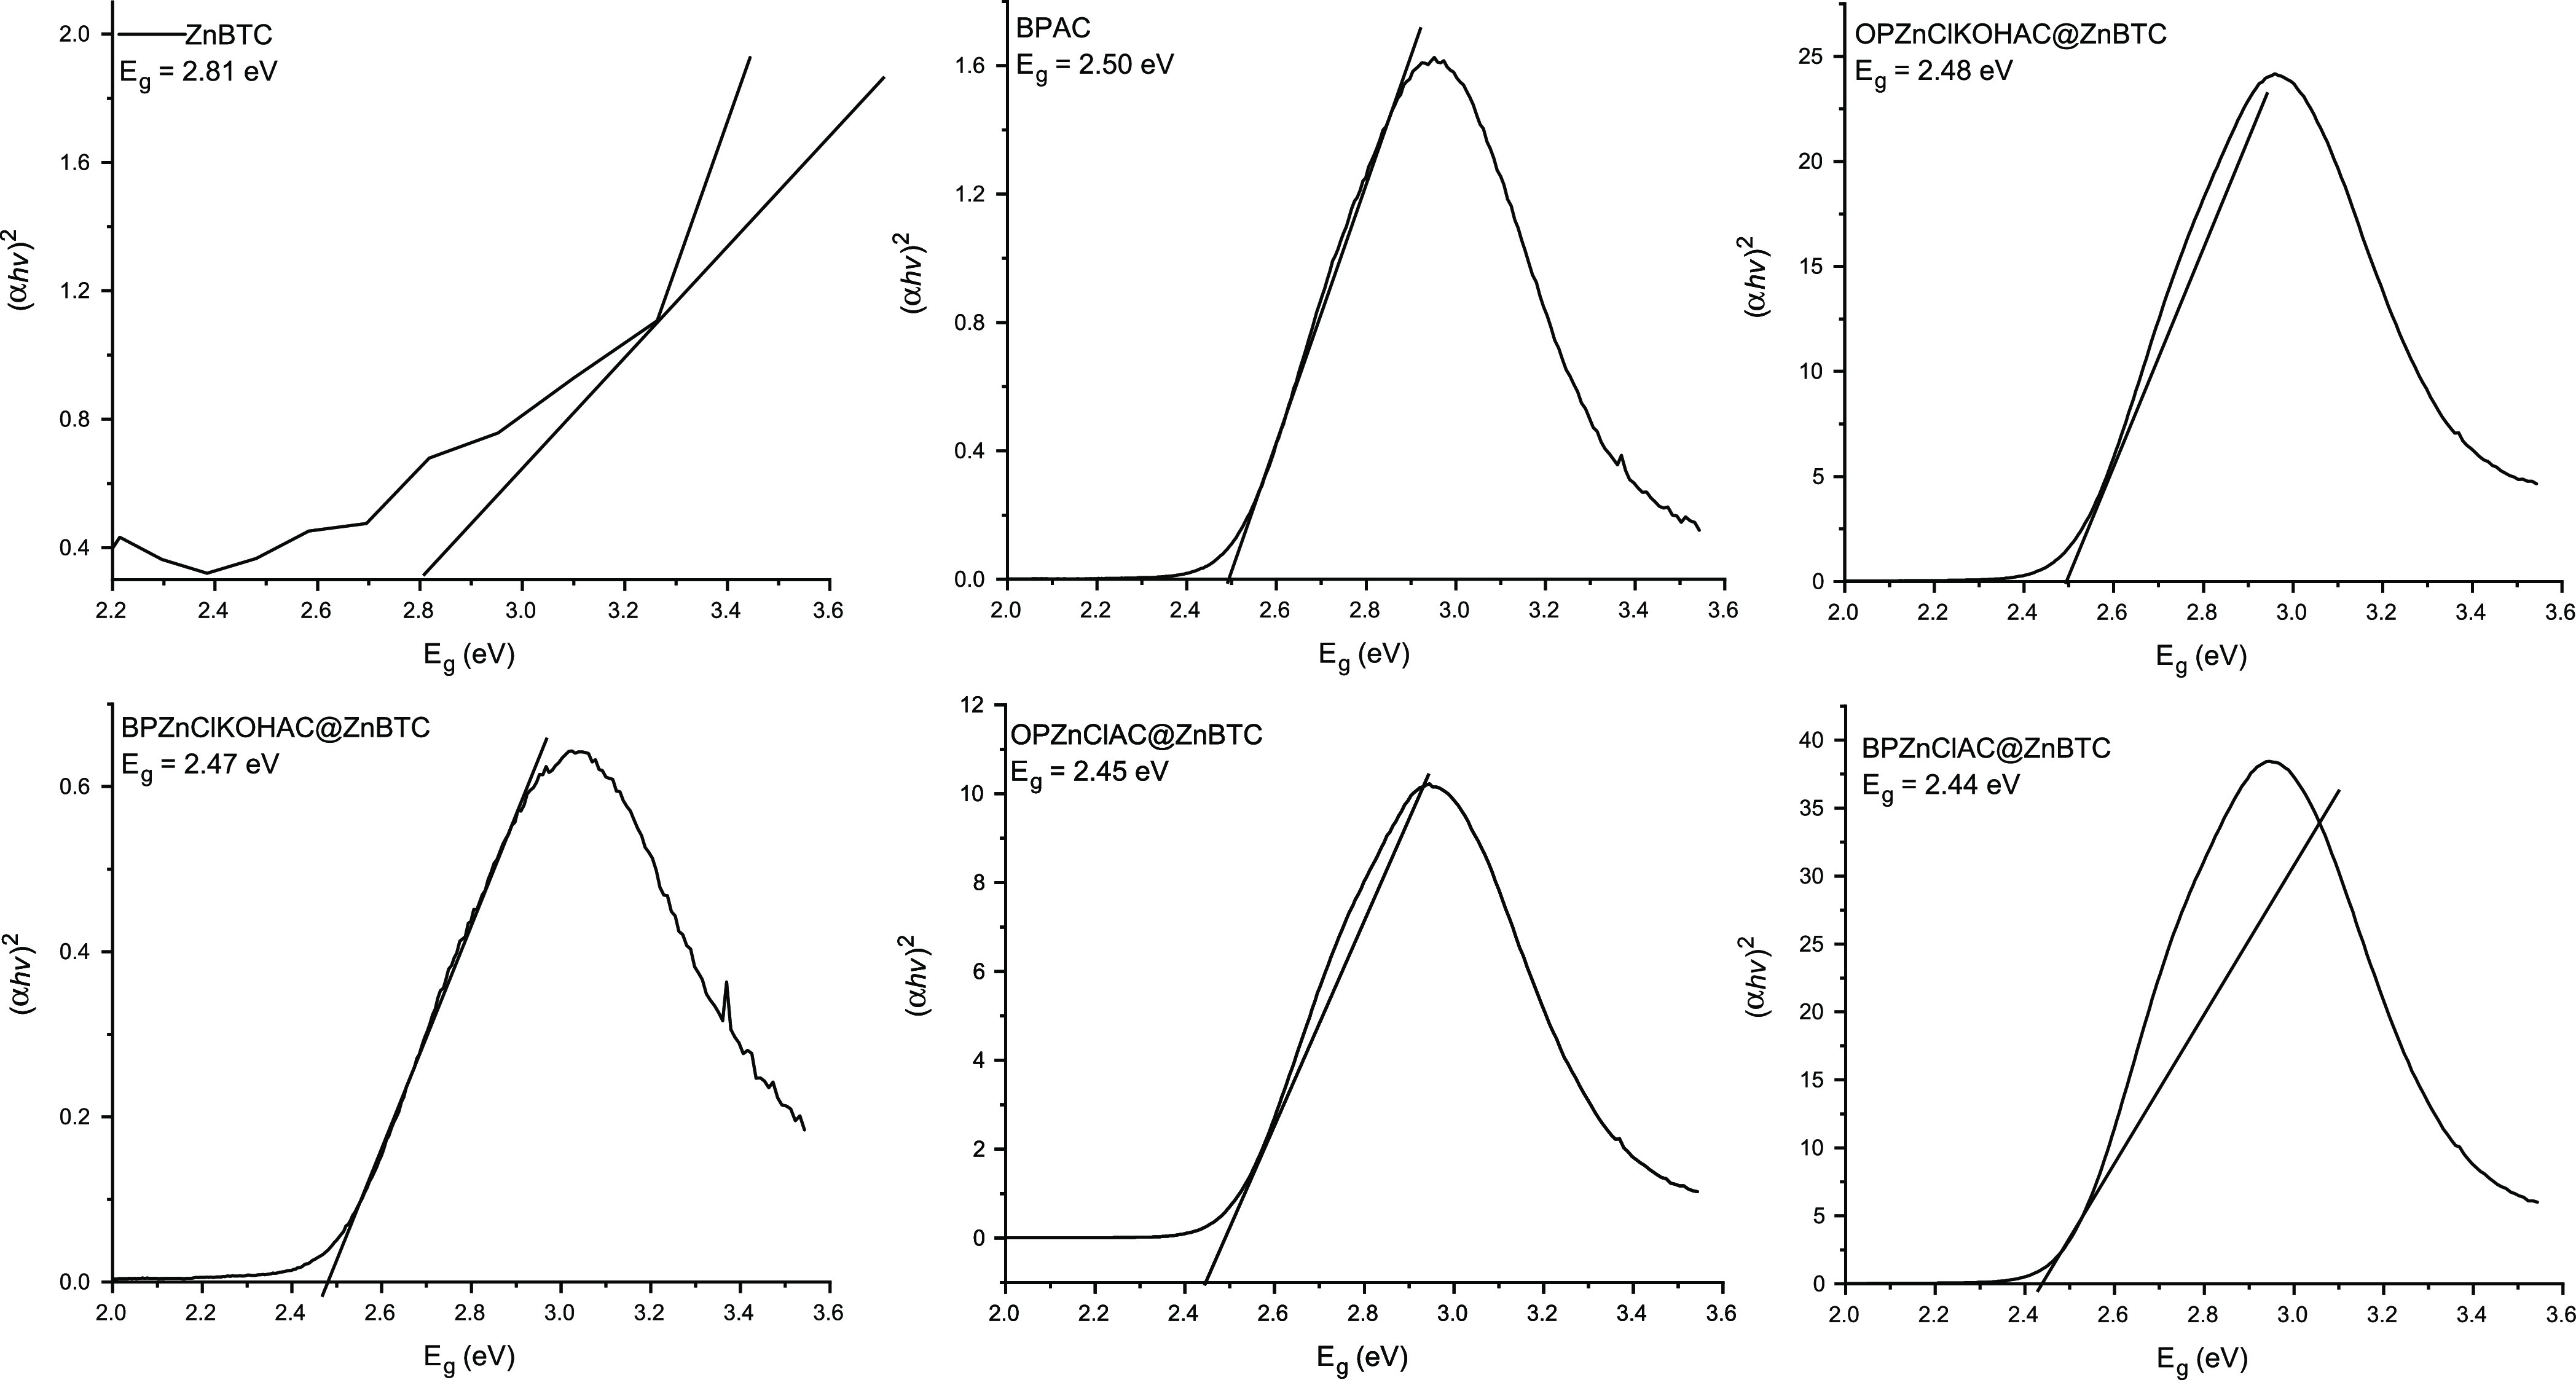
Tauc plots for the estimation of band gap for some selected samples.
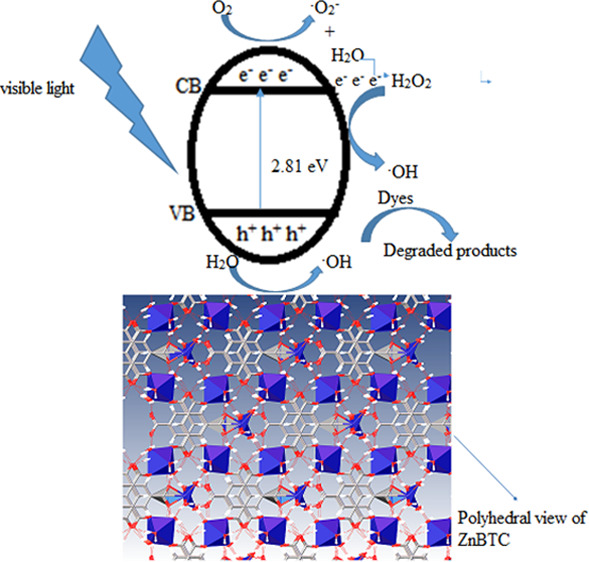
According to the mechanism proposed in the literature,83,84 when the catalysts absorbed light in the visible region of the electromagnetic spectrum, corresponding to energy equals to or greater than the optical band gap, excitation of electrons from the valence to the conduction band creates a hole in the valence band. The electron–hole (eCB––hVB+) pairs migrate to the catalysts’ surface, where electron combines with oxygen to generate the •O2 radical, while the hole combines with H2O to form •OH. Furthermore, the oxygen radical combines with H2O to give H2O2, reacting with the photogenerated electrons to form •OH. The combination of MO with •OH results in a degradation process (Figure 12).
Figure 12.
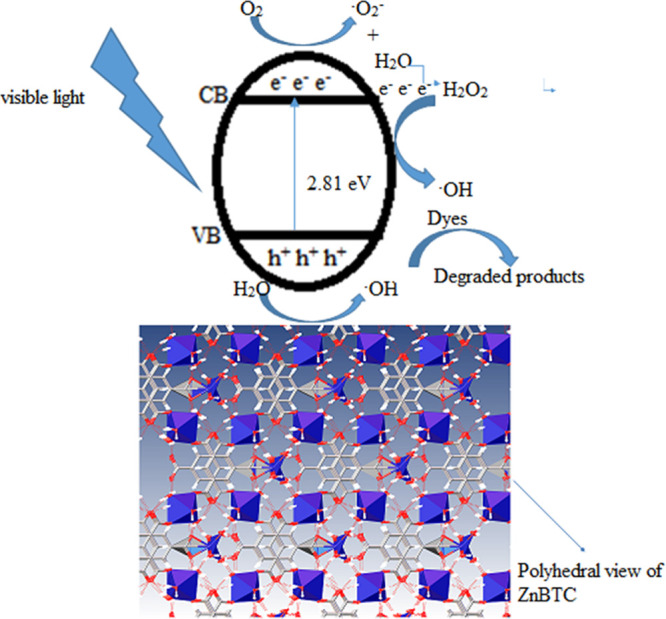
Proposed mechanism for the photodegradation process.
4. Conclusions
A Zn(II) coordination polymer [Zn3(BTC)2(H2O)12]n (ZnBTC) based on 1,3,5-benzene tricarboxylic acid was synthesized under hydro/solvothermal conditions. First-principles electronic structure investigation of ZnBTC using the DFT computational method revealed the coordination polymer to very stable but less reactive in aqueous medium. The intramolecular charge transfers of the NBO prescription include the motion of electron density in all orbitals and the transition of electrons from a σ bonding σC–H to an antibonding π*C–O is more polarized as compared to the other intradonor–acceptor interactions. Owing to the lower reactivity of ZnBTC in solvent medium, its use as a photocatalyst in the degradation of MO dye only yielded 52% efficiency. To enhance the photocatalytic activity, AC derived from agricultural waste biomass was used to modify the surface of ZnBTC to obtain nanocomposites. The FT-IR analyses revealed surface functionalization of ZnBTC, which results in an increased specific surface area, SBET for the nanocomposites. The nanocomposites displayed efficient photocatalytic properties in the degradation of MO under UV light irradiation, without any additive such as H2O2, with the percentage degradation increasing with the value of the specific surface area of the materials.
Acknowledgments
This work was supported by The Academy of Science for the Developing Nations (TWAS) [grant numbers: 12-169 RG/CHE/AF/AC-G-UNESCO FR: 3240271320] for which grateful acknowledgement is made. A.A.A. is also grateful to the Royal Society of Chemistry for the personal research grant.
Supporting Information Available
The Supporting Information is available free of charge at https://pubs.acs.org/doi/10.1021/acsomega.1c04037.
CCDC 2053471 contains crystallographic data for the structural analysis of ZnBTC and can be obtained free from the Cambridge Crystallographic Data Centre (PDF)
The authors declare no competing financial interest.
Supplementary Material
References
- Jamshidi M.; Ghaedi M.; Dashtian K.; Ghaedi A. M.; Hajati S.; Goudarzi A.; Alipanahpour E. Highly efficient simultaneous ultrasonic-assisted adsorption of brilliant green and eosin B onto ZnS nanoparticles loaded activated carbon: Artificial neural network modelling and central composite design optimization. Spectrochim. Acta, Part A 2016, 153, 257–267. 10.1016/j.saa.2015.08.024. [DOI] [PubMed] [Google Scholar]
- Jamshidi M.; Ghaedi M.; Dashtian K.; Hajati S.; Bazrafshan A. Ultrasound-assisted removal of Al3+ ions and Alizarin red S by activated carbon engrafted with Ag nanoparticles: central composite design and genetic algorithm optimization. RSC Adv. 2015, 5, 59522–59532. 10.1039/c5ra10981g. [DOI] [Google Scholar]
- Gupta V. K.; Mittal A.; Gajbe V.; Mittal J. Removal and Recovery of the Hazardous Azo Dye Acid Orange 7 through Adsorption over Waste Materials: Bottom Ash and De-Oiled Soya. Ind. Eng. Chem. Res. 2006, 45, 1446–1453. 10.1021/ie051111f. [DOI] [Google Scholar]
- Khan N. A.; Hasan Z.; Jhung S. H. Adsorptive removal of hazardous materials using metal-organic frameworks (MOFs): A review. J. Hazard. Mater. 2013, 244–245, 444–456. 10.1016/j.jhazmat.2012.11.011. [DOI] [PubMed] [Google Scholar]
- Hasan Z.; Jhung S. H. Removal of hazardous organics from water using metal-organic frameworks (MOFs): Plausible mechanisms for selective adsorptions. J. Hazard. Mater. 2015, 283, 329–339. 10.1016/j.jhazmat.2014.09.046. [DOI] [PubMed] [Google Scholar]
- Haque E.; Lee J. E.; Jang I. T.; Hwang Y. K.; Chang J.-S.; Jegal J.; Jhung S. H. Adsorptive removal of methyl orange from aqueous solution with metal-organic frameworks, porous chromium-benzenedicarboxylates. J. Hazard. Mater. 2010, 181, 535–542. 10.1016/j.jhazmat.2010.05.047. [DOI] [PubMed] [Google Scholar]
- Kaur R.; Kaur A.; Umar A.; Anderson W. A.; Kansal S. K. Metal organic framework (MOF) porous octahedral nanocrystals of Cu-BTC: Synthesis, properties and enhanced adsorption properties. Mater. Res. Bull. 2019, 109, 124–133. 10.1016/j.materresbull.2018.07.025. [DOI] [Google Scholar]
- Embaby M. S.; Elwany S. D.; Setyaningsih W.; Saber M. R. The adsorptive properties of UiO-66 towards organic dyes: A record adsorption capacity for the anionic dye Alizarin Red S. Chin. J. Chem. Eng. 2018, 26, 731–739. 10.1016/j.cjche.2017.07.014. [DOI] [Google Scholar]
- Abd El Salam H. M.; Zaki T. Removal of hazardous cationic organic dyes from water using nickel-based metal-organic frameworks. Inorg. Chim. Acta 2018, 471, 203–210. 10.1016/j.ica.2017.10.040. [DOI] [Google Scholar]
- Idrisi M.; Saleh H. A. M. I.; Qasem K. M. A.; Shahid M.; Mehtab M.; Ahmad M. Efficient and selective adsorption and separation of methylene blue (MB) from mixture of dyes in aqueous environment employing a Cu(II) based metal organic framework. Inorg. Chim. Acta 2020, 511, 119787. 10.1016/j.ica.2020.119787. [DOI] [Google Scholar]
- Asfaram A.; Ghaedi M.; Agarwal S.; Tyagi I.; Kumar G. V. Removal of basic dye Auramine-O by ZnS: Cu nanoparticles loaded on activated carbon: optimization of parameters using response surface methodology with central composite design. RSC Adv. 2015, 5, 18438–18450. 10.1039/c4ra15637d. [DOI] [Google Scholar]
- Snyder S. A.; Westerhoff P.; Yoon Y.; Sedlak D. L. Pharmaceuticals, personal care products, and endocrine disruptors in water: Implications for the water industry. Environ. Eng. Sci. 2003, 20, 449–469. 10.1089/109287503768335931. [DOI] [Google Scholar]
- Sofi F. A.; Majid K.; Mehraj O. The visible light driven copper based metal-organic-framework heterojunction:HKUST-1@Ag-Ag3PO4 for plasmon enhanced visible light photocatalysis. J. Alloys Compd. 2018, 737, 798–808. 10.1016/j.jallcom.2017.12.141. [DOI] [Google Scholar]
- Wang S.; Wang X. Multifunctional Metal–Organic Frameworks for Photocatalysis. Small 2015, 11, 3097–3112. 10.1002/smll.201500084. [DOI] [PubMed] [Google Scholar]
- Nasalevich M. A.; Goesten M. G.; Savenije T. J.; Kapteijn F.; Gascon J. Enhancing optical absorption of metal–organic frameworks for improved visible light photocatalysis. Chem. Commun. 2013, 49, 10575–10577. 10.1039/c3cc46398b. [DOI] [PubMed] [Google Scholar]
- Ai L.; Zhang C.; Li L.; Jiang J. Iron terephthalate metal–organic framework: Revealing the effective activation of hydrogen peroxide for the degradation of organic dye under visible light irradiation. Appl. Catal., B 2014, 148–149, 191–200. 10.1016/j.apcatb.2013.10.056. [DOI] [Google Scholar]
- Dias E. M.; Petit C. Towards the use of metal–organic frameworks for water reuse: a review of the recent advances in the field of organic pollutants removal and degradation and the next steps in the field. J. Mater. Chem. A 2015, 3, 22484–22506. 10.1039/c5ta05440k. [DOI] [Google Scholar]
- Doan T. L. H.; Nguyen H. L.; Pham H. Q.; Pham-Tran N.-N.; Le T. N.; Cordova K. E. Tailoring the Optical Absorption of Water-Stable ZrIV- and HfIV-Based Metal–Organic Framework Photocatalysts. Chem.—Asian J. 2015, 10, 2660–2668. 10.1002/asia.201500641. [DOI] [PubMed] [Google Scholar]
- Sha Z.; Sun J.; Chan H. S. O.; Jaenicke S.; Wu J. Enhanced Photocatalytic Activity of the AgI/UiO-66(Zr) Composite for RhodamineBDegradation under Visible -LightIrradiation. Chempluschem 2015, 80, 1321–1328. 10.1002/cplu.201402430. [DOI] [PubMed] [Google Scholar]
- Duan C.; Yu Y.; Xiao J.; Li Y.; Yang P.; Hu F.; Xi H. Recent advancements in metal–organic frameworks for green applications. Green Energy Environ. 2021, 6, 33–49. 10.1016/j.gee.2020.04.006. [DOI] [Google Scholar]
- Wang H.; Yuan X.; Wu Y.; Zeng G.; Dong H.; Chen X.; Leng L.; Wu Z.; Peng L. In situ synthesis of In2S3@MIL-125(Ti) core–shell microparticle for the removal of tetracycline from wastewater by integrated adsorption and visible-light-driven photocatalysis. Appl. Catal., B 2016, 186, 19–29. 10.1016/j.apcatb.2015.12.041. [DOI] [Google Scholar]
- Xiao S.-L.; Li Y.-H.; Ma P.-J.; Cui G.-H. Synthesis and characterizations of two bis(benzimidazole)-based cobaltous coordination polymers with high adsorption capacity for congo red dye. Inorg. Chem. Commun. 2013, 37, 54–58. 10.1016/j.inoche.2013.09.047. [DOI] [Google Scholar]
- Wang J.-L.; Wang C.; Lin W. Metal–Organic Frameworks for Light Harvesting and Photocatalysis. ACS Catal. 2012, 2, 2630–2640. 10.1021/cs3005874. [DOI] [Google Scholar]
- Gao Y.; Li S.; Li Y.; Yao L.; Zhang H. Accelerated photocatalytic degradation of organic pollutant over metal-organic framework MIL-53(Fe) under visible LED light mediated by persulfate. Appl. Catal., B 2017, 202, 165–174. 10.1016/j.apcatb.2016.09.005. [DOI] [Google Scholar]
- Zhang T.; Lin W. Metal–organic frameworks for artificial photosynthesis and photocatalysis. Chem. Soc. Rev. 2014, 43, 5982–5993. 10.1039/c4cs00103f. [DOI] [PubMed] [Google Scholar]
- Meek S. T.; Greathouse J. A.; Allendorf M. D. Metal-Organic Frameworks: A Rapidly Growing Class of Versatile Nanoporous Materials. Adv. Mater. 2011, 23, 249–267. 10.1002/adma.201002854. [DOI] [PubMed] [Google Scholar]
- Wang Q.; Gao Q.; Al-Enizi A. M.; Nafady A.; Ma S. Recent advances in MOF-based photocatalysis: environmental remediation under visible light. Inorg. Chem. Front. 2020, 7, 300–339. 10.1039/c9qi01120j. [DOI] [Google Scholar]
- Zeng L.; Guo X.; He C.; Duan C. Metal–Organic Frameworks: Versatile Materials for Heterogeneous Photocatalysis. ACS Catal. 2016, 6, 7935–7947. 10.1021/acscatal.6b02228. [DOI] [Google Scholar]
- Wen T.; Zhang D.-X.; Zhang J. Two-Dimensional Copper(I) Coordination Polymer Materials as Photocatalysts for the Degradation of Organic Dyes. Inorg. Chem. 2013, 52, 12–14. 10.1021/ic302273h. [DOI] [PubMed] [Google Scholar]
- Das M.; Khullar S.; Sarkar M. Increased Photocatalytic Activity of Post Synthetically Modified Coordination Polymer Derived from Bis-pyridyldiamide. Eur. J. Inorg. Chem. 2020, 3174–3186. 10.1002/ejic.202000450. [DOI] [Google Scholar]
- Yaghi O. M.; Li H.; Groy T. L. Construction of Porous Solids from Hydrogen-Bonded Metal Complexes of 1, 3, 5-Benzenetricarboxylic Acid. J. Am. Chem. Soc. 1996, 118, 9096–9101. 10.1021/ja960746q. [DOI] [Google Scholar]
- Majumder A.; Shit S.; Choudhury C. R.; Batten S. R.; Pilet G.; Luneau D.; Daro N.; Sutter J.-P.; Chattopadhyay N.; Mitra S. Synthesis, structure and fluorescence of two novel manganese(II) and zinc(II)-1,3,5-benzene tricarboxylate coordination polymers: Extended 3D supramolecular architectures stabilized by hydrogen bonding. Inorg. Chim. Acta 2005, 358, 3855–3864. 10.1016/j.ica.2005.07.002. [DOI] [Google Scholar]
- Motegi H.; Hu L.; Slebodnick C.; Hanson B. E. Synthesis and structure of two novel cobalt(II) and zinc(II) crystalline coordination networks constructed with 1, 3, 5-benzene tricarboxylate and 9, 10-bis(imidazole-1-ylmethyl)anthracene. Microporous Mesoporous Mater. 2010, 129, 360–365. 10.1016/j.micromeso.2009.06.009. [DOI] [Google Scholar]
- Li X.; Cao R.; Sun D.; Yuan D.; Bi W.; Li X.; Wang Y. A three-dimensional zinc(II) complex consisting of single metal centers and pentanuclear clusters bridged by 1, 3, 5-benzenetricarboxylate. J. Mol. Struct. 2004, 694, 205–210. 10.1016/j.molstruc.2004.03.032. [DOI] [Google Scholar]
- Wang X.-F.; Liu G.-X.; Zhou H. Syntheses, structures and physical properties of two zinc(II) coordination polymers with 1,3,5-tris(imidazole-1-ylmethyl)-2,4,6-trimethylbenzene and 1,3,5-benzenetricarboxylate. Inorg. Chim. Acta 2013, 406, 223–229. 10.1016/j.ica.2013.04.039. [DOI] [Google Scholar]
- Zou R.; Zhong R.; Han S.; Xu H.; Burrell A. K.; Henson N.; Cape J. L.; Hickmott D. D.; Timofeeva T. V.; Larson T. E.; Zhao Y. A Porous Metal–Organic Replica of α-PbO2 for Capture of Nerve Agent Surrogate. J. Am. Chem. Soc. 2010, 132, 17996–17999. 10.1021/ja101440z. [DOI] [PubMed] [Google Scholar]
- Davies K.; Bourne S. A.; Öhrström L.; Oliver C. L. Anionic zinc-trimesic acid MOFs with unusual topologies: Reversible hydration studies. Dalton Trans. 2010, 39, 2869–2874. 10.1039/b922690g. [DOI] [PubMed] [Google Scholar]
- Wu Y.; Luo H.; Wang H. Synthesis of iron(III)-based metal–organic framework/graphene oxide composites with increased photocatalytic performance for dye degradation. RSC Adv. 2014, 4, 40435–40438. 10.1039/c4ra07566h. [DOI] [Google Scholar]
- Gao S.; Feng T.; Feng C.; Shang N.; Wang C. Novel visible-light-responsive Ag/AgCl@MIL-101 hybrid materials with synergistic photocatalytic activity. J. Colloid Interface Sci. 2016, 466, 284–290. 10.1016/j.jcis.2015.12.045. [DOI] [PubMed] [Google Scholar]
- Wu Z.; Yuan X.; Zhang J.; Wang H.; Jiang L.; Zeng G. Photocatalytic Decontamination of Wastewater Containing Organic Dyes by Metal–Organic Frameworks and their Derivatives. ChemCatChem 2017, 9, 41–64. 10.1002/cctc.201600808. [DOI] [Google Scholar]
- Askari H.; Ghaedi M.; Dashtian K.; Azghandi M. H. A. Rapid and high-capacity ultrasonic assisted adsorption of ternary toxic anionic dyes onto MOF-5-activated carbon: Artificial neural networks, partial least squares, desirability function and isotherm and kinetic study. Ultrason. Sonochem. 2017, 37, 71–82. 10.1016/j.ultsonch.2016.10.029. [DOI] [PubMed] [Google Scholar]
- Mahmoodi N. M.; Taghizadeh M.; Taghizadeh A. Activated carbon/metal-organic framework composite as a bio-based novel green adsorbent: Preparation and mathematical pollutant removal modeling. J. Mol. Liq. 2019, 277, 310–322. 10.1016/j.molliq.2018.12.050. [DOI] [Google Scholar]
- Hasanzadeh M.; Simchi A.; Shahriyari F. H. Nanoporous composites of activated carbon-metal organic frameworks for organic dye adsorption: Synthesis, adsorption mechanism and kinetics studies. J. Ind. Eng. Chem. 2020, 81, 405–414. 10.1016/j.jiec.2019.09.031. [DOI] [Google Scholar]
- Malik R.; Ramteke D. S.; Wate S. R. Adsorption of malachite green on groundnut shell waste based powdered activated carbon. Waste Manage. 2007, 27, 1129–1138. 10.1016/j.wasman.2006.06.009. [DOI] [PubMed] [Google Scholar]
- Tsai W. T.; Chang C. Y.; Lee S. L. Preparation and characterization of activated carbons from corn cob. Carbon 1997, 35, 1198–1200. 10.1016/s0008-6223(97)84654-4. [DOI] [Google Scholar]
- Hu Z.; Srinivasan M. P. Preparation of high-surface-area activated carbons from coconut shell. Microporous Mesoporous Mater. 1999, 27, 11–18. 10.1016/s1387-1811(98)00183-8. [DOI] [Google Scholar]
- Daud W. M. A. W.; Ali W. S. W.; Sulaiman M. Z. The effects of carbonization temperature on pore development in palm-shell-based activated carbon. Carbon 2000, 38, 1925–1932. 10.1016/s0008-6223(00)00028-2. [DOI] [Google Scholar]
- Köseoğlu E.; Akmil-Başar C. Preparation, structural evaluation and adsorptive properties of activated carbon from agricultural waste biomass. Adv. Powder Technol. 2015, 26, 811–818. 10.1016/j.apt.2015.02.006. [DOI] [Google Scholar]
- Azad F. N.; Ghaedi M.; Dashtian K.; Hajati S.; Pezeshkpour V. Ultrasonically assisted hydrothermal synthesis of activated carbon–HKUST-1-MOF hybrid for efficient simultaneous ultrasound-assisted removal of ternary organic dyes and antibacterial investigation: Taguchi optimization. Ultrason. Sonochem. 2016, 31, 383–393. 10.1016/j.ultsonch.2016.01.024. [DOI] [PubMed] [Google Scholar]
- Sayğılı F.; Guzel F. High surface area mesoporous activated carbon from tomato processing solid waste by zinc chloride activation: process optimization, characterization and dyes adsorption. J. Cleaner Prod. 2016, 113, 995–1004. 10.1016/j.jclepro.2015.12.055. [DOI] [Google Scholar]
- Mahmoodi N. M.; Taghizadeh M.; Taghizadeh A. Mesoporous activated carbons of low-cost agricultural bio-wastes with high adsorption capacity: preparation and artificial neural network modeling of dye removal from single and multicomponent (binary and ternary) systems. J. Mol. Liq. 2018, 269, 217–228. 10.1016/j.molliq.2018.07.108. [DOI] [Google Scholar]
- Dolomanov O. V.; Bourhis L. J.; Gildea R. J.; Howard J. A. K.; Puschmann H. OLEX2: a complete structure solution, refinement and analysis program. J. Appl. Crystallogr. 2009, 42, 339–341. 10.1107/s0021889808042726. [DOI] [Google Scholar]
- Sheldrick G. M. SHELXT-Integrated space-group and crystal-structure determination. Acta Crystallogr., Sect. A: Found. Adv. 2015, 71, 3–8. 10.1107/s2053273314026370. [DOI] [PMC free article] [PubMed] [Google Scholar]
- Sheldrick G. M. Crystal structure refinement with SHELXL. Acta Crystallogr., Sect. C: Struct. Chem. 2015, 71, 3–8. 10.1107/s2053229614024218. [DOI] [PMC free article] [PubMed] [Google Scholar]
- Zhang W.; Bruda S.; Landee C. P.; Parent J. L.; Turnbull M. M. Structures and magnetic properties of transition metal complexes of 1, 3, 5-benzenetricarboxylic acid. Inorg. Chim. Acta 2003, 342, 193–201. 10.1016/s0020-1693(02)01139-8. [DOI] [Google Scholar]
- Becke A. D. Density functional exchange energy approximation with correct asymptotic behavior. Phys. Rev. A: At., Mol., Opt. Phys. 1988, 38, 3098–3100. 10.1103/physreva.38.3098. [DOI] [PubMed] [Google Scholar]
- Lee C.; Yang W.; Parr R. G. Development of the colle-salveti correlation energy formula into a functional of the electron density. Phys. Rev. B: Condens. Matter Mater. Phys. 1988, 37, 785–789. 10.1103/physrevb.37.785. [DOI] [PubMed] [Google Scholar]
- Frisch M. J.; Trucks G. W.; Schlegel H. B.; Scuseria G. E.; Robb M. A.; Cheeseman J. R.; Scalmani G.; Barone V.; Mennucci B.; Petersson G. A.; Nakatsuji H.; Caricato M.; Li X.; Hratchian H. P.; Izmaylov A. F.; Bloino J.; Zheng G.; Sonnenberg J. L.; Hada M.; Ehara M.; Toyota K.; Fukuda R.; Hasegawa J.; Ishida M.; Nakajima T.; Honda Y.; Kitao O.; Nakai H.; Vreven T.; Montgomery J. A.; Peralta J. E.; Ogliaro F.; Bearpark M.; Heyd J. J.; Brothers E.; Kudin K. N.; Staroverov V. N.; Kobayashi R.; Normand J.; Raghavachari K.; Rendell A.; Burant J. C.; Iyengar S. S.; Tomasi J.; Cossi M.; Rega N.; Millam J. M.; Klene M.; Knox J. E.; Cross J. B.; Bakken V.; Adamo C.; Jaramillo J.; Gomperts R.; Stratmann R. E.; Yazyev O.; Austin A. J.; Cammi R.; Pomelli C.; Ochterski J. W.; Martin R. L.; Morokuma K.; Zakrzewski V. G.; Voth G. A.; Salvador P.; Dannenberg J. J.; Dapprich S.; Daniels A. D.; Farkas Ö.; Foresman J. B.; Ortiz J. V.; Cioslowski J.; Fox D. J.. Gaussian 09; Gaussian, Inc.: Wallingford CT, 2009.
- Dennington R.; Keith T. A.; Millam J. M.. GaussView 6.0.16; Semichem Inc.: Shawnee Mission, KS, USA, 2016.
- HyperChem 8.07, HyperChem Professional Program; Hypercube: Gainesville, 2001.
- Lu T.; Chen F. Multiwfn: a multifunctional wavefunction analyzer. J. Comput. Chem. 2012, 33, 580–592. 10.1002/jcc.22885. [DOI] [PubMed] [Google Scholar]
- Humphrey W.; Dalke A.; Schulten K. VMD: visual molecular dynamics. J. Mol. Graphics 1996, 14, 33–38. 10.1016/0263-7855(96)00018-5. [DOI] [PubMed] [Google Scholar]
- Nadeem M. A.; Bhadbhade M.; Stride J. A. Four new coordination polymers constructed from benzene tricarboxylic acid: synthesis, crystal structure, thermal and magnetic properties. Dalton Trans. 2010, 39, 9860–9865. 10.1039/c0dt00600a. [DOI] [PubMed] [Google Scholar]
- Liang S.; Wang H.; Wang Z.; Han J.-Y. catena-Poly[[dodecaaqua(μ3-benzene-1,3,5-tricarboxylato)dinickel(II)zinc(II)]-μ-benzene-1, 3, 5-tricarboxylato]. Acta Crystallogr., Sect. E: Struct. Rep. Online 2006, 62, m3014–m3015. 10.1107/s1600536806042413. [DOI] [Google Scholar]
- Clegg W.; Harbron D. R.; Homan C. D.; Hunt P. A.; Little I. R.; Straughan B. P. Crystal structures of three basic zinc carboxylates together with infrared and FAB mass spectrometry studies in solution. Inorg. Chim. Acta 1991, 186, 51–60. 10.1016/s0020-1693(00)87930-x. [DOI] [Google Scholar]
- Hameed B.; Daud F. Adsorption studies of basic dye on activated carbon derived from agricultural waste: Hevea brasiliensis seed coat. Chem. Eng. J. 2008, 139, 48–55. 10.1016/j.cej.2007.07.089. [DOI] [Google Scholar]
- Mastalerz M.; Bustin R. M. Application of reflectance micro-Fourier transform infrared spectrometry in studying coal macerals: comparison with other Fourier transform infrared techniques. Fuel 1995, 74, 536–542. 10.1016/0016-2361(95)98356-j. [DOI] [Google Scholar]
- Altomare A.; Cuocci C.; Giacovazzo C.; Moliterni A.; Rizzi R.; Corriero N.; Falcicchio A. EXPO2013: a kit of tools for phasing crystal structures from powder data. J. Appl. Crystallogr. 2013, 46, 1231–1235. 10.1107/s0021889813013113. [DOI] [Google Scholar]
- Sing K. S. W.; Everett D. H.; Haul R. A. W.; Moscou L.; Pierotti R. A.; Rouquerol J.; Siemieniewsk T. Reporting Physisorption data for gas/solid Systems with Special Reference to the Determination of Surface Area and Porosity. Pure Appl. Chem. 1985, 57, 603–619. 10.1351/pac198557040603. [DOI] [Google Scholar]
- Caballero J. A.; Marcilla A.; Conesa J. A. Thermogravimetric analysis of olive stones with sulphuric acid treatment. J. Anal. Appl. Pyrolysis 1997, 44, 75–88. 10.1016/s0165-2370(97)00068-5. [DOI] [Google Scholar]
- Raveendran K.; Ganesh A.; Khilar K. C. Pyrolysis characteristics of biomass and biomass components. Fuel 1996, 75, 987–998. 10.1016/0016-2361(96)00030-0. [DOI] [Google Scholar]
- Yang H.; Yan R.; Chen H.; Lee D. H.; Zheng C. Characteristics of hemicellulose, cellulose and lignin pyrolysis. Fuel 2007, 86, 1781–1788. 10.1016/j.fuel.2006.12.013. [DOI] [Google Scholar]
- Laurier K. G. M.; Vermoortele F.; Ameloot R.; De Vos D. E.; Hofkens J.; Roeffaers M. B. J. Iron(III)-Based Metal–Organic Frameworks As Visible Light Photocatalysts. J. Am. Chem. Soc. 2013, 135, 14488–14491. 10.1021/ja405086e. [DOI] [PubMed] [Google Scholar]
- Ekpenyong E. E.; Louis H.; Anyama C. A.; Ogar J. O.; Utsu P. M.; Ayi A. A. Experimental and density functional theory studies on the adsorption behavior of selected gas molecules on Mg (II) coordination polymer constructed with 1, 3, 5-benzenetricarboxylates. J. Mol. Struct. 2020, 1220, 128641. 10.1016/j.molstruc.2020.128641. [DOI] [Google Scholar]
- Louis H.; Guo L.-j.; Zhu S.; Hussain S.; He T. Computational study on interactions between CO2 and (TiO2) n clusters at specific sites. Chin. J. Chem. Phys. 2019, 32, 674–686. 10.1063/1674-0068/cjcp1905108. [DOI] [Google Scholar]
- Ali I.; Hussain R.; Louis H.; Bokhari S. W.; Iqabl M. Z. In situ reduced graphene-based aerogels embedded with gold nanoparticles for real-time humidity sensing and toxic dyes elimination. Microchim. Acta 2021, 188, 10. 10.1007/s00604-020-04658-0. [DOI] [PubMed] [Google Scholar]
- Odey J. O.; Louis H.; Agwupuye J. A.; Moshood Y. L.; Bisong E. A.; Brown O. I. Experimental and Theoretical Studies of the Electrochemical Properties of Mono Azo Dyes derived from 2-Nitroso-1-Naphthol, 1-Nitroso-2-Naphthol, and CI Disperse Yellow 56 Commercial Dye in Dye-sensitized Solar Cell. J. Mol. Struct. 2021, 1241, 130615. 10.1016/j.molstruc.2021.130615. [DOI] [Google Scholar]
- Bisong E. A.; Louis H.; Unimuke T. O.; Bassey V. M.; Agwupuye J. A.; Peter L. I.; Adeleye A. T. Theoretical investigation of the stability, reactivity, and the interaction of methyl-substituted peridinium-based ionic liquids. Phys. Sci. Rev. 2021, 10.1515/psr-2020-0137. [DOI] [Google Scholar]
- Weinhold F.; Landis C. R.; Glendening E. what is NBO analysis and how is it useful?. Int. Rev. Phys. Chem. 2016, 35, 399–440. 10.1080/0144235x.2016.1192262. [DOI] [Google Scholar]
- Yoosefian M.; Etminan N. The role of solvent polarity in the electronic properties, stability and reactivity trend of a tryptophane/Pd doped SWCNT novel nanobiosensor from polar protic to non-polar solvents. RSC Adv. 2016, 6, 64818–64825. 10.1039/c6ra14006h. [DOI] [Google Scholar]
- Lu T.; Chen F. Multiwfn: a multifunctional wavefunction analyzer. J. Comput. Chem. 2012, 33, 580–592. 10.1002/jcc.22885. [DOI] [PubMed] [Google Scholar]
- Wang C.-C.; Li J.-R.; Lv X.-L.; Zhang Y.-Q.; Guo G. Photocatalytic organic pollutants degradation in metal–organic frameworks. Energy Environ. Sci. 2014, 7, 2831–2867. 10.1039/c4ee01299b. [DOI] [Google Scholar]
- Ma K.; Bi C.; Zhang X.; Zong Z.; Fan C.; Xu C.; Fan Y. H. Synthesis of two different Ni(II) coordination polymers by introduction of carboxylic acid ligands: Crystal structure and photocatalytic properties. Inorg. Chim. Acta 2019, 494, 91–97. 10.1016/j.ica.2019.04.042. [DOI] [Google Scholar]
- Mahata P.; Madras G.; Natarajan S. Novel Photocatalysts for the Decomposition of Organic Dyes Based on Metal-Organic Framework Compounds. J. Phys. Chem. B 2006, 110, 13759–13768. 10.1021/jp0622381. [DOI] [PubMed] [Google Scholar]
Associated Data
This section collects any data citations, data availability statements, or supplementary materials included in this article.


