

Summary
Advances in chimeric antigen receptor (CAR) T cell therapies have led to the modality dominating translational cancer research; however, a standardized protocol for evaluating such therapies in vitro is needed. This protocol details the in vitro preclinical evaluation of CAR-T cell therapies for glioblastoma (GBM), including target cell cytotoxicity and T cell proliferation, activation, and cytokine release assays.
For complete details on the use and execution of this protocol, please refer to Vora et al. (2020).
Subject areas: Cancer, Cell culture, Cell separation/fractionation, Cell-based Assays, Flow Cytometry/Mass Cytometry, Health Sciences, Immunology
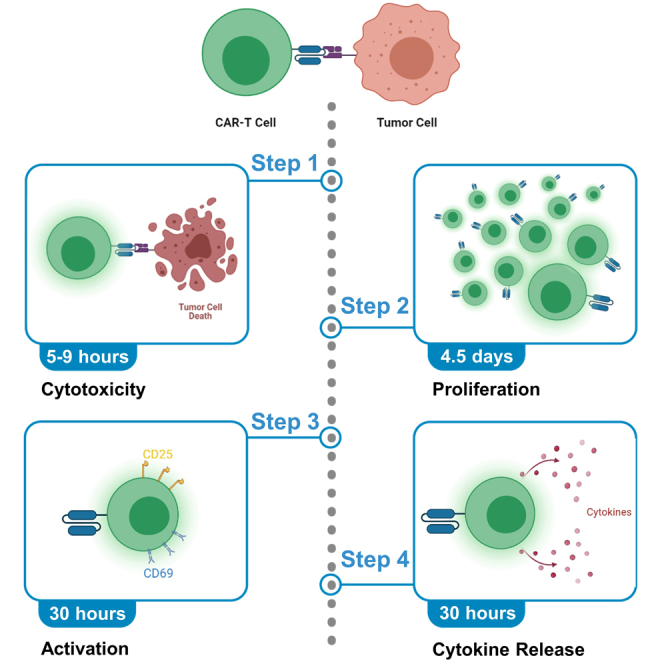
Graphical abstract
Highlights
-
•
Evaluating CAR-T cell activity in heterogeneous, patient-derived GBM models
-
•
Functional readout of therapy-mediated target cell cytotoxicity
-
•
Assessing proliferation, activation, and cytokine release of CAR-T cells
Advances in chimeric antigen receptor (CAR) T cell therapies have led to the modality dominating translational cancer research; however, a standardized protocol for evaluating such therapies in vitro is needed. This protocol details the in vitro preclinical evaluation of CAR-T cell therapies for glioblastoma (GBM), including target cell cytotoxicity and T cell proliferation, activation, and cytokine release assays.
Before you begin
GBM tumor samples are dissociated and propagated as described previously Chokshi et al. (2020). Please refer to Tatari et al. (2020) for methods detailing lentiviral production and generation of CAR-T cells.
Note: For all assays, tumor antigen-targeting CAR-T cells and control CAR-T cells are needed. Appropriate control CAR-T cells should not target any antigen expressed on target cells.
Generation of GBM cells expressing firefly luciferase
Timing: 2–3 days
-
1.
Plate a single-cell suspension of 150,000 GBM cells in 250 μL of Neurocult Complete (NCC) media per well in a 24 well plate. Refer to materials and equipment for details on NCC media.
-
2.
Carefully add luciferase lentivirus at an MOI of 1 in 50 μL NCC per well. Incubate cells at 37°C, 5% CO2 for 24 h.
-
3.
Collect cells, centrifuge at 300 × g for 5 min at 20°C–22°C and discard supernatant. Resuspend cells in 2 mL of warm NCC media supplemented with a compatible antibiotic at the minimum inhibitory concentration. Plate cells back into the same wells and incubate at 37°C, 5% CO2 for 48–72 h depending on the antibiotic being used.
Note: To determine the minimum inhibitory concentration for a given antibiotic, perform a dose-response experiment with antibiotic concentrations ranging from 0.5 to 2 μg/mL over 48–72 hours. Duration of antibiotic treatment is specific to the type of antibiotic.
-
4.
Collect cells, centrifuge at 300 × g for 5 min at 20°C–22°C and discard supernatant. Resuspend cell pellet in 250 μL of TrypLE and incubate at 37°C for 2–5 min until solution contains no visible clumps. If needed, use a pipette to aid in dissociation.
-
5.
Add 4 mL of PBS and centrifuge cells at 300 × g for 5 min at 20°C–22°C. Discard supernatant.
-
6.
Resuspend cells in 1 mL of PBS, filter cell suspension through a 35 μm cell strainer cap and determine live cell concentration of each cell solution using Trypan Blue solution.
Key resources table
| REAGENT or RESOURCE | SOURCE | IDENTIFIER |
|---|---|---|
| Antibodies | ||
| CD25-FITC | Miltenyi Biotec | Cat. No. 130-113-283, RRID:AB_2734062 |
| CD3-PECy7 | BD Biosciences | Cat. No. 557851, Research Resource Identifier:AB_396896 |
| CD69-APC | BD Biosciences | Cat. No. 555533, Research Resource Identifier:AB_398602 |
| IgG Compbeads | BD Biosciences | Cat. No. 552843 |
| Biological samples | ||
| HEK293 T Lenti-X cells | n/a | n/a |
| Chemicals, peptides, and recombinant proteins | ||
| Antibiotic/antimycotic solution | Wisent Bio Products | Product No. 450-115-EL |
| Basic fibroblast growth factor (bFGF), human, recombinant | STEMCELL Technologies | Cat. No. 78003.2 |
| D-firefly luciferin potassium salt | Perkin Elmer | Part No. 122799 |
| DMEM, high glucose with pyruvate | Thermofisher Scientific | Cat. No. 11995073 |
| DNase vial (D2) | Worthington Biochemical Corporation | Cat. No. NC9216647 |
| EDTA | Millipore Sigma | Product No. 20158 |
| Epidermal growth factor (EGF), human, recombinant | STEMCELL Technologies | Cat. No. 78006 |
| Fetal bovine serum (FBS) | Wisent Bioproducts | Product No. 098-150 |
| Heparin solution | STEMCELL Technologies | Cat. No. 07980 |
| Liberase research grade | Millipore Sigma | Product No. LIBTM-RO |
| MEM-non-essential amino acids | Thermofisher Scientific | Cat. No. 11140050 |
| MycoZap prophylactic | Lonza | Cat. No. VZA-2031 |
| NeuroCult NS-A proliferation kit (Human) | STEMCELL Technologies | Cat. No. 05751 |
| Nonidet 40 (NP40) | Thermofisher Scientific | Cat. No. 98379 |
| PBS pH 7.4, with calcium and magnesium | Wisent Bio Products | Product No. 311-011-CL |
| Polybrene infection/transfection reagent | Millipore Sigma | Product No. TR-1003 |
| PrestoBlue reagent | Thermofisher Scientific | Cat. No. A13262 |
| Prime-XV T cell expansion media XSFM (XSFM) | Irvine Scientific | Cat. No. 91141 |
| Trypan blue | Thermofisher Scientific | Cat. No. 15250-061 |
| TrypLE™ express enzyme (1×), phenol red | Thermofisher Scientific | Cat. No. 12605028 |
| 7-AAD viability dye | Beckman Coulter | Product No. A07704 |
| Critical commercial assays | ||
| Cytometric bead array (CBA) Kit | BD Biosciences | Cat. No. 550749 |
| Experimental models: Cell lines | ||
| CAR-T cells | Please refer to Vora et al. (2020) | n/a |
| Patient-derived GBM stem cell lines | Dr. Sheila Singh’s Laboratory | n/a |
| Software and algorithms | ||
| Kaluza Analysis Software | Beckman Coulter | Web Link: https://www.mybeckman.ca/flow-cytometry/software/kaluza |
| FLUOstar omega fluorescence 556 microplate Reader |
BMG Labtech | n/a |
| Other | ||
| Countess chamber slides | Invitrogen | Cat. No. C10228 |
| 5 mL round-bottom polystyrene tubes with 35 μm strainer lid | Corning | Cat. No. CA21008-948 |
Materials and equipment
NCC media
| Reagent | Final concentration | Amount |
|---|---|---|
| NeuroCult basal medium | n/a | 443.3 mL |
| NeuroCult supplement | n/a | 50 mL |
| Antibiotic/Antimycotic solution (100×) | 1× | 5 mL |
| MycoZap prophylactic (500×) | 1× | 1 mL |
| Heparin solution | 0.0002% (w/v) | 500 μL |
| EGF | 20 ng/mL | 100 μL |
| bFGF | 10 ng/mL | 100 μL |
| Total | n/a | 500 mL |
Storage: Store at 4°C for up to 1 week. Store all reagents as per manufacturer’s instructions.
Step-by-step method details
Preparation of CAR-T cells
-
1.
Warm required amounts of basal XSFM media at 37°C.
-
2.
Collect CAR-T cells (culture day 12–15) and centrifuge at 450 × g for 5 min at 20°C–22°C.
-
3.
Aspirate supernatant and resuspend cell pellet in 1 mL of warmed basal XSFM.
-
4.
Filter the cell suspension into a 12 × 75 mm tube with 35 μm cell strainer cap.
-
5.
Determine cell number and viability using Trypan Blue solution, and adjust cell count as required for specific assays.
Cytotoxicity assay
This assay determines the cytotoxicity of CAR-T cells against target cells using a bioluminescence-based measure of target cell lysis.
Note: This protocol was adapted from Karimi et al. (2014) and performed in Vora et al. (2020).
Preparing target cells (GBM cells)
-
6.
Prepare luciferase-expressing target cells at a concentration of 3 × 10⁵ live cells/mL of warmed basal XSFM with 75 μg/mL D-firefly luciferin potassium salt.
-
7.
Add 100 μL of cell mixture per well in a tissue culture-treated, flat-bottom 96-well plate for a total of 3 × 10⁴ live cells per well, plating 6 wells per effector: target (E:T) ratio.
Note: Cells must also be plated for a lysis control and media-only control. Each sample and control should be run in triplicates (Figure 1). The media-only control adjusts luminescence readings for background signal and provides a reference of spontaneous death occurring in the target cells in the absence of effector cells, while the lysis control provides a reference of maximal target cell killing through the addition of a lysis buffer.
Note: For all E:T ratios, target cell count remains constant while CAR-T cell count is adjusted. E:T ratios typically range from 1:1 to 10:1.
Figure 1.

Layout for cytotoxicity assay with E:T ratios from 1:1 to 4:1
Red and green represent wells in which CAR-T cells and control CAR-T cells are added, respectively. Yellow represents wells in which target cells are added without effector cells.
-
8.
Read the plate with a luminometer (measured as relative luminescence units or RLU) to ensure equal distribution of target cells. Luminometer (FLUOstar Omega, BMG Labtech) settings should be as follows: bottom optic read, gain: 3600, time: 10 s.
Note: Luminescence values should be within a small range of variability (<10%).
Preparing CAR-T cells
-
9.
Adjust the CAR-T cell concentrations to 3×10⁵ CAR-T cells/mL basal XSFM with 75 μg/mL D-firefly luciferin potassium salt. Plate 100 μL of cell mixture per well for a 1:1 E:T ratio, or adjust to a higher cell concentration for other E:T ratios to obtain a final volume of 200 μL per well.
Note: CAR-T cells consist of live, CAR-transduced T cells. This can be determined by measuring transduction efficiency, calculated when producing CAR-T cells using flow cytometry (Tatari et al., 2020). For instance, if the CAR-T cell transduction efficiency is 80%, a concentration of 3.75×10⁵ live cells/mL will yield 3×10⁵ CAR-T cells/mL.
-
10.
For lysis controls, add 100 μL of XSFM with 75 μg/mL D-firefly luciferin potassium salt and 1% nonidet P-40 lysis buffer.
-
11.
Add 100 μL of basal XSFM with 75 μg/mL D-firefly luciferin potassium salt to media-only wells.
Plate readout
-
12.
Incubate plate at 37°C, 5% CO2 for 4–8 h. After incubation, measure bioluminescence with luminometer using same settings previously described (step 8).
Note: You may take multiple readings over 24 hours, however, increased cytotoxicity in control wells may occur as a result of non-specific effects. See troubleshooting problem 4 for further details.
-
13.
To analyze data, use the following equation:
Test: RLU of individual well for which percent specific lysis is being determined.
Spontaneous lysis: average RLU of media-only wells.
Lysis control: average RLU of lysis control wells.
CAR-T cell proliferation assay
This assay quantifies the proliferation of CAR-T cells upon co-culturing with tumor cells.
Co-culture
-
14.
Prepare target cells at a concentration of 4×10⁶ live cells/mL of basal XSFM and plate 250 μL per well in a tissue culture-treated, flat-bottom 24-well plate. One well is needed for each CAR-T cell being used.
-
15.
In the same plate, add 250 μL per well of basal XSFM without target cells as media-only controls.
-
16.
Adjust the CAR-T cell concentration to 4×10⁶ CAR-T cells/mL of basal XSFM and plate 250 μL per well.
Note: CAR-T cells consist of live, CAR-transduced T cells. This can be determined by measuring transduction efficiency, calculated when producing CAR-T cells using flow cytometry (Tatari et al., 2020).
Note: This results in a 1:1 E:T ratio in co-culture wells.
-
17.
Incubate at 37°C, 5% CO2 for 24–48 h.
Prepare cells for flow cytometry
-
18.
Collect cell solution from each well.
-
19.
Centrifuge at 300 × g for 5 min at 20°C–22°C and resuspend pellet gently in 1 mL of PBS.
-
20.
Filter cell suspension into a 12 × 75 mm tube through 35μm cell strainer cap.
-
21.
Determine live cell concentration of each cell solution using Trypan Blue solution and aliquot between 500,000 and 1,000,000 live cells per well into 12 × 75 mm tubes, collecting three tubes per well.
Note: Three samples are needed per experimental condition: CD3 antibody, isotype control antibody or unstained control, and a viability stain control. The number of cells used per sample can vary depending on cell availability but must be consistent throughout all samples.
Cell staining
-
22.
Centrifuge tubes at 300 × g for 5 min at 20°C–22°C. Remove supernatant and resuspend cells being stained in 100 μL of PBS with 2 mM EDTA (PBS-EDTA). Stain cells with the respective antibody as per manufacturer’s recommendations (i.e., antibody concentration, duration, temperature). Skip to step 24 for viability stain control.
Note: Viability stain samples should be resuspended promptly after centrifuging, as leaving cells pelleted will reduce cell viability.
-
23.
Add 1mL of PBS-EDTA to the tubes and mix gently to wash cells. Centrifuge at 300 × g for 5 min at 20°C–22°C.
-
24.
Resuspend all pellets in 150 μL of 1× 7-AAD viability stain (100-fold dilution of 7-AAD from stock in PBS-EDTA).
Isolate T cells
-
25.
Prepare a 96 well plate with 200 μL basal XSFM per well (n = 3 replicates per sample). Sort CD3+ cells into the plate at a cell density of 1000 cells/well.
Note: Cells should be gated by selecting live cells (7-AAD-negative population), then from this population the CD3-positive cells.
-
26.
Add 200 μL basal XSFM as a blank in the same plate (n = 3).
-
27.
Incubate at 37°C, 5% CO2 for 3 days.
Plate readout
-
28.
Add 1× presto blue reagent into all wells (20 μL into 200 μL well; 10-fold dilution). Incubate plate at 37°C, 5% CO2 for 4 h.
-
29.
Read plate for relative fluorescence intensity (RFI) at an Excitation and Emission wavelength of 544nm and 590nm respectively.
Note: The presto blue assay is a measure of viable cells, but reflects differences in proliferation when same number of cells are seeded and culture conditions are constant as is the case with this assay.
-
30.
Proliferation is calculated for each well by subtracting the average RFI of all blank wells from the RFI of that well. Mean RFI can be plotted for each CAR-T cell being tested as a side-by-side comparison of proliferation in the presence and absence of target cells.
CAR-T cell activation assay
This assay detects markers of activation on the CAR-T cell surface to assess activation upon co-culturing with target cells.
Co-culture
-
31.
Prepare target cells at a concentration of 4×10⁶ live cells/mL of basal XSFM and plate 250 μL per well in a tissue culture-treated, flat-bottom 24-well plate. Three wells are needed for each CAR-T cell being used.
-
32.
Add 250 μL of basal XSFM per well in the same plate as media-only controls.
-
33.
Adjust the CAR-T cell concentration to 4×10⁶ cells/mL of basal XSFM and plate 250 μL of the cell solution per well.
Note: This results in a 1:1 E:T ratio in co-culture wells.
-
34.
Incubate at 37°C, 5% CO2 for 24 h.
Prepare cells for flow cytometry
-
35.
Refer to steps 18–24 for preparing and staining cells for flow cytometry analysis.
Note: Three samples are needed per well: CD25/CD69/CD3 co-stained, isotype co-stained or unstained control, and a viability stain control. Subsequent co-staining can be done by repeating steps 22 and 23 for each antibody. Fluorescence minus one controls can also be used to improve gating accuracy, whereby cells are stained with all fluorophores except one. Doing this for each fluorophore reveals the spread of all other fluorophores into the missing channel and gates can be set accordingly.
Data analysis
-
36.
Analyze the CD3+ population for CD25 and CD69 markers of activation.
Note: Flow gating strategy: Forward scatter (FSC)-height vs. side scatter (SSC)-height is used as the initial gate to exclude debris. Doublet cells are excluded using an FSC-height vs FSC-width gate. Viability gate is set using 7-AAD to exclude non-viable cells. Isotype control or an unstained control is used to set the gate for expression of CD3, CD25, and CD69 where the gate is drawn to exclude baseline expression of fluorophores. Expression of CD25/CD69 is analyzed on gated CD3 population.
The percentage of T cells positive for each marker, in addition to MFI (median fluorescence intensity) per cell reflects the degree of activation occurring in the cells, which can be compared between CAR-T and control CAR-T cells to determine specificity of the CAR and any off-target effects that may be taking place.
Cytokine release assay
This assay measures cytokine levels secreted by CAR-T cells upon co-culturing with cancer cells.
-
37.
Co-culture target cells and CAR-T cells or CAR-T cells only at a 1:1 ratio in basal XSFM (repeat activation assay co-culture, steps 31–34).
-
38.
For each well, transfer cells to sterile tube and centrifuge at 300 × g for 5 min at 20°C–22°C.
-
39.
Collect supernatant and store at −80°C for cytokine analysis or proceed directly to step 40
-
40.
Perform flow cytometry quantification of TNF-α and IFN-γ cytokines using Cytometric Bead Array Kit (BD Biosciences). For a detailed protocol, please refer to the BD™ Cytometric Bead Array (CBA) Human Th1/Th2 Cytokine Kit Instruction Manual (BD Biosciences, 2019). Briefly, supernatant or provided cytokine standard solutions are serially diluted and cytokine bead suspensions are added. Beads are then washed and used in flow cytometry to quantify presence of TNF-α and IFN-γ cytokines.
Expected outcomes
The cytotoxicity assay should show increasing target cell lysis with increasing E:T ratios, while control CAR-T cells should continuously show low lysis.
The proliferation assay should show CAR-T cell proliferation increasing significantly upon co-culture with target cells compared to control CAR-T cells and CAR-T cells without target cell co-culture.
The activation assay should show a large fraction of CAR-T cells expressing CD25 and CD69 activation markers as shown in figure 2, whilst this expression should be limited for control CAR-T cells.
Figure 2.

Representative flow cytometry plot of activation assay
Live, CD3+ cells were analyzed for expression of both CD25 and CD69 activation markers.
Similarly, the cytokine release assay should show high levels of both TNF-α and IFN-γ cytokines in CAR-T cells, whilst showing limited amounts in control CAR-T cells.
Limitations
In vitro co-culture-based assays provide valuable insights into the efficacy of CAR-T cell therapies but are inherently limited by several factors. Culturing of cell lines can allow for selection and cultural artifacts, and depending on the cell line, variation may occur. Additionally, the complex tumor immune microenvironment can have varying and unpredictable effects on immunotherapies not seen in vitro.
The in vitro cytotoxicity assays are done in small volumes where effector molecules are in close proximity to each other. CAR-T cell cytotoxicity can be enhanced by this clustering and intracellular signaling can be amplified, potentially exaggerating cytotoxicity values, known as the bystander effect. However, this assay has been effective at demonstrating relative cell killing and continues to be a reliable proxy of CAR-T cell efficacy.
CAR-T cell proliferation is measured via the presto blue assay which measures cell viability and thus cannot distinguish between an actively dividing cell and one in a quiescent state. Proliferation is thus calculated as an arbitrary fluorescence reading correlated to the number of live cells. Regardless, changes in viable cell count directly reflect and can be used to accurately assess CAR-T cell proliferation when the same number of cells are initially plated. Further, changes in viable cell count upon co-culture of CAR-T cells with target cells can be used to assess target cell-induced proliferation.
Troubleshooting
Problem 1
Low CAR transduction efficiency.
Potential solution
Due to the “pooled” approach of assessing the entire T cell population, low transduction efficiency can make differences between CAR-T and control CAR-T cell results indistinguishable, even for effective therapies. Enrichment for CAR-transduced T cells can be done prior to assays using a CAR-expressed marker to resolve this. See (Vora et al., 2020) for conceptual details on this.
Problem 2
Transfection of target cells with luciferase plasmid is not feasible or has low efficiency.
Potential solution
For cells in which stable transfection with luciferase plasmid (before you begin, steps 1–6) is not feasible, other measures of cytotoxicity are available which don’t require a reporter gene (Kiesgen et al., 2021). Low transfection can be overcome by electroporating target cells with luciferase mRNA (Omokoko et al., 2016).
Problem 3
Low CAR-T cell viability.
Potential solution
T cells are very sensitive to handling, and as such, resuspending vigorously can result in high amounts of cell death. T cells should be handled gently at all points in the protocol and handling should be kept to a minimum.
Problem 4
High cytotoxicity or activation in non-targeting control CAR-T cells.
Potential solution
Prior to final reading during the cytotoxicity (step 12) or activation (step 34) assays, prolonged co-culturing may lead to non-specific effects and increase killing or activation for both CAR-T and control CAR-T cells. If controls show high cytotoxicity or activation, the readout time may need to be optimized and include shorter incubation time.
Note: Non-targeted control CAR may express activation markers due to culturing and expansion. This is acceptable so long as the targeting CAR shows much greater activation.
Problem 5
Optimum cytotoxicity occurs prior to readout timepoint.
Potential solution
While readout of the proliferation assay usually occurs after a 24–48 h co-culture of CAR-T cells with target cells (step 17), this period can be shortened or the assay can be read out several times within the period to gain more resolution of cytotoxicity at earlier time points.
Resource availability
Lead contact
Further information and requests for resources and reagents should be directed to and will be fulfilled by the lead contact, Dr. Sheila Singh (ssingh@mcmaster.ca).
Materials availability
Requests for cell lines and information of all other pertinent information can be directed toward Dr. Sheila Singh.
Acknowledgments
This work was supported through a program project grant from the Terry Fox Research Institute, the catalyst program grant from BioCanRx, and Canadian Institutes of Health Research to S.S. S.S. is a Canada Research Chair in Human Cancer Stem Cell Biology.
Author contributions
B.A.B. drafted the protocol with input from C.R.C. and S.K.S. B.A.B. prepared the figures and graphical abstract. C.V. and S.S. contributed to integration of the writing sections and edited the manuscript with input from all authors.
Declaration of interests
Dr. Sheila K. Singh is a scientific advisor for Century Therapeutics Inc., and her role in the company has been reviewed and is supported by McMaster University. Dr. Chitra Venugopal is a member of the STAR Protocols advisory board.
Data and code availability
No datasets were generated or analyzed during this study.
References
- BD Biosciences BD™ cytometric bead array (CBA) human Th1/Th2 cytokine kit instruction manual. 2019. https://www.bdbiosciences.com/content/dam/bdb/products/global/reagents/immunoassay-reagents/cba/cba-kits/550749_base/pdf/550749_Book_Website.pdfBdbiosciences.com
- Chokshi C.R., Savage N., Venugopal C., Singh S.K. A patient-derived xenograft model of glioblastoma. STAR Protoc. 2020;1:100179. doi: 10.1016/j.xpro.2020.100179. [DOI] [PMC free article] [PubMed] [Google Scholar]
- Karimi M.A., Lee E., Bachmann M.H., Salicioni A.M., Behrens E.M., Kambayashi T., Baldwin C.L. Measuring cytotoxicity by bioluminescence imaging outperforms the standard chromium-51 release assay. PLoS One. 2014;9:e89357. doi: 10.1371/journal.pone.0089357. [DOI] [PMC free article] [PubMed] [Google Scholar]
- Kiesgen S., Messinger J.C., Chintala N.K., Tano Z., Adusumilli P.S. Comparative analysis of assays to measure CAR T-cell-mediated cytotoxicity. Nat. Protoc. 2021;16:1331–1342. doi: 10.1038/s41596-020-00467-0. [DOI] [PMC free article] [PubMed] [Google Scholar]
- Omokoko T.A., Luxemburger U., Bardissi S., Simon P., Utsch M., Breitkreuz A., Tureci O., Sahin U. Luciferase mRNA transfection of antigen presenting cells permits sensitive nonradioactive measurement of cellular and humoral cytotoxicity. J. Immunol. Res. 2016;2016:9540975. doi: 10.1155/2016/9540975. [DOI] [PMC free article] [PubMed] [Google Scholar]
- Tatari N., Maich W.T., Salim S.K., McKenna D., Venugopal C., Singh S. Preclinical testing of CAR T cells in a patient-derived xenograft model of glioblastoma. STAR Protoc. 2020;1:100174. doi: 10.1016/j.xpro.2020.100174. [DOI] [PMC free article] [PubMed] [Google Scholar]
- Vora P., Venugopal C., Salim S.K., Tatari N., Bakhshinyan D., Singh M., Seyfrid M., Upreti D., Rentas S., Wong N. The rational development of CD133-targeting immunotherapies for glioblastoma. Cell Stem Cell. 2020;26:832–844 e836. doi: 10.1016/j.stem.2020.04.008. [DOI] [PubMed] [Google Scholar]
Associated Data
This section collects any data citations, data availability statements, or supplementary materials included in this article.
Data Availability Statement
No datasets were generated or analyzed during this study.