Abstract
The Drosophila trachea, as the functional equivalent of mammalian blood vessels, senses hypoxia and oxygenates the body. We show that the adult intestinal tracheae are dynamic and respond to enteric infection, oxidative agents, and tumors with increased terminal branching. Increased tracheation is necessary for efficient damage-induced intestinal stem cell (ISC)-mediated regeneration and sufficient to drive ISC proliferation in undamaged intestines. Gut damage or tumors induce Hif-1α/Sima, which stimulates tracheole branching via the FGF(Branchless/Bnl)/FGFR(Breathless/Btl) signalling cascade. Bnl/Btl signalling is required in the intestinal epithelium and the trachea for efficient damage-induced tracheal remodelling and ISC proliferation. Chemical or Pseudomonas-generated ROS affect the trachea directly and are necessary for branching and intestinal regeneration. Similarly, tracheole branching and the resulting increase in oxygenation are essential for intestinal tumor growth. We have identified a mechanism of tracheal-intestinal tissue communication, whereby damage and tumors induce neo-tracheogenesis in Drosophila, a process reminiscent of cancer-induced neoangiogenesis in mammals.
Introduction
The Drosophila trachea, a network of ramified oxygen-transporting tubes, is the functional equivalent of the mammalian vasculature1,2. It encompasses highly plastic cells, the terminal tracheal cells (TTCs) that extend cytoplasmic tubular processes, the terminal branches (TBs) or tracheoles, towards oxygen-needy tissues. Developmental cues drive TTC formation, and oxygen regulates TB remodelling: low oxygen (hypoxia) induces, whereas increased oxygen (hyperoxia) suppresses tracheole formation3–5. Therefore, the TTCs are oxygen sensors equivalent to the mammalian tip cells6. Hypoxia controls TB formation via the Hypoxia-inducible Factor-1α(Hif-1α)/Similar(Sima)4. Sima activates expression of non-tracheal FGF/Branchless(Bnl) and tracheal FGFR/Breathless(Btl) to orchestrate TTC remodelling in Drosophila larvae7, similar to Hif-1α in mammalian angiogenesis8. However, our knowledge about the adult tracheal maintenance and remodelling is limited.
The Drosophila adult midgut is an excellent system to study stem cell regeneration and tissue communication upon damage and aging9–12. The midgut is an apicobasally-polarized epithelium comprised of intestinal stem cells (ISCs), and their progeny, the transient enteroblasts (EBs) and pre-enteroendocrine cells (pre-EEs), which differentiate to lumen-facing absorptive enterocytes (ECs) and secretory enteroendocrines (EEs), respectively13–15. Visceral muscles (VM) ensheath the epithelium, support midgut peristalsis, supply a basement membrane and contribute signals to the ISC niche16,17. Outside the VM lie the visceral tracheae that branch extensively and penetrate the VM to access the intestinal epithelium18 to supply it with oxygen internalized via the spiracles19,20. Enteric infection damages the intestinal epithelium and induces ISC-mitoses, that facilitate regeneration21–23. Ingestion of ROS-like chemicals (hydrogen peroxide (H2O2), Paraquat (PQ)), and tissue-damaging agents (bleomycin, dextran sulfate sodium) also induce ISC-mediated gut regeneration24–26. Regeneration is controlled by paracrine niche signals activating conserved signalling cascades, including the JNK, Jak/Stat, Wnt/Wg, Hippo/Yki and EGFR 10,27. The intestinal tracheae contribute niche signals for ISC maintenance18, respond to nutritional cues28, and associate with metastatic tumors29. However, a mechanistic study on the role of the trachea in gut regeneration and tumorigenesis has not yet been described.
We have investigated the signals mediating communication between the trachea and the intestinal epithelium. We show that the adult midgut-associated tracheae increase their terminal branching in response to infection, oxidative stress, and tumors. Increased tracheation is necessary for robust ISC regeneration and tumor growth. By comparing responses in normoxia and hypoxia, we show that the availability of oxygen, transported to the epithelium via the TTCs, is essential for ISC-mediated regeneration.
Results
Intestinal tracheal remodelling is necessary for ISC mitosis
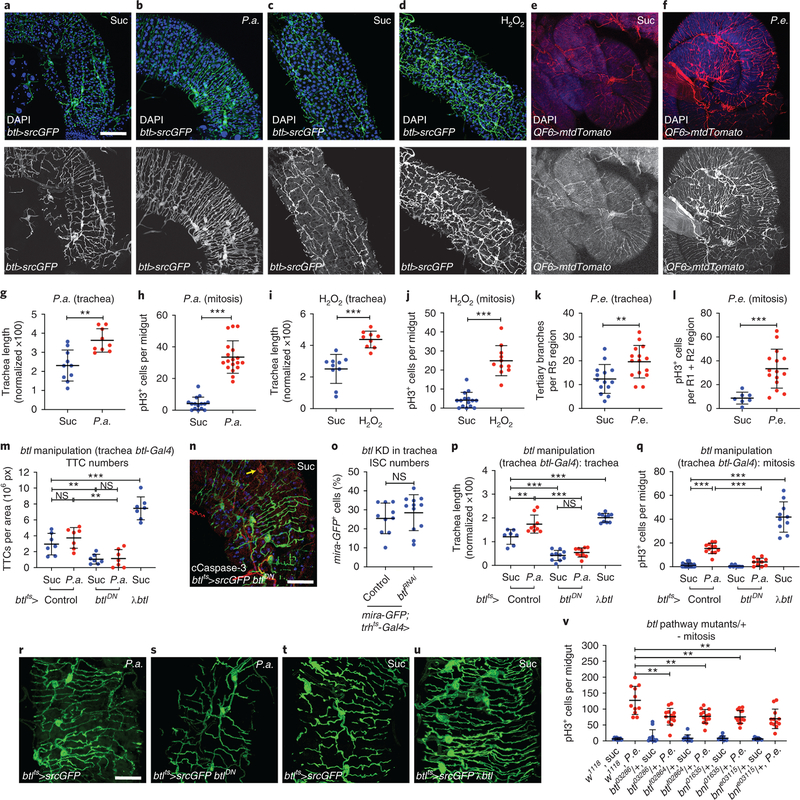
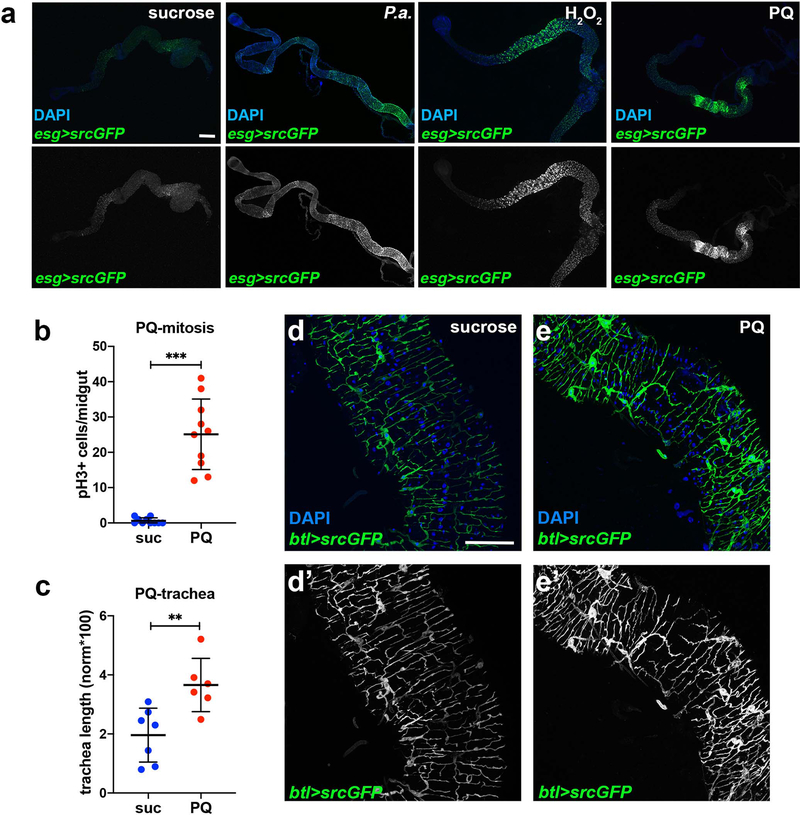
The trachea actively regulates the metabolic status of adult tissues18,28. To assess if damaging and regeneration-promoting agents induce intestinal tracheal branching, we subjected wild-type flies to different stresses known to induce ISC proliferation by damaging the intestinal epithelium21–24 (Fig. 1a–l). We fluorescently-labeled the trachea either via the Gal4-UAS system30 using the trachea-specific btl-Gal4>UAS-srcGFP31 or via the QF-QUAS system32 using the QF6>QUAS-mtdTomato that exhibits tracheal expression (Fig. 1; Extended Data Fig. 1). The flies were infected orally with pathogenic bacteria (Pseudomonas aeruginosa (P.a.), Pseudomonas entomophila (P.e.)) or fed with oxidative agents, such as H2O2 or PQ. All treatments led to significantly increased esg>GFP-positive midgut cells (Extended Data Fig. 1a) and ISC proliferation (Fig. 1h,j,l, and Extended Data Fig. 1b). Strikingly, Pseudomonas infection and oxidative agents also induced an increase in the midgut-associated tracheoles (Fig. 1a–f; Extended Data Fig. 1c–e). We quantified tracheal coverage using confocal images with fluorescently-labeled trachea or bright-field images of detergent-free midgut preparations. In the latter, the air maintained in the tubes offered contrast. Then, we measured the total length of the tracheae overlaying the midgut using NeuronJ (an ImageJ plugin) and we normalized to the gut surface. In some cases (e.g. Fig. 1k), we measured the number of TBs in specific midgut regions. Image quantification confirmed the imaging observations (Fig. 1g,i,k; Extended Data Fig. 1c). To exclude the possibility that extensive tracheal branching was caused by increased TTC numbers, we measured the TTCs in uninfected and P.a.-infected midguts. We found that infection did not alter the number of midgut TTCs (Fig. 1m). We did not observe any intestinal TTC undergoing mitosis either in control or in damaged conditions. Thus, direct epithelial damage caused by infection or ROS increases ISC proliferation and reorganizes the adult intestinal tracheoles.
Figure 1. Remodelling of visceral TTCs covering the midgut is associated with ISC proliferation.
a-f. The adult intestinal trachea is increased upon P.a. infection (a, b), administration of H2O2 (c, d) and P.e. infection (e, f). The intestinal TTCs were labeled with btl-Gal4>UAS-srcGFP in a-d and with QF6>QUAS-mtdTomato in e-f, and DAPI (blue) labeled all nuclei in a-f. The R5 midgut region was imaged in a-b, the R2 region in c-d and the R4-R5 region in e-f. Single channel images of the trachea are shown in a’-f’. g-l. Quantification of TTC branching and mitosis upon P.a. infection (g, n=10,9 and h, n=15,18), administration of H2O2 (i, n=10,9 and j, n=15,11) and P.e. infection (k, n=14,15 and l, n=7,15). m. Quantification of TTCs upon trachea-specific btl manipulation with or without P.a. infection (n=7 each). n. Tracheae (green) and cleaved Caspase-3 (red) upon trachea-specific btl knockdown. o. Quantification of mira-GFP-positive ISCs upon trachea-specific btl knockdown via trh-Gal4 (n=10,12). p-q. Quantification of TTC branching (p, n=7,9,10,10,10) and mitosis (q, n=35,12,8,10,10) upon trachea-specific btl manipulation with or without P.a. infection. r-u. Tracheae (green) of P.a.-infected R5 regions of the midgut in btl-Gal4>UAS-srcGFP control (r) and btl-Gal4>UAS-srcGFP, UAS-btlDN-expressing (s), as well as control (t) versus btl-Gal4>UAS-srcGFP, UAS-λbtl-expressing flies (u). v. Quantification of midgut mitosis of flies heterozygous for btl pathway mutations with or without P. e. infection compared to controls (n=9,11,11,13,11,13,10,14,9,12). Scale bars: 75 μm in a-d, 60 μm in e-f, 37.5 μm in n, r-u. Data are presented as mean values ± SD. Statistical significance (t-tested, two-sided): ns, not significant, * 0.01<p≤0.05, ** 0.001<p≤0.01 and *** p≤0.001.
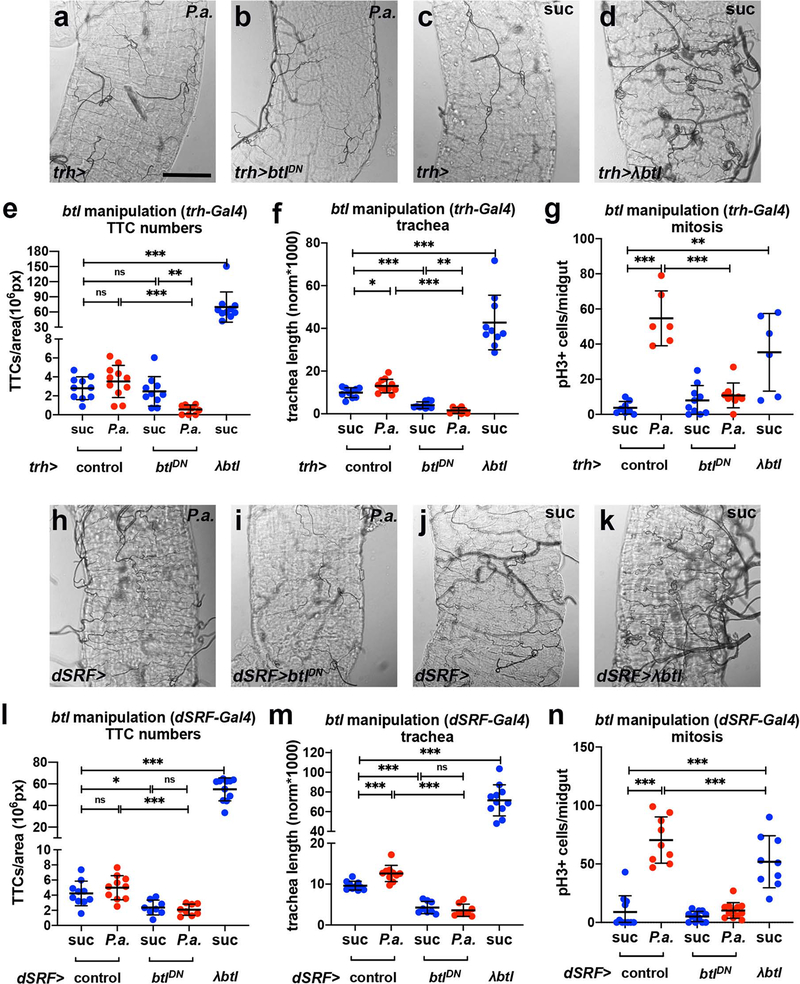
Since the FGFR/Btl pathway is integral to tracheal formation and remodelling during development1,2, we reasoned that its manipulation might affect adult intestinal tracheole dynamics. To assess whether the FGFR/Btl is necessary in the trachea for maintenance and remodelling, we overexpressed a dominant-negative form of Btl, btlDN, specifically in the adult trachea using btlts-Gal4. We noticed that files with trachea-specific btl inhibition had fewer intestinal TTCs in uninfected and P.a.-infected conditions (Fig. 1m). TTC apoptosis was evident by cleaved Caspase-3 staining (Fig. 1n). Importantly, trachea-specific btl knockdown did not alter the number of mira-GFP-positive ISCs (Fig. 1o) in uninfected midguts, confirming that the mitosis impairment was not due to fewer ISCs. Upon P.a. infection, flies expressing btlDN in the adult trachea under btlts-Gal4 exhibited reduced tracheation relative to controls (Fig. 1r–s). When we overexpressed a constitutively-active form of Btl, λbtl, in the trachea, we found that it was sufficient to increase intestinal TTCs and TBs in uninfected flies (Fig. 1m,p,t–u). Therefore, trachea-specific increase and decrease of btl activity leads to increased and decreased tracheole density, respectively. To test whether intestinal tracheal remodelling is necessary for damage-induced regeneration, we assessed ISC mitosis in flies with trachea-specific manipulation of btl. We found that P.a.-infected flies expressing btlDN in the trachea exhibited less mitosis, whereas uninfected flies expressing λbtl in the trachea exhibited increased mitosis (Fig. 1q). We confirmed the effects of btl on tracheogenesis and mitosis with two additional trachea-specific drivers (trh-Gal4 and dSRF-Gal4) (Extended Data Fig. 2). Furthermore, to underscore the necessity for the FGFR/Btl pathway in intestinal regeneration upon infection, we subjected heterozygote btlMI03286, btlf02864, bnlMI01635 and bnle03115 mutants to P.e. infection and found significantly-decreased mitosis (Fig. 1v). These results indicate that FGFR/Btl receptor-mediated tracheal branching is critical for ISC regeneration.
FGF/FGFR controls tracheal remodelling and ISC proliferation
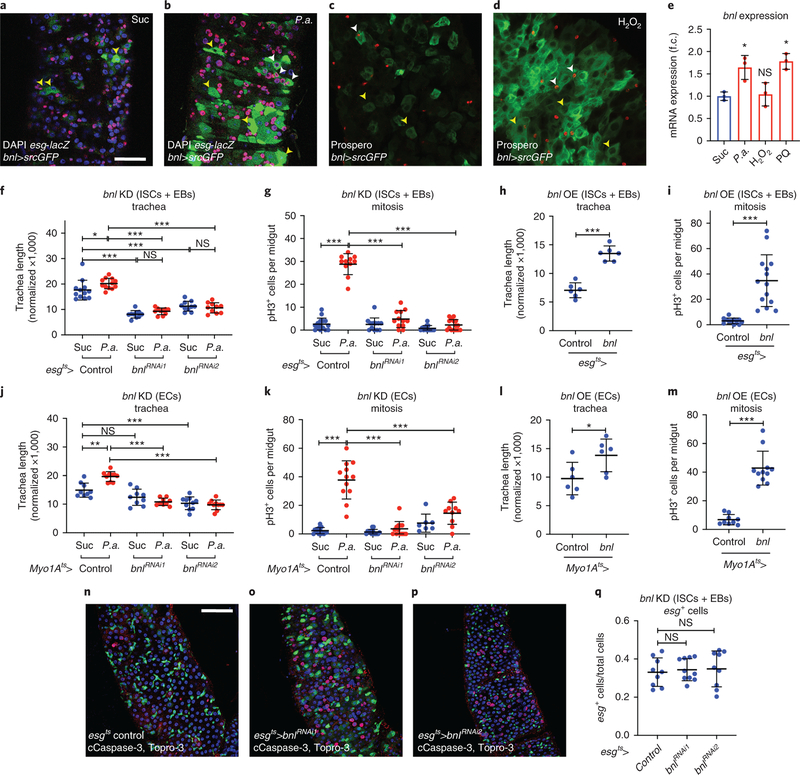
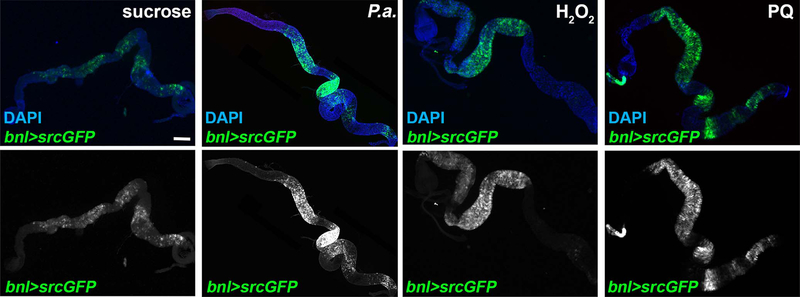
The Drosophila FGF, Bnl, is essential for the directional migration of terminal tracheal cells during embryonic development, and in larvae upon hypoxia3,4,33. To test whether Bnl is involved in damage-induced intestinal tracheogenesis, we examined bnl induction upon different damages. Using bnl-Gal4>UAS-srcGFP, we monitored bnl expression in the adult midgut. We found that bnl was expressed in midgut epithelial cells and P.a., H2O2, or PQ feeding robustly increased the number of bnl-expressing cells (Fig. 2a–d; Extended Data Fig. 3). To confirm that bnl is induced transcriptionally, we performed RT-qPCR in midguts of wild-type w1118 flies at the same time points used for reporter imaging. We found that bnl mRNA was induced by more than 1.5-fold by P.a. and PQ, but not H2O2 (Fig. 2e). The lack of bnl mRNA induction by H2O2 in whole midgut tissue is possibly due to the regional effect of H2O2 evident by the bnl reporter (Extended Data Fig. 3), which can affect the RT-qPCR sensitivity. To identify the specific cell types with bnl expression, we assessed co-localization of bnl-Gal4>UAS-srcGFP with esg-lacZ, Dl-lacZ, Su(H)-lacZ, and Prospero, which report progenitors (ISCs and EBs), ISCs, EBs and EEs, respectively. We also identified mature ECs by their large size. We found that bnl was expressed and induced in all the midgut epithelial cell types (Fig. 2a–d). To assess whether Bnl is involved in tracheal remodeling and mitosis, we knocked-down and overexpressed bnl in adult intestinal progenitors or ECs using esgts-Gal4 or Myo1Ats-Gal4 (Fig. 2f–m; Extended Data Fig. 4a–d), respectively. Progenitor- and EC-specific bnl knockdown reduced tracheal coverage in P.a.- or P.e.-infected midguts (Fig. 2f,j; Extended Data Fig. 4a–b). Furthermore, the ISC proliferation rate upon P.a. (Fig. 2g,k) or P.e. infection (Extended Data Fig. 4c–d) was reduced, suggesting that bnl is necessary for regeneration. To test whether bnl overexpression is sufficient to induce tracheal remodelling in baseline conditions, we overexpressed bnl in intestinal progenitors or ECs. bnl overexpression was sufficient to induce tracheal remodelling (Fig. 2h,l), and it was also sufficient to induce ISC mitoses (Fig. 2i,m). Notably, the viability and number of progenitors upon progenitor-specific bnl knockdown remained unchanged (Fig. 2n–q; Extended Data Fig. 4e). Collectively, our data suggest that damage-induced bnl expression in the midgut epithelium is necessary for ISC proliferation and that bnl is sufficient for TTC remodelling and induction of ISC proliferation in the absence of damage.
Figure 2. The FGF/Bnl is expressed in the midgut epithelium and controls ISC proliferation and TTC remodelling.
a-b. Control (a) and P.a.-infected (b) bnl-Gal4>UAS-srcGFP midguts (R5 region) with esg-lacZ-labeled (red) ISCs and EBs, and DAPI (blue) staining all the nuclei. c-d. Control (c) and H2O2-fed (d) bnl-Gal4>UAS-srcGFP midguts (R2 region) with Prospero-labeled (red) EEs, and DAPI (blue) staining all the nuclei. Yellow arrowheads indicate bnl-positive ECs (big cells) and white arrowheads indicate bnl-positive esg-positive progenitors (a-b) and EEs (c-d). e. RT-qPCR for bnl mRNA expression in w1118 whole adult midguts upon different stresses. The average and standard deviation of n=3 biological expreriments are plotted. f-g. Quantification of TTC branching (f, n=12,12,10,10,10,10) and mitosis (g, n=15,11,12,12,13,15) upon progenitor-specific bnl knockdown with or without P.a infection. h-i. Quantification of TTC branching (h, n=6 each) and mitosis (i, n=12,14) upon progenitor-specific bnl overexpression. j-k. Quantification of TTC branching (j, n=9,10,9,9,10,10) and mitosis (k, n=15,12,13,13,7,10) upon EC-specific bnl knockdown with or without P.a infection. l-m. Quantification of TTC branching (l, n=6 each) and mitosis (m, n=9,11) upon EC-specific bnl overexpression. n-p. Midguts (R5 region) of control (n) and esgts-Gal4 progenitor-specific bnl knockdown (o-p), stained for ISCs+EBs (green), cleaved Caspase-3 (red) and Topro-3 (blue). q. Quantification of esg-positive ISCs+EBs in control and progenitor-specific bnl knockdown (n=9,10,9). Scale bars: 37.5 μm in a-d, 75 μm in n-p. Data are presented as mean values ± SD. Statistical significance (t-tested, two-sided): ns, not significant, * 0.01<p≤0.05, ** 0.001<p≤0.01 and *** p≤0.001.
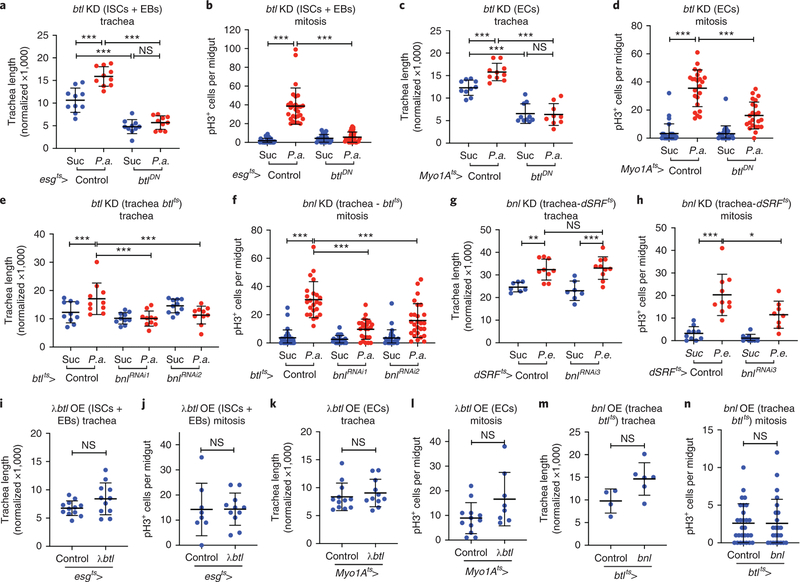
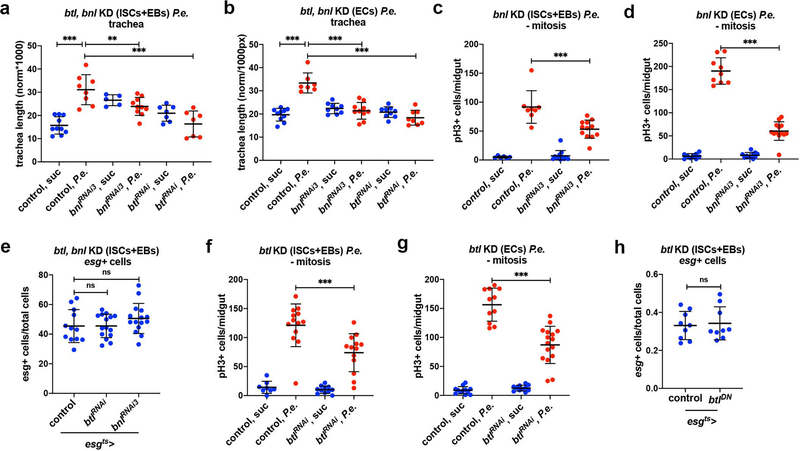
We did not observe btl outside the trachea or bnl outside the intestinal epithelium (Fig. 1a–d, Fig. 2a–d). Nevertheless, because the reporters might not precisely highlight the cells expressing the genes of interest, we tested btl and bnl requirements in the intestinal epithelium and the trachea, respectively. To assess if btl is necessary in intestinal progenitors or ECs, we inactivated btl by overexpressing btlDN or btlRNAi under esgts-Gal4 and Myo1Ats-Gal4, respectively. We found that tracheal branching and ISC mitosis were impaired upon btl inhibition in the epithelium upon infection (Fig. 3a–d; Extended Data Fig. 4a–b,f–g). Importantly, the number of esg-positive progenitors remained unchanged upon progenitor-specific btl downregulation (Extended Data Fig. 4e,h). Thus, intestinal epithelial btl is necessary for mitosis and tracheal remodelling upon infection.
Figure 3. Damage-induced TTC remodelling and ISC mitosis require epithelial FGFR/Btl and tracheal FGF/Bnl.
a-d. Quantification of TTC branching (a, n=10 each, and c, n=10,10,10,9) and mitosis (b, n=31,27,25,30 and d, n=29,23,26,23) upon progenitor-specific (a-b) and EC-specific (c-d) btl knockdown with or without P.a. infection. e-f. Quantification of TTC branching (e, n=10 each) and mitosis (f, n=32,23,27,24,28,27) upon trachea-specific btl knockdown via btlts-Gal4 with or without P.a. infection. g-h. Quantification of TTC branching (g, n=7,9,7,10) and mitosis (h, n=10,10,9,8) upon trachea-specific btl knockdown via dSRFts-Gal4 with or without P.e. infection. i-j. Quantification of TTC branching (i, n=12,11) and mitosis (j, n=8,11) upon progenitor-specific λbtl overexpression. k-l. Quantification of TTC branching (k, n=12,11) and mitosis (l, n=12,8) upon EC-specific λbtl overexpression. m-n. Quantification of TTC branching (m, n=4,6) and mitosis (n, n=28,24) upon trachea-specific λbtl overexpression via btlts-Gal4. The flies were uninfected in i-n. Data are presented as mean values ± SD. Statistical significance (t-tested, two-sided): ns, not significant, * 0.01<p≤0.05, ** 0.001<p≤0.01 and *** p≤0.001.
To assess if bnl functions in the trachea, we silenced it in the adult trachea via the btlts-Gal4 using two independent RNAi lines. We found that tracheal bnl was necessary for damage-induced tracheogenesis and mitosis (Fig. 3e–f). Interestingly, trachea-specific bnl knockdown using dSRFts-Gal4 showed that tracheal bnl was required for infection-induced ISC mitosis, but had no effect on tracheal remodelling (Fig. 3g–h). Thus, bnl is necessary in the intestinal trachea for mitosis and damage-induced tracheole remodelling.
To test if epithelial btl is sufficient to induce ISC mitosis and tracheole remodelling, we overexpressed λbtl in progenitors or ECs using the esgts-Gal4 and Myo1Ats-Gal4. Neither progenitor- nor EC-specific λbtl expression affected tracheal remodelling and ISC mitosis (Fig. 3i–l). To assess if tracheal bnl is sufficient, we overexpressed bnl under btlts-Gal4. We found that trachea-specific bnl overexpression was not sufficient to induce mitosis or tracheal remodelling (Fig. 3m–n). Thus, neither epithelial btl nor tracheal bnl are sufficient to induce mitosis and tracheal remodelling, indicating the requirement for other factors.
Hif-1α/Sima controls tracheogenesis and ISC proliferation
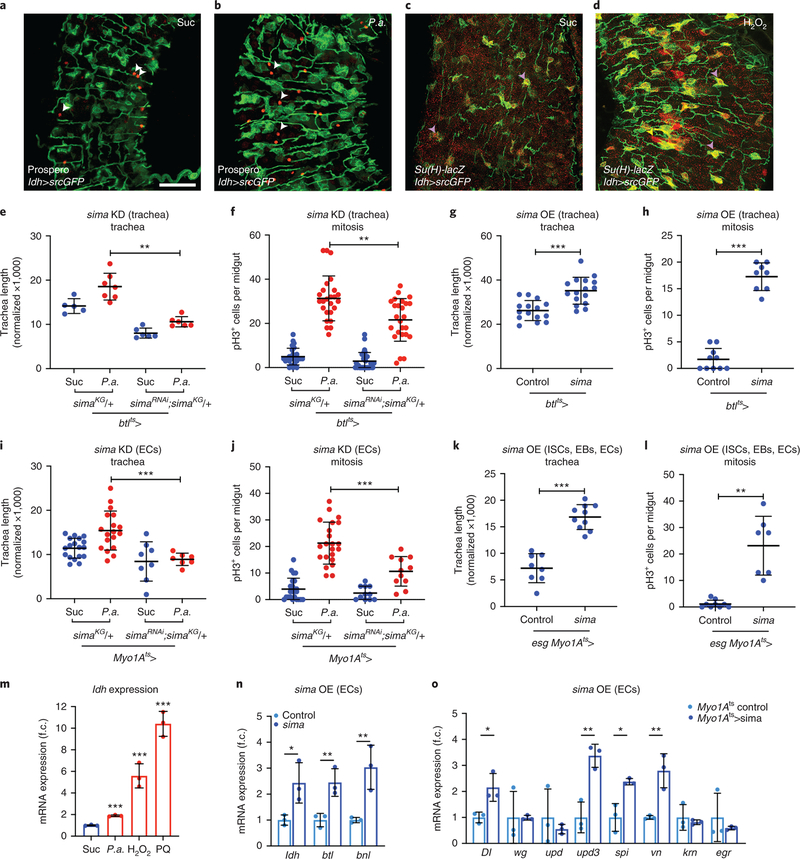
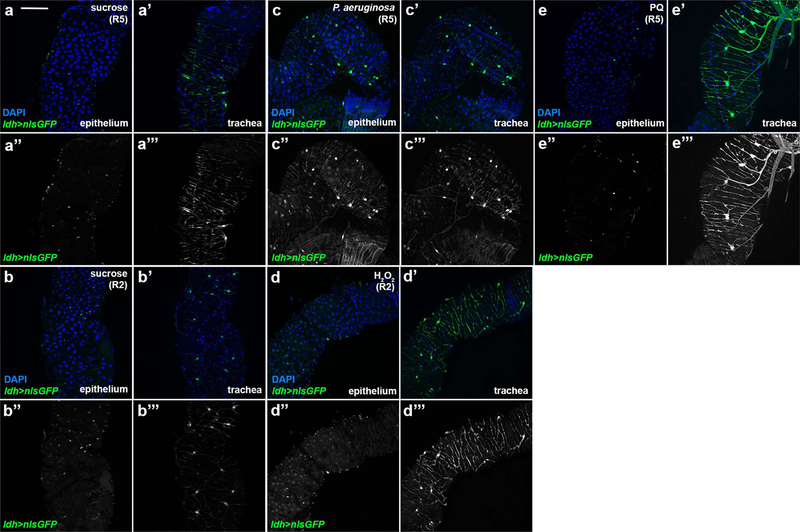
Sima, the Drosophila Hif-1α, controls Btl activity and tracheal remodelling in response to hypoxia in larvae4, and is induced upon epithelial damage and tumors34,35. In mammalian cells, Hif-1α activity is controlled by ROS, produced by mitochondria in moderate hypoxia, and can inhibit the PHD/Hph proteins that promote Hif-1α degradation36–38. In normoxia, Hif-1α activity can be controlled by exogenous ROS, e.g. H2O2, in cultured mammalian cells39. To monitor midgut Sima activity, we reared flies carrying the hypoxia-inducible reporters40 lactate dehydrogenase (ldh)-Gal4>UAS-nlsGFP or ldh-Gal4>UAS-srcGFP in normoxia upon different damages (Fig. 4a–d; Extended data Fig. 5). These Hif-1α/Sima-responsive reporters were expressed weakly in midgut epithelial cells and the trachea in baseline conditions. They were strongly induced in the epithelium and the trachea upon P.a. infection or oxidative damage (Fig. 4a–d; Extended data Fig. 5). To assess whether ldh was induced transcriptionally, we performed RT-qPCR in midguts of wild-type w1118 flies under the same conditions. We found that P.a. and ROS induced ldh mRNA (Fig. 4m). Co-localization experiments showed that ldh was activated in ISCs, EBs and ECs, and rarely in EEs. Importantly, ldh-Gal4>UAS-srcGFP highlighted the terminal branches of the intestinal tracheae (Fig. 4a–d). Sima is, thus, induced in the intestinal epithelium and trachea in response to infection and oxidative stress, suggesting that it may act in both tissues to control tracheal remodelling and intestinal proliferation.
Figure 4. The Hif-1α/Sima is expressed in the midgut epithelium and the visceral trachea, and is necessary and sufficient for ISC proliferation and TTC remodelling.
a-b. Uninfected (a) and P.a.-infected (b) ldh-Gal4>UAS-srcGFP midguts (R5 region) with Prospero-labeled (red) EEs. c-d. Control (c) and H2O2-fed (d) midguts (R2 region) with Su(H)-lacZ-labeled (red) EBs. Purple arrowheads indicate ldh-positive Su(H)-positive EBs and white arrowheads indicate ldh-negative Prospero-positive EEs. e-f. Quantification of TTC branching (e, n=5,7,6,6) and mitosis (f, n=14,13,18,14) with or without P.a. infection in trachea-specific sima knockdown in the background of heterozygous simaKG. g-h. Quantification of TTC branching (g, n=15,16) and mitosis (h, n=10,8) upon trachea-specific sima overexpression in baseline conditions. i-j. Quantification of TTC branching (i, n=18,18,8,7) and mitosis (j, n=24,22,11,11) with or without P.a. infection upon EC-specific sima knockdown in the background of heterozygous simaKG. k-l. Quantification of TTC branching (k, n=8,10) and mitosis (l, n=9,7) upon trachea-specific sima overexpression in baseline conditions. m. RT-qPCR for ldh mRNA expression in w1118 whole adult midguts upon different stresses. n=3 biological experiments. n. RT-qPCR analysis of btl, bnl and ldh upon EC-specific sima overexpression. n=3 biological experiments. o. RT-qPCR analysis of Dl, wg, upd, upd3, spi, vn, krn, and egr upon EC-specific sima overexpression. n=3 biological experiments. The average and standard deviation are plotted in m-o. Scale bars: 37.5 μm in a-d. Data are presented as mean values ± SD. Statistical significance (t-tested, two-sided in f-k, m-o and U-tested in e,l): ns, not significant, * 0.01<p≤0.05, ** 0.001<p≤0.01 and *** p≤0.001.
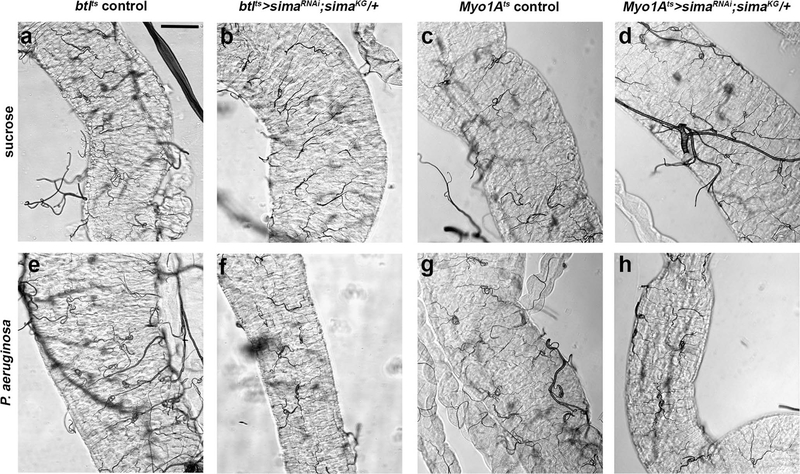
To assess whether Sima induction is necessary for tracheal remodelling and ISC mitoses, we performed tissue-specific loss- and gain-of-function tests. To achieve effective sima silencing, we inactivated sima by tissue-specific RNAi in a heterozygous simaKG07607 mutant background41, in the tracheal cells or ECs. Upon P.a. infection, both tracheal coverage and ISC mitosis were reduced by sima depletion (Fig. 4e–f,i–j; Extended data Fig. 6). To assess if sima is sufficient for tracheal remodelling and intestinal regeneration in baseline conditions, we overexpressed sima4 specifically in adult tracheal cells using btlts-Gal4, and in progenitors and ECs using esgts-Gal4 and Myo1Ats-Gal4, respectively. Overexpression of sima was sufficient to induce tracheogenesis and ISC proliferation without infection (Fig. 4g–h,k–l). Interestingly, sima gain-of-function increased expression of the bnl and btl transcripts, suggesting that both are sima targets (Fig. 4n). Morevover, EC-specific sima overexpression led to increased expression of ISC mitosis regulators, such as genes encoding the Notch ligand Delta (Dl), the Jak/Stat ligand Unpaired 3 (Upd3), and the EGFR ligands Spitz (Spi) and Vein (Vn) (Fig. 4o). Thus, Sima controls midgut TTC remodelling and damage repair acting both in the epithelium and the trachea.
Increased tracheoles induce ISC mitosis only in normoxia
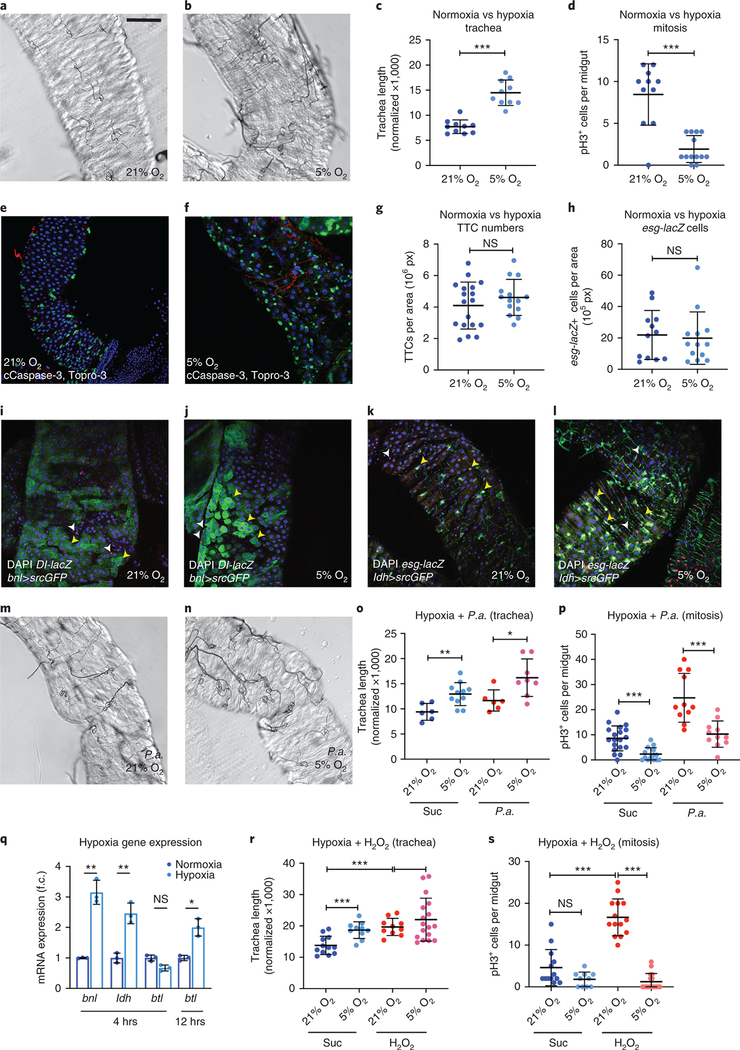
In addition to bacteria and ROS, hypoxia is known to activate Hif-1α, and to affect remodelling of oxygen-carrying blood vessels and trachea, in mammals and insects, respectively42,43. To assess if oxygen availability affects intestinal tracheogenesis, we subjected wild-type flies to hypoxia (5% O2) for 12 hrs and compared them with flies reared in normoxia (21% O2). We found that intestinal tracheal coverage, but not TTC number, was significantly increased in hypoxia-treated flies (Fig. 5a–c, g). Contrary to our expectation, however, we found that intestinal mitosis of wild-type flies was significantly reduced in hypoxia (Fig. 5d). Importantly, hypoxia did not cause progenitor apoptosis (Fig. 5e–f), or reduction in esg-positive cells (Fig. 5h). Hypoxia induced bnl in epithelial cells, and sima in the epithelium and the trachea (Fig. 5i–l). In addition, flies subjected to hypoxia for 4 hrs exhibited increased midgut transcription of bnl and ldh. Midgut btl was induced only after 12 hrs of hypoxia by approximately 2-fold (Fig. 5q). Hypoxia, therefore, induces intestinal tracheal remodelling, but it does not promote ISC mitosis, uncoupling the two processes.
Figure 5. Hypoxia induces TTC branching, but not ISC proliferation.
a-b. Brightfield images of the midgut TTCs (R5 region) of wild-type (w1118) uninfected flies reared in normoxia (21% O2) vs. hypoxia (5% O2). c-d. Quantification of TTC branching (c, n=10 each) and mitosis (d, n=11,13) in normoxia vs. hypoxia. e-f. esg-Gal4>UAS-srcGFP (ISCs+EBs, green) midguts (R5 region) of flies reared in normoxia (e) and hypoxia (f) stained for cleaved Caspase-3 (red) and Topro3 (blue) staining all nuclei. g-h. Quantification of TTCs (g, n=18, 14) and esg-lacZ+ progenitors (h, n=12,13) in normoxia and hypoxia. i-j. Fluorescence images showing normoxia- (i) and hypoxia-reared (j) bnl-Gal4>UAS-srcGFP (Bnl reporter, green) midguts with Dl-lacZ (red) labeling the ISCs and DAPI (blue) staining all nuclei. Yellow arrowheads indicate bnl-positive and Dl-positive progenitors and white arrowheads indicate bnl-negative and Dl-positive progenitors. k-l. Fluorescence images showing normoxia- (k) and hypoxia-reared (l) ldh-Gal4>UAS-srcGFP (Sima reporter, green) midguts with esg-lacZ (red) labeling the ISCs and EBs and DAPI (blue) staining all nuclei. Yellow arrowheads indicate bnl-positive and esg-positive progenitors and white arrowheads indicate bnl-negative and esg-positive progenitors. m-n. Brightfield images of the midgut TTCs (R5 region) of wild-type (w1118) P.a.-infected flies reared in normoxia (21% O2) vs. hypoxia (5% O2). o-p. Quantification of TTC branching (o, n=6,11,6,8) and mitosis (p, n=19,14,11,11) of uninfected and P.a.-infected flies in normoxia and hypoxia. q. RT-qPCR analysis of btl, bnl and ldh in normoxia vs. hypoxia. The average and standard deviation of n=3 biological experiments are shown. r-s. Quantification of TTC branching (r, n=12,10,10,17) and mitosis (s, n=13,10,14,17) of untreated vs. H2O2-fed flies in normoxia and hypoxia. All scale bars: 75 μm. Data are presented as mean values ± SD. Statistical significance (t-tested, two-sided, and U-tested for o): ns, not significant, * 0.01<p≤0.05, ** 0.001<p≤0.01 and *** p≤0.001.
To assess the relationship between infection and hypoxia, which induce tracheal remodelling but affect ISC mitoses oppositely, we infected flies with P.a. while subjecting them to hypoxia. Although tracheal branching was increased in treated flies (Fig. 5m–o), hypoxia significantly suppressed mitosis upon infection (Fig. 5p). To exclude the possibility that hypoxia affected the damaging capacity of bacteria, we tested tracheal branching and mitosis of H2O2-treated flies upon hypoxia. Regardless of the increased tracheal coverage, hypoxia suppressed H2O2-induced mitoses too (Fig. 5r–s). Therefore, increased tracheae induce ISC proliferation only in the presence of oxygen.
ROS induce ISC proliferation via the tracheal niche
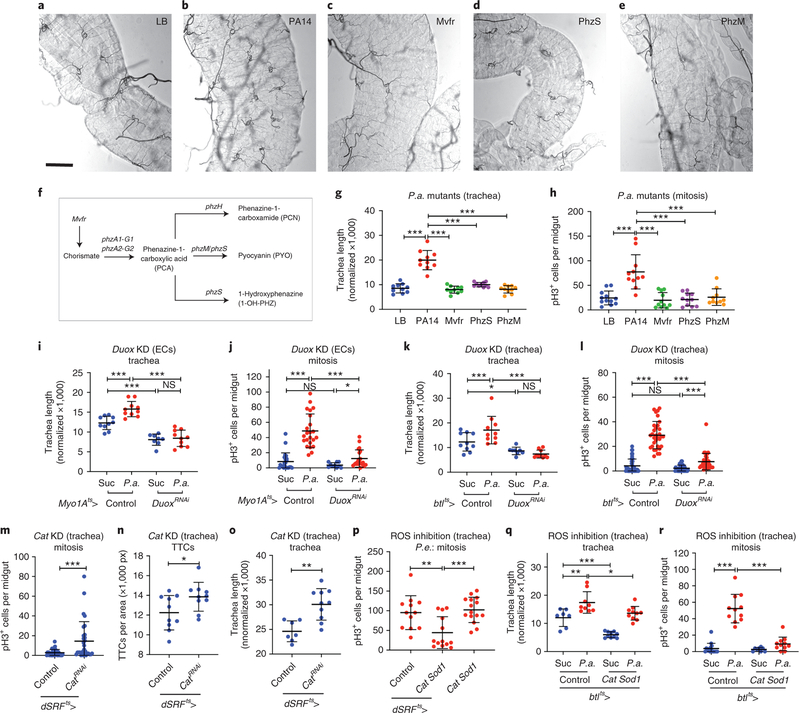
Enteric infection phenocopies oxidative stress with regards to intestinal regeneration and tracheal remodelling. Pseudomonas are extracellular pathogens damaging tissues via secreted virulence factors. The P.a. quorum-sensing MvfR pathway is a master regulator of virulence. Genes involved in phenazine production, including phzS and phzM, control pyocyanin, a ROS-generating secreted virulence factor that provides the blue hue in the P.a. cultures44,45. To assess the role of pyocyanin in intestinal regeneration and tracheogenesis, we fed wild-type flies with bacterial culture supernatants from wild-type P.a. (strain PA14) and MvfR, PhzM and PhzS mutants (isogenic to PA1446). All mutants led to significantly-reduced tracheation (Fig. 6a–g) compared to PA14, accompanied by significant reductions in ISC mitoses (Fig. 6h). Since pathogenic bacteria induce ROS via the Dual Oxidase (Duox)22,47, we assessed the requirement for Duox in P.a.-induced tracheal remodelling and ISC mitosis. To assess if epithelial or tracheal Duox affect regeneration, we silenced Duox in the ECs or the trachea via Myo1Ats-Gal4 and btlts-Gal4, respectively. We found that Duox was necessary in the epithelium and the trachea for induction of tracheal remodelling and mitosis (Fig. 6i–l). Thus, bacterial pyocyanin and host Duox are necessary for tracheal remodelling and intestinal mitosis upon infection.
Figure 6. Stress-responsive increased TTC remodelling is ROS dependent.
a-e. Brightfield images of the midgut TTCs (R5 region) of wild-type (w1118) flies fed on LB (a, negative control) and P.a. culture supernatants of the virulent wild-type PA14 strain (b, positive control), the quorum-sensing mutant MvfR (c), and the phenazine mutants PhzS (d) and PhzM (e). f. Schematic of the P.a. quorum-sensing and phenazine production pathway. g-h. Quantification of TTC branching (g, n=10 each) and midgut mitosis (h, n=12,11,11,11,10) upon P.a. culture supernatant feeding. i-j. Quantification of TTC branching (i, n=10,10,8,10) and midgut mitosis (j, n=22,23,10,21) upon EC-specific Duox knockdown with or without P.a. infection. k-l. Quantification of TTC branching (k, n=10,10,8,10) and midgut mitosis (l, n=42,32,36,36) upon trachea-specific (via btlts-Gal4) Duox knockdown with or without P.a. infection. m-o. Quantification of midgut mitosis (m, n=37,30), TTC number (n, n=10 each) and TTC branching (o, n=7,10) upon trachea-specific (via dSRFts-Gal4) Cat knockdown in uninfected flies. p. Quantification of midgut mitosis upon trachea-specific (via dSRFts-Gal4) Cat and Sod1 overexpression in P.e.-infected flies (n= 12,13,15). q-r. Quantification of TTC branching (q, n=7,9,10,10) and midgut mitosis (r, n=15,11,8,11) upon trachea-specific (via btlts-Gal4) Cat and Sod1 overexpression with or without P.a. infection. All scale bars: 75 μm. Data are presented as mean values ± SD. Statistical significance (t-tested, two-sided): ns, not significant, * 0.01<p≤0.05, ** 0.001<p≤0.01 and *** p≤0.001.
ROS induce ISC mitoses and cell turnover in the fly intestine48,49. However, no report has indicated any direct effects of ROS on the intestinal trachea. We found that bacterial ROS-generators and chemical ROS affected the intestinal trachea (Fig. 1a–l, Fig. 6a–h and Extended data Fig. 1) via Sima. To address the role of tracheal ROS in damage-induced tracheal remodelling and mitosis, we genetically modulated ROS levels or activity directly in the trachea and measured tracheation and ISC proliferation. Trachea-specific knockdown of the antioxidant Catalase A (Cat) in uninfected conditions led to increased ISC mitosis, accompanied by increased tracheole branching without differences in TTC numbers (Fig. 6m–o). This suggests that ROS exist in tracheal branches and affect the epithelium. When antioxidants, Cat and Superoxide dismutase 1 (Sod1), were overexpressed in the adult trachea, the infection-induced ISC proliferation was severely restricted (Fig. 6p,r). Trachea-specific overexpression of Cat and Sod1 also led to significantly reduced tracheae (Fig. 6q). Our results suggest that flies remodel their intestinal tracheoles in response to ROS-mediated tissue damage that induces Sima in both the midgut epithelium and the trachea. In normoxia, increased tracheogenesis increases oxygen supply, which is necessary for efficient ISC regeneration.
ISC-derived tumors induce and require tracheal arborization
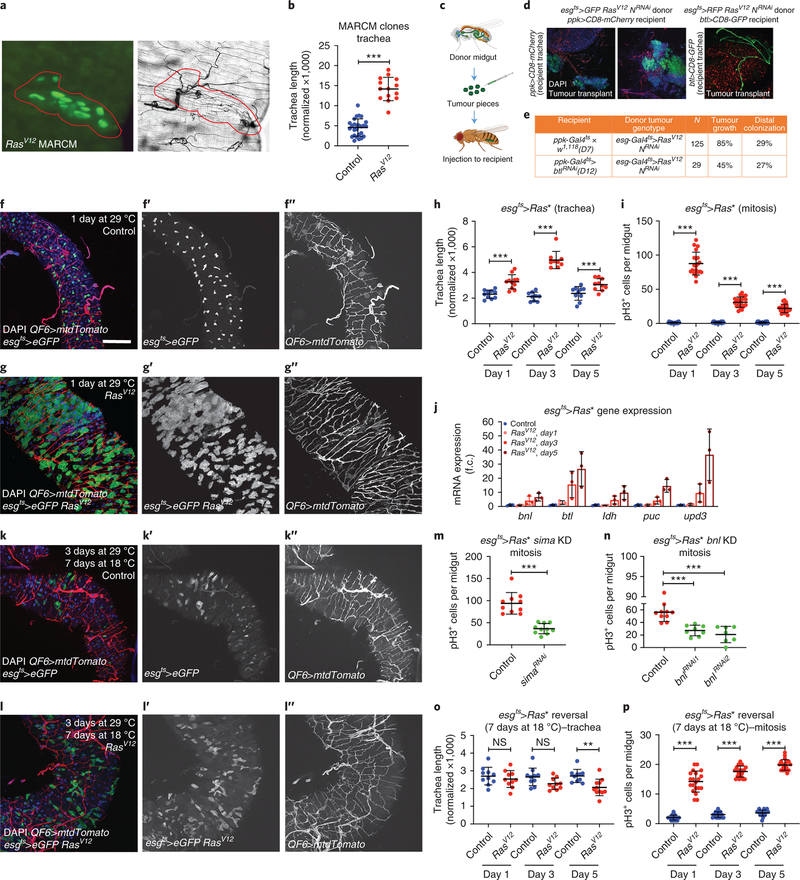
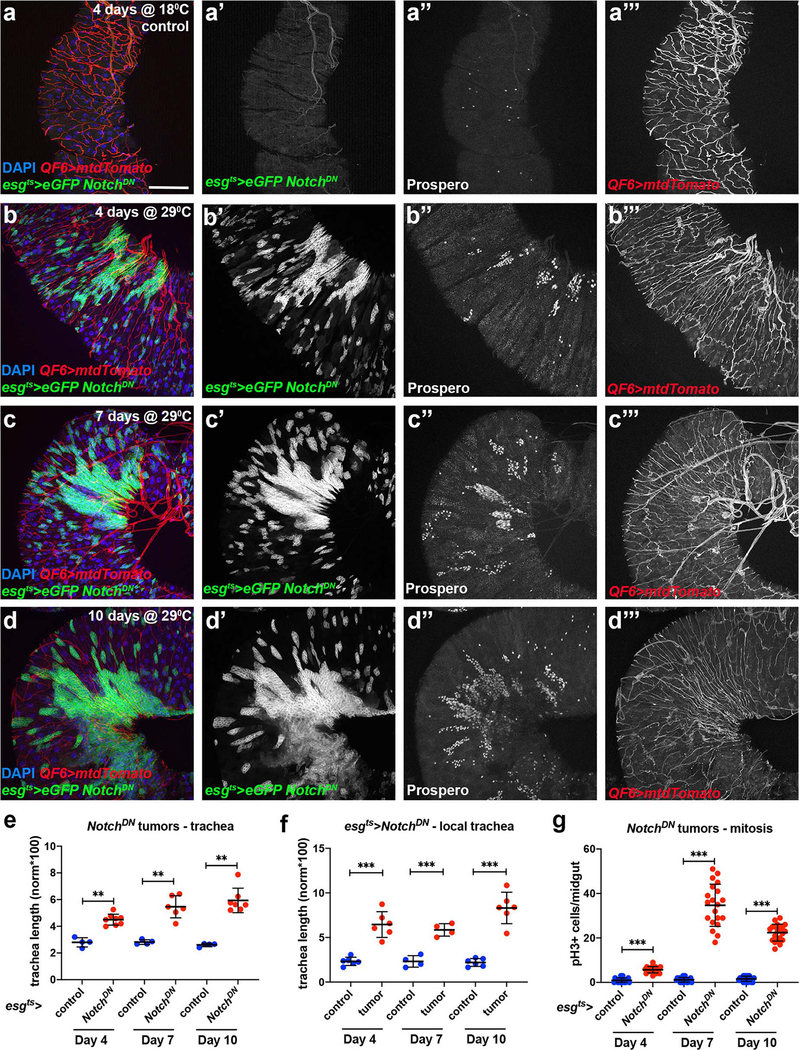
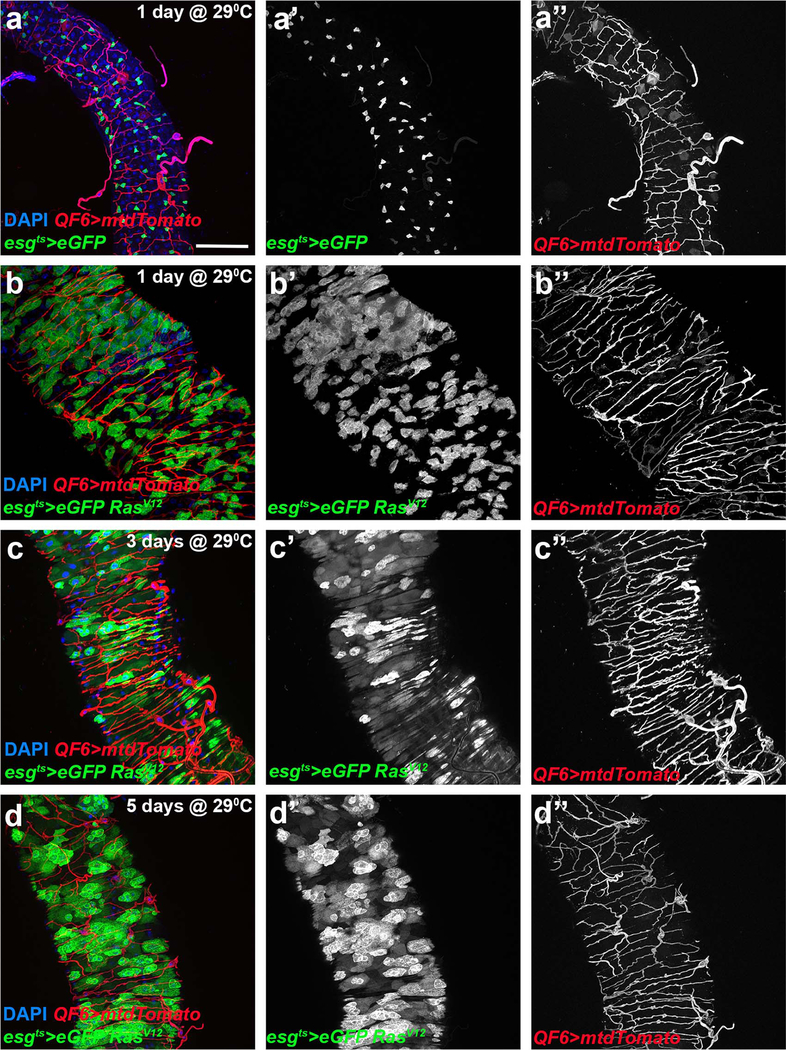
Neoangiogenesis is a hallmark of mammalian cancer50. While differentiation of tumor cells into trachea has been suggested34,51 and tumor-trachea association has been reported29 previously, no study has examined the role of the Drosophila trachea in tumorigenesis. To investigate whether Drosophila ISC-derived tumor development associates with increased tracheal branching (“neo-tracheogenesis”), we generated MARCM clones expressing the RasV12 oncogene in the adult midgut. We observed increased tracheole density in the tumor compared to the surrounding tissue (Fig. 7a). Tracheal length measurements of intestines carrying control versus RasV12 MARCM clones indicated increased tracheation in the RasV12 (Fig. 7b). To test the trachea requirements for tumor growth, we transplanted progenitor-derived GFP- or RFP-labeled RasV12NotchRNAi tumor masses into recipients with mCherry- or GFP-labeled trachea, respectively, and found that wild-type recipient tracheae were recruited to the transplants (Fig. 7c–d). Furthermore, we transplanted RasV12NotchRNAi tumor masses into wild-type recipients or recipients with trachea-specific btl knockdown. We found that 85% of the transplants survived and grew in wild-type recipients. However, only 45% survived in the trachea-specific btlRNAi-expressing recipients, and the tumor masses grew substantially smaller (Fig. 7e). Furthermore, we generated flies bearing ISC-derived tumors by expressing a dominant negative form of the Notch tumor suppressor (NotchDN) or activated forms of the Ras GTPase (RasV12 or RasQ13) (Fig. 7; Extended data Fig. 7–8) in adult intestinal progenitors. In all genotypes we observed increased tracheation either by fluorescent tracheal labeling (Fig. 7f–g, k–l, Extended data Fig. 7–8) or by brightfield microscopy (Fig. 7a–b, Fig. 8a). To achieve simultaneous labeling of the tumors and the trachea, we combined Gal4/Gal80ts/UAS30,52 with QF/QUAS32 to visualize the tumors with eGFP and the trachea with membrane-targeted mtd-Tomato. We performed time-course analysis for the NotchDN and the RasV12 tumors to simultaneously assess their development and tracheation. We found that NotchDN caused slow-progressing, regional tumorigenesis, whereby tumors developed gradually and were clearly visible in the R4a (P1) region of the midgut53,54 after 4 days of induction (Extended data Fig. 7). The RasV12-expressing tumors developed rapidly. Their growth was noticeable 1 day post-induction (Fig. 7g), and eGFP-positive cells almost covered the midgut 3 days after tumor initiation (Extended data Fig. 8). In both genotypes, tumor growth correlated with an expansion of TTC branching. Quantification of the intestinal trachea (tracheal branch length normalized to the midgut surface in the R4a region for NotchDN and throughout the midgut for RasV12) showed significant and gradual increases in the tumorous midguts (Fig. 7f–h, Extended data Fig. 7a–d; e-g; Extended data Fig. 8). Further, the tumor-bearing midguts encompassed more mitotic cells (Fig. 7i, Extended data Fig. 7g). Similarly, double RasV12NotchRNAi tumors exhibited increased tracheation (number of tertiary tracheal branches in R5), and mitoses (Fig. 8a,c–d). These results suggest that the trachea is induced by the tumor and is necessary for its growth, and that tracheal branches are needed for this process.
Figure 7. Midgut ISC-derived tumors induce TTC branching required for tumor growth.
a. Midgut RasV12 MARCM clone (green) and corresponding brightfield image (a’) of the trachea. b. Quantification of TTC branching in tumorous RasV12 clone-bearing midguts vs control clone-bearing midguts (n=26,14). c. Schematic of the transplant experimental process. d. Fluorescently-labeled midgut tumor pieces from a donor fly are transplanted to a recipient fly with fluorescently-labeled trachea. Images showing GFP+ green tumors (first two images) recruiting CD8-mCherry marked tracheae from the recipient. The third image shows RFP+ (red) tumor mass overlayed with CD8-GFP+ (green) recipient trachea. e. Table showing comparison of the growth ability and survival of transplanted tumors in wild-type or trachea-defective (ppk-Gal4>UAS-btlRNAi) recipients. f-g. The R5 region of control esg-Gal4 UAS-eGFP tub-Gal80ts (f) and esg-Gal4 UAS-eGFP tub-Gal80ts>UAS-RasV12-tumor (g) bearing midguts with concomitant expression of QF6>QUAS-mtdTomato (red) to label the trachea reared for 1 day at 29°C. DAPI (blue) was used to label all midgut nuclei. f’- g’, and f”-g” show the individual channels for the eGFP and the Tomato-labeled trachea, respectively. h-i. Quantification of TTC branching (h, n=10,11,9,9,10,10) and midgut mitosis (i, n=20 each) in control and RasV12-tumor bearing flies during a time-course analysis at 1, 3, and 5 days post-tumor induction. j. qRT-PCR analysis of btl, bnl, ldh, puc and upd3 upon RasV12 tumor progression. The average and standard deviation of n=3 biological experiments are plotted. k-l. Control genotype and RasV12 tumor reversal (3 days at 29°C followed by 7 days at 18°C). k’-k” and l’-ll” show the individual channels for eGFP and the Tomato-labeled trachea, respectively. m-n. RasQ13 tumor mitosis in the presence or knockdown of sima (m, n=10 each), and bnl (n, n=10,8,7). o-p. Quantification of TTC branching (o, n=10,10,10,10,10,11) and midgut mitosis (p, n=20 each) in control and RasV12 following reversal of the tumors after 1, 3, and 5 days post tumor initiation. Data are presented as mean values ± SD. All scale bars: 75 μm in f-g, k-l. Statistical significance (t-tested, two-sided): ns, not significant, * 0.01<p≤0.05, ** 0.001<p≤0.01 and *** p≤0.001.
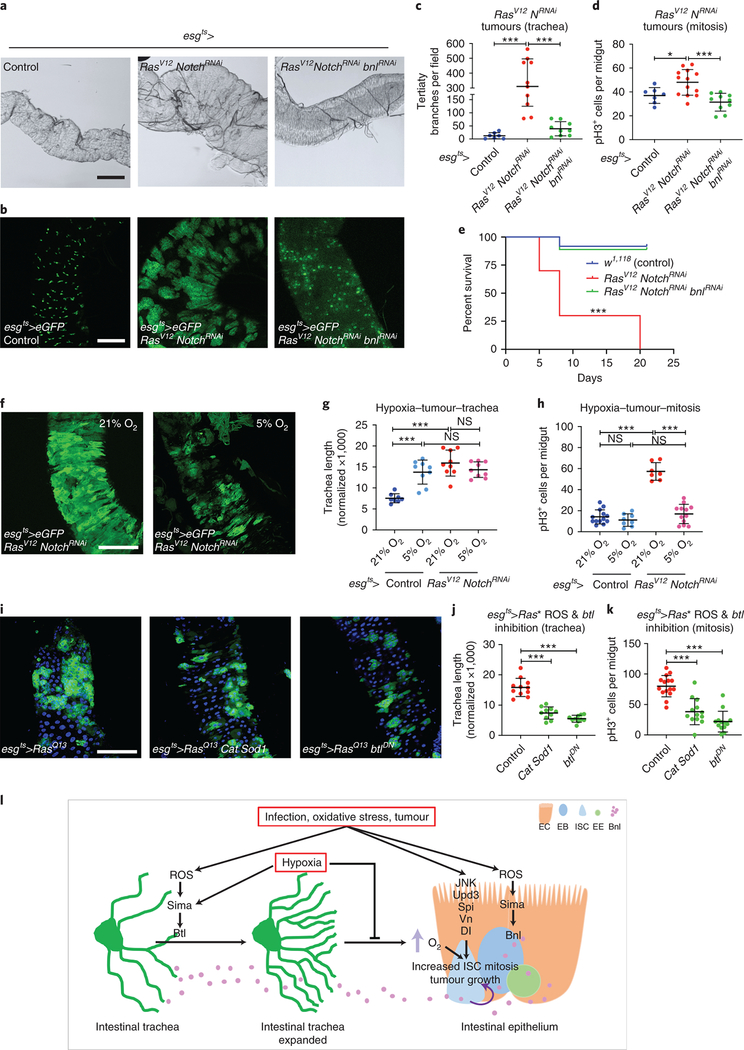
Figure 8. Tumor-induced increased tracheal coverage, oxygen supply, and ROS are necessary for tumor growth.
a-d. Brightfield images of the TTCs (a) and fluorescent images of the GFP-positive (b) progenitor or progenitor derived tumor cells in control midguts, midguts bearing esg-Gal4 UAS-eGFP tub-Gal80ts>UAS-RasV12 UAS-NotchRNAi tumors, and esg-Gal4 UAS-eGFP tub-Gal80ts>UAS-RasV12 UAS-NotchRNAi co-expressing UAS-bnlRNAi. Quantification of TTC branching (c, n=7,10,11) and mitosis (d, n=7,13,10) in control, RasV12 NotchRNAi and RasV12 NotchRNAi bnlRNAi tumor-bearing flies. e. Percent survival of control, RasV12 NotchRNAi and RasV12 NotchRNAi bnlRNAi tumor-bearing flies (n=160,78,120). f-h. Images showing growth of RasV12 NotchRNAi tumors (f), quantification of TTC branching (g, n=8,9,9,9) and midgut mitosis (h, n=13,8,7,12) in control and RasV12 NotchRNAi tumor-bearing flies in normoxia vs. hypoxia. i-k. Images showing tumorous midguts (R5 region) with progenitor derived RasQ13 tumors (green) with Cat and Sod1 overexpression or btl knockdown. Quantification of TTC branching (j, n=11,10,10) and midgut mitosis (k, n=15,13,13) in the same genotypes. Scale bars: 200 μm in a, 100 μm in b and 75 μm in f and i. l. Model of the intestinal trachea-midgut communication during damage-induced regeneration. Data are presented as mean values ± SD. The Kaplan-Meier method was used to test significance in e. For all others, a two-sided t-test was used: ns, not significant, * 0.01<p≤0.05, ** 0.001<p≤0.01 and *** p≤0.001.
To assess whether tumors induce btl, bnl and sima similar to infection and oxidative damage, we performed RT-qPCR on tumorous midguts and compared them to wild-type controls. We found that RasV12 tumors upregulated, as expected, damage-induced genes, such as puckered (puc) and upd3, and that btl, bnl and ldh (the Sima activity reporter) were also upregulated (Fig. 7j). To assess the requirement for sima, we silenced sima in the tumor cells, and found reduced tumor mitoses (Fig. 7m). To assess the requirement for bnl, we silenced bnl in the tumor cells, wherein tumor size, mitoses, and tracheal coverage were found reduced (Fig. 7n and Fig. 8a–d). Further, we performed survival experiments on tumor-bearing flies with or without bnlRNAi in the tumors. We found that bnl silencing in the tumors significantly increased survival of the tumor-bearing flies (Fig. 8e). Collectively, these results suggest that the activation of sima and bnl in intestinal tumors induces tracheal outgrowth, which enhances tumor growth.
To assess whether induction of tracheal remodelling is a reversible feature of growing tumors, we discontinued RasV12 expression 1, 3 and 5 days after induction by shifting the flies from 29°C to 18°C (Fig. 7k–l). We found that RasV12 tumor growth and associated tracheation were reversed by switching RasV12 expression off for 7 days, 1, 3, or 5 days post-oncogene induction (Fig. 7o–p; also compare to Fig. 7h–i). Since increased tracheal branching was associated with increased ISC proliferation only in normoxia, we hypothesized that tumor growth would be reduced in hypoxia. To test this, we reared tumor-bearing flies under hypoxia. Both tumor size and ISC proliferation were reduced by hypoxia, although no significant difference in intestinal tracheal coverage was observed between normoxia and hypoxia (Fig. 8f–h). Thus, during tumorigenesis, the visceral trachea expands TBs to accommodate the extra metabolic needs of the growing tumors and to sustain tumor mitoses. In hypoxia, however, due to the limited oxygen availability to the tumor, regardless of expanded tracheation, tumor growth is reduced.
Furthermore, to assess the involvement of ROS in tumor growth and tracheal remodelling, we inhibited ROS in the tumor by overexpressing Cat and Sod1. We found that tumor growth, mitosis and tracheole branching were reduced (Fig. 8i–k). Finally, to test if btl has a non-tracheal role in the growing tumors, as previously suggested51, we inactivated btl by overexpressing btlDN in the RasV12 tumorous midguts. We found that btl is necessary for tumor growth, mitosis and tracheole branching (Fig. 8i–k). Thus, ROS and btl are necessary for tumor mitosis and tracheole remodelling.
Discussion
Angiogenesis is the process by which oxygen-carrying blood vessels are remodeled physiologically55. This process can go awry during inflammatory diseases and is a recognized cancer hallmark50,56. Studies in cell culture and vertebrate models have established the link between tumor growth and angiogenesis57–59 that implicates hypoxia and the Hif-1α pathway60,61. Despite the identification of several tumor angiogenesis regulators, including VEGF, PDGF, and FGF58,62, we know little about the environmental factors contributing to their induction and whether they are induced in non-tumor contexts. Here we show that infection, oxidative damage and tumors induce intestinal tracheole branching in Drosophila adults that supports regenerative and tumor growth. Independent evidence for the role of tracheogenesis in regeneration of the damaged Drosophila intestine is also presented in an accompanying study63.
During development, branching morphogenesis is triggered by cell-cell communication between Btl-expressing tracheae and Bnl-expressing cells1. Not much is known, however, about adult tracheogenesis, or the role of non-tracheal Btl functions in tracheogenesis. We know that insulin/oxygen-sensitive neurons control adult intestinal tracheal plasticity in response to nutrition, and that tracheal arborization affects metabolism, e.g. lipid storage28. Whether neurons also regulate damage-induced tracheal branching and ISC proliferation requires further inquiry. Remarkably, hypoxic Drosophila wing disc tumor cells stabilize Sima, induce bnl, while a subset of them express the btl transcriptional inducer, Trachealess64, and differentiate into tracheae in ways reminiscent of mammalian angiogenesis34. Also, Sox21a mutant midgut tumors induce btl unconventionally in the tumor51. Furthermore, a tracheal role in tumor oxygenation has been suggested from ISC-derived Apc-Ras tumors expressing Snail, which encompass migratory cells that envelope the intestinal trachea, using it as a scaffold29. We show that the trachea actively regulates tumor growth and is an essential part of niche modification by the tumor for its growth and survival.
We found that tracheal btl and epithelial bnl are necessary and sufficient for tracheogenesis and ISC mitosis. Surprisingly, we also found that epithelial btl and tracheal bnl are necessary for damage-induced regeneration, thus, uncovering an unconventional role for Btl. Of note, we observed an inconsistency in the tracheal bnl knockdown: bnlRNAi driven by btlts-Gal4 affected both mitosis and tracheogenesis, but bnlRNAi driven by dSRFts-Gal4 only impaired mitosis. These results could be explained by the different strength of the drivers: btl-Gal4 is expressed broadly and strongly in all the tracheae, whereas dSRF-Gal4 is a TTC-specific driver, weaker than btl-Gal4. Strikingly, overexpression of btl in the epithelium and bnl in the trachea were not sufficient to induce tracheole remodelling or ISC mitosis, suggesting that these sources are playing secondary roles. Tracheal Btl is abundant, and its sensitivity to the variable-level and multi-source epithelial Bnl directly controls tracheal branching, and consequently, ISC mitosis. On the other hand, epithelial Btl and tracheal Bnl are present at lower levels in the intestine to fine-tune ISC mitosis and, in turn, indirectly impinge on tracheal remodelling.
We show that upon midgut damage, both Btl and Bnl are regulated by Sima. This is reminiscent of the effects of Sima in hypoxic larvae4. However, in the normoxic gut the trigger for Sima is ROS. ROS are byproducts of oxygen metabolism within cells and have a role in regeneration and injury response in Drosophila and mammals49,65–67. In mammals, ROS regulate angiogenesis in a tissue-specific manner: they suppress angiogenesis in diabetic mice, but enhance placental angiogenesis during pregnancy68,69. Epithelial tumors induce ROS-mediated signalling to proliferate in mammals and Drosophila49,70,71. Pathogens and commensals induce intestinal ROS-producing Duox and Nox, respectively, as a defense mechanism72–74. Upon P.e. infection, intracellular ROS produced in ECs by Nox are necessary for intestinal regeneration49. Duox is highly expressed in barrier epithelia, including the Drosophila trachea75, but its tracheal role in intestinal growth has recently emerged76. We show that Duox is required in both the trachea and the epithelium for tracheogenesis and regeneration upon infection. Overall, our data suggest that exogenous and intestinal ROS act coordinately in the trachea and the epithelium for regeneration.
We propose that intestinal homeostasis is maintained by the availability of oxygen supply to the midgut epithelium through the tracheoles. Tracheal branching is dynamically regulated by ROS- and oxygen-dependent signalling emanating from the epithelium. Thus, a feed-forward loop of ROS-induced tracheal branching increases oxygen supply to the epithelium. We suggest that increased oxygen availability drives ISC mitosis by impinging on key damage/infection- and tumor-induced signals, including Upds and EGFs (Fig. 8l).
Materials and Methods
All Drosophila and Pseudomonas strains used in this study are listed in Supplementary Table 1. Commercial reagents, chemicals and antibodies are listed in Supplementary Table 2.
Fly stocks and maintenance
Drosophila stocks were maintained at 18°C on a 12:12 hour light:dark cycle on standard fly food containing propionic acid (Sigma) and Tegosept (Genesee). P.a. and hypoxia experiments were conducted at the University of Cyprus, and P.e. experiments and tumor transplants were conducted at the German Cancer Research Center (DKFZ)-Center for Molecular Biology (ZMBH) and the Huntsman Cancer Institute.
The following Gal4 lines were used for tissue and cell-type specific expression: yw; btl-Gal4 UAS-srcGFP 77, w; btl-Gal4 UAS-srcGFP tub-Gal80ts/CyO (this work), yw; esg-Gal4NP5130 UAS-srcGFP 77, w; esg-Gal4 UAS-GFP tub-Gal80ts13, w; Su(H)-Gal4 UAS-CD8-GFP tub-Gal80ts20/CyO (this work; Su(H)-Gal4 was a gift from S. Hou 15), w; Myo1A-Gal4 UAS-GFP/CyO Su(H)-Gal80 tub-Gal80ts/TM6C (this work), w; Myo1A-Gal4 UAS-mcherry tub-Gal80ts/CyO (this work), w; trh-Gal414D03 (BDSC# 47463), w; dSRF-Gal4/CyO (from BDSC# 25753), w; dSRF-Gal4 UAS-eGFP 78, w; esg-Gal4 UAS-GFP tub-Gal80ts/CyO; QF6 QUAS-mtdTomato/TM6B (this work; QF6 was a gift from C. Potter 32), w; Myo1A-Gal4 UAS-nls-mCherry tub-Gal80ts; QF6 QUAS-mCD8GFP (this work; 32), w; btl-Gal4 UAS-srcGFP tubGal80ts; simaKG/T(2;3) (this work), w; Myo1A-Gal4 UAS-nls-mCherry tub-Gal80ts; simaKG/T(2;3) (this work), w; esg-Gal4 UAS-eGFP tub-Gal80ts/CyO; UAS-Ras1AQ13/TM6C (this work); w; ppk-Gal4/CyO (BDSC# 32078), w; UAS-CD8::GFP.LLL5 UAS-CD8::GFP.L2 (BDSC# 5137), w; mira-GFP/CyO; trh-Gal414D03-Gal4/TM6B (this work, mira-GFP was a gift from A. Bardin 79).
The following UAS strains were used: yw; UAS-btlDN80, w; UAS-λbtl/TM3,Sb 80, w UAS-λbtl (BDSC# 29046), w; UAS-bnl.SA1.1 (from BDSC# 64231), yv; UAS-simaV10,RNAi (BDSC# 26207), w; UAS-simaB (BDSC# 9582) 40, w; UAS-CatRNAi (VDRC# 6283), w; UAS-Sod1.A (BDSC# 24750), w; UAS-Cat.A (BDSC# 24621), w; UAS-bnlRNAi1 (VDRC# 101377), w; UAS-bnlRNAi2 (VDRC# 5730), yv; UAS-bnlRNAi (BDSC# 34572), w; UAS-Ras85DV12 (BDSC# 4847) and w; UAS-NotchDN781, w UAS-NotchRNAi (BDSC# 7078), w; UAS-DuoxRNAi82.
The following mutants and reporter lines were used: w1118 (BDSC# 3605), simaKG07607 (BDSC# 14640, isogenized in CP lab), yw; btlMI03286 (BDSC# 36229), btlf0286483, yw; bnlMI01635/TM3 (BDSC# 34228), bnle0311583, w; UAS-src-GFP; bnl-Gal4NP2211 (this work, originating from KyotoSC# 112825), w; ldh-Gal4 UAS-nls-GFP and w; ldh-Gal4 UAS-src-GFP (this work, ldh-Gal4 was a gift from P. Wappner 40), yw; esg-lacZ606 (BDSC# 10359), ry506 Dl-lacZ05151/TM3 (BDSC# 11651) and w; Su(H)-lacZGBE (BDSC# 83352). For crosses involving driver lines with “tubulin-Gal4, Gal80ts” were set up at 18°C, F1 adult progeny were collected within two days of emerging from the pupae. These flies were transferred to 29°C for the expression of the transgene including RNAi construct of interest. Flies were used within 10 days of emerging for all the stress experiments. Flies were transferred to new food every 2 days except for weekends. Fly stocks used for the experiments are listed in Supplementary Table 1.
Control and RasV12 MARCM clones 84 were generated by crossing yw hs-FLP tub-Gal4 UAS-nls-EGFP; FRT82B tubGal80 85 to w; FRT82B arm-lacZ (BDSC# 7369) and w; UAS-RasV12; FRT82B arm-lacZ (this work), respectively. In short, 3-day-old female flies reared at 25°C were heat shocked at 37°C in a circulating water bath for 60 min, once a day for 2 sequential days. Then, they were maintained at 25°C for one week until dissection.
Oral administration of bacteria and chemicals
Female mated mature flies were used for all feeding assays.
P. aeruginosa:
P.a. feeding was performed as previously described23. Briefly, a single colony from the P. aeruginosa strain PA14 was grown at 37°C to OD600nm=3, corresponding to 5×10⁹ bacteria/ml. Female mature flies of the desired genotype were starved for 5 hours and added in groups of 10 per fly vial containing a cotton ball at the bottom impregnated with 5 ml of 0.5ml PA14 OD600nm=3, 1ml 20% sucrose and 3.5ml dH2O. For uninfected control, 5ml of 1ml sucrose 20% and 4ml dH2O was used. Flies were incubated for 48 hours at 25°C or 29°C (for all experiments utilizing the Gal4-UAS system, unless otherwise noted).
P. entomophila:
P.e. was cultured in LB with rifampicin (100μg/ ml, Sigma-Aldrich, USA) at 29°C. Initial 50 ml overnight culture was transferred to 150 ml media for further 24 hours at the same temperature. P.e. was spun-down, mixed with 5% sucrose, yeast-extract and bacterial supernatant. Flies starved for 4 hours with water were fed with this P.e. mix. 5% sucrose was fed to the control groups at the same time.
H2O2:
30 % H2O2 solution (EMSURE) was stored at 4°C. 500 μl of 1% H2O2 with 4% sucrose solution was pipetted onto a sterile cotton ball at the bottom of an empty vial, and 4% sucrose solution without H2O2 was used as control. Flies were transferred to treatment vials and incubated for 48 hours at 25°C before dissection, unless otherwise noted.
Paraquat:
PQ powder (Sigma) was diluted in ddH2O and stored as a stock of 100mM at 4°C. A 10mM PQ solution prepared fresh in 4% sucrose was used as test food and 4% sucrose solution without PQ as a control. Flies were transferred to the empty fly food vial containing only one 23mm Whatman paper disc soaked with 250μl of test or control food and incubated for 24 hours at 25°C, unless otherwise noted.
P. aeruginosa mutants supernatant administration (MvfR, PhzS, PhzM):
The mutant strains MvfR, PhzS and PhzM were taken from a P.a. library designed by F. Ausubel46. Cell-free supernatants of PA14, MvfR, PhzS and PhzM were prepared by centrifugation and filtering of the supernatant with 0.2 μm filters. Fresh cell-free supernatant solutions were prepared daily for 2 days. Flies were transferred to the vials with the wet cotton balls impregnated with 5 ml of a solution composed of 80% LB medium or supernatant and 20% sucrose.
Dissections and Immunohistochemistry
Adult midgut dissections and immunohistochemistry were performed as previously described23. Following dissections on Sylgard (VWR) plates in 1x PBS (130mM NaCl, 70mM Na2HPO4, 30mM NaH2PO4). Dissected midguts were fixed in 4% Formaldehyde (Polysciences) in 1x PBS for 30 minutes at room temperature. After 3 rinses with PBS, the tissues were incubated in blocking PBT solution (1x PBS, 0.5% BSA, 0.2% TritonX-100) at room temperature for at least 20 minutes. Addition of the primary antibody in PBT was followed by incubation for 16 hours at 4°C. Primary antibody was washed 3 times for 10 min at room temperature with PT (1x PBS, 0.2% TritonX-100). Secondary antibodies and DAPI (Sigma) are added for 1–2 hours at room temperature. Excess antibodies are washed in PT (as before) and the midguts are mounted in Vectashield (Vector). Primary antibodies: rabbit-anti-pH3 (Millipore 1:4000), rabbit anti-cleaved-Caspase-3 (#9661 Cell Signaling Technology 1:400), mouse-anti-Prospero (DSHB 1:100), mouse anti-β-gal (Promega 1:500), chicken-anti-GFP (Invitrogen 1:1000), rabbit anti-GFP (1:3000; Invitrogen) DAPI (Sigma, 1:3000 of 10mg/ml stock) (staining of the nuclei). Secondary antibodies against mouse, rabbit or chicken conjugated to Alexa Fluor 488 and 555 (Invitrogen) were used at 1:1000.
RT-qPCR
Dissected midguts were collected in Qiazol (Qiagen). Total RNA was extracted from 20 midguts per strain per condition per biological replicate using the Qiazol protocol. 800 ng of total RNA were freed from genomic DNA using the RQ1 RNase-Free DNase Kit (Promega). Reverse transcription was performed using 145,4ng of the total DNase-treated RNA using the TaKaRa PrimeScript RT Master Mix Kit. qPCR amplification was performed using gene specific primers with the following amplification program: 95°C for 30 seconds (initial denaturation), 40 cycles of 95°C for 10 seconds (denaturation), 60°C for 30 seconds (annealing), 65°C for 30 seconds (extension) and 65°C for 1 minute (final extension). Primer sequences for each gene are shown in Table 1. The expression of the genes of interest was normalized to the expression levels of two reference genes, rpl32 and gapdh1 using the 2-ΔΔCt method. Data were analyzed using the Bio-Rad CFX Manager 3.1 program and graphs were prepared in Excel. For all experiments at least 3 biological replicates were used to calculate the average and the standard deviation. The primer pairs used for qPCR analyses are listed in Supplementary Table 3.
Midgut Tumorigenesis
Tumors (RasV12, RasQ13, NotchDN, RasV12 NotchRNAi) were induced in the midgut intestinal progenitor population via the Gal4-UAS-Gal80ts system30,52. Tumor-generating crosses were reared at 18°C, and emerging adult progeny were maintained at 18°C to mature for 5–7 days. After maturation, mated adult females were transferred to 29°C to induce transgenes. For RasV12 tumors, flies were induced for 1, 3 and 5 days, for NotchDN tumors flies were induced for 4, 7 and 10 days. For RasQ13 tumors flies were induced for 1 and 2 days. For RasV12 NotchRNAi tumors, flies were induced for 7 days. For MARCM tumors, the crosses were reared at 25°C and mature 3–5 days old adult female progeny with the correct genotype were heat-shocked for 1 hour at 37°C in a water bath. A time-course analysis (3, 7, 10, 14 days) was performed to identify the time point when large clones were readily visible. Large close were obtained 14 days after heat shock. Images were acquired in a Zeiss Axioscope A1 to show GFP fluorescence of the clone and bright-field image of the trachea.
Survival assay
Flies of the appropriate genotypes were collected within 1–2 days after hatching at 18°C. The flies were transferred to 29°C and the number of dead flies were counted every 2 days while changing the food. The Kaplan-Meier log-rank test was used to assess statistical significance and the data were plotted using Graphpad Prism 9.
Tumor transplants
Midguts bearing control progenitor cells and tumors were dissected out and cut into pieces. Cut pieces were aspirated into a hypodermic syringe and carefully injected into the abdomen of the anesthetized recipient flies. Recipient flies with transplanted midgut pieces were incubated at 29°C until observation was complete. The percentage of tumor growth was calculated by counting the number of flies bearing tumors compared to the number of flies injected with the tumor pieces. The percentage of distal colonization was calculated by counting the number of tumor-bearing flies showing tumors above the thorax region (including the head) away for the site of injection in the abdomen to the number of flies injected with the tumor pieces.
Hypoxia
Drosophila strains were reared in normoxic (21% O2) and hypoxic conditions (5% O2) for 12 hours. For the hypoxic conditions the Modular Incubator Chamber (MIC-101, Billups – Rothenberg Inc.), was used connected to a cylinder that contained a mixture of gasses with 4% O2. The flies for both normoxic and hypoxic conditions were transferred into new vials containing the oral experimental condition and were covered with net (instead of cotton). The chamber was moved into a 29°C incubator overnight (12 hrs). For all the combined hypoxia-infected and hypoxia-tumor conditions, hypoxia was the last step, meaning that the flies before dissection were reared in low oxygen tension. The flies that were reared in hypoxia were dissected first to reduce contact with the atmospheric oxygen.
Image acquisition and analysis
Full midgut images (as those used in Extended Data Fig. 1 and 3) were acquired with a Leica MZ16F Fluorescent Stereomicroscope equipped with GFP and DAPI filters. Stacks of optical sections were acquired using the Leica TCS SP2 DMIRE2 Scanning Confocal Microscope using a 40x oil objective (zoom 1x, average 4). Images to be compared were acquired using the exact same settings. Bright-field images were acquired using the fluorescent microscope Zeis Axioscope A.1 at 20x magnification with the Axiovision Software.
Measurements of tracheal length were performed using the NeuronJ Plugin of ImageJ 1.34s software (ImageJ – Plugins – NeuronJ. File – Open image file). The monitoring of the tracheal system can take place in two independent ways. The first relies on the quantification of the fluorescence intensity of the trachea and the other on the quantification of the tracheal branches. For trachea quantification, images were acquired using a Leica TCS SP2 DMIRE2 confocal microscope and the LCS software, at 40Χ magnification, zoom1, image size: 1024×1024, 0.5 μm step size, sequential scan mode DAPI/RFP, ~18–20 serial sections for both the anterior and the posterior areas of the midgut. Importantly, to achieve accurate comparisons, all the images were acquired under the same GFP laser settings. Numerous intestines were photographed from the anterior (R2 region), the posterior (R5) region and occasionally from the middle (R3, R4a) midgut (specified throughout the text). Using the NeuronJ tool (Add tracings), an ImageJ Plugin for Neurite Tracing and Analysis found in the ICY software (http://icy.bioimageanalysis.org/), we highlighted each tracheal branch along on the surface of the midgut. We avoided highlighting the large, thick external tracheal vessels that do not adhere to the gut surface. Then, we summed the full length of the branches (Measure tracings). Normalization to the surface of the midgut was performed for each image before plotting. We tested this image quantification method and compared it to other methods. We found that this was the most accurate method for intestinal tracheal measurements, and thus, we used it for all subsequent experiments. Graphs were generated using Graphpad Prism 9 by calculating the average and standard deviation values. Bright-field images from the Zeiss Axioscope A.1 were also used to measure the tracheal length using the NeuronJ Plugin. In the Edgar lab, the images of the midguts with trachea (Fig. 1e, f, Fig. 7b) were taken at the same magnification with a 40x water objective using a Leica SP8 confocal microscope and the LAS X software. Bright-field DIC images (Fig. 1k, Fig. 7a,c) were taken with a Leica DM microscope and grouped anonymously for quantifying the phenotypes. The tracheal branches were categorized into primary, secondary, and tertiary branches according to their thickness with thickest being the primary trachea. No significant differences in the number of primary or secondary trachea were observed across the groups. The number of tertiary tracheal branches per field was counted manually from the images.
The numbers of pH3-positive cells were counted under the fluorescent microscope (Zeiss Axioscope A.1 and Nikon Eclipse Ti) at 20x magnification along the whole midgut. Graphs were generated using Graphpad Prism 9 by calculating the average and standard deviation values. Image panles were compiled using Photoshop 2020 (Adobe).
Statistics and Reproducibility
All experiments (fluorescence micrographs, brightfield imaging of the trachea, and mitosis assessement) were repeated at least three times with similar results. Representative images are shown for microscopy images.
Pair comparisons were statistically-tested with a two-sided Student’s t-test. The U-test was used in cases where the number of points was less than 10, as specified in individual figure legends.
Data availability
All data supporting the findings of this study are available from the corresponding authors on reasonable request.
Code availability
No custom algorithms or software were generated for this study.
Extended Data
Extended Data Fig. 1. Infection and oxidative damage increase esg>GFP+ cells in the midgut and associate with increased TTC branching.
a. Adult midgut intestinal progenitors labeled with esgNP5130-Gal4>UAS-srcGFP were imaged in unchallenged conditions (4% sucrose) and upon oral P.a. infection (48hrs), and feeding with H2O2 (48hrs) and PQ (24hrs). DAPI (blue) in the upper panels stains all midgut nuclei. The bottom panels show the GFP-labeled progenitors separately. P.a. and PQ expanded the intestinal progenitors with a posterior midgut bias, whereas H2O2 exhibited an anterior midgut bias. b-c. Quantification of midgut mitosis (b, n=10 each) and TTC branching (c, n=7,6) in PQ-treated flies. d-e. Posterior midgut (R4) images of btl-Gal4>UAS-srcGFP flies in baseline conditions (sucrose) and upon PQ feeding. DAPI (blue) staining all the nuclei. Single channel images of the GFP are shown in d’-e’. f-g. Posterior midgut images of QF6>QUAS-mtdTomato flies in baseline conditions exhibit tracheal expression of the reporter. Midgut epithelial ECs with low expression of the reporter are visible is zoomed image (g). Single channel images of the Tomato are shown in f’-g’. Scale bars: 300 μm in a, 75 μm in d-g. Data are presented as mean values ± SD. Statistical significance (t-tested, two-sided for b, and U-tested for c): ns, not significant, * 0.01<p≤0.05, ** 0.001<p≤0.01 and *** p≤0.001.
Extended Data Fig. 2. The FGFR/Btl is necessary and sufficient for midgut TTC branching and ISC mitosis.
a-b. Brightfield images of the tracheae of P.a. infected R5 regions of the midgut in trh-Gal4 control (a) and trh-Gal4>UAS-btlDN (b). c-d. Brightfield images of the tracheae of uninfected R5 regions of the midgut in trh-Gal4 control (c) and trh-Gal4>UAS-λbtl (d). e-g. Quantification of TTCs (e, n=10,11,10,9,10), TTC branching (f, n=10,11,10,8,10), and midgut mitosis (g, n=8,6,10,9,6) upon trh-Gal4-driven btl manipulation with or without P.a. infection. h-i. Brightfield images of the tracheae of P.a.-infected R5 regions of the midgut in dSRF-Gal4 control (h) and dSRF-Gal4>UAS-btlDN (i). j-k. Brightfield images of the tracheae of uninfected R5 regions of the midgut in dSRF-Gal4 control (j) and dSRF-Gal4>UAS-λbtl (k). l-n. Quantification of TTCs (l, n=10,10,8,8,11), TTC branching (m, n=10,10,8,8,11), and midgut mitosis (n, n=11,9,12,12,9) upon dSRF-Gal4-driven btl manipulation with or without P.a. infection. All scale bars: 75 μm. Data are presented as mean values ± SD. Statistical significance (t-tested, two-sided): ns, not significant, * 0.01<p≤0.05, ** 0.001<p≤0.01 and *** p≤0.001.
Extended Data Fig. 3. Infection and oxidative damage induce FGF/bnl in the midgut epithelium.
Adult midgut bnl-expressing cells labeled with the reporter bnl-Gal4>UAS-srcGFP were imaged in unchallenged conditions (4% sucrose) and upon oral P.a. infection (48hrs), feeding with H2O2 (48hrs) and PQ (24hrs). DAPI (blue) in the upper panels stained all midgut nuclei. The bottom panels show the GFP-labeled bnl expressing cells separately. P.a. and PQ induced the reporter throughout the midgut, whereas H2O2 exhibited an anterior midgut bias. Scale bar: 300 μm.
Extended Data Fig. 4. Btl/Bnl signaling in the epithelial cells is necessary for efficient tracheal remodeling and mitosis in response to infection.
a-b. Quantification of TTC branching upon progenitor- (a) and EC-specific (b) silencing of bnl (bnlRNAi3) and btl (btlRNAi) (a, n=10,8,5,10,7,7 and b, n=10,7,9,10,9,8). c-d. Quantification of midgut mitosis upon progenitor- (c) and EC-specific (d) silencing of bnl (bnlRNAi3) (c, n=6,8,12,12 and d, n=9,9,11,13). e. Quantification of esg+ progenitors as a percent of total number of cells in the posterior regions of the midgut upon progenitor-specific knockdown of btl (btlRNAi) and bnl (bnlRNAi3) (n=12,15,15). f-g. Quantification of midgut mitosis upon progenitor- (f) and EC-specific (g) silencing of btl (btlRNAi) (f, n=8,13,11,13 and g, n=12,11,11,16). h. Quantification of esg+ progenitor cells/total number of cells in the posterior midgut upon progenitor-specific knockdown of btl (btlDN, n=9,9). Data are presented as mean values ± SD. Statistical significance (t-tested, two-sided): ns, not significant, * 0.01<p≤0.05, ** 0.001<p≤0.01 and *** p≤0.001.
Extended Data Fig. 5. Infection and oxidative damage activate Hif-1α/Sima in the midgut epithelium and the visceral TTCs.
Hif-1α/Sima activation was monitored via the ldh-Gal4>UAS-nlsGFP reporter expression in the adult midgut epithelium and the intestinal trachea of the R5 region in unchallenged flies (sucrose) and upon P.a. and PQ treatment (a, c, e), and of the R2 region in unchallenged flies (sucrose) and upon H2O2 feeding (b, d). Epithelial sections (a-d) and trachea surface sections (a’-d’) of the same midguts were imaged. DAPI (blue) in a-d and a’-d’ stains all the nuclei. a”-d” and a”’-d”’ correspond to separated channels for reporter expression in the epithelium and the intestinal trachea, respectively. The ldh-Gal4>UAS-nlsGFP reporter was expressed in cells of the midgut epithelium and in the midgut TTCs in baseline conditions in the anterior (R2 in b, b’) and posterior (R5 in a, a’) midgut. P.a. (c, c’), H2O2 (d, d’) and PQ (e, e’) induced the reporter in the epithelium and the trachea at varying degrees. All images were acquired at the same confocal settings as their respective controls. Scale bar: 75 μm.
Extended Data Fig. 6. Hif-1a/Sima is necessary in the intestinal epithelium and the trachea for TTC branching.
a-b. Brightfield images of the midgut TTCs (R5 region) upon trachea-specific (via btl-Gal4) sima knockdown in the background of heterozygous simaKG in baseline conditions. c-d. Bright-field images of the midgut TTCs (R5 region) upon EC-specific (via Myo1A-Gal4) sima knockdown in the background of heterozygous simaKG in baseline conditions. e-f. Bright-field images of the midgut TTCs (R5 region) upon trachea-specific (via btl-Gal4) sima knockdown in the background of heterozygous simaKG in P.a.-infected conditions. g-h. Bright-field images of the midgut TTCs (R5 region) upon EC-specific (via Myo1A-Gal4) sima knockdown in the background of heterozygous simaKG in P.a.-infected conditions. The images correspond to examples of those quantified for Fig. 4e,i. Scale bar: 75 μm.
Extended Data Fig. 7. Time-course analysis of NotchDN progenitor-derived midgut tumors.
a-d. The R4a region of control (reared for 4 days at 18°C) (a) and tumorous midguts (reared for 4, 7 and 10 days at 29°C) (b-d) of the esg-Gal4 UAS-eGFP tub-Gal80ts>UAS-NotchDN genotype with concomitant expression of QF6>QUAS-mtdTomato (red) to label the trachea. DAPI (blue in a-d) is used to label all midgut nuclei and Prospero (a”-d”) labels the EEs. a’-d’, a”-d” and a”’-d”’ correspond to the individual channels for eGFP, Prospero and Tomato-labeled trachea, respectively. Scale bars: 75 μm. e-g. Quantification of TTC branching in the R4a of control (NotchDN uninduced) and NotchDN-expressing midguts (e, n=4,8,4,6,4,7), in the NotchDN tumor-region vs. neighboring non-tumor area on the same image (f, n=6,6,4,4,6,6), and midgut mitosis of control (NotchDN uninduced) and NotchDN-expressing midguts (g, n=20 each) during a time-course analysis at 4, 7, and 10 days post-tumor induction. Scale bar: 75 μm. Data are presented as mean values ± SD. Statistical significance (t-tested, two-sided): ** 0.001<p≤0.01 and *** p≤0.001.
Extended Data Fig. 8. Time-course analysis of RasV12 progenitor-derived midgut tumors.
a-d. The R5 region of control esg-Gal4 UAS-eGFP tub-Gal80ts (reared for 1 day at 29°C) and esg-Gal4 UAS-eGFP tub-Gal80ts>UAS-RasV12-tumor bearing midguts (reared for 1, 3 and 5 days at 29°C) with concomitant expression of QF6>QUAS-mtdTomato (red) to label the trachea. DAPI (blue in a-d) was used to label all midgut nuclei. a’-d’ and a”-d” correspond to the individual channels for the eGFP and the Tomato-labeled trachea, respectively. Scale bar: 75 μm.
Supplementary Material
Acknowledgements
The authors would like to thank the BDSC, VDRC, the Kyoto Stock Center and the TRiP for fly stocks; Allison Bardin, Steven Hou, Jordi Casanova, Thomas Kornberg, Chris Potter, Pablo Wappner and Anastasia Ignatiou for fly stocks; Eric Snyder for the Nikon Ti microscope usage; the DSHB for antibodies. This project was supported by FP7-PEOPLE-2011-CIG-303727, the Fondation Santé and the Cyprus Research and Innovation Foundation EXCELLENCE/0918/0082 to C.P., and by ERC AdG 268515, DFG SFB873, the Huntsman Cancer Foundation and NIH GM124434 to B.A.E.
Footnotes
Competing Interests Statement
The authors declare no competing interests.
References
- 1.Ghabrial A, Luschnig S, Metzstein MM & Krasnow MA Branching morphogenesis of the Drosophila tracheal system. Annu Rev Cell Dev Biol 19, 623–647 (2003). [DOI] [PubMed] [Google Scholar]
- 2.Hayashi S & Kondo T Development and Function of the Drosophila Tracheal System. Genetics 209, 367–380 (2018). [DOI] [PMC free article] [PubMed] [Google Scholar]
- 3.Jarecki J, Johnson E & Krasnow MA Oxygen Regulation of Airway Branching in Drosophila Is Mediated by Branchless FGF. Cell 99, 211–220 (1999). [DOI] [PubMed] [Google Scholar]
- 4.Centanin L, et al. Cell Autonomy of HIF Effects in Drosophila: Tracheal Cells Sense Hypoxia and Induce Terminal Branch Sprouting. Developmental Cell 14, 547–558 (2008). [DOI] [PubMed] [Google Scholar]
- 5.Best BT Single-cell branching morphogenesis in the Drosophila trachea. Dev Biol 451, 5–15 (2019). [DOI] [PubMed] [Google Scholar]
- 6.Eilken HM & Adams RH Dynamics of endothelial cell behavior in sprouting angiogenesis. Curr Opin Cell Biol 22, 617–625 (2010). [DOI] [PubMed] [Google Scholar]
- 7.Centanin L, et al. Cell autonomy of HIF effects in Drosophila: tracheal cells sense hypoxia and induce terminal branch sprouting. Dev Cell 14, 547–558 (2008). [DOI] [PubMed] [Google Scholar]
- 8.Fraisl P, Mazzone M, Schmidt T & Carmeliet P Regulation of angiogenesis by oxygen and metabolism. Dev Cell 16, 167–179 (2009). [DOI] [PubMed] [Google Scholar]
- 9.Apidianakis Y, Tamamouna V, Teloni S & Pitsouli C Intestinal Stem Cells: A Decade of Intensive Research in Drosophila and the Road Ahead. (2017).
- 10.Jiang H, Tian A & Jiang J Intestinal stem cell response to injury: lessons from Drosophila. Cellular and molecular life sciences : CMLS 73, 3337–3349 (2016). [DOI] [PMC free article] [PubMed] [Google Scholar]
- 11.Lemaitre B & Miguel-Aliaga I The digestive tract of Drosophila melanogaster. Annu Rev Genet 47, 377–404 (2013). [DOI] [PubMed] [Google Scholar]
- 12.Jasper H Intestinal Stem Cell Aging: Origins and Interventions. Annu Rev Physiol 82, 203–226 (2020). [DOI] [PubMed] [Google Scholar]
- 13.Micchelli CA & Perrimon N Evidence that stem cells reside in the adult Drosophila midgut epithelium. Nature 439, 475–479 (2006). [DOI] [PubMed] [Google Scholar]
- 14.Ohlstein B & Spradling A The adult Drosophila posterior midgut is maintained by pluripotent stem cells. Nature 439, 470–474 (2006). [DOI] [PubMed] [Google Scholar]
- 15.Zeng X & Hou SX Enteroendocrine cells are generated from stem cells through a distinct progenitor in the adult Drosophila posterior midgut. Development 142, 644–653 (2015). [DOI] [PMC free article] [PubMed] [Google Scholar]
- 16.Lin G, Xu N & Xi R Paracrine Wingless signalling controls self-renewal of Drosophila intestinal stem cells. Nature 455, 1119–1123 (2008). [DOI] [PubMed] [Google Scholar]
- 17.Xu N, et al. EGFR, Wingless and JAK/STAT signaling cooperatively maintain Drosophila intestinal stem cells. Developmental Biology 354, 31–43 (2011). [DOI] [PubMed] [Google Scholar]
- 18.Li Z, Zhang Y, Han L, Shi L & Lin X Trachea-Derived Dpp Controls Adult Midgut Homeostasis in Drosophila. Developmental Cell 24, 133–143 (2013). [DOI] [PubMed] [Google Scholar]
- 19.Miguel-Aliaga I, Jasper H & Lemaitre B Anatomy and Physiology of the Digestive Tract of Drosophila melanogaster. Genetics 210, 357–396 (2018). [DOI] [PMC free article] [PubMed] [Google Scholar]
- 20.Kux K & Pitsouli C Tissue communication in regenerative inflammatory signaling: lessons from the fly gut. Frontiers in Cellular and Infection Microbiology 4(2014). [DOI] [PMC free article] [PubMed] [Google Scholar]
- 21.Jiang H, et al. Cytokine/Jak/Stat signaling mediates regeneration and homeostasis in the Drosophila midgut. Cell 137, 1343–1355 (2009). [DOI] [PMC free article] [PubMed] [Google Scholar]
- 22.Buchon N, Broderick NA, Poidevin M, Pradervand S & Lemaitre B Drosophila intestinal response to bacterial infection: activation of host defense and stem cell proliferation. Cell Host Microbe 5, 200–211 (2009). [DOI] [PubMed] [Google Scholar]
- 23.Apidianakis Y, Pitsouli C, Perrimon N & Rahme L Synergy between bacterial infection and genetic predisposition in intestinal dysplasia. P Natl Acad Sci USA 106, 20883–20888 (2009). [DOI] [PMC free article] [PubMed] [Google Scholar]
- 24.Amcheslavsky A, Jiang J & Ip YT Tissue Damage-Induced Intestinal Stem Cell Division in Drosophila. Cell Stem Cell 4, 49–61 (2009). [DOI] [PMC free article] [PubMed] [Google Scholar]
- 25.Biteau B, Hochmuth CE & Jasper H JNK activity in somatic stem cells causes loss of tissue homeostasis in the aging Drosophila gut. Cell Stem Cell 3, 442–455 (2008). [DOI] [PMC free article] [PubMed] [Google Scholar]
- 26.Markstein M, et al. Systematic screen of chemotherapeutics in Drosophila stem cell tumors. Proc Natl Acad Sci U S A 111, 4530–4535 (2014). [DOI] [PMC free article] [PubMed] [Google Scholar]
- 27.Kux K & Pitsouli C Tissue communication in regenerative inflammatory signaling: lessons from the fly gut. Front Cell Infect Microbiol 4, 49 (2014). [DOI] [PMC free article] [PubMed] [Google Scholar]
- 28.Linneweber GA, et al. Neuronal control of metabolism through nutrient-dependent modulation of tracheal branching. Cell 156, 69–83 (2014). [DOI] [PMC free article] [PubMed] [Google Scholar]
- 29.Campbell K, et al. Collective cell migration and metastases induced by an epithelial-to-mesenchymal transition in Drosophila intestinal tumors. Nat Commun 10, 2311 (2019). [DOI] [PMC free article] [PubMed] [Google Scholar]
- 30.Brand AH & Perrimon N Targeted gene expression as a means of altering cell fates and generating dominant phenotypes. Development 118, 401–415 (1993). [DOI] [PubMed] [Google Scholar]
- 31.Shiga Y, Tanaka-Matakatsu M & Hayashi S A nuclear GFP/β-galactosidase fusion protein as a marker for morphogenesis in living Drosophila. Development, Growth & Differentiation 38, 99–106 (1996). [Google Scholar]
- 32.Potter CJ, Tasic B, Russler EV, Liang L & Luo L The Q system: a repressible binary system for transgene expression, lineage tracing, and mosaic analysis. Cell 141, 536–548 (2010). [DOI] [PMC free article] [PubMed] [Google Scholar]
- 33.Sutherland D, Samakovlis C & Krasnow MA branchless encodes a Drosophila FGF homolog that controls tracheal cell migration and the pattern of branching. Cell 87, 1091–1101 (1996). [DOI] [PubMed] [Google Scholar]
- 34.Grifoni D, Sollazzo M, Fontana E, Froldi F & Pession A Multiple strategies of oxygen supply in Drosophila malignancies identify tracheogenesis as a novel cancer hallmark. Sci Rep 5, 9061 (2015). [DOI] [PMC free article] [PubMed] [Google Scholar]
- 35.Wang CW, Purkayastha A, Jones KT, Thaker SK & Banerjee U In vivo genetic dissection of tumor growth and the Warburg effect. Elife 5(2016). [DOI] [PMC free article] [PubMed] [Google Scholar]
- 36.Kaelin WG Jr. The von Hippel-Lindau protein, HIF hydroxylation, and oxygen sensing. Biochem Biophys Res Commun 338, 627–638 (2005). [DOI] [PubMed] [Google Scholar]
- 37.Klimova T & Chandel NS Mitochondrial complex III regulates hypoxic activation of HIF. Cell Death Differ 15, 660–666 (2008). [DOI] [PubMed] [Google Scholar]
- 38.Semenza GL Hypoxia-inducible factors: coupling glucose metabolism and redox regulation with induction of the breast cancer stem cell phenotype. The EMBO Journal 36, 252–259 (2017). [DOI] [PMC free article] [PubMed] [Google Scholar]
- 39.Movafagh S, Crook S & Vo K Regulation of hypoxia-inducible factor-1a by reactive oxygen species: new developments in an old debate. J Cell Biochem 116, 696–703 (2015). [DOI] [PubMed] [Google Scholar]
- 40.Lavista-Llanos S, et al. Control of the Hypoxic Response in Drosophila melanogaster by the Basic Helix-Loop-Helix PAS Protein Similar. Molecular and Cellular Biology 22, 6842–6853 (2002). [DOI] [PMC free article] [PubMed] [Google Scholar]
- 41.Centanin L, Ratcliffe PJ & Wappner P Reversion of lethality and growth defects in Fatiga oxygen-sensor mutant flies by loss of hypoxia-inducible factor-alpha/Sima. EMBO reports 6, 1070–1075 (2005). [DOI] [PMC free article] [PubMed] [Google Scholar]
- 42.Majmundar AJ, Wong WJ & Simon MC Hypoxia-inducible factors and the response to hypoxic stress. Mol Cell 40, 294–309 (2010). [DOI] [PMC free article] [PubMed] [Google Scholar]
- 43.Tamamouna V & Pitsouli C The Hypoxia-Inducible Factor-1α in Angiogenesis and Cancer: Insights from the Drosophila Model. Gene Expression and Regulation in Mammalian Cells - Transcription Toward the Establishment of Novel Therapeutics, IntechOpen 72318, 209–241 (2018). [Google Scholar]
- 44.Deziel E, et al. The contribution of MvfR to Pseudomonas aeruginosa pathogenesis and quorum sensing circuitry regulation: multiple quorum sensing-regulated genes are modulated without affecting lasRI, rhlRI or the production of N-acyl-L-homoserine lactones. Mol Microbiol 55, 998–1014 (2005). [DOI] [PubMed] [Google Scholar]
- 45.Xiao G, et al. MvfR, a key Pseudomonas aeruginosa pathogenicity LTTR-class regulatory protein, has dual ligands. Mol Microbiol 62, 1689–1699 (2006). [DOI] [PubMed] [Google Scholar]
- 46.Liberati NT, et al. An ordered, nonredundant library of Pseudomonas aeruginosa strain PA14 transposon insertion mutants. Proc Natl Acad Sci U S A 103, 2833–2838 (2006). [DOI] [PMC free article] [PubMed] [Google Scholar]
- 47.Lee KA, et al. Bacterial-derived uracil as a modulator of mucosal immunity and gut-microbe homeostasis in Drosophila. Cell 153, 797–811 (2013). [DOI] [PubMed] [Google Scholar]
- 48.Hochmuth CE, Biteau B, Bohmann D & Jasper H Redox Regulation by Keap1 and Nrf2 Controls Intestinal Stem Cell Proliferation in Drosophila. Cell Stem Cell 8, 188–199 (2011). [DOI] [PMC free article] [PubMed] [Google Scholar]
- 49.Patel PH, et al. Damage sensing by a Nox-Ask1-MKK3-p38 signaling pathway mediates regeneration in the adult Drosophila midgut. Nat Commun 10, 4365 (2019). [DOI] [PMC free article] [PubMed] [Google Scholar]
- 50.Hanahan D & Weinberg RA Hallmarks of cancer: the next generation. Cell 144, 646–674 (2011). [DOI] [PubMed] [Google Scholar]
- 51.Zhai Z, et al. Accumulation of differentiating intestinal stem cell progenies drives tumorigenesis. Nat Commun 6, 10219 (2015). [DOI] [PMC free article] [PubMed] [Google Scholar]
- 52.McGuire SE, Mao Z & Davis RL Spatiotemporal gene expression targeting with the TARGET and gene-switch systems in Drosophila. Sci STKE 2004, pl6 (2004). [DOI] [PubMed] [Google Scholar]
- 53.Buchon N, et al. Morphological and molecular characterization of adult midgut compartmentalization in Drosophila. Cell Rep 3, 1725–1738 (2013). [DOI] [PubMed] [Google Scholar]
- 54.Marianes A & Spradling AC Physiological and stem cell compartmentalization within the Drosophila midgut. Elife 2, e00886 (2013). [DOI] [PMC free article] [PubMed] [Google Scholar]
- 55.Potente M, Gerhardt H & Carmeliet P Basic and therapeutic aspects of angiogenesis. Cell 146, 873–887 (2011). [DOI] [PubMed] [Google Scholar]
- 56.Trinchieri G Cancer and inflammation: an old intuition with rapidly evolving new concepts. Annu Rev Immunol 30, 677–706 (2012). [DOI] [PubMed] [Google Scholar]
- 57.Folkman J Tumor angiogenesis: therapeutic implications. N Engl J Med 285, 1182–1186 (1971). [DOI] [PubMed] [Google Scholar]
- 58.Folkman J Fundamental concepts of the angiogenic process. Curr Mol Med 3, 643–651 (2003). [DOI] [PubMed] [Google Scholar]
- 59.Weis SM & Cheresh DA Tumor angiogenesis: molecular pathways and therapeutic targets. Nat Med 17, 1359–1370 (2011). [DOI] [PubMed] [Google Scholar]
- 60.Choudhry H & Harris AL Advances in Hypoxia-Inducible Factor Biology. Cell Metab 27, 281–298 (2018). [DOI] [PubMed] [Google Scholar]
- 61.Lee P, Chandel NS & Simon MC Cellular adaptation to hypoxia through hypoxia inducible factors and beyond. Nat Rev Mol Cell Biol 6, 020–0227 (2020). [DOI] [PMC free article] [PubMed] [Google Scholar]
- 62.Takenaga K Angiogenic signaling aberrantly induced by tumor hypoxia. Front Biosci (Landmark Ed) 16, 31–48 (2011). [DOI] [PubMed] [Google Scholar]
- 63.Perochon J, Yu Y, Aughey GN, Southall TD & Cordero JB Dynamic adult tracheal plasticity drives stem cell adaptation to changes in intestinal homeostasis. Nat Cell Biol, (2021) [DOI to be updated]. [DOI] [PMC free article] [PubMed] [Google Scholar]
- 64.Ohshiro T & Saigo K Transcriptional regulation of breathless FGF receptor gene by binding of TRACHEALESS/dARNT heterodimers to three central midline elements in Drosophila developing trachea. Development 124, 3975–3986 (1997). [DOI] [PubMed] [Google Scholar]
- 65.Santabarbara-Ruiz P, et al. ROS-Induced JNK and p38 Signaling Is Required for Unpaired Cytokine Activation during Drosophila Regeneration. PLoS Genet 11, e1005595 (2015). [DOI] [PMC free article] [PubMed] [Google Scholar]
- 66.André-Lévigne D, Modarressi A, Pepper MS & Pittet-Cuénod B Reactive Oxygen Species and NOX Enzymes Are Emerging as Key Players in Cutaneous Wound Repair. Int J Mol Sci 18(2017). [DOI] [PMC free article] [PubMed] [Google Scholar]
- 67.Jia Y-T, et al. Activation of p38 MAPK by Reactive Oxygen Species Is Essential in a Rat Model of Stress-Induced Gastric Mucosal Injury. The Journal of Immunology 179, 7808–7819 (2007). [DOI] [PubMed] [Google Scholar]
- 68.Warren CM, Ziyad S, Briot A, Der A & Iruela-Arispe ML A ligand-independent VEGFR2 signaling pathway limits angiogenic responses in diabetes. Science signaling 7, ra1–ra1 (2014). [DOI] [PMC free article] [PubMed] [Google Scholar]
- 69.Nezu M, et al. Nrf2 inactivation enhances placental angiogenesis in a preeclampsia mouse model and improves maternal and fetal outcomes. Sci Signal 10(2017). [DOI] [PubMed] [Google Scholar]
- 70.Reczek C & Chandel N The Two Faces of Reactive Oxygen Species in Cancer. Annual Review of Cancer Biology 1(2017). [Google Scholar]
- 71.Perez E, Lindblad JL & Bergmann A Tumor-promoting function of apoptotic caspases by an amplification loop involving ROS, macrophages and JNK in Drosophila. Elife 6(2017). [DOI] [PMC free article] [PubMed] [Google Scholar]
- 72.Ha E-M, et al. An Antioxidant System Required for Host Protection against Gut Infection in Drosophila. Developmental Cell 8, 125–132 (2005). [DOI] [PubMed] [Google Scholar]
- 73.Lee WJ & Brey PT How microbiomes influence metazoan development: insights from history and Drosophila modeling of gut-microbe interactions. Annu Rev Cell Dev Biol 29, 571–592 (2013). [DOI] [PubMed] [Google Scholar]
- 74.Jones RM, et al. Symbiotic lactobacilli stimulate gut epithelial proliferation via Nox-mediated generation of reactive oxygen species. The EMBO Journal 32, 3017–3028 (2013). [DOI] [PMC free article] [PubMed] [Google Scholar]
- 75.Kim SH & Lee WJ Role of DUOX in gut inflammation: lessons from Drosophila model of gut-microbiota interactions. Front Cell Infect Microbiol 3, 116 (2014). [DOI] [PMC free article] [PubMed] [Google Scholar]
- 76.Jang S, et al. Dual oxidase enables insect gut symbiosis by mediating respiratory network formation. Proceedings of the National Academy of Sciences 118, e2020922118 (2021). [DOI] [PMC free article] [PubMed] [Google Scholar]
- 77.Pitsouli C & Perrimon N Embryonic multipotent progenitors remodel the Drosophila airways during metamorphosis. Development 137, 3615–3624 (2010). [DOI] [PMC free article] [PubMed] [Google Scholar]
- 78.Gervais L & Casanova J The Drosophila homologue of SRF acts as a boosting mechanism to sustain FGF-induced terminal branching in the tracheal system. Development 138, 1269–1274 (2011). [DOI] [PubMed] [Google Scholar]
- 79.Bardin AJ, Perdigoto CN, Southall TD, Brand AH & Schweisguth F Transcriptional control of stem cell maintenance in the Drosophila intestine. Development 137, 705–714 (2010). [DOI] [PMC free article] [PubMed] [Google Scholar]
- 80.Sato M & Kornberg TB FGF is an essential mitogen and chemoattractant for the air sacs of the drosophila tracheal system. Dev Cell 3, 195–207 (2002). [DOI] [PubMed] [Google Scholar]
- 81.Kumar JP & Moses K EGF receptor and Notch signaling act upstream of Eyeless/Pax6 to control eye specification. Cell 104, 687–697 (2001). [DOI] [PubMed] [Google Scholar]
- 82.Ha EM, Oh CT, Bae YS & Lee WJ A direct role for dual oxidase in Drosophila gut immunity. Science 310, 847–850 (2005). [DOI] [PubMed] [Google Scholar]
- 83.Thibault ST, et al. A complementary transposon tool kit for Drosophila melanogaster using P and piggyBac. Nature Genetics 36, 283–287 (2004). [DOI] [PubMed] [Google Scholar]
- 84.Lee T & Luo L Mosaic analysis with a repressible cell marker (MARCM) for Drosophila neural development. Trends Neurosci 24, 251–254 (2001). [DOI] [PubMed] [Google Scholar]
- 85.Pitsouli C & Delidakis C The interplay between DSL proteins and ubiquitin ligases in Notch signaling. Development 132, 4041–4050 (2005). [DOI] [PubMed] [Google Scholar]
Associated Data
This section collects any data citations, data availability statements, or supplementary materials included in this article.
Supplementary Materials
Data Availability Statement
All data supporting the findings of this study are available from the corresponding authors on reasonable request.


