

Abstract
To determine the functional organization of premotor areas in the cat pericruciate cortex we applied intracortical microstimulation (ICMS) within multiple cytoarchitectonically identified subregions of areas 4 and 6 in the awake cat, both at rest and during treadmill walking. ICMS in most premotor areas evoked clear twitch responses in the limbs and/or head at rest. During locomotion, these same areas produced phase-dependent modifications of muscle activity. ICMS in the primary motor cortex (area 4γ) produced large phase-dependent responses, mostly restricted to the contralateral forelimb or hindlimb. Stimulation in premotor areas also produced phase-dependent responses that, in some cases, were as large as those evoked from area 4γ. However, responses from premotor areas had more widespread effects on multiple limbs, including the ipsilateral limbs, than did stimulation in 4γ. During locomotion, responses in both forelimb and hindlimb muscles were evoked from cytoarchitectonic areas 4γ, 4δ, 6aα, and 6aγ. However, the prevalence of effects in a given limb varied from one area to another. The results suggest that premotor areas may contribute to the production, modification, and coordination of activity in the limbs during locomotion and may be particularly pertinent during modifications of gait.
Keywords: cat, intracortical microstimulation, locomotion, premotor cortex
Introduction
The ability to volitionally adjust gait in response to environmental challenges is a key feature of natural locomotion among terrestrial mammals and one that entails the formation and timely execution of motor plans based on multimodal information. Studies from this and other laboratories have shown that such visually guided gait modifications involve multiple cortical and sub-cortical structures (reviewed in Drew and Marigold 2015), in much the same way as has been more extensively described in primates for reaching movements (Cisek and Kalaska 2010; Rizzolatti et al. 2014).
Most of our information on the cortical contribution to the control of locomotion in the cat comes from studies of the motor cortex and the posterior parietal cortex, both of which have been shown to be implicated in the control of visually guided gait modifications. The former is proposed to be involved with specifying the change in muscle activity required to step over an obstacle (Amos et al. 1990; Beloozerova and Sirota 1993; Drew 1993; Drew et al. 2008; Krouchev and Drew 2013; Drew and Marigold 2015), while the latter has been proposed to be involved in the planning of gait modifications (Beloozerova and Sirota 2003; Andujar et al. 2010; Marigold and Drew 2011, 2017; Drew and Marigold 2015), and particularly in determining the location of an object with respect to the body (Marigold and Drew 2017). Our recent experiments (Nakajima et al. 2019) further suggest that the premotor cortex is also involved in the control of gait modifications and that some parts of this structure are involved in the sensorimotor transformations required to convert global information about objects in the environment into the appropriate patterns of muscle activity required to negotiate that obstacle.
Our understanding of the contribution of the feline premotor cortex to the control of locomotion is, however, hampered by a lack of specific information on the functional characteristics of the different subregions that are proposed to compose the premotor cortex in the cat. For example, while the study of Nakajima et al. (2019) provides some information on two cytoarchitectonic regions, areas 6iffu and the rostral portion of area 4δ (4δr), there are a total of seven regions in the cat pericruciate cortex that have been identified as putative secondary motor areas. In the original classification of Hassler and Muhs-Clement (1964) area 6 was divided into three areas: 6iffu, 6aα, and 6aβ. More recently, this classification has been modified (Avendaño et al. 1992) on the basis of a reinvestigation of the cytoarchitecture, resulting in a change of the borders and the addition of a new area (6aγ). We follow Avendaño et al. (1992) and Ghosh (1997b) in using this modified nomenclature. In addition, Hassler and Muhs-Clement also subdivided area 4 into several subregions (4δ, 4fu, 4γ, and 4sfu) with area 4γ considered to correspond to the primary motor cortex and with the other three areas being considered as additional putative secondary motor areas. As indicated above, information on cell properties in tasks involving limb movements is absent for five of seven of these proposed secondary motor, or premotor, regions.
The presence of multiple secondary motor areas within cytoarchitectonic area 6 is similar to that described for the primate where a number of subdivisions of area 6 have been identified on both the lateral and medial surfaces of the frontal cortex (see e.g., Barbas and Pandya 1987; Matelli et al. 1991; Geyer et al. 2000; Belmalih et al. 2007). Altogether, six different subregions, frequently referred to as areas F2–F7 in one classification, have been identified in area 6 based on cytoarchitectonic features (see Matelli et al. 1991; Geyer et al. 2000). These areas are also referred to as the dorsal and ventral premotor areas on the lateral surface of the cortex (PMd and PMv, corresponding to areas F2 and F4, F5, respectively), and the supplementary motor area and the pre-supplementary motor areas on the medial surface of the cortex (SMA and pre-SMA, corresponding to areas F3 and F6). A separate rostral region of PMd (PMdr, area F7) has also been identified. In contrast to the situation in the cat, these areas have been extensively studied in terms of the characteristics of neuronal activity during the planning and execution of movement (Wise et al. 1996; Kalaska et al. 1998; Dum and Strick 2002; Hoshi and Tanji 2007; Dancause 2008; Rizzolatti et al. 2014), as well as in terms of the motor outputs evoked from these areas by microstimulation (Mitz and Wise 1987; Luppino et al. 1991; Godschalk et al. 1995; Boudrias et al. 2010a, 2010b). These studies have led to the conclusion that each of these subdivisions of area 6 makes a differential contribution to the planning and execution of reaching and grasping movements.
It is reasonable to suggest that each of the subdivisions in the cat premotor cortex may also make a differential contribution to the control of motor activity, including locomotion. As mentioned above, some evidence for this suggestion comes from our neuronal recording studies in the rostral bank of the cruciate sulcus (Nakajima et al. 2019). Differences in physiological functions would also be expected given that we know that there are differences in the cortico-cortical projections and inputs of some of these regions (Yumiya and Ghez 1984; Ghosh 1997a, 1997c; Andujar and Drew 2007; Nakajima et al. 2019). Similarly, many parts of area 6 project strongly to the pontomedullary reticular formation, again with some differences in the projection areas of different subregions (Keizer and Kuypers 1984; Matsuyama and Drew 1997; Rho et al. 1997). Further support for a functional specificity in the premotor areas of the cat comes from microstimulation studies. Ghosh (1997b), for example, has made a detailed examination of the motor responses evoked by microstimulation of different regions of area 6 in the anesthetized cat and demonstrated both that motor effects can be evoked from most subdivisions of area 6 and that the nature of those effects varies between areas.
However, there is little detailed information on the motor effects evoked in the awake cat beyond one study that examined those parts of area 6 that are accessible on the cortical gyri (Nieoullon and Rispal-Padel 1976). Microstimulation was not applied within the cruciate sulcus where many of the subregions of area 6 are found. During locomotion, there are several studies on the effects of stimulating the primary motor cortex (area 4γ: Drew and Rossignol 1984; Rho et al. 1999; Bretzner and Drew 2005b), or the pyramidal tract (Orlovsky 1972) on the activity of limb muscles of the fore- or hindlimb, but none to examine the effects of the secondary motor areas on locomotion.
In the current study, we use microstimulation to determine the motor outputs of different cytoarchitectonic regions of areas 4 and 6. We determine first the similarities and differences in the motor effects evoked from different areas in the awake, unrestrained cat at rest. More importantly, however, we extend these microstimulation studies to determine the capacity of activation of these secondary motor areas to influence motor activity during locomotion, and to determine whether there is areal specificity in the nature of the evoked activity. Further, we suggest that given the fact that many of these areas provide strong inputs to the pontomedullary reticular formation, which has a widespread influence on multiple limbs (Drew and Rossignol 1990b; Drew 1991; Prentice and Drew 2001), microstimulation within area 6 might equally provide more widespread effects than those observed from stimulation of the primary motor cortex. Such activity would be compatible with a role in coordinating limb activity both on the approach to, and during the step over, an obstacle.
Our results are compatible with the key elements of these proposals in showing that many of the secondary motor areas are indeed capable of modifying the level of motor activity during locomotion. Moreover, many of these areas have effects on both fore- and hindlimbs as well as weaker effects on the ipsilateral limbs, with different areas showing some specificity in the nature of the effects that are evoked.
Methods
Experiments were performed on four male cats (P1, P2, P4, and P5; weights: 4.1–5.3 kg) trained to walk at a comfortable and constant speed (0.4–0.45 m.s−1) on a treadmill for bouts of 10–20 min. In parallel with the stimulation experiments presented here, neuronal activity was recorded in all cats, with some data from P1 and P2 detailed in a prior publication (Nakajima et al. 2019).
Surgery
Following training, the cats were prepared for aseptic surgery under general anesthesia. Induction was achieved by intramuscular injection of ketamine (11 mg/kg), combined with acepromazine maleate (50 μg/kg) and glycopyrrolate (10 μg/kg). The cats were then intubated and anesthetized with isoflurane (2–3% with oxygen). Fluids and corticosteroids (methylprednisolone, 15–30 mg/kg) were administered through a catheter. Heart rate, body temperature, blood oxygen saturation, and the depth of anesthesia were continuously monitored. The animals were placed in a stereotaxic frame using a pair of atraumatic ear bars coated with xylocaine; petroleum jelly was applied to the eyes to prevent desiccation of the cornea. A craniotomy was performed over the right hemisphere to expose the pericruciate cortex as well as the presylvian and ansate sulci. A recording chamber (internal dimensions 10 × 15 mm) was placed over the cranial aperture tilted rostrally at a 20° or 25° forward angle with respect to the stereotaxic horizontal plane and fixed in place with dental acrylic (Drew 1993). To identify corticofugal neurons in layer V of the cortex, in one cat (P1), two arrays of microwires were stereotaxically implanted into the cerebral peduncle (coordinates A 4.0, L 3.0 and A 4.0, L 5.0) by using a harpoon assembly (Palmer 1978; Drew 1993). For the other cats (P2, P4, P5), one array was implanted into the cerebral peduncle (A 4.0, L 3.5) and the other into the pyramidal tract (P 7.0, L 1.2). Pairs of Teflon-coated, braided stainless steel wires were implanted into selected muscles of the forelimbs and hindlimbs (Drew et al. 1986; Drew 1993). A single dose of a long-acting antibiotic (cefovecin sodium, 8 mg/kg) was injected subcutaneously, and analgesics (buprenorphine, 5 μg/kg SC 4 days; Gabapentin, 20 mg/kg PO 7 days) were administered postoperatively. The cats were allowed to recover for 1–2 weeks before beginning experiments. All surgical procedures followed the recommendations of the Canadian Council on Animal Care and protocols were approved by the local animal ethics committee.
Protocol
During each experimental session, a custom-made microdrive was attached to the recording chamber and a glass-insulated tungsten microelectrode (impedance of 0.5–1.5 MΩ) was advanced into the cortex at an angle perpendicular to the recording chamber. Penetrations (one per day) were made in a grid pattern generally separated by a minimum of 0.5 mm in both the rostrocaudal and mediolateral planes; in a few cases, penetrations were made with a separation of 0.25 mm. Because of the geometry of the cat’s brain, the electrode typically crossed the cortex up to three times during its descent (generally traversing either the posterior sigmoid gyrus and both banks of the cruciate sulcus, or the anterior sigmoid gyrus and the presylvian sulcus, see e.g., Supplementary Figure S2). As we traversed each region of the cortex, we identified cortical layer V by the presence of neurons discharging antidromically in response to stimulation of the microwires implanted in the cerebral peduncle or the pyramidal tract. After recording cellular activity during locomotion (data not presented here), we applied intracortical microstimulation (ICMS) (cathodal current, 11 pulses at 330 Hz, pulse duration 0.2 ms, 5–100 μA) in layer V with the cat calmly standing or sitting on the treadmill and determined the threshold and nature of the responses evoked in the limbs, trunk, head, and face. Limbs were methodically palpated, unloaded and passively manipulated by the experimenter in search of the most responsive posture. Threshold was defined as the lowest current intensity eliciting a consistent movement. Stimulation was then applied at 1.5–2 times the threshold (1.5–2 T) for movement, up to a maximum of 100 μA, and EMG activity was recorded while the responsive limbs were unloaded. Evoked electromyographic (EMG) activity was amplified, band-pass filtered (100–450 Hz), and digitized at a sampling rate of 2 kHz from −50 to +150 ms relative to the onset of the stimulus.
We then applied microstimulation in the same site while the cat walked on the treadmill. For the experiments during locomotion, trains of stimuli (identical to those used for stimulation with the cat at rest) were delivered at every third step cycle at varying delays following the onset of activity in either the contralateral Cleidobrachialis or Sartorius (coClB, coSrt; indicators of forelimb and hindlimb swing onset, respectively), based on whether the main effects observed at rest were in the forelimb or hindlimb. The delays were applied in the following non-sequential order: 100-600-0-500-200-700-300-800-400-900 ms, effectively covering the entire step cycle, and 15 to 20 repetitions were made at each delay. In addition to recording the EMG activity at 2 kHz from −50 to +150 ms relative to the onset of the stimulus we also made a continuous record of the EMG activity during locomotion at 1 kHz. Video recordings (60 frames/s) were made of all experiments and synchronized to the EMG data by means of a digital time code. This allowed us to inspect the recordings off-line to ensure that only periods of stable walking were included for analysis.
Data Analysis
The data obtained from stimulation at rest were rectified and averaged. We determined the onset and offset of cortically evoked EMG responses using the interval of confidence (P < 0.01) of the standard error of the mean (SE) of the prestimulus period as a guideline. The magnitude of the net evoked responses was then computed by subtracting the prestimulus EMG amplitude (for an identical period of time) from the selected evoked EMG responses.
For the data in which stimulation was applied during locomotion, we first identified the beginning and end of the step cycles with reference to the onset of either the coClB or coSrt muscle. Unstimulated step cycles preceding the stimulated ones were defined as control cycles and averaged together. For each stimulated step cycle, the phase of stimulation was calculated as the delay of the stimulus from cycle onset, divided by the duration of the average control step cycle. Based on this phase, the stimuli were then sorted into one of 10 equal periods (groups) partitioning the full duration of the control step cycle (Fig. 1A: see Bretzner and Drew 2005b; Dyson et al. 2014).
Figure 1 .
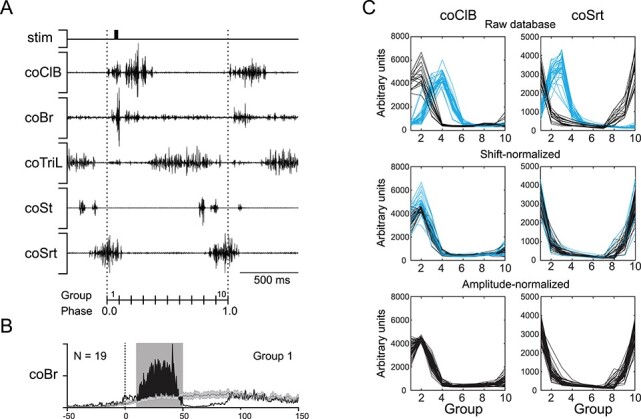
Method of EMG averaging and correction. A: Electromyographic (EMG) recording of multiple muscles in a single stimulated step cycle, defined in reference to the onset (vertical dotted lines) of the contralateral Cleidobrachialis (coClB). The step cycle is divided into 10 equal groups based on the average duration of the control step cycles, where the first group encompasses the first tenth of the step cycle (phase 0.0–0.1). Here, stimulation falls in the first group. B: averaged evoked response in the contralateral Brachialis (coBr; black line) to 19 stimuli occurring in group 1 (average phase = 0.04). The average response is displayed together with the averaged activity of 106 unstimulated, control, cycles (gray line ± SE with 95% CI), triggered on the same average phase of the step cycle (i.e., phase 0.04). The filled black area indicates the net response, with the objective window of analysis (in gray) spanning from 10 to 50 ms post-stimulus onset. C: Examples of shift and amplitude normalization. Top: EMG activity of the coClB (left) and sartorius (coSrt, right) from all sites of cat P2, synchronized on either the coClB (black) or coSrt (blue). Middle: Shift-normalized EMG activity, where coSrt-synchronized sites have been circularly shifted by −20% (two groups) of the cat’s standard step cycle. Differences in peak control amplitude remain due to gradual changes in EMG signal across experimental sessions. Sites whose peak control activity are less than 1SD from the reference peak amplitude (see Methods) for the muscle are displayed in black. Outliers are displayed in blue. Bottom: Amplitude normalization is applied: outliers are scaled to the muscle’s reference peak amplitudes. Abbreviations: St, semitendinosus; TriL, lateral head of triceps.
In each group, the EMG traces were rectified, averaged, and superimposed onto the averaged EMG activity of the control steps for the same period (Fig. 1B). To objectively compute the magnitude of the responses, we first used the interval of confidence (P < 0.01, SE) of the control activity as a guideline to determine, from a subset of sites, the time of onset and offset of the response for each muscle. We then used these values to define a fixed window of analysis specific to the muscle (e.g., 10–50 ms post-stimulus onset for the contralateral brachialis, coBr, in Fig. 1B). This window was used for all sites for all cats. In this window, the averaged EMG trace was integrated and the control activity for the same period was subtracted (Dyson et al. 2014). The resulting values therefore represent the net integrated response to stimulation at a particular phase of the step cycle. For all muscles, in all cats, the maximum extent of the window was 50 ms; this avoided the inclusion of secondary responses that frequently followed the initial effects in a muscle (see e.g., Fig. 1B). The onset of the window varied from 10 to 20 ms depending on the muscle, with the longer onset latencies being used primarily for hindlimb muscles.
Phase Normalization
In P1 and P2, microstimulation was applied with respect to the onset of the coSrt if the major response to stimulation at rest was in the hindlimb. This resulted in phase differences with respect to the response obtained in a given muscle depending on the muscle used for synchronization (Fig. 1C, top panel). To allow the pooling of coClB- and coSrt-synchronized sites, we applied a circular phase shift to the latter based on a comparison of the grouped control data. Briefly, a least-squares minimization protocol was used to determine the relative shift that produced the lowest absolute difference in EMG amplitude between the multi-site averages of a cat’s coClB- and coSrt-synchronized control step cycles, tested by sliding back the coSrt-synchronized average one group (i.e., one-tenth of a step cycle) at a time. We then shifted all of the values in the test EMG according to the phase that produced the lowest sum of the squares of the differences in value between test and control traces. This protocol was applied to both the coClB and coSrt muscles, concurring on a two-group phase shift for coSrt-synchronized sites in both cats, which was then applied throughout their dataset (Fig. 1C, middle panel).
Amplitude Normalization
Due to the extended period of data collection for each cat (>8 months), there was sometimes a slow change in the amplitude of some of the EMG signals from the indwelling electrodes. To allow the comparison of response magnitudes between sites recorded at different times, we applied an amplitude normalization protocol based on the magnitude of the EMG activity in the unstimulated step cycles. First, for each site, peak EMG amplitude was extracted for each muscle using the grouped control data (i.e., the highest value among the 10 groups; see thin line in Fig. 1B). A reference value and standard deviation (SD) of peak amplitude was then computed for all muscles from the mean calculated from experimental sessions 10–20 in each cat, when activity was stable. Evaluating one muscle at a time, each site’s EMG peak amplitude was compared to that reference. For any site whose EMG value lay above or below the reference value ±1SD, a correction factor was calculated so that its normalized peak activity would equal that of the reference (Fig. 1C, lower panel). This correction factor was equally applied to the responses evoked by the stimulation (and the control values) to permit comparison of the responses evoked throughout the recording period.
To allow comparisons of the responses evoked in different muscles, limbs, and cats, we expressed the magnitude of the evoked responses as a ratio of the magnitude of peak averaged EMG activity observed during control locomotion (as described in the previous paragraph). Response magnitudes greater than the average control values are expressed as positive values while response magnitudes that are smaller than the average control values are expressed as negative values. Changes with ratios <0.25 with respect to the peak control value were classified as no response, thereby eliminating responses that were only just above the noise level. Response values were adjusted similarly whether stimulation was applied at rest or during locomotion.
Histology
Near the end of the experimental series, small electrolytic lesions (50 μA, DC cathodal current) were made in layer V in selected penetrations to aid histological reconstruction. The cats were deeply anesthetized with sodium pentobarbital (Somnotol 30 mg/kg, IV) and perfused transcardially with sequential buffered solutions of physiological saline, formaldehyde (4%), and sucrose (4%). The brains were blocked, cryo-protected in 20% sucrose, sectioned at 40 μm thickness in the para-sagittal plane, mounted on glass slides and stained with cresyl violet. We identified stimulation sites from the visible tracks left by each electrode penetration as well as the presence of electrolytic lesions carefully disseminated across the recording area through a subset of those penetrations.
To accurately map the position of the stimulation sites, we calculated the rostro-caudal coordinate of each site as its distance from the fundus of the cruciate sulcus, measured along the straightened layer V (Jiang and Drew 1996; Andujar and Drew 2007). We determined medio-lateral coordinates from the laterality of the brain sections in which the sites were identified. These coordinates were used to plot the location of each stimulation site on a flattened map of the cortex centered on the fundus of the cruciate sulcus (see Supplementary Figure S1 and Fig 2E, F). The rostral bank of the cruciate sulus is depicted to the left of the fundus and stimulation sites are represented by negative values with respect to the zero point of the fundus; sites caudal to the fundus are indicated by positive values. Cytoarchitectonic borders, as well as major sulci and gyri of the frontal cortex, were plotted on the flattened map, as above; abbreviations for cytoarchitectonic areas and anatomical landmarks are provided in Table 1. Note that none of our stimulation sites were located within the medial wall of the cortex. There are therefore no data points medial to 1.5 mm in these flattened maps. For area 4γ, we identified a forelimb and a hindlimb representation. Because these two representations are not clearly spatially differentiated within the lateral margins of the cruciate sulcus (see Results), sites were identified as 4γFL or 4γHL on the basis of the movement evoked at threshold. A few sites in 4γ evoked both forelimb and hindlimb movements at threshold and these were classified separately as 4γFH.
Figure 2 .

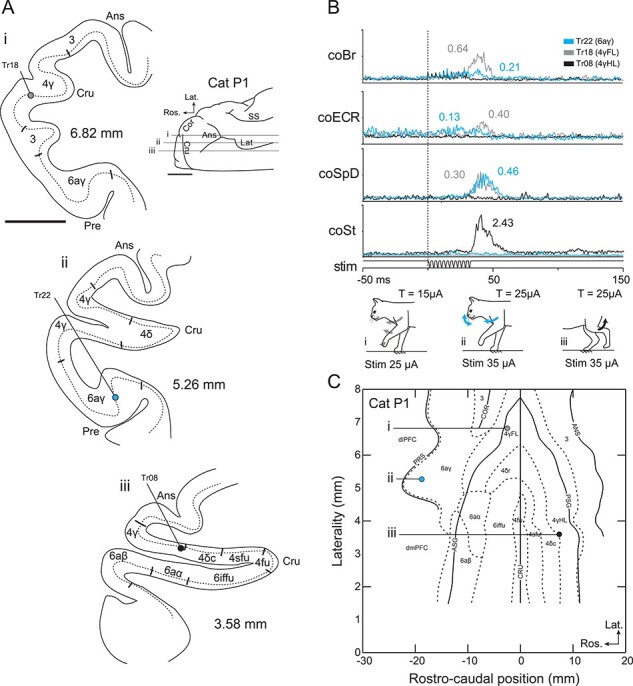
Representative movements evoked by threshold stimulation at rest. A: Drawing of the dorsal surface of the cat brain showing the location of the cruciate sulcus (Cru) and the schematic representation of the penetrations illustrated in B(b) and C(c). B: Tracing of a parasagittal section from cat P2 at a laterality of 3.8 mm from the midline (corresponding to b in Fig. 2A). The section includes several cytoarchitectonic areas including areas 4γ, 4δc, 4sfu, and 4fu in the dorsal bank of the sulcus, together with areas 6iffu, 6aα, and 6aγ in the rostral bank. We illustrate all sites at which ICMS was applied at the same laterality with respect to chamber coordinates (histology showed that all of these tracks crossed layer V at 3.3–3.8 mm from the mid-line). For each stimulation site we illustrate the movement evoked (see color key); the size of the symbol represents the threshold of that response (see key for thresholds). C: Parasagittal section from cat P4 (laterality 5.7 mm, represented by c in Fig. 2A) with all stimuli applied at a laterality of 5.5–5.8 mm. D: schematic pseudo-3D representation of the brain showing the different cytoarchitectonic regions within the cruciate sulcus (adapted from Keizer and Kuypers 1984; Drew 1993). E. The stimulated sites from B are plotted on a flattened map of cat P2. Numbers indicate individual tracks as identified in B. F: data from section illustrated in C plotted on a flattened map of cat P4. Note that the values on the x-axis provide relative distance of stimulation sites rostral (negative values) and caudal (positive values) with respect to the fundus of the cruciate sulcus. Abbreviations: Ans, Ansate; ASG, anterior sigmoid gyrus; Cor, Coronal; Cru, Cruciate; dlPFC, dorsolateral prefrontal cortex; dmPFC, dorsomedial prefrontal cortex; Lat, Lateral; Ros, Rostral; Prs, Presylvian; PSG, posterior sigmoid gyrus; T, threshold; Tr, track. Scale bar (B,C) = 5 mm.
Table 1.
Abbreviations for cytoarchitectonic areas and anatomical structures used in the manuscript
| Cytoarchitectonic Areas | |
| Area 4γ | Primary motor cortex, M1 |
| Caudal bank of cruciate sulcus | |
| Area 4δ | Secondary motor region of cytoarchitectonic area 4 |
| Area 4sfu | Secondary motor region of cytoarchitectonic area 4 |
| Area 4fu | Secondary motor region of cytoarchitectonic area 4 |
| Rostral bank of cruciate sulcus and anterior sigmoid gyrus | |
| Area 6aα | Secondary motor region of cytoarchitectonic area 6 |
| Area 6aβ | Secondary motor region of cytoarchitectonic area 6 |
| Area 6aγ | Secondary motor region of cytoarchitectonic area 6 |
| Area 6iffu | Secondary motor region of cytoarchitectonic area 6 |
| Anatomical sulci and gyri | |
| Ans: | Ansate sulcus |
| ASG: | Anterior sigmoid gyrus |
| Cor | Coronal sulcus |
| Cru | Fundus of the Cruciate sulcus |
| dlPFC | Dorsolateral prefrontal cortex |
| dmPFC | Dorsomedial prefrontal cortex |
| Lat | Lateral sulcus |
| Orb | Orbital sulcus |
| Prs | Presylvian sulcus |
| PSG | Posterior sigmoid gyrus |
| SS | Suprasylvian sulcus |
To allow superimposition of data recorded from the four different cats we used a custom Matlab program based on the warping algorithm developed by Archibald (2020) using thin plate splines. In brief, we identified a number of fiducial points identifying the borders of the cytoarchitectonic areas together with key sulci and gyri and used the algorithm to morph the data from each cat onto the map created from cat P1. This allowed us to combine data from different cats, despite differences in the morphology of the brains. The method is further explained and illustrated in Supplementary Figure S1. Note that the same morphing routine was applied to the coordinates of the stimulation sites so that they maintained their location within a given cytoarchitectonic region after the morphing process.
Results
Database
Microstimulation with the cat at rest was applied in a total of 519 sites throughout the different subdivisions of areas 4 and 6 across four cats (see Table 2) and these data will be described first. Stimulation during locomotion was applied in 245/519 of those sites and is reported in the second part of this manuscript. As only four sites were stimulated in area 4fu, this area was not considered further.
Table 2.
Number of sites stimulated at rest and during locomotion
| Cat | Number of sites (locomotion/rest) | |||||||||||
|---|---|---|---|---|---|---|---|---|---|---|---|---|
| 4γFL | 4γHL | 4γFH | 4δr | 4δc | 4sfu | 4fu | 6aα | 6aβ | 6aγ | 6iffu | TOTAL | |
| P1 | 9/14 | 9/17 | 2/2 | 2/3 | 7/23 | 0/0 | 0/0 | 4/9 | 2/6 | 3/26 | 2/25 | 40/125 |
| P2 | 8/9 | 18/21 | 1/1 | 4/8 | 11/22 | 1/12 | 0/3 | 7/15 | 0/8 | 3/9 | 0/36 | 54/144 |
| P4 | 20/66 | 2/2 | 0/1 | 4/4 | 4/4 | 0/0 | 0/0 | 17/18 | 0/0 | 35/44 | 1/1 | 83/140 |
| P5 | 7/27 | 4/16 | 0/2 | 3/4 | 14/14 | 2/2 | 1/1 | 15/16 | 5/6 | 5/10 | 12/15 | 68/110 |
| TOTAL | 44/116 | 32/53 | 3/6 | 13/19 | 36/63 | 3/14 | 1/4 | 43/58 | 7/20 | 47/89 | 15/77 | 244/519 |
The number of sites stimulated during locomotion is presented as a function of the number of sites stimulated at rest for each cytoarchitectonic region that we studied. Note that for area 4γ, the division into three representations is based on the movements evoked at threshold (see Methods). Area 4δ was divided in 4δr and 4δc, as in the study of Ghosh (1997b).
Movements Evoked by Stimulation at Rest: Threshold Responses
The most common responses evoked by stimulation at rest were either a brief movement (generally a flexion) around a single joint of a single limb, movement of the head, or twitch responses in facial musculature. Responses were occasionally combined and movement of more than one limb was occasionally observed. The nature of the responses depended on the cortical region that we stimulated. Although we determined the joint around which movement was evoked during these experiments, in the description that follows we refer only to the limb in which the movement was evoked.
In general, microstimulation within a given cytoarchitectonic area produced responses with similar characteristics, while transition from one cytoarchitectonic area to another resulted in a qualitative change in the nature of the movements that were evoked. Figure 2, for example, illustrates the effects of stimulating in different rostro-caudal locations at two different lateralities (see Fig. 2A). Because the cruciate sulcus is oriented caudally within the depths of the frontal cortex, the most caudal penetrations (e.g., track 33 in the medial row of penetrations and track 26 in the more lateral row) cross the cruciate sulcus at its most caudal aspect (see Fig. 2B, C). More rostral penetrations cross the cruciate sulcus more rostrally, passing first through the dorsal bank and then into the ventral bank. Some extend further to the dorsal bank of the presylvian sulcus (e.g., Tr25 in Fig. 2C).
The movements evoked in different regions of the motor and premotor cortices at these two lateralities are detailed in Figure 2B, C. Figure 2B illustrates the effects evoked by stimulating at 15 different rostro-caudal locations at a single mediolateral chamber coordinate in cat P2. Histology showed that the laterality at which these penetrations crossed layer V within the dorsal bank of the cruciate sulcus ranged from 3.3 to 3.8 mm. Within the dorsal bank of the cruciate sulcus, the three penetrations that entered the cortex just caudal to the cruciate sulcus (including track 38) crossed layer V within area 4γ. Microstimulation at two/three sites produced movements of the hindlimbs at threshold currents of ≤25 μA, while the most caudal of the three sites, close to where we identified the border with 4δc, produced a combined movement of the forelimb and hindlimb. Within area 4δc, stimulation produced movements of the forelimb (rostrally) and of the hindlimb (caudally). Three tracks in area 4sfu were without effect at 100 μA.
Changes in responses over small distances around cytoarchitectonic borders were also observed in the ventral bank of the cruciate sulcus and the adjoining anterior sigmoid gyrus, as also illustrated in Figure 2B. Penetrations that entered the cortex caudal to the cruciate sulcus targeted area 6iffu (e.g., Tr33). Microstimulation in this region was mostly ineffective at 100 μA or produced responses in the forelimbs, generally slow movements of the wrist as opposed to the brisk twitches observed in other areas. Penetrations made more rostrally crossed area 6aα and produced a variety of movements, including of the forelimb, hindlimb, and of the head. One site produced movements of the forelimbs and hindlimbs.
The results of stimulating in the series of penetrations made more laterally in the cortex (as represented in the schematic illustration of Fig. 2A) are illustrated in Figure 2C. In this example, forelimb responses were evoked from both the caudal and rostral banks of the cruciate sulcus in area 4γ, while a hindlimb response was evoked from the track that crossed 4δr. Displacement of the electrode from area 4γ to area 6aγ was marked by a rapid transition in which responses in face musculature were now evoked at low intensity. Occasionally, responses were evoked simultaneously in forelimb and facial musculature (cyan symbol).
The location of these penetrations can be better synthesized by plotting them on flattened maps of the cortex (see Methods) that are centered on the fundus of the cruciate sulcus. This is represented schematically in Figure 2D in which the cruciate sulcus is opened to reveal the different regions within. The effect of flattening the cortex according to the distance of different landmarks from the fundus (see Methods) is illustrated in Figure 2E and F. In this representation, the most rostral site, in area 6aα (track 44), is plotted at the extreme left of the row of responses in Figure 2E and site 38 in the caudal bank is plotted at the extreme right. The stimulation sites in Figure 2C are likewise plotted on the flattened representation of the cortex in Figure 2F.
The locations of all 519 stimulated sites, together with the principal movement evoked in the different subdivisions of areas 4 and 6 by ICMS at threshold, are shown in Figure 3 for each of the four cats (P1, P2, P4, and P5) used in this study. The stimulation was effective in producing movement at ≤100 μA in 421/519 sites. Note that while sampling across the pericruciate cortex in P1, P2, and P5 was generally uniform, ICMS in cat P4 was concentrated in the rostrolateral aspect of the pericruciate cortex to increase sampling of area 6aγ. The size of each symbol in Figure 3 indicates the threshold of the current necessary to evoke a given movement (see key). In general, and ignoring cytoarchitectonic boundaries for the moment, forelimb responses were evoked mostly from rostral and lateral regions, hindlimb movements mostly from medial and caudal regions, and face and head responses were concentrated in the most rostral regions. This broad pattern of topographical representation is similar to that described in previous studies (Nieoullon and Rispal-Padel 1976; Armstrong and Drew 1984b; Ghosh 1997b). Overall, we placed an emphasis on those parts of areas 4 and 6 that are considered as putative premotor areas and that have not been extensively studied before in the cat, and rarely in the unrestrained animal. As such, we do not present detailed findings for the organization of area 4γ, which can be found in several other studies (see Introduction). Rather, we use ICMS in area 4γ primarily as a base for comparison with the responses to ICMS in the other regions.
Figure 3 .

Maps of all responses evoked by threshold stimulation at rest in cats P1–5. Data are plotted on flattened maps as in Figure 2E, F. Each symbol depicts the location of a stimulation site in area 4 or 6, with the type of movement evoked from a given site indicated by a color code (see Key). The size of the markers indicates the movement threshold divided into four categories (see Key). Small open symbols represent sites in which 100 μA stimulation evoked no discernible movement. The white stars and arrows in P1 and P4 indicate the sites used in Figures 7 and 9, respectively. Abbreviations: FL, forelimb; HL, hindlimb; N, number of stimulated sites in each cat.
A comparison of threshold values within and between cats is provided in the box plots of Figure 4. As expected, the threshold for evoking movement from area 4γ was significantly lower (P < 0.05, paired t-test with Tukey correction) than that from all other areas studied. Thresholds in area 6aγ were also relatively low, while those in areas 4δc and 4δr were slightly higher and on a par with the thresholds for movement in area 6aα. Median values for evoking threshold responses were ≤35 μA in areas 4γ, 4δr, 6aα, and 6aγ. Thresholds were substantially higher in areas 4sfu, 6aβ, and, especially, area 6iffu. Note that threshold values between cats were very similar.
Figure 4 .

Thresholds for evoking movements in different cytoarchitectonic areas. Individual threshold values for each responsive stimulation site are displayed as single, semi-opaque markers. The intensity of the shading is proportional to the number of sites with a given threshold (see key). Data from P1, 2, 4, and 5 are separated in four columns, respectively, from left to right. A superimposed boxplot depicts the median (red line), 25th and 75th percentiles (boxes), and extremes (whiskers) excluding outliers. The dashed black line at 35 μA threshold indicates the empirical upper limit of normal response thresholds in area 4γ that we have used in previous publications (Drew 1993; Widajewicz et al. 1994).
Movements Elicited by Stimulation at Rest: Suprathreshold Responses
A more global view of the organization of the responses is provided by Figure 5 in which the results from each cat have been morphed onto a single cortical map based on cat P1 (see Methods and Supplementary Figure S1). Moreover, we now present the movements evoked by stimulation at 1.5–2 T to allow comparison with the EMG recordings made at rest and during locomotion (which were made only at the higher strength). Increasing the current strength from 1 T to 1.5–2 T produced stronger, but identical movements at the majority of effective sites (381/421, 90%).
Figure 5 .

Cortical regions producing different movements. The data illustrated in Figure 3 have been morphed onto a standard flattened map based on the cortex of cat P1 (see Methods and Suppl. Fig. 1 for morphing technique). A: responses evoked from all 519 sites stimulated in all four cats using the same color code as in Figure 3. B–F illustrate the cortical regions from which stimulation evoked different types of movement (see also figurines in bottom left of each panel). The values in the top right indicate the number of sites in each map. Numbers in parentheses indicate the change in representation at 1.5–2 T with respect to T. For example, 22 additional sites (open circles) produced forelimb and hindlimb movements at 1.5–2 T compared with T (D) and there were 14 fewer exclusive forelimb sites at 1.5–2 T (B).
Sites that evoked responses in the forelimb (blue circles) were concentrated in the rostrolateral region of area 4γ. However, forelimb responses were evoked widely throughout the studied region, including within areas 6aα, 6aβ, 6aγ, and 4δ (Fig. 5B). Sites that produced movements of the hindlimb were concentrated in the caudomedial bank of the cruciate sulcus in area 4γ, generally referred to as the hindlimb representation in the cat (Nieoullon and Rispal-Padel 1976; Armstrong and Drew 1984b; Widajewicz et al. 1994), but were also found more laterally, within the banks of the cruciate sulcus. Hindlimb movements were also evoked from area 4δc, as well as 4δr and area 6aα (Fig. 5C). No hindlimb movements were evoked from areas 6aβ or 6iffu and only two sites in area 6aγ produced hindlimb movements, both lying on the border with area 6aα. Responses in face musculature or movements of the head were primarily evoked from areas 6aγ and 6aα, with some responses also from area 6aβ and 6iffu (Fig. 5E).
Stimulation in some sites produced combined movements of the forelimbs and hindlimbs (Fig. 5D) or of the face/head and the forelimb (Fig. 5F). While such combined movements were observed at threshold, they became more prevalent at 1.5–2 T. For example, at T, responses in both the forelimbs and hindlimbs were produced from 19 sites, while at 1.5–2 T, an additional 22 sites produced movements of both limbs (open circles in Fig. 5D). These sites were concentrated in areas 4δc, 4δr, and 6aα. Similarly, while movements of the face/head and forelimb were observed at T, the number of sites producing such combined movements doubled at 1.5–2 T (Fig. 5F).
Sites that were unresponsive at 100 μA were particularly frequent in area 6iffu and the more medial regions of area 4δc. No evoked movements were observed in the ipsilateral limbs.
While the general distribution of movements gives an appearance of being independent of cytoarchitectonic boundaries, both the intensity of the current required to evoke a movement (Fig. 4) and the pattern of movement evoked from each area shows clear differences. This latter issue is illustrated in Figure 6. Stimulation of area 4γ (the primary motor cortex) at 1.5–2 T for example produced movements almost exclusively in the forelimb or the hindlimb (Fig. 6) and only 16/175 sites produced combined movements of the forelimbs and hindlimbs. Responses evoked in areas 4δc and 4δr had a similar profile to area 4γ but the responses evoked in the forelimb and hindlimbs together formed a higher percentage than in 4γ. Area 6aα also evoked forelimb and combined forelimb-hindlimb responses, but fewer hindlimb-only responses. In addition, responses in face/head were evoked, sometimes combined with forelimb movements. Similar effects to those evoked from area 6aα, although with significantly higher threshold, were observed in 6aβ. Area 6aγ stood out from the other areas because of the high proportion of low threshold responses evoked in the face/head, sometimes combined with forelimb movements, which were also observed in isolation from some sites. In contrast, area 6iffu was characterized by the large proportion of ineffective sites.
Figure 6 .

Summary of movement representation: Bar plots illustrating the number (left axis) and relative proportion (right axis) of movements evoked by stimulation at 1.5–2 T in different subdivisions of areas 4 and 6 with the cat at rest. For each area, the number of occurrences of a specific movement, pooled across all animals, is displayed above that movement’s bar. Abbreviations: F/H, face or head; FL, forelimb; F/H, forelimb with face or head; FL, HL forelimb and hindlimb; NE, no effect.
EMG Responses Evoked by Stimulation at Rest: Suprathreshold Responses
Stimulation at 1.5–2 T evoked robust EMG responses in multiple muscles consistent with the movements evoked. Figure 7A, for example, shows three penetrations made in three different regions: from top to bottom, 4γFL, 6aγ, and 4γHL. The responses evoked in three representative contralateral forelimb flexor muscles (coBr; extensor carpi radialis, coECR, and spinodeltoideous coSpD), and one hindlimb flexor muscle, contralateral semitendinosus (coSt), by stimulation in these three penetrations is illustrated in Figure 7B. Stimulation in area 4γFL (gray traces) evoked robust responses in all three forelimb flexor muscles, but no response in the coSt. Stimulation in area 4γHL (black traces) evoked the opposite effects, with a robust response in the coSt, but no responses in any of the forelimb muscles. Stimulation of area 6aγ evoked a robust response in the coSpD, weak responses in the coBr and coECR, and no responses in the coSt (blue traces); there was also movement of the whiskers.
Figure 7 .
Representative EMG responses evoked from areas 4γ and 6aγ. A. Left: Parasagittal sections of the cortex showing three representative stimulation sites. The different cytoarchitectonic subdivisions of areas 4 and 6 as well as the different sulci, are illustrated. The dotted line indicates cortical layer V. Right: Dorsal view of the cat’s right cortex, with the lateralities of the illustrated sections (the presylvian sulcus is not clear on this dorsal view). B. EMG responses evoked in selected muscles by stimulation of the three sites shown in A. The different colors identify the three sites as illustrated by the key and by the figurines (bottom). The values beside each trace indicate the magnitude of the response as a ratio with respect to the peak control activity of the muscle during locomotion (see Methods). C. Map of the flattened cortex showing the position of stimulation sites relative to the sulci, gyri, and cytoarchitectonic borders. Muscle Abbreviations: ECR, extensor carpi radialis; SpD, spinodeltoideus. Scale bars in A = 5 mm.
The spatial distribution of the evoked EMG responses is illustrated in Figure 8A for representative muscles of the contralateral forelimb and hindlimb (coBr and coSt) and is compatible with the distribution of the evoked movements illustrated in Figure 5. Responses in coBr and coSt were evoked from large regions of the pericruciate cortex, corresponding to the regions from which movements of the forelimb and hindlimbs, respectively, were observed (Fig. 5). For example, responses were evoked in at least one of the forelimb flexor muscles that we recorded from each of the stimulated sites in area 4γFL (Fig. 8B). In our exemplar muscle, coBr, responses were evoked from 79% of sites in area 4γFL, while responses were evoked in coSt from 71% of sites in 4γHL (Fig. 8B). The frequency of evoked responses in the coBr and coSt (and other muscles) was substantially lower from sites stimulated in the other subdivisions of areas 4 and 6 illustrated in Figure 8B, although it did attain 20–40% in some cases. When responses were present, they were frequently robust (see Fig. 7B). In areas 6aβ and 6iffu, responses in limb muscles were evoked from a maximum of 7% of sites (not illustrated). Although perceptible movements of the ipsilateral limbs were never observed, we did obtain occasional responses in ipsilateral muscles.
Figure 8 .

Spatial representation of EMG responses recorded in the subdivisions of areas 4 and 6 upon stimulation at rest. A: The EMG responses evoked in coBr and coSt from all four cats are morphed onto a single flattened representation of the brain. The filled symbols indicate increased activity: only changes that differed by more than 25% from control (ratio of 0.25) are illustrated. The gray symbols indicate no response (ratio <0.25). The size of the circle is proportionate to the magnitude of the response (see key). B: For each cytoarchitectonic area, we present the percentage of sites that produced a response (>0.25) in each muscle that we recorded. The frequency with which a response in a given muscle was evoked is expressed as a percentage of all sites that were stimulated in a given area, including those that were nonresponsive at 100 μA. Muscle abbreviations: AcT, acromiotrapezius; i, ipsilateral; Srt, sartorius, anterior head; SSp, supraspinatus; VL, vastus lateralis.
Stimulation during Locomotion
We applied stimulation during locomotion in 245/519 sites. Fewer sites were stimulated during locomotion than with the cat at rest for two main reasons. First, only a few of the sites in which no responses were evoked at the highest current strengths when the cat was at rest were stimulated during locomotion. Second, in penetrations that crossed layer V more than once, the cats were sometimes unwilling to walk for the protracted time required to complete the stimulation protocol, resulting in some under sampling of the deeper regions of the cortex.
In total, both the FL and HL representations of the primary motor cortex (area 4γ), as well as the most responsive premotor subdivisions (4δc, 6aα and 6aγ), were each stimulated in more than 30 sites during locomotion, while 4δr, which is relatively small, was stimulated in 13 experiments (Table 2). Area 6iffu, which was relatively unresponsive at rest, was stimulated 15 times. Areas 4fu, 4sfu, and 6aβ were each stimulated in fewer than 10 sites during locomotion and these areas are excluded from the quantitative analysis.
Phase-Dependent Responses during Locomotion
As described previously (Armstrong and Drew 1984a; Rho et al. 1999), ICMS in the forelimb representation of area 4γ during locomotion produced robust phase-dependent responses in contralateral forelimb flexor muscles (e.g., SpD, Br, ClB, ECR) during the swing phase of that limb (black traces in Group 2 of Fig. 9A) with no, or little, activity in the extensor muscle, the lateral head of the contralateral triceps (TriL). In early stance (Group 5), responses in the flexor muscles were absent or smaller but there was coTriL activation as well as small, longer latency, responses in iBr. Stimulation during swing (Group 2) at a representative site in area 6aα (cyan traces in Fig 9A) of the same cat, produced similar, but smaller, responses in most of the illustrated contralateral forelimb flexor muscles. However, stimulation in area 6aα in early stance (Group 5, corresponding to the swing phase of the ipsilateral limb) evoked a substantially larger response in the iBr than did the 4γFL stimulation (cyan and black traces, respectively). Similarly, stronger responses in the iSt were evoked by stimulation in area 6aα during swing (Group 2) than by stimulation in area 4γFL.
Figure 9 .

Phase-dependent responses in representative 4γFL (black lines) and 6aα (cyan lines) sites during locomotion. A. Responses evoked in selected muscles of the contralateral and ipsilateral fore- and hindlimbs of cat P4 during swing (Group 2) and early stance (Group 5). Responses to stimulation (thick lines) are superimposed onto the control activity (thin lines: see Methods). Note that in some traces the evoked responses are sufficiently large that the control activity is close to zero and the thin lines are not distinguishable. B. the upper traces for each muscle illustrates the activity of the muscle during baseline locomotion in each site (note the near-perfect overlap). The lower trace illustrates the responses evoked in each of the 10 different groups into which the step cycle was divided. For each group, we plot the magnitude of the net evoked response, together with the standard error of the mean, as a ratio of the averaged peak activity observed during control locomotion in each group. The two dotted lines are placed at the ratio of ±0.25 that we used to indicate a meaningful response, i.e., one in which the integrated activity of the response exceeded that of the control by 25% (see Methods). All traces that exceeded the 0.25 limits were significant at the P < 0.05 level. All data are displayed synchronized to the time of onset of the activity in the coClB (swing onset in the forelimb). Abbreviations: FL, forelimb; HL, hindlimb.
The phase-dependent nature of the responses evoked in the different muscles and in different areas can be better appreciated in Figure 9B in which we illustrate the magnitude of the evoked responses as a phase plot (lower graph for each muscle), together with the averaged activity of the muscles during baseline locomotion (upper plot). Stimulation evoked a single period of increased activity in most muscles, with respect to the average background EMG activity, although decreases in activity were also observed in some muscles. In nearly all of the illustrated muscles, stimulation in area 4γFL and area 6aα evoked responses that were at least 25% larger than the control activity (ratio = 0.25 indicated by the red dotted lines). In all cases, the major changes in activity occurred at similar phases to the period of natural locomotor activity of that muscle. Responses in flexors and extensors were anti-phase (e.g., coBr and coTriL), as were the responses in contralateral and ipsilateral muscles (e.g., coBr and iBr). Responses in the hindlimb muscles (e.g., coSt) were phase-shifted with respect to those in the forelimb muscles. Note that responses in area 6aα were almost as robust as many of the responses evoked from area 4γFL and, for some muscles (e.g., iBr and iSt), were larger.
Phase-dependent responses in flexor muscles of the fore- and hindlimb were routinely evoked by stimulation from multiple subregions of area 6 and from the non-primary regions of area 4. This is illustrated by the responses in coBr and coSt shown in Figure 10A. Although responses in the coBr and coSt were generally larger in areas 4γFL and 4γHL, respectively, than in other regions, substantial response magnitudes were observed in regions outside the primary motor cortex. For example, responses in the coBr were sometimes almost as large in area 6aγ and, to a lesser extent, in area 6aα, as in area 4γFL. Similarly, responses in coSt were as large and frequent in the caudal region of 4δ as in 4γHL and were also robust in areas 4δr and 6aα; however, they were smaller and highly phase-specific in 4γFL and area 6aγ.
Figure 10 .

Magnitude of selected forelimb and hindlimb flexor responses to ICMS across areas during locomotion. A. Superimposed responses to stimulation of different regions of areas 4 and 6. For each area, the phase-dependent responses evoked in the coBr and coSt from all stimulated sites is displayed. The magnitude of all responses is scaled as a ratio of the averaged peak activity observed during control locomotion (unstimulated step cycles) in each animal (see Methods). The colored traces indicate responses in which there was a significant change in activity, ≥0.25 of background control; gray traces indicate those with no significant change or changes <0.25. B. The responses are plotted on flattened representations of the cortex with the size of the circle proportional to the maximal response during locomotion (see key): same scale used as for Figure 8A. Then filled colored circles indicate sites evoking increased activity; open circles indicate decreases in activity and gray circles indicate responses that did not surpass a ratio of 0.25 of the peak control activity. Note that not all sites stimulated at rest were stimulated during locomotion; this is particularly true for sites in which no detectable responses were observed at 75–100 μA to stimulation at rest (e.g., many sites in 6iffu).
These results are represented spatially in Figure 10B where it can be seen that while the largest responses in coBr are concentrated rostral to the fundus of the cruciate sulcus, and around the lip of the anterior sigmoid gyrus, substantial responses extend medially into area 6aα and rostrally into 6aγ. Similarly, while the largest responses in coSt are concentrated in the caudal bank of the cruciate sulcus in area 4γ, stimulation during locomotion evoked substantial responses in this muscle from throughout the pericruciate cortex and particularly in areas 4δc, 4δr and area 6aα. For both the coBr and the coSt, the areas from which responses could be elicited occupied a substantially greater part of the pericruciate cortex than was observed during stimulation at rest (compare with Fig. 8A). Particularly noteworthy is the large representation of the hindlimb in area 6aα during locomotion and the presence of widespread responses in the hindlimb from area 6aγ from which only two sites evoked hindlimb responses when the cat was not walking. Equally striking is the fact that responses in the coBr and coSt were evoked from almost all sites in 6iffu that were stimulated during locomotion, despite the fact that this area was mostly unexcitable in the non-behaving cat.
The averaged phase-dependent responses for these two muscles, as well as for six additional muscles are illustrated in Figure 11A for ICMS in seven subregions of areas 4 and 6. Averaged responses in the contralateral forelimb flexors (coBr, coSpD, and coECR), although clearly largest in area 4γFL, were also substantial in area 6aγ, and to a lesser extent in 6aα and 4δr, as also shown in the histograms of Figure 11B. Similar representations were also observed for the other contralateral forelimb flexor muscles (not illustrated). In contrast, the responses in the contralateral acromiotrapezius (coAcT), which retracts the scapula, were largest for stimulation in the subdivisions of area 6 and in area 4δr. Responses in the contralateral forelimb extensor muscles (e.g., coTriL) were as large for stimulation in area 6 as for stimulation in area 4γ. As noted in Figure 9, stimulation during locomotion evoked responses in the forelimb flexor muscle, iBr, during its period of locomotor activity and the responses were evoked, at equal magnitude, from all subregions or areas 4 and 6 that we explored, including from area 4γHL. Responses in coSt were largest from areas 4γHL and from areas 4δc and 4δr. Responses were also seen from all parts of area 6, although these were smaller and were also very phase specific, being evoked only at the onset of activity in the coSt. Responses in the iSt, in contrast, were largest from the subregions of area 6 and were actually smallest from area 4γHL.
Figure 11 .

Magnitude of the responses evoked by ICMS during locomotion. A: Averaged EMG responses of representative muscles to ICMS in different areas. Averages are compiled from the phase dependent responses for all sites in which there was a change of ≥0.25 of the control values. Color code identifies each area (see key). B. Bar plots quantifying the average of the maximum response for the muscles illustrated in A. Bars indicate standard error and the values above each bar indicate the phase of the step cycle at which peak activity was observed for each muscle.
In addition to differences in the magnitude of the responses evoked from different subregions there were also differences in the frequency with which responses were evoked. Figure 12A illustrates the frequency of those evoked responses that exceeded 0.25 of the peak EMG activity during locomotion (as in Fig. 8B) for all of the muscles that we studied. It shows that, in contrast to the situation at rest, stimulation during locomotion frequently evoked responses in muscles of all four limbs from most areas stimulated. In area 4γFL, the stimulation was biased toward evoking responses in the contralateral forelimb, while in area 4γHL it was biased toward responses in the hindlimb. A slight bias toward responses in hindlimb muscles can also be observed in the responses evoked from 4δc and 4δr. However, responses were evoked almost equally, and with high efficacy, in muscles of all four limbs by stimulation of areas 6aα and 6aγ as well as in area 6iffu (not illustrated). These results show that all subregions of areas 4 and 6 that we studied are able to influence the activity of muscles during locomotion, including both the forelimb and hindlimb representations of area 4, which are generally presumed to exert their influence primarily on muscles in the contralateral forelimb or hindlimb.
Figure 12 .

Frequency of responses evoked by ICMS during locomotion. A: Bar graph indicating the proportion of sites that evoked responses of ≥0.25 in the indicated muscles. Values are displayed as a percentage of the number of EMG recordings for each muscle. B: a similar plot but including only those recordings in which the magnitude of the response was ≥0.75 of the control activity. Same color key as in Figure 8B.
Although Figure 12A indicates the potential for exerting a widespread influence on muscle activity, both Figure 10B and Figure 11 indicate that many of these responses were relatively small. We therefore restricted the calculation to larger responses. Using responses of ≥0.75 of peak EMG activity during control locomotion produced frequencies of muscle responses for areas 4γFL and 4γHL (Fig. 12B) that resembled those obtained at rest (Fig. 8B), with responses in contralateral forelimb muscles predominating in area 4γFL and responses in hindlimb muscles predominating in area 4γHL (see also Table 3). This emphasizes that the responses evoked in the muscles of limbs outside of the primary target limb were predominantly small. However, in the other regions of area 4 and in the regions of area 6 that we illustrate in Figure 12B, there were still widespread responses in different muscles, with distinctions between subregions. Evoked responses in hindlimb muscles clearly predominated in area 4δc with smaller effects (10–30%) in contralateral forelimb and ipsilateral hindlimb muscles. Contralateral hindlimb responses also predominated in area 4δr, although there were also robust responses in contralateral forelimb flexor muscles (>50% in the coSpD, +++, Table 3) and ipsilateral hindlimb muscles (++). Contralateral forelimb muscles predominated in 6aα, but also with responses in the three other limbs as well as movements of the head. A similar mix was observed in area 6aγ but in this region there were also substantial responses in face musculature (see Fig. 5). Widespread responses were also evoked in area 6iffu (Table 3, not illustrated in Fig. 12B).
Table 3.
Frequency of responses in the four limbs to ICMS during locomotion in different cytoarchitectonic areas
| Area | coFL | iFL | coHL | iHL | Face/Head |
|---|---|---|---|---|---|
| 4γFL | ++++ | + | + | ||
| 4γHL | ++++ | + | |||
| 4δc | + | ++++ | + | ||
| 4δr | +++ | + | ++++ | ++ | |
| 6aα | +++ | + | ++ | ++ | + |
| 6aγ | +++ | + | ++ | ++ | +++ |
| 6iffu | +++ | + | + | +++ | + |
The table indicates the frequency of evoked responses in the most responsive muscle of each limb as indicated in Figure 12B (see text). For example, for area 4γFL the most responsive muscle in the contralateral forelimb was the coECR at 84%. Single symbol (+) indicates a maximum frequency of 10–30%; ++, 30–50%; +++, 50–70%; ++++, 70–90%. For the face/head column, frequency is based on a qualitative analysis of the movements evoked at rest. Abbreviations: coFL, contralateral forelimb; iFL, ipsilateral forelimb; coHL, contralateral hindlimb; iHL, ipsilateral hindlimb.
Corticospinal Projections to the Lumbosacral Cord
In examining the sites from which hindlimb movements are evoked, one is struck by the continuation of these hindlimb responses into the most lateral regions of the cruciate sulcus and onto the rostral bank of the sulcus. Although previous authors, including ourselves, have reported hindlimb responses from very lateral areas (see Discussion), there has been no systematic report showing such a well-organized hindlimb representation, at low threshold, outside the region in the caudomedial bank that is generally referred to as the hindlimb representation. We therefore re-examined previous data in which we had made injections of wheat germ agglutinin horseradish peroxidase into the lumbar spinal cord and quantitatively examined the distribution of retrogradely labeled cells in the peri-cruciate cortex (Jiang and Drew 1996; Brustein and Rossignol 1998). Two such examples of this analysis are illustrated in Figure 13 in which the cytoarchitectonic areas in cat P1 have been morphed onto the cortex of the cats illustrated in Figure 13A, B by using the location of the different sulci. Although indirect evidence, these data suggest that lumbar-projecting corticospinal cells are to be found within areas 4γ, 4δc, 4δr, and 6aα; the same areas from which responses in the hindlimb flexor, St, were most readily evoked. Although, in the example in Figure 13B, there are indications of separation of the corticospinal cells in areas 4γ and 4δc, suggesting two separate representations, such a separation was neither observed in Figure 13A nor in one other cat (not illustrated).
Figure 13 .

Location of corticospinal cells projecting to the hindlimb. Two examples of the cortical regions containing cells projecting to the lumbar spinal cord. Flattened representations are prepared as in Figures 2 and 3. The plots show the relative density of cells in different regions according to the key on the figure. Cytoarchitectonic regions from cat P1 have been morphed onto cats A31 and N7 based on the coordinates of the sulci and gyri in each cat.
Discussion
We provide the first detailed report in the awake animal of the motor output of the major subregions of the cat premotor cortex. We show that brief trains of ICMS in many of these premotor areas produce movements at rest and exert a strong influence on EMG activity during locomotion. While thresholds were mostly higher in these areas than in the primary motor cortex, robust EMG activity during locomotion could frequently be evoked at current intensities of ≤50 μA. Importantly, we show that ICMS across different cytoarchitectonic areas evokes different patterns of movements both at rest and during locomotion, suggesting areal specificity in their effects.
Methodological Considerations
Generally, one of two methods is used to compare activity in different areas when using ICMS. In one case, one can apply a constant current in different sites and compare the magnitude of the responses. This has the advantage that the stimulus activates a relatively constant volume of cortex in each area and is useful, for example, in exploring the topographical organization within a given region (e.g., primary motor cortex: see Rho et al. 1999; Park et al. 2004). In the other case, one determines the threshold current necessary to evoke a response and then applies a current at a constant multiple of that threshold (see e.g., Donoghue et al. 1992; Côté et al. 2017). This method, which was used in this study, is the only way to examine the functional connectivity of areas that are not excited by the relatively low currents that are sufficient to evoke movements in area 4γ. Nonetheless, in comparing activity in different subregions when using currents that are a multiple of T, one has to consider that response magnitudes of similar value evoked at similar multiples of T result from the activation of, potentially, quite different numbers of cells. This is shown by the results in Supplementary Figure S2 which compares the distribution and magnitude of responses evoked in flexor muscles of each of the four limbs at two different intensities. As such, comparisons of the magnitude of a response serve primarily to demonstrate that a given area or site of stimulation has the potential to produce robust modifications of activity. It does not mean that such a site has similar efficacy in modifying activity.
We also emphasize that our comparison of the effects evoked by the microstimulation are largely restricted to details concerning which limb was activated by the stimulus, and on the strength of the responses evoked in two representative flexor muscles of the forelimb and hindlimb (Br and St, respectively). As such, details on the effects of the stimulation on different muscles are largely absent, although we have reported the efficacy of the responses on a range of muscles in Figures 8, 11, and 12). Thus, while flexor muscles are always activated most strongly during the swing phases of locomotion, the specific period of activation of different muscles may differ (see e.g., Dyson et al. 2014). However, arguments about the differences in efficacy of the stimulation in evoking activity in a given limb hold for most, if not all, of the muscles that we recorded.
In addition, despite the large number of penetrations and sites that we stimulated, we did not sample the entire premotor cortex, nor were areas sampled evenly. In the former case, large parts of area 6aβ were not sampled as they lay outside the area of the chamber. In addition, areas 4fu and, to a lesser extent, 4sfu were sparsely represented in the results because of their small size and depth within the sulcus. Lastly, because of the orientation of the lateral bank of the presylvian sulcus at its most medial location (parallel to the orientation of the electrode penetrations), it was difficult to sample layer V in this part of the sulcus.
Functional Connectivity of Different Cytoarchitectonic Regions at Rest
One of the important differences between the cytoarchitectonic areas was the threshold current required to evoke a movement from each. Presumably, the differences in threshold relate to the densities of corticospinal neurons in a given area, together with the density and synaptic efficacy of the projections to other excitable areas, including corticocortical and corticoreticular projections (see below). For example, two of the areas with low thresholds, areas 4γ and area 4δ, have a high density of corticospinal projections to both cervical and lumbar regions (Groos et al. 1978; Hayes and Rustioni 1981; Keizer and Kuypers 1984; Ghosh 1997b; see Fig. 13). Areas 6aα and 6aγ have strong projections to the pontomedullary reticular formation, while area 6iffu, with very high thresholds, has only limited brainstem projections (Matsuyama and Drew 1997; Rho et al. 1997). These differences in threshold are in general agreement with the study of Ghosh (1997b) in the anesthetized cat.
However, some important differences with the results from the study of Ghosh were noted, including the fact that we could evoke hindlimb movements from area 6aα, in which Ghosh was able to evoke only forelimb movements. Thus, in the awake cat we were able to find representations of the forelimb and hindlimb, not only in area 4δ, but also in area 6aα. Moreover, while all of the movements described by Ghosh involved either the forelimb or hindlimb, we identified several sites from which we were able to evoke both forelimb and hindlimb movements simultaneously, and such sites became more prevalent when we increased the stimulus strength above threshold. Similarly, we also identified sites, principally in area 6aγ, from which we were able to evoke combined forelimb and facial or head movements. Moreover, our recordings of EMG responses showed that the areas from which we were able to evoke EMG activity in forelimb and hindlimb flexor muscles was larger than that from which visible twitch responses could be evoked. Importantly, the EMG recordings showed that stimulation in several areas, including the primary motor cortex (4γ) also evoked small EMG responses in the ipsilateral limbs that were not visible as movements.
The large region from which hindlimb movements, or activity in hindlimb flexor muscles, could be evoked is of particular interest. Generally, in electrophysiological studies, the hindlimb representation of area 4γ is considered to reside in the caudomedial parts of the cruciate sulcus and adjoining posterior sigmoid gyrus (Nieoullon and Rispal-Padel 1976; Armstrong and Drew 1984b; Widajewicz et al. 1994). However, as shown in this study, the region from which hindlimb activity could be evoked extended into both the dorsal and ventral banks of the more lateral regions of the cruciate sulcus. This apparent difference in the extent of the hindlimb representation resides in the fact that most ICMS studies of area 4γ target the anterior and posterior gyri and few studies have stimulated within the sulcus. Indeed, our results showing substantial hindlimb activation from the rostrolateral regions of the cortex are compatible with anatomical data showing the presence of lumbar-projecting corticospinal cells in these same regions (our Fig. 13, see also Hayes and Rustioni 1981; Keizer and Kuypers 1984; Jiang and Drew 1996; Ghosh 1997b). Moreover, it also overlaps the region in which work from this lab has previously demonstrated cells related to both fore- and hindlimb activity during locomotion (Widajewicz et al. 1994; see also Nakajima et al. 2019).
Contribution to the Control of Locomotion
One of the major strengths of this study was the ability to compare the effects of microstimulation at rest with those obtained during behavior, in this case, locomotion. This provides the opportunity to determine how microstimulation of the different premotor areas modulates locomotion and at the same time the effect that motor behavior has on the functional connectivity of the different areas.
The results from this study clearly show that many of the subregions of areas 4 and 6 that are considered to comprise the premotor cortex have the capacity to modify locomotor activity. Although this has been demonstrated for area 4γ by several studies (Armstrong and Drew 1985b; Rho et al. 1999; Bretzner and Drew 2005b), it is shown for the first time here for the premotor areas. The general finding is that ICMS in all areas that were studied produced phase-dependent responses in muscles of one or more limbs.
In area 4γ, the largest responses were always in either the contralateral forelimb or hindlimb, and ICMS generally increased the level of activity in the flexor muscles during swing while having mixed effects on extensor muscles during stance (Armstrong and Drew 1984a; Rho et al. 1999). However, in recording the responses in both fore- and hindlimb muscles in this study, we demonstrated two related features that were not evident in our previous studies in which EMG recordings were restricted to the muscles of a single limb. First, sites identified as being in the forelimb representation of the primary motor cortex based on their threshold responses to stimulation at rest frequently evoked responses in muscles of the hindlimb, and vice versa. And second, ICMS in both the fore- and hindlimb representations of area 4γ frequently evoked responses in muscles of the ipsilateral limbs. Although the responses in the contralateral forelimb or hindlimb were generally substantially larger than those in the other limbs, the responses in the muscles of the other limbs were nonetheless significant. These results emphasize that individual sites in the motor cortex, while exerting their major effect on muscles of a single limb, can also influence activity in the other limbs.
ICMS of the premotor areas produced phase-dependent responses in muscles that were similar to those observed from stimulation of area 4γ. However, all premotor areas were distinct from area 4γ in the frequency and magnitude of the responses that they evoked in more than one limb (Fig. 12B and Table III). This suggests that these premotor areas are involved in coordinating activity during locomotion in contrast to the motor cortex which is more focused on the activity of a single limb. As in area 4γ, these responses were larger and more widespread than those evoked at rest and even areas that were largely ineffective in producing responses at rest (e.g., area 6iffu) produced responses when stimulation was applied during locomotion. All the premotor areas that we studied in detail therefore have the capacity to modify locomotor activity. Moreover, as in area 4γ, stimulation in the premotor areas produced responses in which the peak amplitude occurred at the same general phase of the step cycle, regardless of the site stimulated. This suggests that the magnitude of the response is more dependent on the excitability of spinal circuits than on the pattern of cortical activity, which is likely to vary from site to site. Possibly, microstimulation applied during tasks requiring advanced planning for gait modifications may demonstrate more variability in the capacity of different areas to modify activity during different stages of the planning processes. Such a proposition would be compatible with experiments showing that stimulation within premotor areas may modify the time of initiation of a planned movement (Zimnik et al. 2019; Thura and Cisek 2020).
In addition to demonstrating the capacity for premotor areas to modify activity during locomotion, the results also provide further information on the functional characteristics of each area. For example, while stimulation at rest in areas 6aα and 6aγ produced responses in hindlimb muscles from only a very few sites, stimulation during locomotion showed that almost the entirety of both of these areas can modify hindlimb activity. Similarly, responses in muscles of the ipsilateral limbs were much more prevalent from the premotor areas during locomotion.
Further, while microstimulation in all of the areas that we studied during locomotion was capable of influencing activity in multiple limbs, the relative pattern of activity in the limbs (and the head and face) differed between areas (Table 3), compatible with the view that each area has distinct functional characteristics and, probably, makes a distinct contribution to the control of locomotion. Area 4γ, despite being able to influence activity in multiple limbs, was characterized by a strong focal response restricted to either the contralateral forelimb or hindlimb. Areas 4δc and 4δr were both characterized by a strong effect on the contralateral hindlimbs but with also a substantial contralateral forelimb effect. Both also influenced the ipsilateral limbs. This would be compatible with our previous results showing cells in area 4δr with activity that we suggested was related to coordinating activity in the two forelimbs (Nakajima et al. 2019). Area 6aα had a more balanced effect on all four limbs and also evoked head movements, while the effects evoked from area 6aγ resembled those from area 4γFL, with the proviso that most sites also produced face movements.
Together, these results suggest that the premotor cortex may act to control coordinated changes in gait, involving modification of the placement of all four limbs, as required for example when planning goal related activities such as approaching an obstacle (Lajoie and Drew 2007). Moreover, the areal differences further suggest that different areas may be predominantly active to regulate specific aspects of limb planning, in much the same way that different groups of cells in the posterior parietal cortex are preferentially activated during different combinations of limb movement prior to and during steps over an obstacle (Lajoie et al. 2010; Wong et al. 2018). In addition, some areas may be involved in coordinating head and limb movements of the type that might be expected when hunting prey.
Motor Effects May Be Mediated by Multiple Pathways
The question arises as to how these different subregions of areas 4 and 6 produce their effect on movement and locomotion. In the case of 4γ, it is well established that there is a large corticospinal projection to both the cervical and lumbar enlargements of the cat (Groos et al. 1978; Hayes and Rustioni 1981; Keizer and Kuypers 1984; Ghosh 1997b) that is likely responsible for the effects produced by ICMS in this region. This is supported by the fact that transection of the pyramidal tract, caudal to the origin of much of the cortico-reticulospinal tract, leads either to abolition of the movements produced by ICMS or to dramatically increased threshold to produce movement both at rest and during locomotion (Asanuma et al. 1981; Armstrong and Drew 1985a, 1985b; Bretzner and Drew 2005a). It is equally probable that many of the responses produced by stimulation of area 4δ are also mediated by the corticospinal tract given that corticospinal neurons are found in this region (Ghosh 1997b).
However, other premotor areas, including areas 6aα and 6aγ, have weaker corticospinal projections (Keizer and Kuypers 1984; Ghosh 1997b). For these areas, other circuits are possibly responsible for the evoked responses. First, it is possible that locomotor movements are modified via cortico-cortical projections from area 6 to area 4γ. Anatomical studies in the cat show that such projections exist (Yumiya and Ghez 1984; Ghosh 1997a; Andujar and Drew 2007) although the details of these connections are not as well studied as in primates (Barbas and Pandya 1987; Luppino et al. 1993; Dum and Strick 2005; Dea et al. 2016). Such projections from premotor areas to the motor cortex may have the potential to modify motor output as in primates (Davare et al. 2011; Côté et al. 2017). Second, it is possible that effects may be mediated by the corticoreticular pathway. This pathway is large in the cat and the projection to the nucleus reticularis gigantocellularis originates in particular from rostral areas of the pericruciate cortex, including areas now identified as corresponding to 6aα and 6aγ, but also including 4γFL (Keizer and Kuypers 1984; Rho et al. 1997). Given that stimulation of the reticulospinal pathways produces responses in muscles of all four limbs during locomotion (Drew 1991), this projection might account for the distributed nature of the output from the premotor areas to stimulation during locomotion.
Possibly, during natural behavior, corticocortical and corticoreticular projections act in concert. The corticocortical projections to area 4γ would specify the focal regulation of contralateral muscles of a single limb, while the corticoreticular projections would coordinate activity in the other three limbs. As indicated above, this coordinated activity would facilitate both the planning and execution of voluntary gait modifications. A contribution to the execution of voluntary gait modifications is compatible with our previous suggestions that the corticoreticular pathway is used to coordinate the production of postural responses with the focal movements produced by the motor cortex (Kably and Drew 1998; Prentice and Drew 2001). Moreover, reticulospinal cells receive input bilaterally from the motor and premotor cortices (Drew et al. 2004; Fisher et al. 2020) and it has been proposed that this pathway provides a means of coordinating movement in the two forelimbs (Fisher et al. 2020). Increases in excitability of this corticoreticulospinal system during locomotion, together with the increased excitability of spinal circuits, is probably responsible in large part for the increased levels of evoked activity, and the wider distribution of the responses among the four limbs that we observed during locomotion. Indeed, we previously argued that changes in efficacy at subcortical levels probably underlie the increased responses observed during motor cortical stimulation following peripheral nerve lesion (Bretzner and Drew 2005a). However, it should be noted that responses in ipsilateral flexor muscles are small compared to those evoked by stimulation within the pontomedullary reticular formation (Drew and Rossignol 1990a; Drew 1991) raising questions as to the efficacy of the corticoreticulospinal pathway. Complementary modulatory mechanisms possibly also arise from callosal effects on the contralateral cortex (Asanuma and Okuda 1962; Matsunami et al. 1994) or from commissural connections in the spinal cord (Jankowska and Edgley 2006).
Comparison with Primates
The lack of information on the functional properties of cells in different regions of the cat premotor cortex makes a detailed comparison with premotor areas in the primate difficult. However, some comparisons can be made solely on the basis of microstimulation studies. For example, the responses evoked by stimulation in the primary motor cortex in each species are very similar, demonstrating low thresholds for activation, a restricted effect on muscles around a single joint of one of the contralateral limbs and a well-organized somatotopy (Asanuma and Rosen 1972; Nieoullon and Rispal-Padel 1976; Kwan et al. 1978; Armstrong and Drew 1984b, 1985a; Humphrey 1986; Donoghue et al. 1992; Ghosh 1997b; Park et al. 2001). Microstimulation in surrounding premotor areas in the primate equally shows evidence of a topographical organization. Area PMv is characterized by low threshold activation of the distal musculature as well as low threshold orofacial movements (Gentilucci et al. 1988; Godschalk et al. 1995; Preuss et al. 1996; Dum and Strick 2002; Dancause 2008; Boudrias et al. 2010b). In this regard the effects evoked in area 6aγ bear a strong resemblance, both with respect to the movement representation and the thresholds (see also Ghosh 1997a). Area PMd generally requires higher strengths to produce movements and has an effect primarily on proximal musculature in the forelimb, with a small representation of the hindlimb and a rostral representation of orofacial movements (Godschalk et al. 1995; Preuss et al. 1996; Boudrias et al. 2010a). In this respect, the characteristics of the stimulation responses in area 6aα of the cat are the most similar. The SMA has a well-organized somatotopy including forelimb, hindlimb, and orofacial regions but with the forelimb predominating (Mitz and Wise 1987; Luppino et al. 1991). Ghosh (1997b) has suggested that area 4δ might be an analog of area SMA (see also Nakajima et al. 2019).
Conclusions
We demonstrate that several cytoarchitectonic subregions of areas 4 and 6 have the capacity to modify locomotor activity and that in some cases ICMS in premotor areas is as efficient as that in the primary motor cortex (area 4γ). However, while ICMS in area 4γ had a strong focal effect on activity in either the contralateral forelimb or hindlimb, ICMS in premotor areas was generally more widely distributed to more than one limb, including ipsilateral limbs. The manifest capacity of the cat’s premotor cortex to modify locomotor activity, combined with our recent report (Nakajima et al. 2019) of the close relationship between neural activity in two of these areas (4δr and 6iffu) and some of the parameters of limb activity during steps over an obstacle make a strong case for the importance of this contribution in the planning and execution of gait. While we suggested that area 6iffu is implicated in the transformation of a global signal to the specific patterns of motor activity in the contralateral limb required to step over the obstacle, our data further suggested that area 4δr might be implicated in assuring correct placement of the contralateral limb in front of the obstacle to allow the ipsilateral limb to step over it (Nakajima et al. 2019). The results here extend this function of premotor cortex in coordinating activity in the forelimbs to one of potentially determining the spatial and temporal coordination of activity across all four limbs. Such a function during locomotion would be particularly important in the planning and execution of gait modifications in which the accurate and coordinated placement of each limb is critical, especially on uneven terrain or on approach to a target or obstacle.
Supplementary Material
Contributor Information
Nicolas Fortier-Lebel, Département de Neurosciences, Centre Interdisciplinaire de Recherche sur le Cerveau et l’Apprentissage (CIRCA) Groupe de recherche sur le système nerveux central (GRSNC), Université de Montréal, Québec H3C 3J7, Canada.
Toshi Nakajima, Department of Integrative Neuroscience, Graduate School of Medicine and Pharmaceutical Sciences, University of Toyama, Toyama 930-0194, Japan.
Nabiha Yahiaoui, Département de Neurosciences, Centre Interdisciplinaire de Recherche sur le Cerveau et l’Apprentissage (CIRCA) Groupe de recherche sur le système nerveux central (GRSNC), Université de Montréal, Québec H3C 3J7, Canada.
Trevor Drew, Département de Neurosciences, Centre Interdisciplinaire de Recherche sur le Cerveau et l’Apprentissage (CIRCA) Groupe de recherche sur le système nerveux central (GRSNC), Université de Montréal, Québec H3C 3J7, Canada.
Funding
This work was supported by an operating grant (PJT-156281) from the CIHR.
Notes
We would like to thank T. Ariel, M. Bourdeau, N. De Sylva, P. Drapeau, F. Lebel, and J. Soucy for technical assistance in the performance and analysis of these experiments. We thank Dr Edna Brustein for the use of the data in Figure 13A and Drs. Elaine Chapman and Numa Dancause for helpful comments on this manuscript. Conflict of Interest: None declared.
References
- Amos A, Armstrong DM, Marple-Horvat DE. 1990. Changes in the discharge patterns of motor cortical neurones associated with volitional changes in stepping in the cat. Neurosci Lett. 109:107–112. [DOI] [PubMed] [Google Scholar]
- Andujar J-E, Drew T. 2007. Organization of the projections from the posterior parietal cortex to the rostral and caudal motor cortex of the cat. J Comp Neurol. 504:17–41. [DOI] [PubMed] [Google Scholar]
- Andujar J-E, Lajoie K, Drew T. 2010. A contribution of area 5 of the posterior parietal cortex to the planning of visually guided locomotion: limb-specific and limb-independent effects. J Neurophysiol. 103:986–1006. [DOI] [PubMed] [Google Scholar]
- Archibald, F. 2020. Warping using thin plate spines. MATLAB Central File Exchange. https://www.mathworks.com/matlabcentral/fileexchange/24315-warping-using-thin-plate-splines (last accessed 16 June 2020).
- Armstrong DM, Drew T. 1984a. Locomotor-related neuronal discharges in cat motor cortex compared with peripheral receptive fields and evoked movements. J Physiol. 346:497–517. [DOI] [PMC free article] [PubMed] [Google Scholar]
- Armstrong DM, Drew T. 1984b. Topographical localisation in the motor cortex of the cat for somatic afferent responses and evoked movements. J Physiol. 350:33–54. [DOI] [PMC free article] [PubMed] [Google Scholar]
- Armstrong DM, Drew T. 1985a. Electromyographic responses evoked in muscles of the forelimb by intracortical stimulation in the cat. J Physiol. 367:309–326. [DOI] [PMC free article] [PubMed] [Google Scholar]
- Armstrong DM, Drew T. 1985b. Forelimb electromyographic responses to motor cortex stimulation during locomotion in the cat. J Physiol. 367:327–351. [DOI] [PMC free article] [PubMed] [Google Scholar]
- Asanuma H, Babb RS, Mori A, Waters RS. 1981. Input-output relationships in cat's motor cortex after pyramidal section. J Neurophysiol. 46:694–703. [DOI] [PubMed] [Google Scholar]
- Asanuma H, Okuda O. 1962. Effects of transcallosal volleys on pyramidal tract cell activity of cat. J Neurophysiol. 25:198–208. [DOI] [PubMed] [Google Scholar]
- Asanuma H, Rosen I. 1972. Topographical organisation of cortical efferent zones projecting to distal forelimb muscles in the monkey. Exp Brain Res. 14:243–256. [DOI] [PubMed] [Google Scholar]
- Avendaño C, Isla AJ, Rausell E. 1992. Area 3a in the cat. II. Projections to the motor cortex and their relations to other corticocortical connections. J Comp Neurol. 321:373–386. [DOI] [PubMed] [Google Scholar]
- Barbas H, Pandya DN. 1987. Architecture and frontal cortical connections of the premotor cortex (area 6) in the rhesus monkey. J Comp Neurol. 256:211–228. [DOI] [PubMed] [Google Scholar]
- Belmalih A, Borra E, Contini M, Gerbella M, Rozzi S, Luppino G. 2007. A multiarchitectonic approach for the definition of functionally distinct areas and domains in the monkey frontal lobe. J Anat. 211:199–211. [DOI] [PMC free article] [PubMed] [Google Scholar]
- Beloozerova IN, Sirota MG. 1993. The role of the motor cortex in the control of vigour of locomotor movements in the cat. J Physiol. 461:27–46. [DOI] [PMC free article] [PubMed] [Google Scholar]
- Beloozerova IN, Sirota MG. 2003. Integration of motor and visual information in the parietal area 5 during locomotion. J Neurophysiol. 90:961–971. [DOI] [PubMed] [Google Scholar]
- Boudrias M, Lee S, Svojanovsky S, Cheney PD. 2010a. Forelimb muscle representations and output properties of motor areas in the mesial wall of rhesus macaques. Cereb Cortex. 20:704–719. [DOI] [PMC free article] [PubMed] [Google Scholar]
- Boudrias M, McPherson R, Frost S, Cheney PD. 2010b. Output properties and organization of the forelimb representation of motor areas on the lateral aspect of the hemisphere in rhesus macaques. Cereb Cortex. 20:169–186. [DOI] [PMC free article] [PubMed] [Google Scholar]
- Bretzner F, Drew T. 2005a. Changes in corticospinal efficacy contribute to the locomotor plasticity observed after unilateral cutaneous denervation of the hindpaw in the cat. J Neurophysiol. 94:2911–2927. [DOI] [PubMed] [Google Scholar]
- Bretzner F, Drew T. 2005b. Contribution of the motor cortex to the structure and the timing of hindlimb locomotion in the cat: a microstimulation study. J Neurophysiol. 94:657–672. [DOI] [PubMed] [Google Scholar]
- Brustein E, Rossignol S. 1998. Recovery of locomotion after ventral and ventrolateral spinal lesions in the cat. I. Deficits and adaptive mechanisms. J Neurophysiol. 80:1245–1267. [DOI] [PubMed] [Google Scholar]
- Cisek P, Kalaska JF. 2010. Neural mechanisms for interacting with a world full of action choices. Annu Rev Neurosci. 33:269–298. [DOI] [PubMed] [Google Scholar]
- Côté SL, Hamadjida A, Quessy S, Dancause N. 2017. Contrasting modulatory effects from the dorsal and ventral premotor cortex on primary motor cortex outputs. J Neurosci. 37:5960–5973. [DOI] [PMC free article] [PubMed] [Google Scholar]
- Dancause N. 2008. In: Yoshida MSH, editor. Cortical network of the ventral premotor cortex. New York: New Research on Neuronal Networks Nova Science Publishers, Inc, pp. 149–176. [Google Scholar]
- Davare M, Kraskov A, Rothwell JC, Lemon RN. 2011. Interactions between areas of the cortical grasping network. Curr Opin Neurobiol. 21:565–570. [DOI] [PMC free article] [PubMed] [Google Scholar]
- Dea M, Hamadjida A, Elgbeili G, Quessy S, Dancause N. 2016. Different patterns of cortical inputs to subregions of the primary motor cortex hand representation in Cebus apella. Cereb Cortex. 26:1747–1761. [DOI] [PMC free article] [PubMed] [Google Scholar]
- Donoghue JP, Leibovic S, Sanes JN. 1992. Organization of the forelimb area in squirrel monkey motor cortex: representation of digit, wrist, and elbow muscles. Exp Brain Res. 89:1–19. [DOI] [PubMed] [Google Scholar]
- Drew T. 1991. Functional organization within the medullary reticular formation of the intact unanaesthetized cat. III. Microstimulation during locomotion. J Neurophysiol. 66:919–938. [DOI] [PubMed] [Google Scholar]
- Drew T. 1993. Motor cortical activity during voluntary gait modifications in the cat. I. Cells related to the forelimbs. J Neurophysiol. 70:179–199. [DOI] [PubMed] [Google Scholar]
- Drew T, Andujar J-E, Lajoie K, Yakovenko S. 2008. Cortical mechanisms involved in visuomotor coordination during precision walking. Brain Res Rev. 57:199–211. [DOI] [PubMed] [Google Scholar]
- Drew T, Dubuc R, Rossignol S. 1986. Discharge patterns of reticulospinal and other reticular neurons in chronic, unrestrained cats walking on a treadmill. J Neurophysiol. 55:375–401. [DOI] [PubMed] [Google Scholar]
- Drew T, Marigold DS. 2015. Taking the next step: cortical contributions to the control of locomotion. Curr Opin Neurobiol. 33:25–33. [DOI] [PubMed] [Google Scholar]
- Drew T, Prentice S, Schepens B. 2004. Cortical and brainstem control of locomotion. In: Mori S, Stuart DG, Wiesendanger M, editors. Brain mechanisms for the integration of posture and movement. Amsterdam: Elsevier, pp. 251–261. [DOI] [PubMed] [Google Scholar]
- Drew T, Rossignol S. 1984. Phase dependent responses evoked in limb muscles by stimulation of the medullary reticular formation during locomotion in thalamic cats. J Neurophysiol. 52:653–675. [DOI] [PubMed] [Google Scholar]
- Drew T, Rossignol S. 1990a. Functional organization within medullary reticular formation of intact unanaesthetized cat. II. Electromyographic activity evoked by microstimulation. J Neurophysiol. 64:782–795. [DOI] [PubMed] [Google Scholar]
- Drew T, Rossignol S. 1990b. Functional organization within medullary reticular formation of intact, unanaesthetized cat. I. Movements evoked by microstimulation. J Neurophysiol. 64:767–781. [DOI] [PubMed] [Google Scholar]
- Dum RP, Strick PL. 2002. Motor areas in the frontal lobe of the primate. Physiol Behav. 77:677–682. [DOI] [PubMed] [Google Scholar]
- Dum RP, Strick PL. 2005. Frontal lobe inputs to the digit representations of the motor areas on the lateral surface of the hemisphere. J Neurosci. 25:1375–1386. [DOI] [PMC free article] [PubMed] [Google Scholar]
- Dyson KS, Miron J-P, Drew T. 2014. Differential modulation of descending signals from the reticulospinal system during reaching and locomotion. J Neurophysiol. 112:2505–2528. [DOI] [PubMed] [Google Scholar]
- Fisher KM, Zaaimi B, Edgley SA, Baker SN. 2020. Extensive cortical convergence to primate Reticulospinal pathways. J Neurosci. 41:1005–1018. [DOI] [PMC free article] [PubMed] [Google Scholar]
- Gentilucci M, Fogassi L, Luppino G, Matelli M, Camarda R, Rizzolatti G. 1988. Functional organization of inferior area 6 in the macaque monkey. I. Somatotopy and the control of proximal movements. Exp Brain Res. 71:475–490. [DOI] [PubMed] [Google Scholar]
- Geyer S, Matelli M, Luppino G, Zilles K. 2000. Functional neuroanatomy of the primate isocortical motor system. Anat Embryol. 202:443–474. [DOI] [PubMed] [Google Scholar]
-
Ghosh S. 1997a. Comparison of the cortical connections of areas 4gamma and 4
 in the cat cerebral cortex. J Comp Neurol. 388:371–396. [DOI] [PubMed] [Google Scholar]
 - Ghosh S. 1997b. Identification of motor areas of the cat cerebral cortex based on studies of cortical stimulation and corticospinal connections. J Comp Neurol. 380:191–214. [DOI] [PubMed] [Google Scholar]
- Ghosh S. 1997c. Ipsilateral cortical connections of area 6 in the cat cerebral cortex. J Comp Neurol. 388:397–414. [DOI] [PubMed] [Google Scholar]
- Godschalk M, Mitz AR, Van Duin B, Van der Burg H. 1995. Somatotopy of monkey premotor cortex examined with microstimulation. Neurosc iRes. 23:269–279. [DOI] [PubMed] [Google Scholar]
- Groos WP, Ewing LK, Carter CM, Coulter JD. 1978. Organisation of corticospinal neurons in the cat. Brain Res. 143:393–419. [DOI] [PubMed] [Google Scholar]
- Hassler R, Muhs-Clement K. 1964. Architektonischer aufbau des sensomotorischen und parietalen cortex der katze. J Hirnforsch. 6:377–420. [PubMed] [Google Scholar]
- Hayes NL, Rustioni A. 1981. Descending projections from brainstem and sensorimotor cortex to spinal enlargements in the cat. Exp Brain Res. 41:89–107. [DOI] [PubMed] [Google Scholar]
- Hoshi E, Tanji J. 2007. Distinctions between dorsal and ventral premotor areas: anatomical connectivity and functional properties. Curr Opin Neurobiol. 17:234–242. [DOI] [PubMed] [Google Scholar]
- Humphrey DR. 1986. Representation of movements and muscles within the primate precentral motor cortex: historical and current perspectives. Fed Proc. 45:2687–2699. [PubMed] [Google Scholar]
- Jankowska E, Edgley S. 2006. How can corticospinal tract neurons contribute to ipsilateral movements? A question with implications for recovery of motor functions. Neuroscientist. 12:67–79. [DOI] [PMC free article] [PubMed] [Google Scholar]
- Jiang W, Drew T. 1996. Effects of bilateral lesions of the dorsolateral funiculi and dorsal columns at the level of the low thoracic spinal cord on the control of locomotion in the adult cat .1. Treadmill walking. J Neurophysiol. 76:849–866. [DOI] [PubMed] [Google Scholar]
- Kably B, Drew T. 1998. The corticoreticular pathway in the cat: II. Discharge characteristics of neurones in area 4 during voluntary gait modifications. J Neurophysiol. 80:406–424. [DOI] [PubMed] [Google Scholar]
- Kalaska JF, Sergio LE, Cisek P. 1998. Cortical control of whole-arm motor tasks. Novartis Found Symp. 218:176–190. [DOI] [PubMed] [Google Scholar]
- Keizer K, Kuypers HGJM. 1984. Distribution of corticospinal neurons with collaterals to lower brain stem reticular formation in cat. Exp Brain Res. 54:107–120. [DOI] [PubMed] [Google Scholar]
- Krouchev N, Drew T. 2013. Motor cortical regulation of sparse synergies provides a framework for the flexible control of precision walking. Front Comput Neurosci. 7:83. [DOI] [PMC free article] [PubMed] [Google Scholar]
- Kwan HC, Mac Kay WA, Murphy JT, Wong YC. 1978. Spatial organisation of precentral cortex in awake primates. II. Motor outputs. J Neurophysiol. 41:1120–1131. [DOI] [PubMed] [Google Scholar]
- Lajoie K, Andujar J-E, Pearson KG, Drew T. 2010. Neurons in area 5 of the posterior parietal cortex in the cat contribute to interlimb coordination during visually guided locomotion: a role in working memory. J Neurophysiol. 103:2234–2254. [DOI] [PubMed] [Google Scholar]
- Lajoie K, Drew T. 2007. Lesions of area 5 of the of the posterior parietal cortex in the cat produce errors in the accuracy of paw placement during visually guided locomotion. J Neurophysiol. 97:2339–2354. [DOI] [PubMed] [Google Scholar]
- Luppino G, Matelli M, Camarda R, Rizzolatti G. 1993. Corticocortical connections of area F3 (SMA-proper) and area F6 (pre-SMA) in the macaque monkey. J Comp Neurol. 338:114–140. [DOI] [PubMed] [Google Scholar]
- Luppino G, Matelli M, Camarda RM, Gallese V, Rizzolatti G. 1991. Multiple representations of body movements in mesial area 6 and the adjacent cingulate cortex: an intracortical microstimulation study in the macaque monkey. J Comp Neurol. 311:463–482. [DOI] [PubMed] [Google Scholar]
- Marigold DM, Drew T. 2017. Posterior parietal cortex estimates the relationship between object and body location during locomotion. Elife. 6:e28143. [DOI] [PMC free article] [PubMed] [Google Scholar]
- Marigold DS, Drew T. 2011. Contribution of cells in the posterior parietal cortex to the planning of visually guided locomotion in the cat: effects of temporary visual interruption. J Neurophysiol. 105:2457–2470. [DOI] [PubMed] [Google Scholar]
- Matelli M, Luppino G, Rizzolatti G. 1991. Architecture of superior and mesial area 6 and the adjacent cingulate cortex in the macaque monkey. J Comp Neurol. 311:445–462. [DOI] [PubMed] [Google Scholar]
- Matsunami K, Kawashima T, Ueki S, Fujita M, Konishi T. 1994. Topography of commissural fibers in the corpus callosum of the cat: a study using WGA-HRP method. Neurosci Res. 20:137–148. [DOI] [PubMed] [Google Scholar]
- Matsuyama K, Drew T. 1997. The organization of the projections from the pericruciate cortex to the pontomedullary brainstem of the cat: a study using the anterograde tracer, Phaseolus vulgaris leucoagglutinin. J Comp Neurol. 389:617–641. [DOI] [PubMed] [Google Scholar]
- Mitz AR, Wise SP. 1987. The somatotopic organization of the supplementary motor area: intracortical microstimulation mapping. J Neurosci. 7:1010–1021. [DOI] [PMC free article] [PubMed] [Google Scholar]
- Nakajima T, Fortier-Lebel N, Drew T. 2019. Premotor cortex provides a substrate for the temporal transformation of information during the planning of gait modifications. Cereb Cortex. 29:4982–5008. [DOI] [PMC free article] [PubMed] [Google Scholar]
- Nieoullon A, Rispal-Padel L. 1976. Somatotopic localisation in cat motor cortex. Brain Res. 105:405–422. [DOI] [PubMed] [Google Scholar]
- Orlovsky GN. 1972. The effect of different descending systems on flexor and extensor activity during locomotion. Brain Res. 40:359–371. [DOI] [PubMed] [Google Scholar]
- Palmer CI. 1978. A microwire technique for recording single neurons in unrestrained animals. Brain Res Bull. 3:285–289. [DOI] [PubMed] [Google Scholar]
- Park MC, Belhaj-Saif A, Cheney PD. 2004. Properties of primary motor cortex output to forelimb muscles in rhesus macaques. J Neurophysiol. 92:2968–2984. [DOI] [PubMed] [Google Scholar]
- Park MC, Belhaj-Saif A, Gordon M, Cheney PD. 2001. Consistent features in the forelimb representation of primary motor cortex in rhesus macaques. J Neurosci. 21:2784–2792. [DOI] [PMC free article] [PubMed] [Google Scholar]
- Prentice SD, Drew T. 2001. Contributions of the reticulospinal system to the postural adjustments occurring during voluntary gait modifications. J Neurophysiol. 85:679–698. [DOI] [PubMed] [Google Scholar]
- Preuss TM, Stepniewska I, Kaas JH. 1996. Movement representation in the dorsal and ventral premotor areas of owl monkeys: a microstimulation study. J Comp Neurol. 371:649–676. [DOI] [PubMed] [Google Scholar]
- Rho M-J, Cabana T, Drew T. 1997. The organization of the projections from the pericruciate cortex to the pontomedullary reticular formation of the cat: a quantitative retrograde tracing study. J Comp Neurol. 388:228–249. [DOI] [PubMed] [Google Scholar]
- Rho M-J, Lavoie S, Drew T. 1999. Effects of red nucleus microstimulation on the locomotor pattern and timing in the intact cat: a comparison with the motor cortex. J Neurophysiol. 81:2297–2315. [DOI] [PubMed] [Google Scholar]
- Rizzolatti G, L C, M F-D, S R. 2014. Cortical mechanisms underlying the organization of goal-directed actions and mirror neuron-based action understanding. Physiol Rev. 94:655–706. [DOI] [PubMed] [Google Scholar]
- Thura D, Cisek P. 2020. Microstimulation of dorsal premotor and primary motor cortex delays the volitional commitment to an action choice. J Neurophysiol. 123:927–935. [DOI] [PubMed] [Google Scholar]
- Widajewicz W, Kably B, Drew T. 1994. Motor cortical activity during voluntary gait modifications in the cat. II. Cells related to the hindlimbs. J Neurophysiol. 72:2070–2089. [DOI] [PubMed] [Google Scholar]
- Wise SP, Di Pellegrino G, Boussaoud D. 1996. The premotor cortex and nonstandard sensorimotor mapping. Can J Physiol Pharmacol. 74:469–482. [DOI] [PubMed] [Google Scholar]
- Wong C, Pearson KG, Lomber SG. 2018. Contributions of parietal cortex to the working memory of an obstacle acquired visually or tactilely in the locomoting cat. Cereb Cortex. 28:3143–3158. [DOI] [PMC free article] [PubMed] [Google Scholar]
- Yumiya H, Ghez C. 1984. Specialized subregions in the cat motor cortex: anatomical demonstration of differential projections to rostral and caudal sectors. Exp Brain Res. 53:259–276. [DOI] [PubMed] [Google Scholar]
- Zimnik AJ, Lara AH, Churchland MM. 2019. Perturbation of macaque supplementary motor area produces context-independent changes in the probability of movement initiation. J Neurosci. 39:3217–3233. [DOI] [PMC free article] [PubMed] [Google Scholar]
Associated Data
This section collects any data citations, data availability statements, or supplementary materials included in this article.