

Abstract
Purpose
The aim of the study was to develop and validate machine learning models to predict the personalized risk of 30-day readmission with venous thromboembolism (VTE).
Design
This study was a retrospective, observational study.
Methods
We extracted and preprocessed the structured electronic health records from a single academic hospital. Then we developed and evaluated three prediction models using Logistic Regression, Balanced Random Forest, and Multilayer Perceptron.
Results
The study sample included 158,804 total admissions; among them, VTE positive cases were 2,080 admissions from 1,695 patients (1.31%). Based on the evaluation results, the Balanced Random Forest outperformed the other two risk prediction models.
Conclusion
This study delivered a high performing, validated risk prediction tool using machine learning and EHRs, to identify patients at high risk of VTE after discharge.
Clinical Relevance
The risk prediction model developed in this study can potentially guide treatment decisions for discharged patients for better patient outcomes.
Keywords: Venous Thromboembolism, Machine Learning, Electronic Health Records, 30-day Readmission, Risk Prediction Model
Introduction
Venous thromboembolism (VTE), which includes deep vein thrombosis (DVT) and pulmonary embolism (PE), is a serious cause of patient morbidity and mortality in hospitals, and associated with substantial economic burden (Weycker et al., 2018, Le Sage et al., 2008). Moreover, the Centers for Disease Control and Prevention (CDC) has estimated that the number of people affected by VTE would increase each year (CDC, 2020). Findings indicate that more than 50% of VTEs are related to a recent hospitalization or surgery, and most of these do not occur until after discharge (Streiff et al., 2014). Kahn et al. (2013) suggest that these incidents are preventable, but fewer than half of hospitalized patients receive appropriate prevention. Ineffective prevention and management strategies for VTE after discharge can lead to readmission with VTE, which directly relates to patient harm and healthcare cost (Beckman et al., 2010).
Therefore, patients at risk for VTE should be carefully monitored even after discharge to prevent the readmissions with acute VTE. However, estimating the risk of VTE is challenging. The risk of VTE can be lowered by prophylactic anticoagulation therapy, but extended anticoagulation after hospital discharge can be associated with an increased risk of adverse event such as a major bleeding episode (Fahrni et al., 2015). There are existing risk assessment models for VTE (Spyropoulos et al., 2012; Hachey et al., 2016) – however, patients are assessed for VTE risk at the time of admission. To the best of our knowledge, these models are not developed for discharged patients and there are no standard procedures for assessing VTE risk when discharged. Hence, there is an imperative need for a prediction tool that accurately predicts the individualized risk for readmission with VTE for all hospitalized patients to provide improved discharge planning and transition of care.
Accurate identification of at-risk patients is critical to achieving more timely and proper intervention. Studies suggest that building prediction models using machine learning (ML) methods along with electronic health record (EHR) data can drive personalized medicine and improvement of quality of care (Miotto et al., 2016; Chen & Asch, 2017). The enormous volume of risk patient information captured in the EHR can be leveraged by the ML approach for identifying patients at risk for readmission with VTE. Prediction models can facilitate identification of patients at risk for hospital readmissions and identify relevant factors to potentially inform tailored interventions for those who might benefit most (Kansagara et al., 2011).
The primary goal of this study was to create a risk prediction tool for VTE management for discharged patients. More specifically, this study sought to develop and validate ML models to predict the personalized risk of 30-day readmission with VTE and determine whether further prophylactic anticoagulation is necessary for those patients. We utilized ML approaches such as Logistic Regression (LR), Balanced Random Forest (BRF), and Multilayer Perceptron (MLP). The dataset was divided into a training set and a validation set for model development and validation. The models were then evaluated using statistical measures.
Methods
Data Sources
This was a retrospective study using de-identified structured patient data from the EHR used at a tertiary academic hospital. The data are stored in a research clinical data warehouse (CDW) and analyzed in a secure computing environment. The CDW was structured using the Observational Medical Outcomes Partnership (OMOP) Common Data Model (CDM), which enables standardized representation of patient information for efficient and high-quality computing. The patient cohort analyzed for this study include adult patients (18 years or older) who had been hospitalized and had at least one subsequent visit recorded in the EHR after the initial discharge, between January 1, 2009 and September 20, 2020, to exclude patients whose hospitalization was the only contact with this healthcare system. Multiple hospitalizations of the same patient within this hospital were possible as long as they occurred >30 days after any previous hospitalization.
Predictor and Outcome Variables
The following structured data were extracted from the CDW for analysis: patient demographics (age, gender, race/ethnicity), diagnoses (ICD-9-CM/ICD-10-CM), procedures (CPT-4), medications (Anatomical Therapeutic Chemical classification 3rd level), Charlson Comorbidity score, medical history (ICD-9-CM/ICD-10-CM), surgical vs. medical patients, and length of inpatient stay.
As a way to improve computing efficiency, we grouped relevant diagnoses and medications into higher-level diagnosis groups and medication classes. For diagnoses and medical history, matching concepts of ICD-9-CM and ICD-10-CM codes were identified, and the first three characters of the ICD codes (e.g., Z83 from ICD-10-CM), i.e. the “categories” that describe the general type of the injury or disease, were used. Also, we used the third level of the Anatomical Therapeutic Chemical (ATC) classification codes that indicate the therapeutic/pharmacological subgroup. Charlson Comorbidity score was computed and appended to the final feature set using the diagnostic categories and weights (Sundararajan et al., 2004). A higher Charlson comorbidity score indicates a higher level of severity of the conditions (Charlson et al., 1994). Surgical patients referred to the those who received a surgical procedure during the inpatient stay (eligible CPT-4 codes are listed in Table S1), and medical patients were those who did not receive any surgical procedure during the inpatient stay.
The primary outcome variable was the 30-day readmission with acute DVT or PE (excluding pregnancy-related VTE). We used the ICD-9-CM and ICD-10-CM diagnosis codes for acute DVT, or PE as specified by the Agency for Healthcare Research and Quality (Table S2) (Secemsky et al. 2018). Any revisit with acute DVT or PE within ≤ 30 days of discharge, diagnoses at the time of revisit or within 24 hours of revisit, was considered as a VTE positive outcome. Any revisit that did not meet these criteria was considered as a VTE negative outcome. Since each patient can have multiple hospitalizations under different medical conditions and result in different consequences, we used each admission as a unit of analysis. Because the data are fully de-identified, this study was not considered human subject research by the Institutional Review Board at the University and no informed consent was required.
Data Preprocessing and Feature Selection
To effectively train a prediction model, raw input data must be transformed into a format such that numerical models can readily recognize and compute. For example, the ranges of ages and length of inpatient stay are different. Such a differences can cause certain features to dominate the training process regardless of its actual importance/relevance. Thus, we applied simple min-max normalization to those features to avoid unintended weighting. Also, features with zero-variance (constant over every data point) were eliminated since it would only increase the computational cost and add no extra information to the model. A data point with missing features were dropped as well. Lastly, categorical features (such as race, ethnicity, and diagnosis code) were pivoted into binary features using one-hot encoding; the new binary feature corresponds to a single category which is assigned 1 if a data point belongs to the category, and 0 if not.
When constructing and evaluating prediction models, it is important that they are not built and tested on the same data sets for accuracy because such models may not be generalizable to unseen, real-world data sets. Therefore, a data set is often divided into two sets: a training set, which is a set of examples used to develop the prediction model; and a test set, which is unseen by the model during training and used to estimate the prediction performance of the model. In this study, we followed the norm of ML studies in healthcare to use 70% of the data for the training set and 30% for the test set.
We performed a feature selection from the training set to avoid overfitting and to decrease computational memory requirements. Feature selection provides insights about a set of relevant features associated with the outcome. A full set of features were tested to assess predictive value using a classifier called BRF model (Chen et al. 2004). Similar to conventional Random Forest (RF) models, a trained BRF model provides feature importance for each feature wherein a higher value means more relevance to the prediction accuracy. These feature importance values can be used as thresholds to select relevant features for the model, and in our study, we used the mean of the feature importance as the cut-off criterion. That is, if a feature’s relevance score is lower than overall average, then the feature was dropped. Once the features were selected from the training set, they were applied to the test set for further validation.
Prediction Model Development
We trained and compared the performance of three prediction models using LR, BRF, and MLP. Since the unbalanced classes in our dataset might lower the predictive power of the model, the class weighting approach, which is popularly used in highly imbalanced distributions (Japkowicz & Stephen, 2002), was utilized for the LR and MLP models as a to countermeasures. This method was not applied to the BRF model because the BRF model automatically adjusts imbalanced conditions by using a balanced down-sampling approach. The class weighting approach refers to the classification method that uses misclassification costs as a penalty to correct class imbalance; the goal is to minimize the total cost (Ling & Sheng, 2011). Mostly, the rarer class is regarded as positive class; misclassifying an actual positive as a negative entails a much higher cost than misclassifying an actual negative as a positive. In the class weighting approach, any given instance should be classified into the class that has the minimum expected cost. This principle prevents a instance from being classified as a false negative.
Logistic regression.
Logistic regression uses a set of independent features to model the dichotomous classes. Logistic regression builds a model to predict the odds of an event’s occurrence using an odds ratio (OR). The ORs show the magnitude of each feature’s contribution to the outcome variable.
Balanced Random Forest.
The BRF model is based on the RF approach using balanced down-sampled data to avoid poor performance for predicting the minority class (Chen et al., 2004; Lemaître et al., 2017). The RF model constructs a large number of individual decision trees at training and operates as an ensemble for more accurate prediction. A decision tree uses recursive data separation to construct a tree for the purpose of improving predictive accuracy. Each individual tree outputs a class prediction, and the class with the most votes becomes the RF model’s prediction.
Multilayer Perceptron.
An MLP is a robust, supervised learning algorithm and a class of feedforward artificial neural network used to solve complex classification problems (Pal & Mitra, 1992). An MLP model has a minimum of three layers of nodes: an input layer, a hidden layer, and an output layer. Except for the input nodes, each node is a perceptron that uses a nonlinear activation function which enables an MLP model to fit complex distribution of data.
Data from the CDW, stored in Microsoft SQL Server 2016 (Seattle, WA), were extracted and managed using a structured query language (SQL). Python software v.3.8.3 was used for 1) data preprocessing, 2) prediction model development for logistic regression (Scikit-learn v0.23.1), balanced random forest (imbalanced-learn v0.7.0), and multilayer perceptron (TensorFlow 2.3.0), and 3) evaluation of prediction models. The raw CSV file from SQL query was transformed to numerical multidimensional array, then split into training and test set using Scikit-learn utility functions. Scikit-learn v0.23.1 library in Python was used to optimize hyperparameters of the prediction methods. Also, Keras module inside the TensorFlow 2.3.0 was utilized to build the neural network.
Performance Metrics
Discrimination ability is often used to assess the quality of a classification model (Witten et al., 2011). Commonly used measures of discrimination are area under the receiver operating characteristic (AUROC) curve, sensitivity, and specificity (Beck & Shultz, 1986). The AUROC curve is used to evaluate and compare the overall model performance (Witten et al., 2011). It ranges from 0.5 to 1, with higher values suggesting better overall performance. Sensitivity, which is also called a recall or true positive rate, refers to the ability of a test to be positive when the condition is actually present. Specificity measures the proportion of true negatives that are correctly identified as negative. Both sensitivity and specificity ranges from 0 to 1, and it is considered the higher, the better. In this study, parameters of the models were tuned to enhance the AUROC curve and to optimize sensitivity in particular, since the objective was to maximize the capture of patients with a positive outcome.
The predictive accuracy of each model was also evaluated with 10-fold cross-validation, a standard way to validate the performance of ML models (Witten et al., 2011). In this process, the data are divided randomly into 10 approximately equal partitions; each partition is then used for testing, while the remainder is used for training.
Results
Sample Characteristics
After excluding the data points that had missing values from 171,136 admissions identified, the final sample included a total of 158,804 admissions associated with 92,481 distinct patients from January 1, 2009 to September 20, 2020. Among them, VTE positive cases (30-day readmission with acute DVT or PE) included 2,080 admissions of 1,695 patients (1.31%); and VTE negative cases (not admitted at all within 30 days) included 156,724 admissions of 90,786 patients.
Table 1 reports the basic characteristics of the study sample. The VTE positive group was older (mean: 55.4 years old; SD: 16.6) than the VTE negative group (mean: 52.0; SD: 18.8). The VTE positive group had a higher percentage of males (50.7%) compared to the VTE negative group (47.2%); and higher percentages of White and non-Hispanic (72.9% and 63.8%, respectively) compared to the VTE negative group (69.0% and 61.5%, respectively). Average length of stay during the initial hospitalization was 6.2 days among VTE positive patients, versus 5.4 days among VTE negative patients. The most prevalent primary diagnosis for the VTE positive group was “symptoms and signs involving circulatory and respiratory systems” (61.2%); whereas for the VTE negative group it was hypertensive diseases (45.5%). Antithrombotic agents were the second most commonly administrated medication for the VTE positive group, prescribed for 85.6% of the patients. By contrast, this medication was only administrated for 65.1% of the patients in the VTE negative group, ranked the fifth among the prevalently used medications during hospitalization. The major commonly performed procedure across both groups was cardiovascular system-related procedures. The most prevalent medical history for both groups was diseases of the circulatory system, but the percentages were different (VTE positive group: 40.6%; VTE negative group: 14.4%). The VTE positive groups had a higher comorbidity score (mean: 4.4; SD: 4.7) than the VTE negative group (mean: 3.4; SD: 4.7). Both groups had higher percentages of medical patients than surgical patients (13%), with the VTE positive group had a relatively lower percent of surgical patients (10%, versus 13.4% for the VTE negative group).
Table 1.
Sample Characteristics
| Total (n=158,804) | 30-day VTE positive readmission (n=2,080) | 30-day VTE negative readmission (n=156,724) | ||
|---|---|---|---|---|
| Distinct number of patients | 92,481 | 1,695 | 90,786 | |
| Age at the time of initial visit, y, mean (SD) | 52.1 (18.8) | 55.4 (16.6) | 52.0 (18.8) | |
| Gender, n (%) | ||||
| Unknown | 73 (0.1%) | 2 (0.1%) | 71 (0.0%) | |
| Race, n (%) | ||||
| Black | 5,468 (3.4%) | 113 (5.4%) | 5,355 (3.4%) | |
| Unknown | 1,140 (0.7%) | 4 (0.2%) | 1,136 (0.7%) | |
| Ethnicity, n (%) | ||||
| Unknown | 7,669 (4.8%) | 101 (4.9%) | 7,568 (4.8%) | |
| Length of initial inpatient stay, days, mean (SD) | 5.4 (8.0) | 6.2 (7.9) | 5.4 (8.0) | |
| Prevalent Diagnoses | 1 | Hypertensive diseases (72,449, 45.6%) |
Symptoms and signs involving circulatory and respiratory systems (1,273, 61.2%) |
Hypertensive diseases (71,372, 45.5%) |
| 2 | Metabolic disorders (70,308, 44.3%) |
Hypertensive diseases (1,077, 51.8%) |
Metabolic disorders (69,236, 44.2%) |
|
| 3 | General symptoms and signs (68,530, 43.2%) |
General symptoms and signs (1,072, 51.5%) |
General symptoms and signs (67,458, 43.0%) |
|
| 4 | Symptoms and signs involving circulatory and respiratory systems (68,312, 43.0%) |
Metabolic disorders (1,072, 51.5%) |
Symptoms and signs involving circulatory and respiratory systems (67,039, 42.8%) |
|
| 5 | Symptoms and signs involving digestive system and abdomen (61,626, 38.8%) |
Diseases of veins, lymphatic vessels and lymph nodes, not elsewhere classified (1,018, 48.9%) |
Symptoms and signs involving digestive system and abdomen (60,709, 38.7%) |
|
| Prevalent Medications | 1 | Solution additives (133,839, 84.3%) |
Solution additives (1,917, 92.2%) |
Solution additives (131,922, 84.2%) |
| 2 | Drugs for constipation (127,394, 80.2%) |
Antithrombotic agents (1,780, 85.6%) |
Drugs for constipation (125,775, 80.3%) |
|
| 3 | Other analgesics and antipyretics (124,735, 78.5%) |
Drugs for constipation (1,619, 77.8%) |
Other analgesics and antipyretics (123,215, 78.6%) |
|
| 4 | Opioids (112,503, 70.8%) |
Other analgesics and antipyretics (1,520, 73.1%) |
Opioids (111,005, 70.8%) |
|
| 5 | Antithrombotic agents (103,392, 65.1%) |
Opioids (1,498, 72.0%) |
Potassium (102,247, 65.2%) |
|
| Prevalent Procedures | 1 | Cardiovascular system related procedure (128,638, 81.0%) |
Cardiovascular system related procedure (1,888, 90.8%) |
Cardiovascular system related procedure (126,750, 80.9%) |
| 2 | Hospital inpatient services (112,109, 70.6%) |
Hospital inpatient services (1,804, 86.7%) |
Hospital inpatient services (110,305, 70.4%) |
|
| 3 | Diagnostic radiology (112,085, 70.6%) |
Diagnostic radiology (1,802, 86.6%) |
Diagnostic radiology (110,283, 70.4%) |
|
| 4 | Emergency department services (94,540, 59.5%) |
Pulmonary procedures (1,535, 73.8%) |
Emergency department services (93,165, 59.4%) |
|
| 5 | Pulmonary procedures (88,314, 55.6%) |
Emergency department services (1,375, 66.1%) |
Pulmonary procedures (86,779, 55.4%) |
|
| Prevalent Medical History | 1 | Diseases of the circulatory system (23,473, 14.8%) |
Diseases of the circulatory system (845, 40.6%) |
Diseases of the circulatory system (22,628, 14.4%) |
| 2 | Other specified personal risk factors, not elsewhere classified (19,525, 12.3%) |
Other specified personal risk factors, not elsewhere classified (365, 17.5%) |
Other specified personal risk factors, not elsewhere classified (19,160, 12.2%) |
|
| 3 | Other specified conditions (17,569, 11.1%) |
Other specified conditions (190, 9.1%) |
Other specified conditions (17.379, 11.1%) |
|
| 4 | Pedal cycle driver injured in collision with car (6,663, 4.2%) |
Pedal cycle driver injured in collision with car (112, 5.4%) |
Pedal cycle driver injured in collision with car (6,551, 4.2%) |
|
| 5 | Malignant neoplasm of digestive organs (6,551, 4.1%) |
Malignant neoplasm of digestive organs (107, 5.1%) |
Malignant neoplasm of digestive organs (6,444, 4.1%) |
|
| Charlson Comorbidity Score, mean (SD) | 3.4 (4.7) | 4.4 (4.7) | 3.4 (4.7) | |
| Surgical patients (%) | 21,265 (13.4%) | 215 (10.3%) | 21,050 (13.4%) | |
Data Preprocessing and Feature Selection
The BRF model was tested for feature selection with an AUC=0.84 and testing accuracy of 78.2%. Based on the model output, 189 features were included in the final analysis from a total of 641 candidate features. The ten selected features with the highest feature importance are presented in Figure 1. These include: 1) Diseases of veins, lymphatic vessels and lymph nodes, 2) Pulmonary heart disease and diseases of pulmonary circulation, 3) Noninvasive vascular diagnostic studies, 4) Age at the initial inpatient visit, 5) Personal history of diseases of the circulatory system, 6) Charlson Comorbidity score, 7) Length of the initial inpatient stay, 8) Antithrombotic Agents, 9) Symptoms and signs involving the circulatory and respiratory systems, and 10) Diagnostic radiology.
Figure 1.
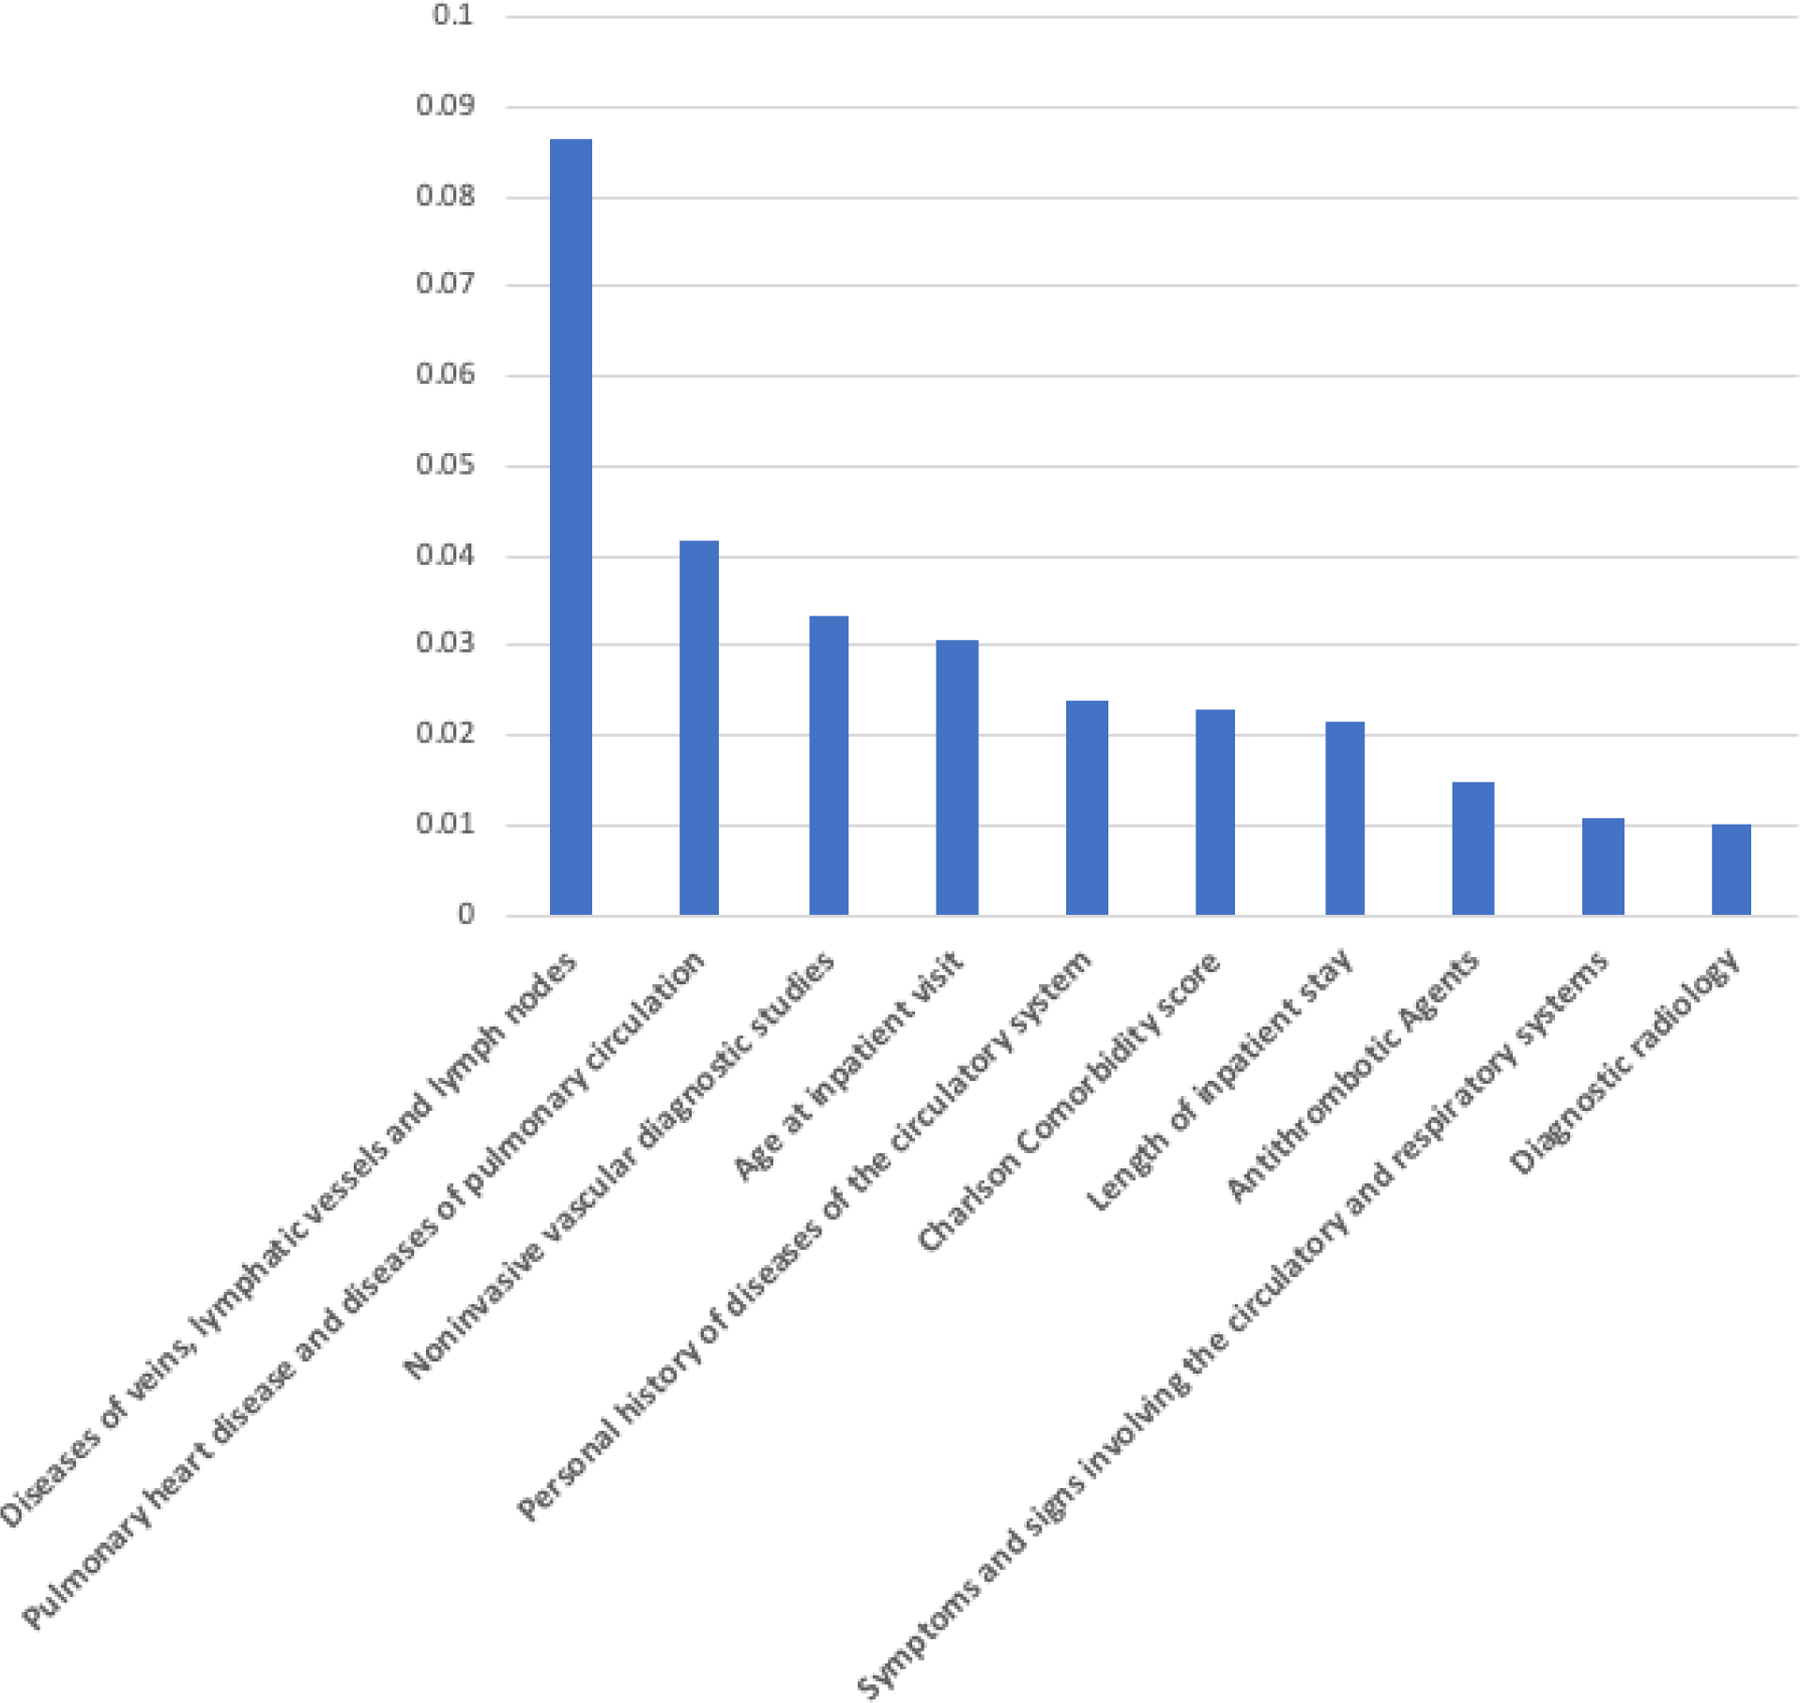
Feature Importance from the Balanced Random Forest Model
Prediction Model Development
Three prediction models were developed using LR, BRF, and MLP. As mentioned earlier, only the LR and MLP models used the class weighting approach to counter the imbalanced classes since the BRF model automatically balances the skewed classes. For the LR model, we used standard implementation from the Scikit-learn library in Python. We used L2-norm for the penalty with L-BFGS optimizer with enough number of iterations to full converge under the given tolerance (0.0001).
The BRF and MLP models require a set of hyperparameters that need to be tuned for optimal performance. In this study, the hyperparameters were tuned with 10-fold cross-validation for given parameter ranges to maximize sensitivity. For the layers in the MLP model, we used Rectified Linear Unit (ReLU) for the activation function in order to learn the non-linear distribution of the data, and Dropout layers for the regularization, which helps to prevent overfitting (Nair and Hinton, 2010; Srivastava et al., 2014). The number of epochs, learning rate, number of layers, neurons per layer, and dropout parameter in the MLP model were treated as hyperparameters for the tuning. We used 100 epochs with early stopping, the learning rate of 0.0002, two hidden layers with 50 neurons each, and a Dropout rate of 0.5. For the RBF model, the number of trees and the maximum depth of a tree were tuned. We found that 33 maximum depth and 630 trees were optimal for our data.
Performance Evaluation
Predictive performance was evaluated using the AUROC curve, sensitivity, and specificity (Table 2). In this study, the AUROC curve and sensitivity had a higher priority in evaluation to measure the overall performance and the true positive rate to maximize the recall of VTE positive cases. We also evaluated the balance between the sensitivity and specificity. The BRF model outperformed the other two models, showing the highest AUROC curve (0.84) and sensitivity (0.74). Although the LR model showed the highest specificity (0.84), its sensitivity was the lowest (0.69). Therefore, our results show that the BRF model has the best performance for VTE risk prediction for our study based on the predetermined criteria.
Table 2.
Prediction Model Evaluation
| AUROC curve | Sensitivity | Specificity | |
|---|---|---|---|
| Logistic Regression * | 0.83 | 0.69 | 0.84 |
| Multilayer Perceptron * | 0.83 | 0.71 | 0.80 |
| Balanced Random Forest | 0.84 | 0.74 | 0.80 |
Class weighting added
Discussion
Reducing hospital readmissions, particularly those related to post-discharge VTE, is critical to improving discharge planning and transition of care. To date, risk prediction tools that can identify patients at risk for developing VTE after discharge are lacking. This study developed a high-performing, validated risk prediction tool using an RF model derived from real-world evidence—the rich data from EHR—to identify patients at risk of VTE after discharge, potentially guiding treatment decisions for community-discharged patients for better patient outcomes. We believe that such a model, when deployed in a clinical setting, has great potential to improve the quality of health care delivery and positively affect patient health, as demonstrated in many other related diseases areas (Shameer et al., 2017).
The results of this work also showed that the VTE positive group had several predisposition factors for developing post-discharge VTE such as older age, higher comorbidity, longer length of stay, higher percentages of circulatory and respiratory symptoms, and a higher percentage of veins, lymphatic vessels, and lymph nodes disease. The VTE positive group stayed in the hospital longer on average (6.2 days) than the VTE negative group (5.4 days), supporting the existing evidence that the VTE events are associated with an increased length of stay (Amin et al., 2019). Having a lower percentage of surgical patients for the VTE positive group can be explained by VTE prophylaxis. VTE prophylaxis is essential in managing surgical procedures; most surgical patients receive prophylactic anticoagulation therapy during hospitalization; some even after discharge. Therefore, the risk prediction model developed in this study can be implemented in real clinical settings to guide the decision on dose or duration of prophylactic anticoagulation treatment. The most prevalent diagnosis for the VTE positive group was symptoms and signs involving circulatory and respiratory systems (61.2%), which are known risk factors for VTE (Anderson & Spencer, 2003). It is possible that having VTE during an inpatient stay affected the VTE development after discharge: the antithrombotic agents were frequently used among the VTE positive groups (85.6%) compared to the VTE negative group which may be attributable to the fact that the former had higher percentages of VTE diagnosis during the inpatient stay and thus had more prescriptions of antithrombotic agents. The prediction model developed in this study can support personalized treatment decisions for this group of patients who are at risk for hospital acquired VTE at discharge: if a patient is at risk for 30-day readmission with VTE, then appropriate prophylactic anticoagulant can be ordered at discharge to prevent the readmission. The most prevalent medical history was diseases of the circulatory system for both groups, with the VTE positive group having a much higher percentage (40% vs. 14%). This may indicate that a prior VTE incidence increases the likelihood of VTE development after discharge from a later hospitalization.
As we enter a precision health era where many individual variables are taken into account for disease prevention and health promotion (Ashley, 2016), there is a growing need for nursing researchers and healthcare providers to provide more personalized care by discovering new insights from the large data captured in EHRs. The secondary use of EHR data, particularly for risk prediction, provides meaningful guidelines using real-world evidence for improving quality of care and patient safety while lowering cost. The use of EHR data and big data analytics for research in nursing, the nation’s largest healthcare profession, could enhance the visibility of nursing care and knowledge generation.
There are several limitations to this study. The EHR data were from a single academic medical center; therefore, whether the findings can be generalized to other institutions and other clinical settings require further validation. To overcome this limitation, external validation can be carried out as future work at additional sites with different patient populations and providers. Further, the data set analyzed in this study was imbalanced, and the VTE positive group was relatively small (1.31%) compared to the size of the VTE negative group. Although imbalanced data were corrected and an alternative approach was used, future work involving more VTE positive patients would be needed to improve the model validity.
Conclusion
This study developed and validated a high-performing risk prediction model using machine learning and EHRs, to identify at-risk patients for 30-day readmissions with VTE. With the complicated nature of estimating the risk of VTE after discharge, it is necessary to precisely predict the likelihood of individualized outcome for each patient. The risk prediction model developed in this study provides a personalized decision support tool that can be implemented in real clinical settings with the potential for producing better patient outcomes.
Supplementary Material
Footnotes
Clinical Resources
Artificial Intelligence in Healthcare. https://online.stanford.edu/programs/artificial-intelligence-healthcare
Fundamentals of Machine Learning for Healthcare. https://online.stanford.edu/courses/som-xche0010-fundamentals-machine-learning-healthcare
References
- Amin A, Neuman WR, Lingohr-Smith M, Menges B, & Lin J (2019). Influence of the duration of hospital length of stay on frequency of prophylaxis and risk for venous thromboembolism among patients hospitalized for acute medical illnesses in the USA. Drugs in context, 8. [DOI] [PMC free article] [PubMed] [Google Scholar]
- Anderson FA Jr, & Spencer FA (2003). Risk factors for venous thromboembolism. Circulation, 107(23_suppl_1), I–9. [DOI] [PubMed] [Google Scholar]
- Ashley EA (2016). Towards precision medicine. Nature Reviews Genetics, 17(9), 507. [DOI] [PubMed] [Google Scholar]
- Beck JR, & Shultz EK (1986). The use of relative operating characteristic (ROC) curves in test performance evaluation. Archives of Pathology & Laboratory Medicine, 110(1), 13–20. [PubMed] [Google Scholar]
- CDC. Learn about healthcare-associated venous thromboembolism. Available from https://www.cdc.gov/ncbddd/dvt/ha-vte.html#ref. Last reviewed February 7, 2020. Accessed September 22, 2020.
- Charlson M, Szatrowski TP, Peterson J, & Gold J (1994). Validation of a combined comorbidity index. Journal of clinical epidemiology, 47(11), 1245–1251. [DOI] [PubMed] [Google Scholar]
- Chen C, Liaw A, & Breiman L (2004). Using random forest to learn imbalanced data. University of California, Berkeley, 110(1–12), 24. [Google Scholar]
- Chen JH, & Asch SM (2017). Machine learning and prediction in medicine—beyond the peak of inflated expectations. The New England journal of medicine, 376(26), 2507. [DOI] [PMC free article] [PubMed] [Google Scholar]
- Fahrni J, Husmann M, Gretener SB, & Keo HH (2015). Assessing the risk of recurrent venous thromboembolism–a practical approach. Vascular health and risk management, 11, 451. [DOI] [PMC free article] [PubMed] [Google Scholar]
- Hachey KJ, Sterbling H, Choi DS, Pinjic E, Hewes PD, Munoz J, & Litle VR (2016). Prevention of postoperative venous thromboembolism in thoracic surgical patients: implementation and evaluation of a Caprini risk assessment protocol. Journal of the American College of Surgeons, 222(6), 1019–1027. [DOI] [PubMed] [Google Scholar]
- Japkowicz N, & Stephen S (2002). The class imbalance problem: A systematic study. Intelligent Data Analysis, 6(5), 429–449. [Google Scholar]
- Kahn SR, Morrison DR, Cohen JM, Emed J, Tagalakis V, Roussin A, & Geerts W (2013). Interventions for implementation of thromboprophylaxis in hospitalized medical and surgical patients at risk for venous thromboembolism. Cochrane Database of Systematic Reviews, (7). [DOI] [PubMed] [Google Scholar]
- Kansagara D, Englander H, Salanitro A, Kagen D, Theobald C, Freeman M, & Kripalani S (2011). Risk prediction models for hospital readmission: a systematic review. Journal of American Medical Association, 306(15), 1688–1698. [DOI] [PMC free article] [PubMed] [Google Scholar]
- Lemaître G, Nogueira F, & Aridas CK (2017). Imbalanced-learn: A python toolbox to tackle the curse of imbalanced datasets in machine learning. The Journal of Machine Learning Research, 18(1), 559–563. [Google Scholar]
- Le Sage S, McGee M, & Emed JD (2008). Knowledge of venous thromboembolism (VTE) prevention among hospitalized patients. Journal of Vascular Nursing, 26(4), 109–117. [DOI] [PubMed] [Google Scholar]
- Ling CX, & Sheng VS (2011). Cost-sensitive learning. Encyclopedia of machine learning (pp. 231–235) Springer. [Google Scholar]
- Miotto R, Li L, Kidd BA, & Dudley JT (2016). Deep patient: an unsupervised representation to predict the future of patients from the electronic health records. Scientific reports, 6(1), 1–10. [DOI] [PMC free article] [PubMed] [Google Scholar]
- Morgan DJ, Bame B, Zimand P, Dooley P, Thom KA, Harris AD, Bentzen S, Ettinger W, Garrett-Ray SD, Tracy JK & Liang Y (2019). Assessment of machine learning vs standard prediction rules for predicting hospital readmissions. JAMA network open, 2(3), e190348–e190348. [DOI] [PMC free article] [PubMed] [Google Scholar]
- Nair V, & Hinton GE (2010, January). Rectified linear units improve restricted boltzmann machines. In ICML. [Google Scholar]
- Pal SK, & Mitra S (1992). Multilayer perceptron, fuzzy sets, classification. [DOI] [PubMed]
- Secemsky EA, Rosenfield K, Kennedy KF, Jaff M, & Yeh RW (2018). High burden of 30-day readmissions after acute venous thromboembolism in the United States. Journal of the American Heart Association, 7(13), e009047. [DOI] [PMC free article] [PubMed] [Google Scholar]
- Shameer K, Johnson KW, Yahi A, Miotto R, Li LI, Ricks D, Jebakaran J, Kovatch P, Sengupta PP, Gelijins S, & Moskovitz A (2017). Predictive modeling of hospital readmission rates using electronic medical record-wide machine learning: a case-study using Mount Sinai heart failure cohort. In Pacific Symposium on Biocomputing 2017 (pp. 276–287). [DOI] [PMC free article] [PubMed] [Google Scholar]
- Spyropoulos AC, McGinn T, & Khorana A (2012). The use of weighted and scored risk assessment models for venous thromboembolism. Thrombosis and haemostasis. 108(6), 1072. [DOI] [PubMed] [Google Scholar]
- Srivastava N, Hinton G, Krizhevsky A, Sutskever I, & Salakhutdinov R (2014). Dropout: a simple way to prevent neural networks from overfitting. The journal of machine learning research, 15(1), 1929–1958. [Google Scholar]
- Streiff MB, Brady PJ, Grant AM, Grosse SD, Wong B, & Popovic T (2014). CDC Grand Rounds: preventing hospital-associated venous thromboembolism. MMWR. Morbidity and mortality weekly report, 63(9), 190. [PMC free article] [PubMed] [Google Scholar]
- Sundararajan V, Henderson T, Perry C, Muggivan A, Quan H, & Ghali WA (2004). New ICD-10 version of the Charlson comorbidity index predicted in-hospital mortality. Journal of clinical epidemiology, 57(12), 1288–1294. [DOI] [PubMed] [Google Scholar]
- Weycker D, Li X, Wygant GD, Lee T, Hamilton M, Luo X, Vo L, Mardekian J, Pan X, & Atwood M (2018). Effectiveness and safety of apixaban versus warfarin as outpatient treatment of venous thromboembolism in US clinical practice. Thrombosis and haemostasis, 118(11), 1951. [DOI] [PMC free article] [PubMed] [Google Scholar]
- Witten IH, Frank E, & Hall MA (2011). Data mining: Practical machine learning tools and techniques. Burlington, MA: Elsevier. [Google Scholar]
Associated Data
This section collects any data citations, data availability statements, or supplementary materials included in this article.