Abstract
This retrospective study was to investigate the association between clinical characteristics and computerized tomography (CT) findings in patients with coronavirus disease-2019 (COVID-19). The clinical data of COVID-19 patients were retrospectively analyzed. Spearman correlation analysis was used to identify the correlation. Totally 209 consecutive COVID-19 patients were eligible for the study, with the mean age of 47.53 ± 13.52 years. At onset of the disease, the most common symptoms were fever (85.65%) and cough (61.24%). The CT features of COVID-19 included pulmonary, bronchial, and pleural changes, with the significant pulmonary presentation of ground-glass opacification (93.30%), consolidation (48.80%), ground-glass opacification plus a reticular pattern (54.07%), telangiectasia (84.21%), and pulmonary fibrotic streaks (49.76%). Spearman analysis showed that the CT findings had significantly inverse associations with the platelets, lymphocyte counts, and sodium levels, but were positively related to the age, erythrocyte sedimentation rate, D-dimer, lactic dehydrogenase, α-hydroxybutyrate dehydrogenase, and C-reactive protein levels (P < .05). In conclusion, the severity of lung abnormalities on CT in COVID-19 patients is inversely associated with the platelets, lymphocyte count, and sodium levels, whereas positively with the age, erythrocyte sedimentation rate, D-dimer, lactic dehydrogenase, hydroxybutyrate dehydrogenase, and C-reactive protein levels.
Keywords: clinical characteristics, computerized tomography, coronavirus disease-2019, pneumonia
1. Introduction
Coronavirus disease-2019 (COVID-19), a highly infectious illness induced by severe acute respiratory syndrome-coronavirus-2 (SARS-CoV-2), has been confirmed to be a global public health emergency by the World Health Organization.[1,2] The incidence of COVID-19 is significantly on the rise in most countries except China. By the end of early August 2020, approximately 18.6 million people have been diagnosed as COVID-19 worldwide, and over 0.7 million people died of this disease. Currently, the full spectrum of COVID-19 is still not entirely clear.[3] Some patients may suffer from severe pneumonia and even death, whereas some may have no obvious clinical symptoms.[4] It is universally recognized that fever, cough, shortness of breath, fatigue, anosmia, myalgia, and sputum production are the most common symptoms of COVID-19, and there are also other less-reported symptoms like hemoptysis, diarrhea, and nasal obstruction.[4,5] Due to the highly infectious character of COVID-19, a reliable, rapid detection of pathogens, and a feasible differential diagnosis based on clinical examinations are very crucial when clinicians first contact with the suspected patients.
Recently, chest computerized tomography (CT), particularly high-resolution computed tomography, has been found a valuable imaging modality in the diagnosis and management of COVID-19 patients.[6–8] The predominant CT findings of COVID-19 comprises ground-glass opacification (GGO), bilateral involvement, consolidation, as well as peripheral and diffuse distribution.[9,10] There is a study showing that COVID-19 on imaging manifests as bilateral and peripheral GGO and consolidative pulmonary opacity, but 56% of patients with early infection have a normal CT; the frequency of CT findings increases with time after the onset of symptoms.[11] By analyzing the CT characteristics at different time points, Shi et al[8] found that the CT imaging was abnormal in COVID-19 patients, and even in asymptomatic patients, suggesting that CT imaging abnormalities may occur before symptoms appear. Hence, CT imaging may be a sensitive approach in the diagnosis of COVID-19. In this study, we assessed the association between clinical characteristics and CT findings in COVID-19 patients, aiming at providing more evidence for early diagnosis of COVID-19.
2. Materials and methods
2.1. Study design and population
Between January 20 and March 13 in 2020, the clinical data of COVID-19 patients admitted to Xiangyang Central Hospital were retrospectively analyzed. Inclusion criteria were as follows: age ≥18 years; the diagnosis of COVID-19 confirmed by the methods of isolation of SARS-CoV-2, or a genetic sequence matched with SARS-CoV-2, or at least 2 positive results of real-time reverse transcription-polymerase chain reaction (RT-PCR) assay for SARS-CoV-2; complete clinical information including demographics, signs, and symptoms, laboratory examination, and chest CT imaging. The patients with history of lung surgery or lung tumors were excluded. All the patients gave informed consent. This study had gained approval from the Institutional Review Board of Xiangyang Central Hospital, and the approval number was 2020-019.
2.2. Data collection
The demographics and clinical information of patients were assessed from the medical record management system of our hospital, including age, gender, exposure characteristics, underlying diseases, signs, and symptoms, routine blood indexes, blood biochemical indexes, as well as various indicators of coagulation function, heart function, and liver and kidney function examinations.
2.3. Image acquisition and evaluation
The chest CT scanning was performed on the patients in a supine position using the Philips Brilliance 64-multi-detector computerized tomography scanner. The parameters used for the scanning protocol included tube voltage of 120 kV, tube current-exposure time product of 50 to 300 mA, section thickness of 5 mm, screw pitch of 1.0, collimation width of 0.625 mm × 64, and matrix of 512 × 512. After scanning, the section thickness of 1 mm was reconstructed.
Through the double-blind method, 2 experienced radiologists in thoracic radiology independently reviewed the CT images on a picture archiving and communication system workstation with multiplanar reconstruction tools. If there existed conflicts on the results of CT images, they must reach consensus after discussion. The images in lung window settings were observed based on the lesion characteristics, such as location, distribution, morphology, margin, and density, whereas those in mediastinal window settings were viewed according to the extrapulmonary changes, including presence or absence of hilus pulmonis, mediastinal lymphadenectasis, and pleural thickening.
The pulmonary involvement of all the abnormalities was assessed quantitatively based on the area involved using a semiquantitative scoring system.[12] Five lung lobes were singly scored with the number from 0 to 5, and 0 to 5 points respectively represented no involvement, involvement <5%, involvement of 5% to 24%, involvement of 25% to 49%, involvement of 50% to 75%, and involvement >75%.[13] The total CT scores were the summation of each lobar score, with the range of 0 to 25 points.
2.4. Statistical analysis
All the data in the current study were analyzed using SPSS 23.0 software (SPSS Inc., Chicago, IL). The data normality was evaluated by Shapiro-Wilk test. The normally distributed data were expressed as the mean ± standard deviations (), and those with abnormal distribution were described as the median (interquartile) [M(Q1, Q3)]. The enumeration data were manifested as the frequency distribution and its percentage [n (%)]. Spearman correlation analysis was employed to identify the association between clinical characteristics and CT findings. All the statistical tests were 2-sided, and the pronounced difference was presented at P < .05.
3. Results
3.1. Clinical characteristics of included patients
Between January 20 and March 13 in 2020, a total of 231 COVID-19 patients were admitted to our hospital. When 1 with history of lung tumors and 21 lacking CT imaging information were excluded, 209 consecutive cases of COVID-19 were finally enrolled in this study, with the mean age of 47.53 ± 13.52 years. Among them, there were 101 males (48.33%) and 108 females (51.67%); 124 cases (59.33%) experienced exposure to coronaviruses, and 22 (10.53%) suffered from different underlying diseases. At onset of the disease, all the patients had symptoms including fever (85.65%), fatigue (25.36%), cough (61.24%), nasal obstruction (2.39%), running nose (2.39%), sore throat (6.70%), diarrhea (6.22%), headache (10.53%), and muscular soreness (12.44%). The clinical characteristics of all the included patients were summarized in Table 1.
Table 1.
Clinical characteristics of included patients, ()/M(Q1, Q3).
| Characteristics | Total cases (n = 209) |
| Age, yrs | 47.53 ± 13.52 |
| Gender, n (%) | |
| Male | 101 (48.33) |
| Female | 108 (51.67) |
| Exposure characteristics, n (%) | |
| Learning or working in Wuhan, China | 4 (4.04) |
| Recent travelling in Wuhan, China | 53 (25.36) |
| Contacting with infected patients | 20 (9.57) |
| Unknown exposure | 47 (22.49) |
| Underlying disease, n (%) | |
| Diabetes mellites | 3 (1.44) |
| Hypertension | 4 (1.91) |
| Cardiovascular and cerebrovascular disease | 3 (1.44) |
| Chronic liver disease | 3 (1.44) |
| Chronic obstructive pulmonary disease | 9 (4.31) |
| Signs and symptoms | |
| Pulse, times/min | 85.58 ± 9.61 |
| Systolic blood pressure, mm Hg | 122.13 ± 10.21 |
| Diastolic blood pressure, mm Hg | 78.56 ± 7.51 |
| Respiratory rate, times/min | 20.00 ± 1.37 |
| Oxygen saturation, % | 69.56 ± 43.78 |
| Body temperature, °C | 37.91 ± 0.78 |
| Fever, n (%) | 179 (85.65) |
| Fatigue, n (%) | 53 (25.36) |
| Cough, n (%) | 128 (61.24) |
| Nasal obstruction, n (%) | 5 (2.39) |
| Running nose, n (%) | 5 (2.39) |
| Sore throat, n (%) | 14 (6.70) |
| Diarrhea, n (%) | 13 (6.22) |
| Headache, n (%) | 22 (10.53) |
| Muscular soreness, n (%) | 26 (12.44) |
| Blood routine test | |
| Hemoglobin, g/L | 134.22 ± 16.10 |
| Red blood cells, 1012/L | 4.38 ± 0.44 |
| White blood cells, 109/L | 4.66 ± 1.59 |
| Platelets, 109/L | 185.24 ± 79.70 |
| Neutrophil count, 109/L | 2.65 (1.9, 3.82) |
| Lymphocyte count, 109/L | 1.29 ± 0.47 |
| Albumin, g/L | 44.08 ± 9.84 |
| Total bilirubin, μmol/L | 9.57 ± 4.86 |
| Serum potassium, mmol/L | 4.04 ± 0.48 |
| Sodium, mmol/L | 138.52 ± 14.38 |
| Coagulation function | |
| Prothrombin time, s | 12.01 ± 5.89 |
| Activated partial thromboplastin time, s | 28.23 ± 8.17 |
| Thrombin time, s | 17.59 ± 1.65 |
| Fibrinogen, g/L | 3.53 ± 1.02 |
| D-dimer, μg/L | 0.32 (0.20, 0.59) |
| Liver function | |
| Alanine aminotransferase, U/L | 24.20 ± 19.34 |
| Aspartate aminotransferase, U/L | 27.83 ± 14.54 |
| Kidney function | |
| Urea nitrogen, mmol/L | 4.56 ± 1.54 |
| Creatinine, μmol/L | 59.30 ± 20.52 |
| Uric acid, μmol/L | 270.85 ± 83.28 |
| Heart function | |
| Lactic dehydrogenase, U/L | 233.56 ± 83.56 |
| α-hydroxybutyrate dehydrogenase, U/L | 181.76 ± 77.45 |
| Creatine kinase, U/L | 63 (39, 104) |
| Creatine kinase-MB, U/L | 9.35 ± 6.23 |
| Blood biochemical indicators | |
| C-reactive protein, μg/L | 10.7 (4.61, 37.7) |
| Erythrocyte sedimentation rate, mm/h | 28.74 ± 21.53 |
| Procalcitonin, μg/L | 0.19 ± 0.13 |
Note: (), mean ± standard deviations; [n(%)] manifested the frequency distribution and its percentage; [M(Q1, Q3)] described as the median (interquartile).
3.2. CT findings of included patients
As shown in Table 2, the CT features of COVID-19 included pulmonary, bronchial, and pleural changes. Most patients had multiple lesions (88.52%). The most typical pulmonary change was GGO, approximately accounting for 93.30%, and other pulmonary changes contained lung consolidation (48.80%), GGO plus a reticular pattern (54.07%), telangiectasia (84.21%), pulmonary fibrotic streaks (49.76%), vocule sign (3.83%), and subpleural lines (3.35%). The lesions were mainly distributed peripherally (45.45%) or peripherally and centrally (53.59%). Air bronchogram, bronchiectasia, and bronchial deformation occurred in 62 (29.81%), 6 (2.88%), and 15 (7.21%) patients, respectively; 18 (8.61%), 15 (7.18%), and 5 (2.39%) patients separately suffered from pleural thickening, pleural indentation, and pleural effusion. In addition, the median CT scores were 5.00.
Table 2.
CT findings of included patients, n (%).
| CT findings | Total cases (n = 209) |
| Lesion characteristics | |
| Single lesion | 24 (11.48) |
| Multiple lesions | 185 (88.52) |
| Location | |
| Peripheral | 95 (45.45) |
| Central | 2 (0.96) |
| Peripheral and central | 112 (53.59) |
| Pulmonary changes | |
| Ground-glass opacity | 195 (93.30) |
| Lung consolidation | 102 (48.80) |
| Ground-glass opacity plus a reticular pattern | 113 (54.07) |
| Vocule sign | 8 (3.83) |
| Telangiectasia | 176 (84.21) |
| Pulmonary fibrotic streaks | 104 (49.76) |
| Subpleural lines | 7 (3.35) |
| Subpleural transparent lines | 6 (2.87) |
| Bronchial changes | |
| Air bronchogram | 62 (29.81) |
| Bronchiectasia | 6 (2.88) |
| Bronchial deformation | 15 (7.21) |
| Pleural changes | |
| Pleural thickening | 18 (8.61) |
| Pleural indentation | 15 (7.18) |
| Pleural effusion | 5 (2.39) |
| CT scores, M(Q1, Q3) | |
| Superior lobe of left lung | 1.00 (0.00, 1.00) |
| Inferior lobe of left lung | 1.00 (1.00, 2.00) |
| Superior lobe of right lung | 1.00 (0.00, 1.00) |
| Middle lobe of right lung | 1.00 (0.00, 1.00) |
| Inferior lobe of right lung | 1.00 (1.00, 2.00) |
| Total scores | 5.00 (2.00, 7.25) |
Note: (), mean ± standard deviations; [n(%)] manifested the frequency distribution and its percentage; [M(Q1, Q3)] described as the median (interquartile).
CT = computerized tomography.
3.3. Correlation between clinical characteristics and CT findings
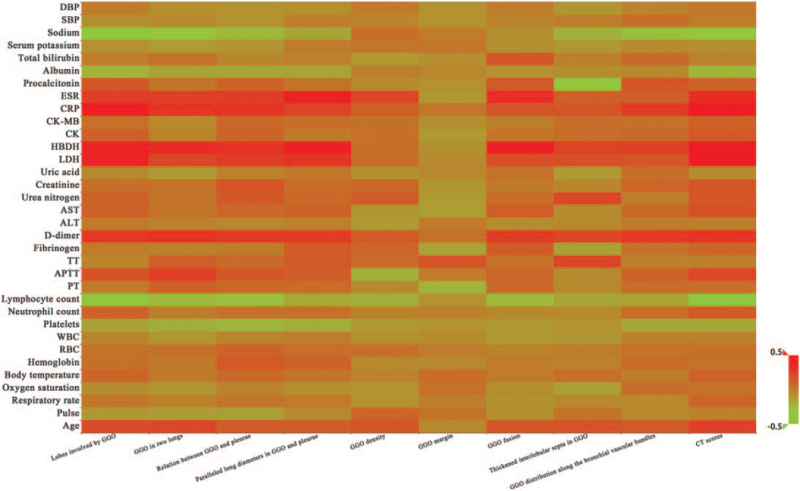
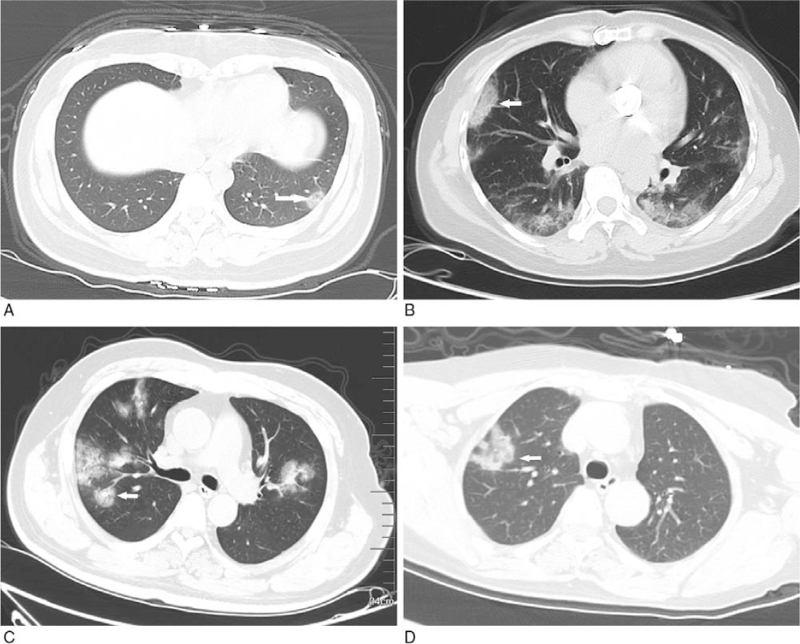
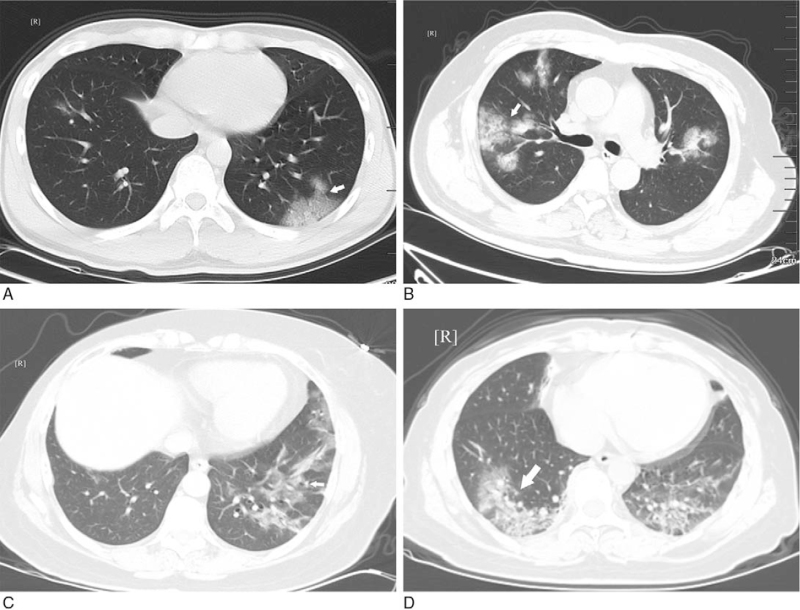
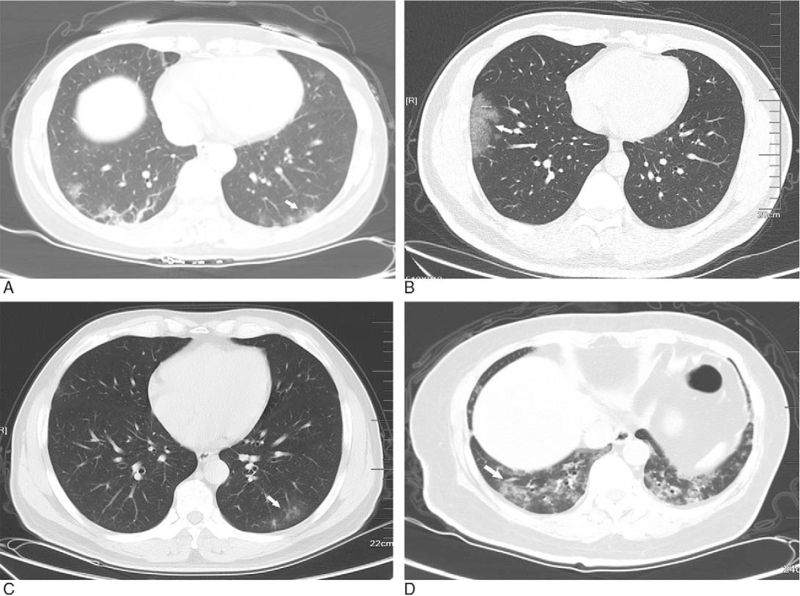
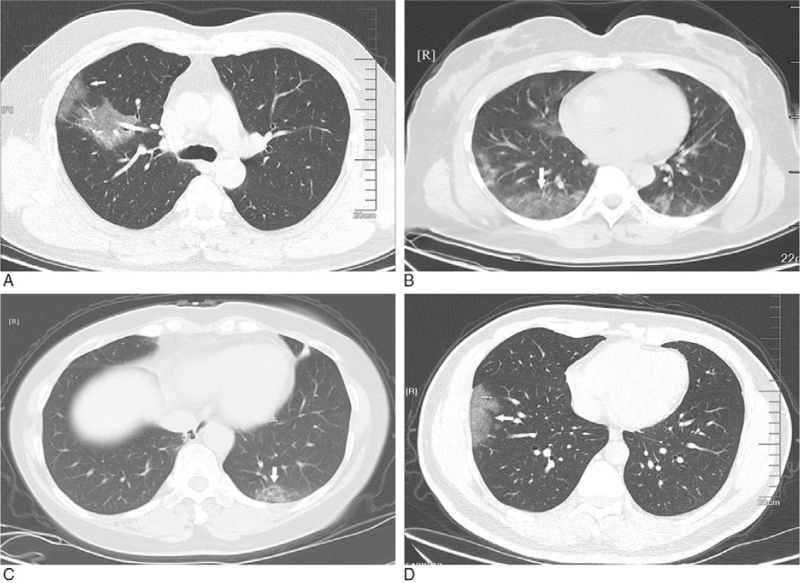
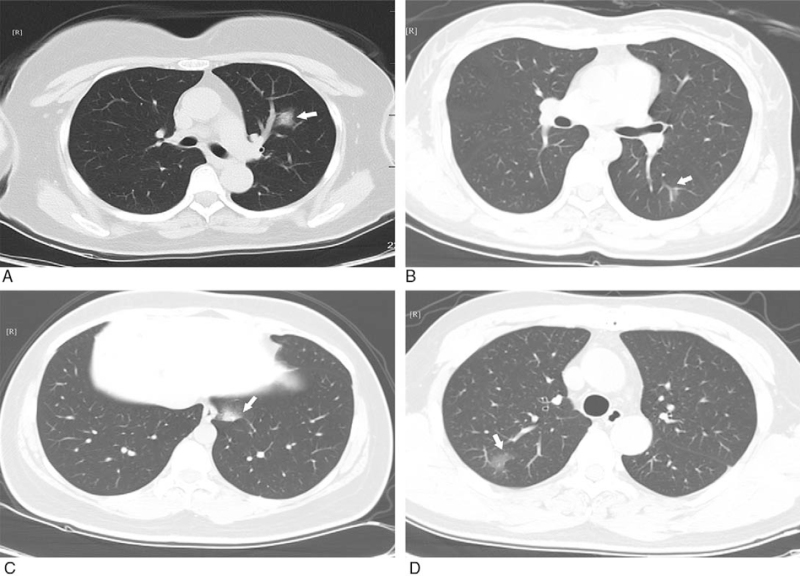
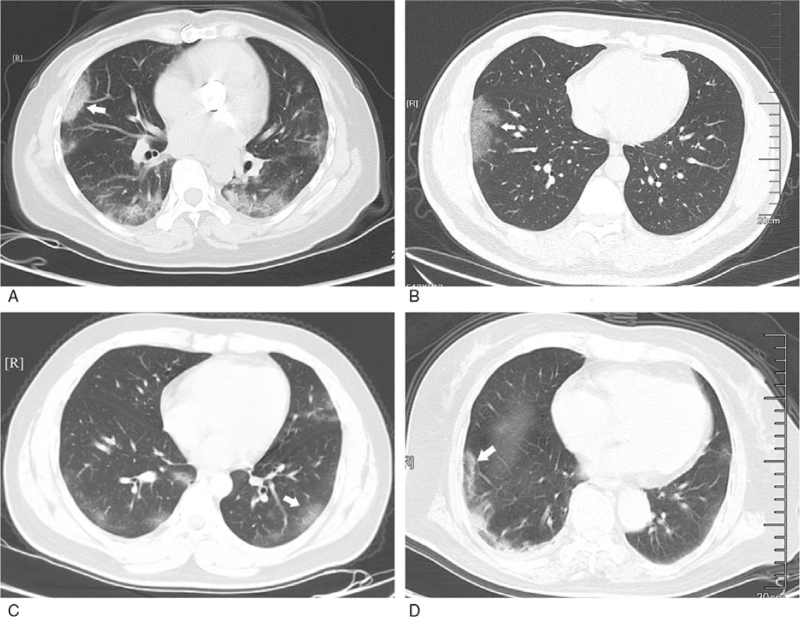
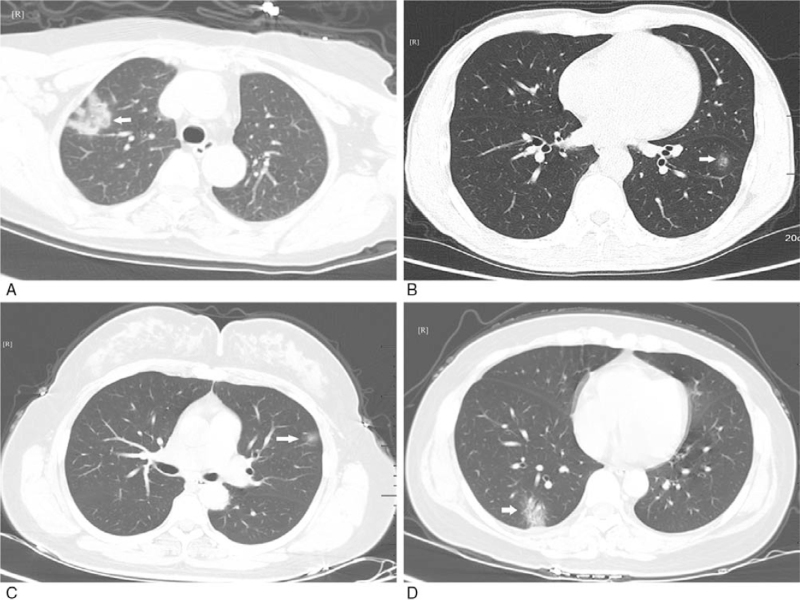
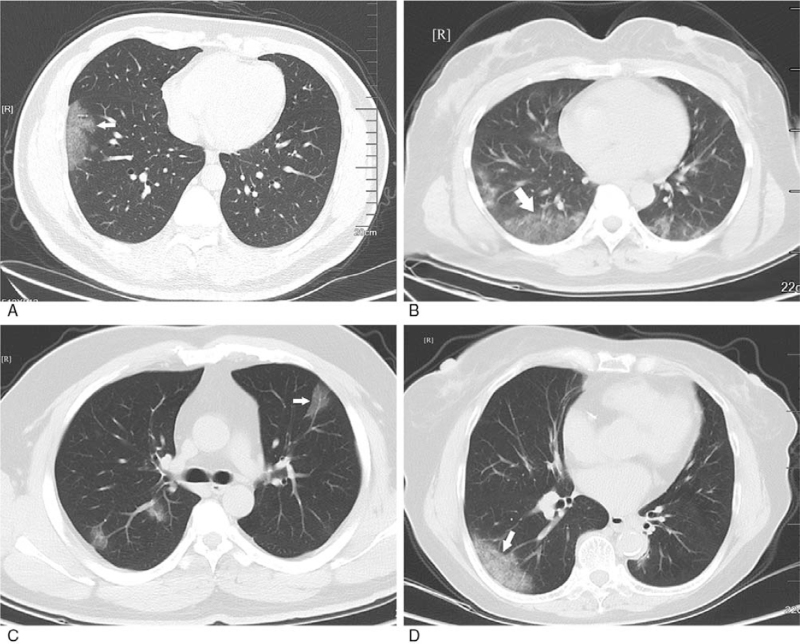
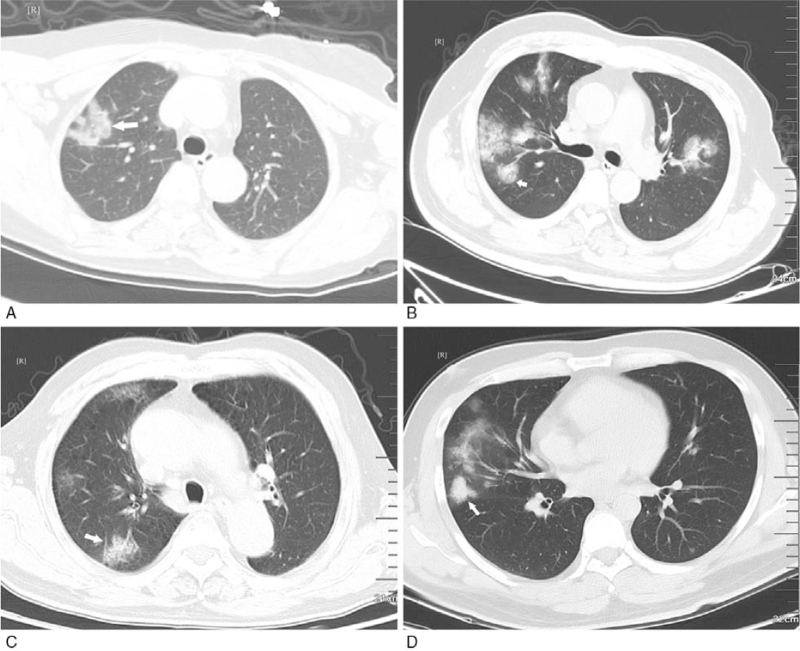
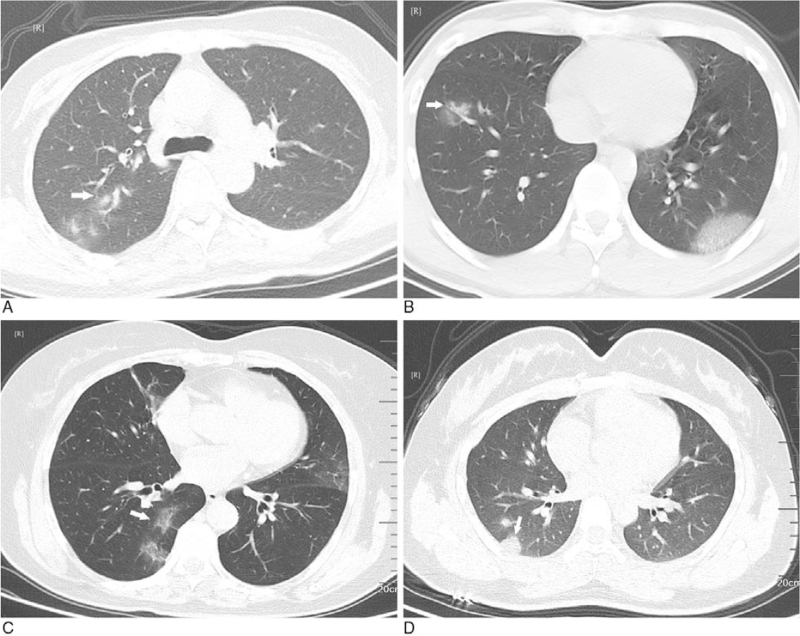
The correlation between clinical characteristics and CT findings in COVID-19 was listed in Table 3. It could be observed that age was positively associated with all CT findings except the GGO margin (clarity or ambiguity) [r range (0.136, 0.248), P < .05]. There were negative correlations between platelets and the lobes involved by GGO, GGO in 2 lungs, relation between GGO and pleurae (occur in subpleural or non-subpleural area), paralleled long diameters in GGO and pleurae (parallel or unparallel), GGO distribution along the bronchial vascular bundles, as well as CT scores [r range (–0.237, –0.152), P < .05]. Significantly inverse associations were presented between the lymphocyte count and all CT findings except the GGO margin [r range (–0.381, –0.165), P < .05]. The sodium level was inversely associated with the lobes involved by GGO, GGO in 2 lungs, relation between GGO and pleurae, thickened interlobular septa in GGO, GGO distribution along the bronchial vascular bundles, and CT scores [r range (–0.337, –0.215), P < .05]. D-dimer (D-D), lactic dehydrogenase (LDH), α-hydroxybutyrate dehydrogenase (HBDH), and C-reactive protein (CRP) levels were positively correlated with other CT findings except the GGO density (single or mixed type with incorporating consolidation) and margin [r range (0.162, 0.472), P < .05]. Besides, positive associations were also exhibited between the erythrocyte sedimentation rate (ESR) and the lobes involved by GGO, GGO in 2 lungs, relation of GGO with pleurae, paralleled long diameters in GGO and pleurae, GGO density, GGO fusion (with or without multiple niduses), and CT scores [r range (0.226, 0.374), P < .05]. Figure 1 was the heat map on the correlation between clinical characteristics and CT findings in COVID-19. Figures 2 to 11 displayed the CT images of patients.
Table 3.
Correlation between clinical characteristics and CT findings in COVID-19.
| Correlation coefficient r | ||||||||||
| Characteristics | Lobes involved by GGO | GGO in 2 lungs | Relation between GGO and pleurae | Paralleled long diameters in GGO and pleurae | GGO density | GGO margin | GGO fusion | Thickened interlobular septa in GGO | GGO distribution along the bronchial vascular bundles | CT scores |
| Age, yrs | 0.205∗∗ | 0.226∗∗ | 0.139∗ | 0.136∗ | 0.163∗ | -0.043 | 0.161∗ | 0.171∗ | 0.142∗ | 0.248∗∗∗ |
| Pulse, times/min | –0.109 | –0.131 | –0.14∗ | –0.049 | 0.098 | 0.039 | –0.077 | 0.04 | –0.049 | –0.018 |
| SBP, mm Hg | –0.075 | –0.05 | –0.093 | –0.012 | –0.034 | –0.09 | –0.029 | –0.001 | 0.056 | 0.006 |
| DBP, mm Hg | 0.006 | –0.069 | –0.085 | –0.073 | 0.017 | –0.082 | 0.003 | –0.104 | –0.031 | 0.022 |
| RR, times/min | 0.026 | –0.013 | 0.025 | 0.015 | –0.085 | –0.012 | –0.084 | –0.05 | –0.053 | 0.097 |
| SpO2, % | –0.059 | –0.105 | –0.025 | –0.072 | –0.09 | 0.053 | –0.063 | –0.141∗ | 0.057 | 0.037 |
| Body temperature, °C | 0.1 | 0.011 | 0.086 | 0.037 | –0.028 | 0.066 | 0.011 | 0.055 | –0.001 | 0.104 |
| Hemoglobin, g/L | 0.049 | 0.02 | 0.147∗ | 0.103 | –0.047 | –0.048 | 0.001 | –0.018 | 0.077 | 0.047 |
| RBC, 1012/L | 0.048 | 0.046 | 0.108 | 0.063 | 0.055 | 0.004 | –0.025 | 0.001 | 0.044 | 0.056 |
| WBC, 109/L | –0.029 | –0.108 | –0.027 | –0.005 | –0.078 | –0.054 | –0.114 | –0.102 | –0.014 | –0.013 |
| Platelets, 109/L | –0.152∗ | –0.208∗∗ | –0.237∗∗∗ | –0.205∗∗ | –0.112 | –0.092 | –0.112 | –0.09 | –0.173∗∗ | –0.172∗ |
| Neutrophil count, 109/L | 0.11 | –0.008 | 0.056 | 0.048 | –0.026 | –0.014 | –0.045 | –0.05 | 0.056 | 0.145∗ |
| Lymphocyte count, 109/L | –0.378∗∗∗ | –0.249∗∗∗ | –0.270∗∗∗ | –0.187∗∗ | –0.209∗∗ | –0.082 | –0.249∗∗∗ | –0.169∗ | –0.165∗ | –0.381∗∗∗ |
| Albumin, g/L | –0.223∗ | –0.159 | –0.171 | –0.163 | –0.008 | –0.041 | –0.078 | –0.068 | –0.044 | –0.235∗ |
| Total bilirubin, μmol/L | –0.002 | 0.045 | –0.036 | –0.015 | –0.117 | –0.071 | 0.163 | –0.009 | 0.085 | –0.024 |
| Serum potassium, mmol/L | –0.078 | –0.126 | –0.089 | 0.003 | 0.03 | 0.029 | –0.075 | –0.11 | –0.046 | –0.072 |
| Sodium, mmol/L | –0.337∗∗∗ | –0.296∗∗ | –0.243∗ | –0.166 | 0.066 | 0.007 | –0.077 | –0.215∗ | –0.273∗∗ | –0.310∗∗ |
| PT, s | 0.015 | 0.118 | 0.081 | 0.073 | –0.046 | –0.227∗ | 0.079 | –0.043 | 0.065 | 0.058 |
| APTT, s | 0.182 | 0.252∗∗ | 0.154 | 0.131 | –0.213∗ | 0.013 | 0.092 | –0.06 | 0.109 | 0.227∗ |
| TT, s | –0.033 | 0.125 | 0.079 | 0.141 | 0.072 | 0.167 | 0.052 | 0.223∗ | –0.016 | –0.011 |
| Fibrinogen, g/L | 0.014 | –0.02 | 0.005 | 0.141 | 0.104 | –0.156 | 0.14 | –0.152 | 0.05 | 0.095 |
| D-dimer, μg/L | 0.283∗∗ | 0.294∗∗ | 0.277∗∗ | 0.267∗∗ | 0.14 | 0.046 | 0.262∗ | 0.221∗ | 0.284∗∗ | 0.301∗∗ |
| ALT, U/L | 0.013 | –0.019 | –0.039 | –0.013 | –0.126 | 0.012 | –0.066 | –0.049 | 0.001 | –0.011 |
| AST, U/L | 0.116 | 0.035 | 0.089 | 0.109 | –0.106 | –0.132 | 0.13 | –0.059 | 0.083 | 0.181∗∗ |
| Urea nitrogen, mmol/L | 0.111 | 0.037 | 0.147∗ | 0.079 | 0.136∗ | –0.126 | 0.067 | 0.219∗∗ | –0.004 | 0.158∗ |
| Creatinine, μmol/L | 0.059 | 0.043 | 0.165∗ | 0.067 | 0.093 | –0.098 | 0.017 | –0.033 | 0.093 | 0.166∗ |
| Uric acid, μmol/L | –0.048 | –0.113 | –0.013 | 0.026 | –0.081 | –0.044 | 0.043 | –0.115 | 0.057 | –0.06 |
| LDH, U/L | 0.379∗∗∗ | 0.226∗∗∗ | 0.269∗∗∗ | 0.297∗∗∗ | 0.062 | –0.056 | 0.189∗∗ | 0.191∗∗ | 0.166∗ | 0.440∗∗ |
| HBDH, U/L | 0.363∗∗ | 0.323∗∗ | 0.294∗∗ | 0.397∗∗∗ | 0.063 | –0.077 | 0.398∗∗∗ | 0.242∗ | 0.256∗ | 0.439∗∗∗ |
| CK, U/L | 0.124 | –0.021 | 0.098 | 0.021 | 0.053 | –0.117 | 0.034 | 0.066 | 0.084 | 0.148∗ |
| CK-MB, U/L | 0.05 | –0.042 | 0.091 | 0.054 | 0.042 | –0.076 | –0.007 | 0.056 | 0.05 | 0.113 |
| CRP, μg/L | 0.440∗∗∗ | 0.291∗∗∗ | 0.292∗∗∗ | 0.240∗∗∗ | 0.124 | 0.031 | 0.167∗ | 0.162∗ | 0.276∗∗∗ | 0.472∗∗∗ |
| ESR, mm/h | 0.258∗ | 0.252∗ | 0.259∗ | 0.374∗∗∗ | 0.226∗ | –0.108 | 0.316∗∗ | 0.122 | 0.121 | 0.327∗∗ |
| Procalcitonin, μg/L | 0.155∗ | 0.033 | 0.11 | 0.037 | –0.05 | –0.079 | 0.15 | –0.309∗∗ | 0.161∗ | 0.107 |
ALT = alanine aminotransferase, APTT = activated partial thromboplastin time, AST = aspartate aminotransferase, CK = creatine kinase, CRP = C-reactive protein, DBP = diastolic blood pressure, ESR = erythrocyte sedimentation rate, GGO = ground-glass opacity, HBDH = α-hydroxybutyrate dehydrogenase, LDH = lactic dehydrogenase, PT = prothrombin time, RBC = red blood cells, RR = respiratory rate, SBP = systolic blood pressure, SpO2 = oxygen saturation, TT = thrombin time, WBC = white blood cells.
∗P < .05, ∗∗P < .01, and ∗∗∗P < .001.
Figure 1.
The heat map on the correlation between clinical characteristics and CT findings in COVID-19. ALT = alanine aminotransferase, APTT = activated partial thromboplastin time, AST = aspartate aminotransferase, CK = creatine kinase, COVID-19 = coronavirus disease-2019, CRP = C-reactive protein, CT = computerized tomography, DBP = diastolic blood pressure, ESR = erythrocyte sedimentation rate, GGO = ground-glass opacification, HBDH = hydroxybutyrate dehydrogenase, LDH = lactic dehydrogenase, PT = prothrombin time, RBC = red blood cells, SBP = systolic blood pressure, TT = thrombin time, WBC = white blood cells.
Figure 2.
GGO with clear margin. A: subpleural GGO in the lateral basal segment of the inferior lobe of left lung with uneven density (white arrow); B: bilateral pulmonary multiple GGO: subpleural GGO in the lateral segment of the middle lobe of right lung with uneven density (white arrow); C: bilateral pulmonary multiple GGO with uneven density (white arrow); D: single GGO in the superior lobe anterior segment of right lung with irregular morphology and uneven density (white arrow). GGO = ground-glass opacification.
Figure 11.
GGO with fusion. A: multiple GGO with clear margin and even density in the lower lobe of left lung (white arrow); B, D: multiple GGO with clear margin and uneven density in both lungs (white arrow); C: multiple GGO with clear margin and uneven density in left lung (white arrow). GGO = ground-glass opacification.
Figure 3.
GGO with ambiguous margin. A: multiple GGO with uneven density in the posterior basal segment of the lower lobes of both lungs (white arrow); B: subpleural GGO with even density in the anterior basal segment of the inferior lobe of right lung (white arrow); C: multiple GGO with uneven density in the posterior basal segment of the lower lobes of left lung (white arrow); D: multiple GGO in the lower lobes of both lungs with uneven density (white arrow). GGO = ground-glass opacification.
Figure 4.
Relation between GGO and pleurae occur in subpleural area. A: GGO with clear margin and even density in the upper lobe of right lung, and part of lesions adjacent to pleurae (white arrow); B: multiple GGO with ambiguous margin and uneven density in the lower lobes of both lungs (white arrow); C: GGO with ambiguous margin and uneven density in the posterior basal segment of the lower lobes of left lung (white arrow); D: GGO with ambiguous margin and even density in the anterior basal segment of the lower lobes of right lung (white arrow). GGO = ground-glass opacification.
Figure 5.
Relation between GGO and pleurae occur in non-subpleural area. A: GGO with clear margin and uneven density in the superior lingular segment of the upper lobe of left lung (white arrow); B, C: GGO with ambiguous margin and uneven density in the posterior basal segment of the lower lobes of left lung (white arrow); D: GGO with ambiguous margin and even density in the posterior segment of the upper lobe of right lung (white arrow). GGO = ground-glass opacification.
Figure 6.
Paralleled long diameters in GGO and pleurae. A: bilateral pulmonary multiple GGO: subpleural GGO with clear margin and even density in the lateral segment of the middle lobe of right lung (white arrow); B: subpleural GGO with ambiguous margin and even density in the anterior basal segment of the lower lobes of right lung (white arrow); C: bilateral pulmonary multiple GGO with ambiguous margin and uneven density (white arrow); D: multiple GGO with clear margin and uneven density in the external segment of the lower lobes of right lung (white arrow). GGO = ground-glass opacification.
Figure 7.
Unparalleled long diameters in GGO and pleurae. A: single GGO with clear margin, irregular shape, and uneven density in the anterior segment of the upper lobe of right lung (white arrow); B: single GGO with ambiguous margin and uneven density in the anterior and inner basal segment of the lower lobes of left lung (white arrow); C: single GGO with ambiguous margin and uneven density in the superior lingular segment of the upper lobe of left lung (white arrow); D: single GGO with ambiguous margin and uneven density in the posterior basal segment of the lower lobes of right lung (white arrow). GGO = ground-glass opacification.
Figure 8.
GGO density: simple type. A: simple type of subpleural GGO with ambiguous margin and even density in the anterior basal segment of the lower lobes of right lung (white arrow); B, C: simple type of multiple GGO with ambiguous margin and even density in both lungs (white arrow); D: simple type of GGO with ambiguous margin and even density in the back segment of the lower lobes of right lung (white arrow). GGO = ground-glass opacification.
Figure 9.
GGO density: mixed type with incorporating consolidation. A: GGO with clear margin, irregular shape and uneven density in the anterior segment of the upper lobe of right lung (white arrow); B: multiple GGO with clear margin and uneven density in both lungs (white arrow); C, D: multiple GGO with clear margin and uneven density in right lung (white arrow). GGO = ground-glass opacification.
Figure 10.
GGO without fusion. A: multiple GGO with ambiguous margin and uneven density in the upper lobe of right lung (white arrow); B, C: multiple GGO with ambiguous margin and uneven density in both lungs (white arrow); D: multiple GGO in both lungs with clear margin and even density (white arrow). GGO = ground-glass opacification.
4. Discussion
The recent study has demonstrated that the typical CT findings contribute to early screening of patients with suspected COVID-19 and effective assessment of the disease extent.[14] In this study, we analyzed the correlation between the clinical characteristics and CT findings in 209 consecutive COVID-19 patients, and discovered that the CT findings were inversely associated with the platelets, lymphocyte count, and sodium levels, whereas positively related to the age, ESR, D-D, LDH, HBDH, and CRP levels. These results suggested that the severity of lung abnormalities on CT in COVID-19 might be affected by multiple clinical and laboratory parameters. The greater the age, ESR, D-D, LDH, HBDH and CRP levels, and the lower the platelets, lymphocyte count and sodium levels, the more significant the lung abnormalities on CT.
The incremental number of confirmed COVID-19 cases is horrendous, and the overall number of cases has significantly exceeded that of SARS cases.[15] This continually increasing condition poses huge challenges to most countries due to incompletely explicit origin and biologic characteristics of COVID-19 and lack of effective drugs. At present, laboratory testing is thought to be the diagnostic standard for COVID-19, but the laboratory kits are often in short supply. Meanwhile, there also exist the false-negative results in the laboratory testing. It is known that the suspected cases may indirectly facilitate the transmission of viruses and cross infection. In this study, 57 (27.27%) patients learned/worked/travelled in Wuhan, 20 (9.57%) contacted with infected patients, and 47 (22.49%) had unknown exposure characteristics, highlighting the importance of early identification and timely isolation for the suspected patients to decrease human-to-human transmission. In our study, the most common symptoms were found to be fever (85.65%) and cough (61.24%), similar to the previous reports.[16–18] In addition to respiratory and systemic symptoms, 6.22% of patients suffered from diarrhea, suggesting an association between gastrointestinal symptoms and the pathogenesis of COVID-19 caused by the binding of the virus to human receptor angiotensin-converting enzyme 2.[19]
CT, a routine imaging modality for COVID-19 diagnosis, contributes to early identification of lung abnormalities in the screening of patients highly suspected of the disease, particularly those with initial negative RT-PCR results.[7] In our study, the typical CT features of COVID-19 were GGO (93.30%), lung consolidation (48.80%), GGO plus a reticular pattern (54.07%), and pulmonary fibrotic streaks (49.76%), resembling those of other viral infections in the lung, such as middle east respiratory syndrome and SARS.[20,21] In terms of lesion distribution, most patients had multiple lesions (88.52%), and the lesions were primarily in the peripheral distribution (45.45%) or in the peripheral plus central distribution (53.59%). Additionally, our results also showed that 84.21% patients experienced telangiectasia probably caused by acute inflammatory responses. Nevertheless, this vascular change differed from the changes in malignant lesions, which usually manifested as irregular or distorted angiectasis and vascular convergence due to infiltration and chronic progression of tumors.[20]
In our study, the laboratory parameters like platelets, lymphocyte count, and sodium levels were observed to be negatively associated with CT characteristics of COVID-19 patients, whereas the age, ESR, D-D, LDH, HBDH, and CRP levels showed positive correlations, supported by the results of Xiong et al[16] that there are significantly positive associations of the ESR, LDH, and CRP levels with the severity of pneumonia quantified on the initial CT. Assessment of the ESR, LDH, and CRP levels may help to predict the inflammatory extent or the degree of extensive tissue injury, which is often observed in viral pneumonia.[22,23] Compared with non-severe cases, the LDH and CRP levels increase markedly in severe cases of COVID-19.[4] In a study involving convalescent patients after SARS, the neutrophil count, LDH, and CRP levels are found to be associated with the thin-section CT scores for interstitial opacities or GGO.[12] Moreover, another study has exhibited that except the elevated CRP level, a reduced lymphocyte count is also confirmed to be a sensitive parameter of COVID-19.[24,25]
Several limitations of our study should be concerned and cautiously interpreted. First, this was a retrospective study with small sample size, which may influence the statistical power. Second, the nucleic acid testing for COVID-19 was not available for all the suspected patients at the time of data collection, and the detection efficiency of real-time RT-PCR assay in SARS-CoV-2 nucleic acid was not high.[7] Third, there probably existed certain subjectivity in the assessment of lung abnormalities using semiquantitative and quantitative methods. Besides, the follow-up CT examinations had not been evaluated. Investigating CT variations and comparing them with clinical indicators may be conducive to better monitoring and predicting the outcomes of patients.[13]
5. Conclusions
Our clinical and radiologic results suggested that the platelets, lymphocyte count and sodium levels were negatively associated with the severity of lung abnormalities on CT in COVID-19 patients, whereas the age, ESR, D-D, LDH, HBDH, and CRP levels had positive correlations, which might provide novel findings for understanding the association between clinical characteristics and CT findings in COVID-19.
Author contributions
All authors contributed to study design. TZ and HR wrote the manuscript and contributed to data collection and analysis. YJW and JTW critically reviewed and edited the manuscript. All authors read and approved the final manuscript.
Conceptualization: Ting Zheng, Hao Ren, Yongjuan Wu, Jiangtao Wang.
Data curation: Ting Zheng.
Formal analysis: Ting Zheng.
Investigation: Hao Ren.
Methodology: Hao Ren.
Project administration: Ting Zheng.
Resources: Hao Ren.
Software: Hao Ren.
Supervision: Yongjuan Wu, Jiangtao Wang.
Validation: Yongjuan Wu, Jiangtao Wang.
Visualization: Yongjuan Wu, Jiangtao Wang.
Writing – original draft: Ting Zheng, Hao Ren.
Writing – review & editing: Yongjuan Wu, Jiangtao Wang.
Footnotes
Abbreviations: COVID-19 = coronavirus disease-2019, CRP = C-reactive protein, CT = computerized tomography, D-D = D-dimer, ESR = erythrocyte sedimentation rate, GGO = ground-glass opacification, HBDH = hydroxybutyrate dehydrogenase, LDH = lactic dehydrogenase, RT-PCR = reverse transcription-polymerase chain reaction, SARS-CoV-2 = severe acute respiratory syndrome-coronavirus-2.
How to cite this article: Zheng T, Ren H, Wu Y, Wang J. Association between clinical characteristics and CT findings in patients with coronavirus disease-2019. Medicine. 2021;100:44(e27435).
All the patients provided informed consent. This study had gained approval from the Institutional Review Board of Xiangyang Central Hospital, and the approval number was 2020-019.
Data sharing is not applicable to this article as no datasets were generated or analyzed during the current study.
The authors have no funding and conflicts of interest to disclose.
The datasets generated during and/or analyzed during the current study are available from the corresponding author on reasonable request.
References
- [1].Bikdeli B, Madhavan MV, Jimenez D, et al. COVID-19 and thrombotic or thromboembolic disease: implications for prevention, antithrombotic therapy, and follow-up: JACC state-of-the-art review. J Am Coll Cardiol 2020;75:2950–73. [DOI] [PMC free article] [PubMed] [Google Scholar]
- [2].World Health Organization. Coronavirus disease 2019 (COVID-19) situation report-39. Available at: https://www.who.int/docs/default-source/coronaviruse/situation-reports/20200228-sitrep-39-covid-19.pdf?sfvrsn=5bbf3e7d_2. Accessed on 5 July, 2020. [Google Scholar]
- [3].Ghannam M, Alshaer Q, Al-Chalabi M, Zakarna L, Robertson J, Manousakis G. Neurological involvement of coronavirus disease 2019: a systematic review. J Neurol 2020;267:01–19. [DOI] [PMC free article] [PubMed] [Google Scholar]
- [4].Guan WJ, Ni ZY, Hu Y, et al. Clinical characteristics of coronavirus disease 2019 in China. N Engl J Med 2020;382:1708–20. [DOI] [PMC free article] [PubMed] [Google Scholar]
- [5].Guan WJ, Liang WH, Zhao Y, et al. Comorbidity and its impact on 1590 patients with COVID-19 in China: a nationwide analysis. Eur Respir J 2020;55:2000547. [DOI] [PMC free article] [PubMed] [Google Scholar]
- [6].Fang Y, Zhang H, Xie J, et al. Sensitivity of chest CT for COVID-19: comparison to RT-PCR. Radiology 2020;296:E115–7. [DOI] [PMC free article] [PubMed] [Google Scholar]
- [7].Xie X, Zhong Z, Zhao W, Zheng C, Wang F, Liu J. Chest CT for typical coronavirus disease 2019 (COVID-19) pneumonia: relationship to negative RT-PCR testing. Radiology 2020;296:E41–5. [DOI] [PMC free article] [PubMed] [Google Scholar]
- [8].Shi H, Han X, Jiang N, et al. Radiological findings from 81 patients with COVID-19 pneumonia in Wuhan, China: a descriptive study. Lancet Infect Dis 2020;20:425–34. [DOI] [PMC free article] [PubMed] [Google Scholar]
- [9].Lei J, Li J, Li X, Qi X. CT imaging of the 2019 novel coronavirus (2019-nCoV) pneumonia. Radiology 2020;295:18. [DOI] [PMC free article] [PubMed] [Google Scholar]
- [10].Lee EYP, Ng MY, Khong PL. COVID-19 pneumonia: what has CT taught us? Lancet Infect Dis 2020;20:384–5. [DOI] [PMC free article] [PubMed] [Google Scholar]
- [11].Bernheim A, Mei X, Huang M, et al. Chest CT findings in coronavirus disease-19 (COVID-19): relationship to duration of infection. Radiology 2020;295:200463. [DOI] [PMC free article] [PubMed] [Google Scholar]
- [12].Chang YC, Yu CJ, Chang SC, et al. Pulmonary sequelae in convalescent patients after severe acute respiratory syndrome: evaluation with thin-section CT. Radiology 2005;236:1067–75. [DOI] [PubMed] [Google Scholar]
- [13].Pan F, Ye T, Sun P, et al. Time course of lung changes at chest CT during recovery from coronavirus disease 2019 (COVID-19). Radiology 2020;295:715–21. [DOI] [PMC free article] [PubMed] [Google Scholar]
- [14].Zhao W, Zhong Z, Xie X, Yu Q, Liu J. Relation between chest CT findings and clinical conditions of coronavirus disease (COVID-19) pneumonia: a multicenter study. Am J Roentgenol 2020;214:1072–7. [DOI] [PubMed] [Google Scholar]
- [15].Wang C, Horby PW, Hayden FG, Gao GF. A novel coronavirus outbreak of global health concern. Lancet 2020;395:470–3. [DOI] [PMC free article] [PubMed] [Google Scholar]
- [16].Xiong Y, Sun D, Liu Y, et al. Clinical and high-resolution CT features of the COVID-19 infection: comparison of the initial and follow-up changes. Invest Radiol 2020;55:332–9. [DOI] [PMC free article] [PubMed] [Google Scholar]
- [17].Huang C, Wang Y, Li X, et al. Clinical features of patients infected with 2019 novel coronavirus in Wuhan, China. Lancet 2020;395:497–506. [DOI] [PMC free article] [PubMed] [Google Scholar]
- [18].Wang D, Hu B, Hu C, et al. Clinical characteristics of 138 hospitalized patients with 2019 novel coronavirus-infected pneumonia in Wuhan, China. JAMA 2020;323:1061–9. [DOI] [PMC free article] [PubMed] [Google Scholar]
- [19].Wan Y, Shang J, Graham R, Baric RS, Li F. Receptor recognition by the novel coronavirus from Wuhan: an analysis based on decade-long structural studies of SARS coronavirus. J Virol 2020;94:e00127–220. [DOI] [PMC free article] [PubMed] [Google Scholar]
- [20].Gao F, Li M, Ge X, et al. Multi-detector spiral CT study of the relationships between pulmonary ground-glass nodules and blood vessels. Eur Radiol 2013;23:3271–7. [DOI] [PubMed] [Google Scholar]
- [21].Wong KT, Antonio GE, Hui DS, et al. Thin-section CT of severe acute respiratory syndrome: evaluation of 73 patients exposed to or with the disease. Radiology 2003;228:395–400. [DOI] [PubMed] [Google Scholar]
- [22].Tsang OT, Chau TN, Choi KW, et al. Coronavirus-positive nasopharyngeal aspirate as predictor for severe acute respiratory syndrome mortality. Emerg Infect Dis 2003;9:1381–7. [DOI] [PMC free article] [PubMed] [Google Scholar]
- [23].Ahn S, Kim WY, Kim SH, et al. Role of procalcitonin and C-reactive protein in differentiation of mixed bacterial infection from 2009 H1N1 viral pneumonia. Influenza Other Respir Viruses 2011;5:398–403. [DOI] [PMC free article] [PubMed] [Google Scholar]
- [24].Zhou S, Wang Y, Zhu T, Xia L. CT features of coronavirus disease 2019 (COVID-19) pneumonia in 62 patients in Wuhan, China. Am J Roentgenol 2020;214:1287–94. [DOI] [PubMed] [Google Scholar]
- [25].Chen N, Zhou M, Dong X, et al. Epidemiological and clinical characteristics of 99 cases of 2019 novel coronavirus pneumonia in Wuhan, China: a descriptive study. Lancet 2020;395:507–13. [DOI] [PMC free article] [PubMed] [Google Scholar]


