

Abstract
Deubiquitinase (DUB) zinc finger RANBP2-type containing 1 (ZRANB1) has been reported to have a close relationship with cancers. However, its underlying role and molecular mechanisms in hepatocellular carcinoma (HCC) remain elusive. In this study, we demonstrated that ZRANB1 was highly expressed in HCC tissues. Additionally, ZRANB1 overexpression was correlated with poorer survival and ZRANB1 could be an independent predictor of poor prognosis for HCC patients. Through gain- and loss-of-function assays, we examined the oncogenic role of ZRANB1 in regulating HCC cell growth and metastasis in vitro and in vivo. To identify the downstream targets of ZRANB1 in regulating HCC tumorigenesis, we performed RNA-seq and demonstrated that Lysyl oxidase-like 2 (LOXL2) was the most significantly downregulated gene after ZRANB1 knockdown. Furthermore, the scatter plots indicated a significant positive correlation between ZRANB1 and LOXL2 expression in clinical HCC specimens. We also demonstrated that ZRANB1 knockdown downregulated the expression of LOXL2 and suppressed HCC growth and metastasis in vitro and in vivo. The effects of ZRANB1 knockdown were reversed by LOXL2 overexpression. More importantly, ZRANB1 regulated LOXL2 through specificity protein 1 (SP1) and SP1 overexpression rescued the suppression of HCC growth and metastasis induced by ZRANB1 knockdown. Mechanistically, ZRANB1 bound with SP1 directly and stabilized the SP1 protein by deubiquitinating it. The expression patterns of ZRANB1, SP1 and LOXL2 were evaluated in HCC patients. In summary, our research highlights a novel role of ZRANB1 in the tumorigenesis of HCC and suggests a new candidate prognostic biomarker for HCC treatment.
Keywords: ZRANB1, SP1, LOXL2, hepatocellular carcinoma, progression
Introduction
Hepatocellular carcinoma (HCC) is the second leading cause of cancer-related death worldwide and is currently one of the most heterogeneous and complex malignancies [1]. Although some clinicopathological factors are essential in influencing the treatment outcome of HCC, there are no effective therapeutic strategies for patients with advanced HCC [2,3]. With a 5-year survival rate of 14%-18%, the mortality of HCC is mostly due to its characteristics of proliferation, invasion and migration [4]. Therefore, further studies and identification of the molecular mechanism underlying HCC tumorigenesis may help us to identify potential targets for improving therapeutic effects on HCC.
Ubiquitination is one of the most versatile post-translational modifications, and it plays an essential role in protein degradation through the proteasome pathway or by direct sorting to the lysosome [5]. The regulation and reversibility of ubiquitination is accomplished through deubiquitinases (DUBs) [6]. In recent years, accumulated evidence has shown that dysregulation of multiple DUBs is closely related to the development of numerous carcinomas [7,8]. Deubiquitinase (DUB) ZRANB1 (zinc finger RANBP2-type containing 1) is a member of the A20 OTU (ovarian tumor proteases) family [9]. It has been reported that ZRANB1 can cleave K29-, K33-, and K63-linked ubiquitin chains [10]. Another study also demonstrated that ZRANB1 can deubiquitinate and stabilize EZH2 in breast cancer and provided therapeutic strategies for targeting the EZH2 deubiquitinase ZRANB1 [11]. Recently, a study reported that high phosphorylation levels of ZRANB1 can activate its deubiquitinase activity, which is highly correlated with poor prognosis in HCC patients [12]. These findings suggest that aberrant expression of ZRANB1 plays an oncogenic role in multiple carcinomas and may indicate novel therapeutic targets. However, the potential role of ZRANB1 in HCC and its underlying mechanisms in regulating HCC tumorigenesis remain elusive.
Here, we investigated the expression patterns of ZRANB1 in HCC samples and further explored the role of ZRANB1 in the proliferation, migration and invasion of HCC cells in vitro and in vivo. We found that ZRANB1 regulated HCC cell growth and metastasis through the SP1-LOXL2 axis. At the mechanistic level, we revealed that ZRANB1 can bind with SP1 directly and thus deubiquitinate and stabilize SP1, which contributes to LOXL2 overexpression and HCC tumorigenesis.
Materials and methods
Human specimens and cell culture
From June 2016 to April 2020, human HCC tissues and corresponding non-tumor tissues were obtained from 132 patients who underwent HCC resection at the Second Affiliated Hospital of Nanchang University. Fresh samples collected after resection were frozen immediately in liquid nitrogen and stored at -80°C for further study. Informed consent of the patients was obtained and the investigation was permitted by research ethics committee of the Second Affiliated Hospital of Nanchang University.
All HCC cell lines including Huh7, MHCC97H, HepG2, HCCLM3 and human normal hepatocyte cells lines HL-7702, THLE-3 were obtained from Cell Bank of Type Culture Collection of Chinese Academy of Sciences and the Shanghai Institute of Cell Biology in China. The cells were routinely cultured in Dulbecco’s modified Eagle’s Medium (Gibco) containing 10% fetal calf serum (FBS, HyClone, USA) at 37°C in a humidified incubator containing 5% CO2.
Quantitative real-time PCR (qrt-PCR) and western blot
Total RNA was extracted by the standard Trizol-based protocol (Invitrogen, USA). Complementary DNA (cDNA) was synthesized using the PrimeScript RT Reagent Kit (Invitrogen, USA) and qRT-PCR was performed using SYBR Premix Ex Taq (TaKaRa Bio, Shiga, Japan), according to the manufacturer’s instructions. Information about the gene-specific primers was in Supplementary Table 1.
Total protein extracts were prepared as described in [13]. Protein was extracted by RIPA buffer (Beyotime, Shanghai, China) containing protease and inhibitor mixes (Thermo Fisher Scientific, New York, USA) on ice. BCA Protein Assay kit (Thermo Scientific, Waltham, MA, USA) was used to analyze protein concentration. Before centrifugation for 10 mins, all protein extracts were boiled in the lysis buffer for 30 mins.
Then, equal amounts of proteins were separated by sodium dodecylsulfonate (SDS) polyacrylamide gel electrophoresis and transferred onto apolyvinylidene fluoride (PVDF) membrane by electroblotting (Millipore, Bedford, MA, USA). Then the proteins were incubated in primary antibodies. Primary antibodies including anti-ZRANB1 monoclonal antibody (code ab82132, Abcam, 1:1000 dilution,), anti-SP1 monoclonal antibody (code sc420, Santa Cruz, 1:1000 dilution), anti-LOXL2 monoclonal antibody (code ab96233, Abcam, 1:500 dilution) and anti-Tubulin monoclonal antibody (code ab7291, 1:2000 dilution, Abcam). After being incubated with the second antibody for 2 h at room temperature, the intensity of protein bands was analyzed by Quantity One software (Bio-Rad, Hercules, CA, USA).
Immunohistochemistry
Sections of 4-μm-thick paraffin-embedded human HCC tissues and normal adjacent tissues were deparaffinized. Sections were washed in water after antigen retrieval were performed in microwave-heated antigen unmasking solution (EDTA, pH 8.0) for 40 mins. Then, goat serum incubation for 30 mins. Afterwards, tissued sections were incubated by anti-ZRANB1 monoclonal antibodies (code ab262877, Abcam, 1:100 dilution), anti-SP1 monoclonal antibodies (code ab124804, Abcam, 1:200 dilution), anti-LOXL2 monoclonal antibodies (code ab96233, Abcam, 1:500 dilution) overnight at 4°C. Next, HRP-conjugated secondary antibody (Boster) was used to incubate sections for 2 h at room temperature. DAB Detection Kit (Maxim) was adopted for immunostaining for 2 mins. The proportion of positive areas was scored semi-quantitatively by 3 pathologists who were blind to the clinical parameters.
Stable cell lines and plasmids
For all figures, short hairpin RNA (shRNA) for stably knockdown ZRANB1 and LOXL2 refers to sense sequence: sh1-ZRANB1: 5’-AGCGTTGTCCAGAGTACACG-3’; sh2-ZRANB1: 5’-TGGCCTCCTTTTCACGCATA-3; sh-LOXL2: 5’-GAAACCCTCCAGTCTATTATA-3’. shRNAs were cloned into lentiviral pLKO.1 vector and were commercially obtained from GenePharma Biothch (Shanghai, China). Overexpression plasmids were obtained from Genechem (Shanghai, China). His-tagged ZRANB1, Flag-tagged SP1 and HA-tagged LOXL2 were constructed into p-cytomegalovirus vectors. Viral supernatants were collected and filtered after 48 h. Cells infected by lentivirus were selected using puromycin, following the manufacturer’s recommended protocol [14].
Cell proliferation assay
5-Ethynyl-20-deoxyuridine assay (EdU) and Real Time Cellular Analysis (RTCA) were described previously [15]. In EdU assay, cells were plated in 96-well plates (5×10³ cells per well) and cultured for 24 hours. Then 5-ethynyl-20-deoxyuridine (EdU; Ribobio) was used to culture cells for 2 hours, followed by three washes with PBS. After cells being incubated with 300 μL of 1xApollo reaction cocktail for 30 minutes, Hoechst 33342 (5 mg/mL) was used to stain the DNA contents of the cells in each well for 25 minutes and was imaged through a fluorescence microscope. In RTCA tests, the transfected cells (1×10⁵ cells per well) were plated and incubated in E-plate 16 for 35 hours and the data during the period was recorded by A Real-Time Cell Kinetic Analyzer xCELLigence RTCA (ACEA Biosciences) to monitor cell proliferation dynamics. Data recorded by the machine was analyzed by the RTCA software.
Cell colony formation assay
0.6×10³ cells were seeded in 6-well plates. Once the appropriate colony size had formed, cells were fixed with 4% paraformaldehyde for 30 mins, and then stained by 1.0% crystal violet for 30 mins until formed visible clones. The number of colonies was counted in 10 different fields.
The scratching assays
When HCC cells were grown to 80% to 90% confluence in 6-well plates, scraping apipette tip was used to scratch across the cells surface. After washing the detached cells with PBS, the cells were incubated over time to allow the cells to migrate into the scratching area. The cells movements during wound closure were measured by phase-contrast photography at 37°C for incubations of 0 and 36 hours, and three randomly selected wound areas were analyzed.
In vitro migration and invasion assays
Cell transwell migration and invasion assays were performed using a transwell system (Corning, NY, USA) with or without Matrigel matrix (BD bioscience) coated above the 8-μm pore polycarbonate membranes. Fresh medium containing 10% FBS was added in the lower chamber as a chemoattractant. For the migration assay, a total of 1×10⁵ cells were resuspended in serum-free medium and placed in the upper chambers; for invasion assays, a total of 1×10⁵ cells were seeded in a Matrigel-coated chamber (BD Biosciences). After 24 hours (to examine migration) or 48 hours (to examine invasion) of incubation, the non-migrated cells on the upper surface of the membrane were removed, and the cells on the lower surface were fixed with methanol and stained by 0.1% crystal violet. The cells in five random microscopic fields were counted and imaged using a light microscope with a DP70 CCD system (Olympus Corp).
Luciferase reporter assay
The luciferase experiment was carried out using LOXL2 firefly luciferase and transfection control renilla luciferase plasmids. Plasmids were forward-transfected into cells using lipofectamine 3000 and PLUS reagent (Thermo Fisher Scientific). Cells were stimulated 24 h post transfection and luciferase activities were evaluated using the Dual-Luciferase Reporter Assay System (Promega).
Co-immunoprecipitation experiment
Cell lysates were incubated with 50 µl of protein G beads (Thermo Scientific), and 1 µg of the indicated antibody overnight at 4°C. The protein G beads were collected by centrifugation. Loading buffer was added to the tube and heated for 15 mins at 100°C. Then the immunoprecipitated proteins were examined by SDS-PAGE and immunoblotting analysis. The intensity of protein bands was analyzed by Quantity One software (Bio-Rad, Hercules, CA, USA).
Animal experiments
For tumorigenicity assays, control and ZRANB1 stably knockdown or ZRANB1 stably overexpression luciferase-labelled HCC cells (2×10⁶ cells per mouse) were subcutaneously injected into the flanks of 8-week-old female BALB/c-nude mice (Hunan SJA Laboratory Animal Co., Ltd.). The size of tumors was measured every 5 days by caliper to examine tumor volume using the formula: V= [length/2] × [width2] [16]. Mice were killed 30 days after inoculating of tumor cells, and the tumor weights were measured (6 mice per group). For metastasis mouse model, a total of 1×10⁶ of control and ZRANB1 stably knockdown or ZRANB1 stably overexpression HCC cells expressing a luciferase reporter were injected into the tail vein of the nude mice (6 mice per group). Organs of mice were harvested after 7 weeks and metastatic nodes in lung sections were evaluated after HE staining. The in vivo imaging system (IVIS, PerkinElmer, USA) was used to monitor tumor progression in mice.
All animals were randomly divided into different groups by a technician under blinding condition. Animal experiments were approved by the Ethics Committee for Animal Experiments of the Second Affiliated Hospital of Nanchang University.
Statistical analysis
All results are shown as mean ± SD from at least three independent experiments. One-way ANOVA for multiple comparisons was used to compare EdU, colony-forming assays, the wound-healing assay, transwell migration and invasion assay, and normalized luciferase values. Student’s t-test was used to compare the mice tumor volume and other related comparisons. All the data were analyzed using GraphPad Prism 5 software and P<0.05 was considered significant.
Results
ZRANB1 expression is increased in human HCC tissues and HCC cells
To determine the expression levels of ZRANB1 in HCC tissues, we performed quantitative real-time PCR on 72 HCC specimens and their corresponding non-tumor tissues. Upregulation of ZRANB1 mRNA level was markedly observed in 55 of the 72 pairs (Figure 1A). Consistently, we detected the protein expression of ZRANB1 in these 72 pairs of HCC tissues and corresponding normal tissues. Quantitative analyses showed that ZRANB1 was significantly overexpressed in HCC tissues compared with non-tumor tissues (Figure 1B). Consistently, we analyzed the relationship between ZRANB1 expression and clinicopathological features in 72 HCC patients. The results showed that ZRANB1 overexpression was significantly correlated with advanced tumor size, TNM stage, vascular invasion and intrahepatic metastasis (Table 1). Furthermore, we performed immunohistochemical staining to examine ZRANB1 expression in 132 pairs of HCC tissues (including the 72 fresh HCC specimens) and found that ZRANB1 expression was markedly upregulated in HCC tissues compared with paired adjacent normal tissues (Figure 1C, 1D). Kaplan-Meier analyses of the overall survival (OS) rate revealed that the high ZRANB1 expression group (i.e., IHC staining with strong and moderate expression) had a worse prognosis than the low ZRANB1 group (i.e., IHC staining with weak and negative expression) (Figure 1E). Then, we explored ZRANB1 expression in HCC cell lines and two normal human hepatocyte lines (HL7702 and THLE-3). As expected, the expression level of ZRANB1 was significantly higher in HCC cell lines (Huh7, MHCC97H, HepG2, and HCCLM3) than that in HL7702 and THLE-3 cells at both the protein and mRNA levels (Figure 1F, 1G). Furthermore, univariate and multivariate logistic regression analyses indicated that ZRANB1 was an independent predictor of poor prognosis for patients with HCC (Table 2). Our results revealed that ZRANB1, which is overexpressed in HCC, might play an essential role in HCC tumorigenesis and prompted us to explore the precise function of ZRANB1 in HCC.
Figure 1.
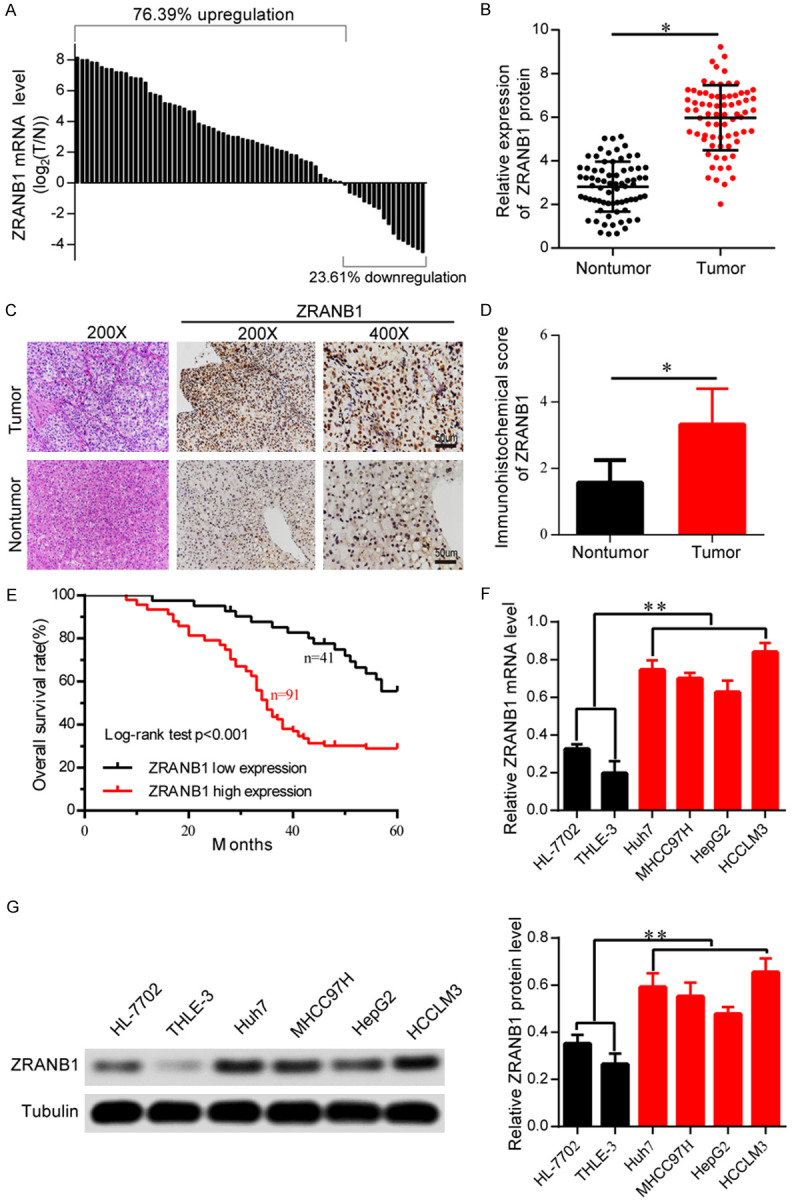
ZRANB1 expression is increased in human HCC tissues and HCC cells. A. Real-time PCR analysis of ZRANB1 mRNA level in 72 cases of HCC tissues and corresponding normal tissues. Left, a log 2 (T/N) value >0 indicates that ZRANB1 expression is overexpressed in the HCC samples; right, a log 2 (T/N) value <0 indicates that ZRANB1 expression is downregulated in the HCC samples. The ZRANB1 mRNA levels are normalized to the tubulin RNA levels. B. Determination and quantification of ZRANB1 protein levels in HCC tissues and paired non-tumor tissues by western blot (n=72; *P<0.05). C and D. Representative IHC staining of ZRANB1 in 132 HCC tissues (Scale bar 50 μm; *P<0.05). E. Kaplan-Meier curve of overall survival (OS) rate for ZRANB1 expression (**P<0.01). F. mRNA levels of ZRANB1 in four HCC cell lines Huh7, MHCC97H, HepG2, and HCCLM3 and two normal liver cell lines HL-7702 and THLE-3 (**P<0.01). G. Protein levels of ZRANB1 in four HCC cell lines and two normal liver cell lines.
Table 1.
Relationship between ZRANB1 expression and clinicopathological features in 72 HCC patients
| Parameters | Total case | ZARNB1 | P value | |
|---|---|---|---|---|
|
|
||||
| 72 | High expression | Low expression | ||
| Age (years) | 0.414 | |||
| <60 | 44 | 24 | 20 | |
| ≥60 | 28 | 18 | 10 | |
| Gender | 0.448 | |||
| Female | 22 | 12 | 10 | |
| Male | 50 | 32 | 18 | |
| Tumor size (cm) | 0.013* | |||
| <5 | 19 | 8 | 11 | |
| ≥5 | 53 | 39 | 14 | |
| Tumor nodule number | 0.207 | |||
| Single | 46 | 23 | 23 | |
| Multiple | 26 | 9 | 17 | |
| AFP (ng/ml) | 0.453 | |||
| <400 | 34 | 14 | 20 | |
| ≥400 | 38 | 19 | 19 | |
| Cirrhosis | 0.521 | |||
| Absence | 42 | 20 | 22 | |
| Presence | 30 | 12 | 18 | |
| Liver function | 0.513 | |||
| Child-Pugh A | 63 | 21 | 42 | |
| Child-pugh B | 9 | 4 | 5 | |
| Lobe | 0.086 | |||
| Right | 43 | 17 | 25 | |
| Left | 29 | 12 | 27 | |
| TNM | 0.023* | |||
| I/II | 21 | 7 | 14 | |
| III/IV | 51 | 32 | 19 | |
| Vascular invasion | 0.021* | |||
| Negative | 23 | 11 | 12 | |
| Positive | 49 | 37 | 12 | |
| Intrahepatic metastasis | 0.017* | |||
| Negative | 18 | 7 | 11 | |
| Positive | 54 | 38 | 16 | |
Abbreviations: AFP, α-fetoprotein; TNM, tumor-node-metastasis.
P<0.05.
Table 2.
Univariate and multivariate analyses of overall survival in HCC patients (Cox proportional hazards regression model)
| Parameters | Univariate analysis | Multivariate analysis | ||||
|---|---|---|---|---|---|---|
|
|
|
|||||
| HR | 95% CI | P value | HR | 95% CI | P value | |
| Age (≥60/<60) | 1.132 | 0.828-2.1 | 0.22 | - | - | - |
| Gender (Male/Female) | 0.867 | 0.561-1.453 | 0.29 | - | - | |
| Tumor nodule number (Single/Multiple) | 1.564 | 0.651-2.389 | 0.13 | - | - | - |
| AFP(ng/ml) (<400/≥400) | 1.12 | 0.816-1.231 | 0.87 | - | - | - |
| Cirrhosis (Absence/Presence) | 1.213 | 0.671-2.674 | 0.72 | - | - | - |
| Liver function (Child-Pugh A/Child-pugh B) | 1.209 | 0.514-2.017 | 0.54 | - | - | - |
| Lobe (Right/Left) | 0.898 | 0.706-1.010 | 0.19 | - | - | - |
| Tumor size (≥5/<5) | 1.462 | 0.936-2.490 | <0.01** | 1.247 | 0.804-2.662 | 0.01* |
| TNM (III, IV/I, II) | 1.515 | 1.657-3.569 | <0.01** | 1.616 | 1.049-2.952 | 0.02* |
| Vascular invasion (Positive/Negative) | 2.134 | 1.321-3.343 | <0.01** | 1.651 | 1.121-2.983 | 0.04* |
| Intrahepatic metastasis (Positive/Negative) | 2.018 | 1.528-3.067 | <0.01** | 1.539 | 1.335-2.704 | 0.02* |
| ZRANB1 expression (High/Low) | 2.018 | 1.391-3.881 | <0.01** | 1.85 | 1.556-2.624 | 0.03* |
Abbreviations: AFP, α-fetoprotein; TNM, tumor-node-metastasis.
P<0.05;
P<0.01.
ZRANB1 facilitates HCC cell proliferation and metastasis in vitro
To investigate how aberrant ZRANB1 levels affect HCC tumorigenesis, we inhibited ZRANB1 expression with shRNA (small hairpin RNA). Then, the ZRANB1 knockdown efficiency was confirmed by western blot and qRT-PCR analysis (Supplementary Figure 1A, 1B). To examine the proliferation ability of HCC cells transfected with control shRNA or shRNA targeting ZRANB1, we performed EdU and colony formation assays. The EdU assay results suggested that ZRANB1 knockdown markedly inhibited HCCLM3 cell and Huh7 cell growth (Figure 2A, 2B). Similarly, the colony formation assay results also showed that decreased ZRANB1 expression reduced the colony-forming capacity of HCC cells (Figure 2C, 2D). Furthermore, we investigated the proliferation ability of ZRANB1-overexpressing HCC cells. The results of both the EdU and colony formation assays suggested that ZRANB1 overexpression enhanced HCC cell growth (Supplementary Figure 2A, 2B).
Figure 2.

ZRANB1 facilitates HCC cell proliferation and metastasis in vitro. A and B. Proliferation capacity for HCC cells HCCLM3 and Huh7 treated with shZRANB1 or shNC was detected by EdU (*P<0.05; scale bar, 100 μm). C and D. Colonies formed by HCCLM3 and Huh7 cells transfected with control shRNA or shRNA targeting ZRANB1. The right panels are quantification of the results of the colony formation assay (**P<0.01). E and F. A total of 5×10⁴ HCC cells HCCLM3 and Huh7 treated with shNC or shZRANB1 were initially seeded in the upper layer of the chamber, and cell migration and invasion ability was evaluated by transwell migration and invasion assays separately. The lower panels are quantification of the results of the transwell migration and invasion assay (*P<0.05). G and H. Cell migration was examined using the wound healing assay. The right panels are quantification of the results of the wound healing assay (*P<0.05).
To further verify the impact of dysregulated ZRANB1 expression on HCC cell metastasis, we performed transwell migration and invasion assays and the scratching assay. The transwell migration and invasion assay results showed that ZRANB1 knockdown significantly suppressed HCCLM3 and Huh7 cell migration and invasion (Figure 2E, 2F). In addition, the scratching assay results suggested that ZRANB1 suppression can inhibit HCC cell migration (Figure 2G, 2H). Consistent with these results, ZRANB1 upregulation in HCCLM3 and Huh7 cells contributed to the opposite effects, as evaluated by transwell migration, invasion and the scratching assays (Supplementary Figure 2C, 2D). These results indicated that ZRANB1 can facilitate HCC cell proliferation, migration and invasion in vitro.
ZRANB1 drives HCC tumorigenesis in vivo
To further understand the biological effects of ZRANB1 on HCC tumorigenesis, we performed tumorigenicity assays and lung metastasis experiments in animal subjects. In the tumorigenicity assay, nude mice were injected subcutaneously with shNC or shZRANB1 HCCLM3 cells expressing a luciferase reporter. Using IVIS to monitor tumor growth in mice, imaging analysis showed that ZRANB1 stable knockdown decreased tumor growth significantly (Figure 3A). Tumor weights and volumes of the nude mice were recorded throughout the experimental period. Decreased ZRANB1 expression significantly inhibited HCC growth compared with that in the control group (Figure 3B, 3C). Additionally, the Ki-67 level was markedly decreased in tumors with ZRANB1 suppression, as assessed through immunofluorescence experiments (Figure 3D). In contrast, ZRANB1 upregulation promoted HCC progression in nude mice compared with that in the control group (Supplementary Figure 2E, 2F).
Figure 3.

ZRANB1 promotes HCC progression in vivo. A. Luciferase intensity of the nude mice injected with luciferase-expressing HCC cells transfected with shNC or shRNA targeting ZRANB1 was detected by IVIS, Representative images obtained are shown. B and C. Tumor weights and tumor sizes of HCCLM3-shNC or HCCLM3-shZRANB1 groups of nude mice were measured and corresponding tumor growth curves were obtained (means ± SEM; *P<0.05, **P<0.01). D. Immunofluorescence staining of the protein expression pattern of Ki67 in nude mice tumor masses (scale bar, 100 μm; Magnification: 200×). E. In vivo tumor metastasis was examined using the nude mice injected with luciferase-expressing HCCLM3 cells transfected with shNC or shRNA targeting ZRANB1 and was detected by IVIS from day 0 to day 45. Representative images obtained are shown. F. Representative H&E-stained sections of the lung tissues collected from shNC and shZRANB1 groups. (Magnification: 100×, 200×, 400×); G. Incidence of lung metastasis of each group (**P<0.01).
To further evaluate the contribution of ZRANB1 to HCC metastasis in vivo, we established a lung metastasis model via tail vein injection. Luciferase-labelled HCCLM3 cells transfected with shNC or shZRANB1 were injected into the tail vein of nude mice. Luciferase fluorescence intensity of the progressive HCC in nude mice was detected by IVIS. The results showed a striking reduction of the metastatic capacity of ZRANB1 knockdown HCCLM3 cells to the lung (Figure 3E). Additionally, H&E staining and the number of lymph node metastases results showed that the incidence of lung metastasis was significantly reduced in the ZRANB1 inhibition group compared with the control group (Figure 3F, 3G). Furthermore, we demonstrated that ZRANB1 upregulation promoted HCC lung metastasis (Supplementary Figure 2G). Collectively, these results showed that ZRANB1 can enhance HCC growth and metastasis in vivo.
LOXL2 expression is highly correlated with ZRANB1 in HCC
To obtain a more robust understanding of the mechanism by which ZRANB1 regulates HCC tumorigenesis, we performed RNA-seq on shNC and shZRANB1 HCCLM3 cells to identify the potential downstream targets of ZRANB1. Our data demonstrated that LOXL2 was the gene with the most marked decrease in expression after ZRANB1 suppression (Figure 4A). Consistent with this finding, we detected the expression level of LOXL2 in shNC and shZRANB1 HCCLM3 cells and found that LOXL2 expression was reduced at both the protein and mRNA levels after ZRANB1 inhibition (Figure 4B, 4C). In contrast, LOXL2 expression showed a significant increase in HepG2 cells with ZRANB1 upregulation (Figure 4D, 4E). Importantly, we detected the mRNA and protein levels of ZRANB1 and LOXL2 in 72 HCC samples, representative images of ZRANB1 and LOXL2 protein expression in HCC tissues and adjacent non-tumor tissues are shown in Figure 4F. Additionally, the scatter plots suggested that LOXL2 expression was significantly correlated with ZRANB1 expression at both the mRNA and protein levels (Figure 4G, 4H). These results revealed a significant relationship between ZRANB1 and LOXL2 in HCC.
Figure 4.
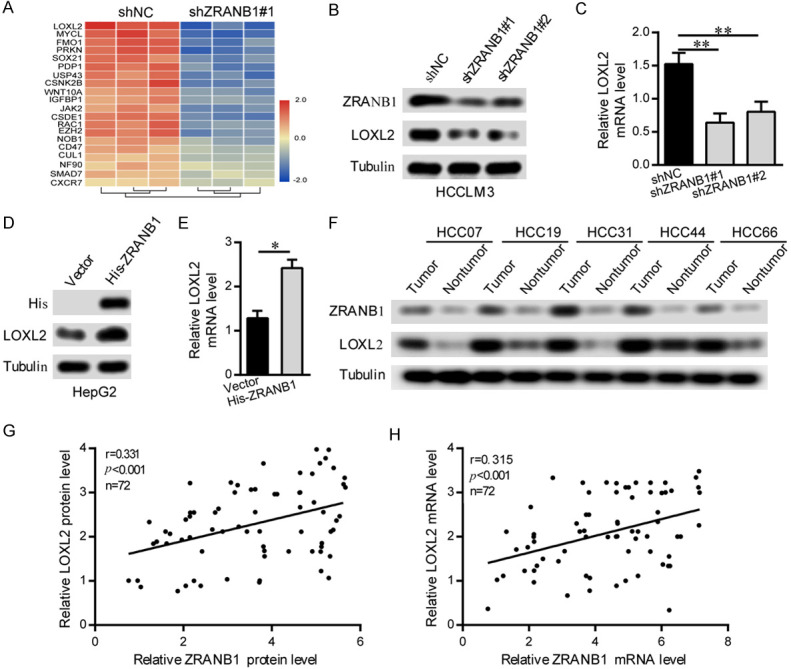
LOXL2 expression is highly correlated with ZRANB1 in HCC. A. RNA-seq listed the top 20 downregulated genes with ZRANB1 knockdown. B and C. Western blot and qRT-PCR analyses were used to detect ZRANB1 and LOXL2 mRNA and protein expression in HCCLM3 cells stably transfected with the control shRNA or the ZRANB1 shRNA (**P<0.01). D and E. Western blot and qRT-PCR analyses were used to detect ZRANB1 and LOXL2 mRNA and protein expression in HepG2 cells stably transfected with the vector or the His-ZRANB1 (*P<0.05). F. Representative images of western blot detecting ZRANB1 protein levels in HCC tissues and paired normal tissues. G. Scatter plots showed positive correlations between ZRANB1 and LOXL2 at the protein levels in 72 HCC tissues (r=0.331, **P<0.01). H. Scatter plots showed positive correlations between ZRANB1 and LOXL2 at the mRNA levels in 72 HCC tissues (r=0.315, **P<0.01).
LOXL2 is critical for ZRANB1-mediated HCC progression
Considering the correlation between ZRANB1 and LOXL2, we further investigated whether LOXL2 plays an essential role in ZRANB1-mediated HCC progression. After upregulating LOXL2 expression in ZRANB1 knockdown HCCLM3 cells, we assessed ZRANB1 and LOXL2 protein expression by western blot. Our results showed that although LOXL2 overexpression increased the LOXL2 protein level in HCCLM3 cells, ZRANB1 suppression markedly abated the increased LOXL2 (Figure 5A). We then performed EdU assay and transwell migration and invasion assays to explore the impact on HCC cell growth and metastasis. Similarly, LOXL2 upregulation significantly enhanced HCCLM3 cell proliferation, migration and invasion; however, ZRANB1 inhibition effectively decreased the enhanced proliferation and metastasis capacities of HCCLM3 cells caused by LOXL2 overexpression (Figure 5B, 5C). We further performed rescue experiments in vivo and assessed tumor growth, tumor weight and lung metastasis in nude mice. Consistent with the observations in vitro, our results showed that ZRANB1 knockdown also significantly suppressed the enhancement of tumor growth and HCC cells lung metastatic ability induced by LOXL2 upregulation (Figure 5D-F).
Figure 5.
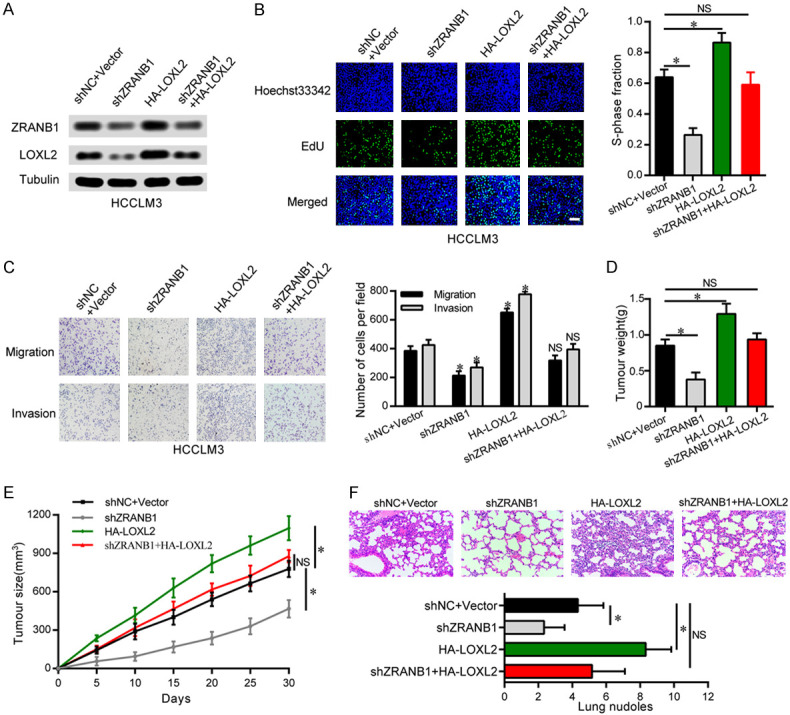
LOXL2 is essential for ZRANB1-mediated HCC cells progression in vitro and in vivo. A. Western blot was used to detect the expression of ZRANB1 and LOXL2 in HCCLM3 cells. The upregulation of LOXL2 attenuated the inhibition of ZRANB1 expression in HCCLM3-shZRANB1 cells. B. EdU assays showed that the upregulation of LOXL2 significantly rescued the cell proliferation in HCCLM3-shZRANB1 cells (*P<0.05; NS, not significant; scale bar, 100 μm). C. The downregulation of ZRANB1 significantly abated the cell migration and invasion in HepG2-HA-LOXL2 cells (*P<0.05; NS, not significant). D and E. Tumor weights and tumor sizes of 24 nude mice (6 mice per group) were measured and corresponding tumor growth curves were obtained in the rescue experiments (means ± SEM; *P<0.05). F. In vivo lung metastasis rescue experiment was examined in 24 nude mice (6 mice per group). Representative H&E staining of lungs are shown (magnification: 200×), along with the number of lung metastases in the four groups of nude mice (means ± SEM; *P<0.05).
In comparison, we also transfected LOXL2 shRNA into ZRANB1-overexpressing HepG2 cells and performed western blot and a series of functional assays. Consistent with the results of the previous experiments, ZRANB1 upregulation markedly reversed the decreased LOXL2 expression in LOXL2 knockdown HepG2 cells (Supplementary Figure 3A). Furthermore, the EdU and transwell assays results showed that LOXL2 suppression significantly inhibited the increased proliferation, migration and invasion capacities of HepG2 cell induced by ZRANB1 overexpression (Supplementary Figure 3B, 3C).
ZRANB1 promotes LOXL2-mediated HCC tumorigenesis through SP1
We next investigated how ZRANB1 regulates LOXL2 in HCC cells. Our co-IP results showed that ZRANB1 cannot interact with LOXL2 directly (Supplementary Figure 4A, 4B). A previous study showed that SP1 can bind to the LOXL2 promoter and regulate its expression directly in breast cancer [17]. In addition, it has reported that SP1 can be regulated by the deubiquitinase USP33 [18]. We thus hypothesized that ZRANB1 might regulate LOXL2 through SP1. We evaluated the protein expression of SP1 and LOXL2 in HepG2 cells transfected with shZRANB1 RNA or His-ZRANB1 overexpression plasmids and, as expected, found that the protein expression levels of SP1 and LOXL2 were significantly correlated with the ZRANB1 expression level (Figure 6A). Importantly, ZRANB1 knockdown decreased the transcriptional activity of the LOXL2 luciferase reporter, whereas upregulation of ZRANB1 showed the opposite effects (Figure 6B). However, neither up- nor downregulation of ZRANB1 had a significant effect on SP1 mRNA expression (Figure 6C). Furthermore, we performed rescue experiments to explore the relationships among ZRANB1, SP1 and LOXL2 in HCC cells. The western blot results showed that ZRANB1 downregulation decreased the upregulation of SP1 and LOXL2 in SP1-overexpressing HCCLM3 cells (Figure 6D). Moreover, the SP1 upregulation-induced enhancement of LOXL2 luciferase reporter transcriptional activity was alleviated by ZRANB1 knockdown (Figure 6E). Through RTCA and transwell migration and invasion assays, ZRANB1 knockdown was found to reverse the increases in the proliferation and metastasis capacities of HCCLM3 cells induced by SP1 overexpression (Figure 6F, 6G). Taken together, these results provide further support for functional associations among ZRANB1, SP1 and LOXL2 in HCC tumorigenesis.
Figure 6.

ZRANB1 promotes LOXL2-mediated HCC tumorigenesis through SP1. A. Western blot were used to detect ZRANB1, SP1 and LOXL2 protein expression in HCCLM3 cells stably transfected with the control shRNA+Vector or the ZRANB1 shRNA, His-ZRANB1 plasmid. B. LOXL2 promoter reporter luciferase assay using HepG2 cells transfected with shNC+Vector or the ZRANB1 shRNA, His-ZRANB1 plasmid. C. qRT-PCR analysis was used to detect SP1 mRNA expression in HepG2 cells stably transfected with the shNC+Vector or the ZRANB1 shRNA, His-ZRANB1 plasmid (NS, not significant). D. Western blot showed the levels of ZRANB1 knockdown and SP1 overexpression and their effects on LOXL2 in HCCLM3 cells. E. LOXL2 promoter reporter luciferase assay was performed in HCCLM3 cells transfected with the indicated plasmids (*P<0.05; NS, not significant). F. RTCA assays showed that the upregulation of SP1 significantly rescued the cell proliferation of HCCLM3-shZRANB1 cells (*P<0.05; NS, not significant). G. Transwell migration and invasion assays showed that the upregulation of SP1 significantly rescued the migration and invasion capability of HCCLM3-shZRANB1 cells (*P<0.05; NS, not significant).
ZRANB1 can deubiquitinate and stabilize SP1
Having confirmed the correlation between ZRANB1 and SP1, we aimed to explore the interaction of them. It has been reported that ZRANB1 can deubiquitinate EZH2 and significantly increase its stability in breast cancer [11]. Additionally, our results in Figure 6A and 6C show that ZRANB1 expression had a notable impact on SP1 expression only at the protein level. Moreover, another study reported that SP1 can be degraded through the ubiquitin-proteasome pathway and can be deubiquitinated by USP33 [18]. We thus hypothesized that ZRANB1 might deubiquitinate SP1 and stabilize it. As expected, the results of co-IP experiments showed that ZRANB1 can bind SP1 directly in HCCLM3 cells (Figure 7A). We also found that ZRANB1 can bind with SP1 directly in HCCLM3 cells cotransfected with His-ZRANB1 and Flag-SP1 (Figure 7B). To evaluate whether ZRANB1 can regulate SP1 degradation through the ubiquitin-proteasome pathway, we treated HepG2 cells transfected with ZRANB1 shRNA or His-ZRANB1 plasmids with or without 15 μM MG132. Our results showed that neither knockdown nor upregulation of ZRANB1 had a notable effect on the SP1 protein level in HepG2 cells treated with MG132 compared with those not treated with MG132 (Figure 7C). Furthermore, we used a 20 μM dose of the translation inhibitor cycloheximide (CHX), and at the indicated times, we detected the SP1 protein level in HepG2 cells transfected with ZRANB1 shRNA or His-ZRANB1 plasmids. Our data demonstrated that ZRANB1 overexpression significantly decreased the degradation rate of SP1, while decreased ZRANB1 levels had the opposite effect (Figure 7D, 7E).
Figure 7.

ZRANB1 can deubiquitinate and stabilize SP1. A. Co-IP between endogenous ZRANB1 and SP1 in HCCLM3 cells. ZRANB1 and SP1 were detected respectively in the immunoprecipitate when the anti-SP1 and anti-ZRANB1 antibodies were used as baits separately. B. A co-IP assay was performed in HCCLM3 cells to explore the interaction between exogenous ZRANB1 and SP1. C. HCCLM3 cells transfected with ZRANB1 shRNA or His-ZRANB1 were treated with MG132 (15 μM). Cells were collected at 12 h and immunoblotted with the antibodies indicated. D. HepG2 cells were transfected with His-ZRANB1 and ZRANB1 shRNA respectively, and treated with 20 μM cycloheximide (CHX). Cells were collected at different time points and immunoblotted with the antibodies indicated. E. Quantitative results of relative ZRANB1 protein levels were analyzed (*P<0.05). F. HCCLM3 and Huh7 cells were transfected with increasing amounts of His-ZRANB1 plasmid. The expression levels of the endogenous SP1 were detected by anti-SP1 antibody. G. HCCLM3 and Huh7 cells were left untreated or were transfected with a single dose of expression plasmid encoding Flag-SP1 with or without being combined with increasing amounts of His-ZRANB1 plasmid. The expression levels of SP1 were detected with anti-Flag antibody. H and I. The knockdown or exogenous expression of ZRANB1 altered the ubiquitination of SP1 in both HCCLM3 and Huh7 cells. The cells in each group were treated with MG132 (15 μM). The levels of ubiquitin-attached SP1 were detected by western blot analysis with Ub antibody.
Additionally, we further investigated the dose-dependent impact of ZRANB1 on SP1. Our data showed that a dose increase in the ectopic ZRANB1 level contributed to SP1 protein accumulation in HCC cells (Figure 7F). Next, an equal dose of Flag-SP1 and an enhancing dose of His-ZRANB1 were cotransfected into HCCLM3 and Huh7 cells, and a dose-dependent effect of ZRANB1 overexpression on SP1 protein levels was observed (Figure 7G). Finally, our results revealed that ZRANB1 suppression markedly increased the ubiquitination level of SP1, while ZRANB1 upregulation showed the opposite impact on SP1 (Figure 7H, 7I). Thus, our data indicated that ZRANB1 can act as a deubiquitinase of SP1 and stabilize it.
Clinical significance of ZRANB1, SP1 and LOXL2 in HCC tissue
To extend our findings to the clinical setting, we analyzed the expression patterns of ZRANB1, SP1 and LOXL2 in 72 paired human HCC specimens. Our results showed that ZRANB1, SP1 and LOXL2 were upregulated in HCC tissues, whereas in adjacent normal tissues, the opposite results were observed (Figure 8A). Notably, there was a marked correlation between ZRANB1 and SP1 protein expression but no significant correlation at the mRNA level (Figure 8B, 8C). For SP1 and LOXL2, significant correlations were observed at both the mRNA and protein levels (Figure 8D, 8E).
Figure 8.
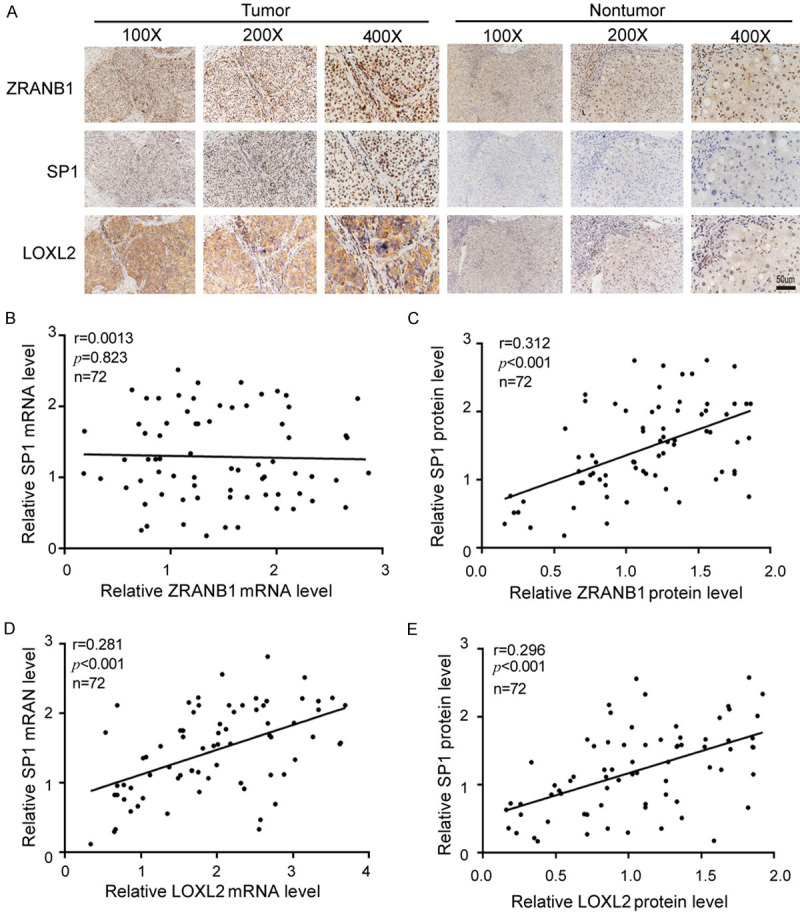
Clinical significance of ZRANB1, SP1 and LOXL2 in HCC tissue. A. Typical IHC staining of ZRANB1, SP1 and LOXL2 in HCC tissues. (Scale bar 50 μm). B and C. Expression correlation between ZRANB1 and SP1 on mRNA and protein level (r=0.0013, P=0.823; r=0.312, ***P<0.001; n=72). D and E. Expression correlation between SP1 and LOXL2 on mRNA and protein level (r=0.281, ***P<0.001; r=0.297, ***P<0.001; n=72).
In summary, our study highlights the novel role and molecular mechanism of ZRANB1 in HCC tumorigenesis. ZRANB1 promotes HCC tumorigenesis by directly deubiquitinating SP1 and stabilizing it via the SP1-LOXL2 axis (Figure 9). Our findings may provide a promising alternative therapeutic strategy for HCC.
Figure 9.
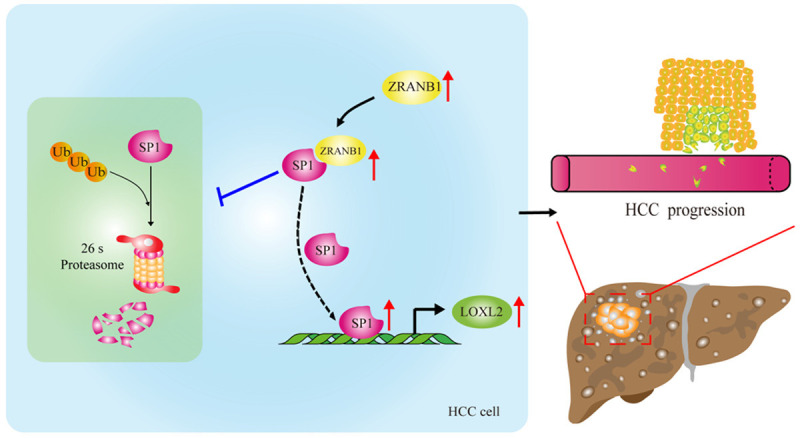
Schematic model of the SP1-LOXL2 axis driven by ZRANB1 in aggravating growth, invasion and migration of HCC cells. ZRANB1 can interact with SP1 directly and thus deubiquitinate and stabilize SP1, which contributes to LOXL2 upregulation and proliferation, invasion and migration of HCC cells.
Discussion
In our research, we provided a comprehensive investigation of the role and mechanism of ZRANB1 in regulating HCC tumorigenesis. Compared with other DUBs, such as USP7, BAP1 and Otubain1 [13,19,20], ZRANB1 has attracted little attention. Previous studies have shown that ZRANB1 positively regulates the WNT/CTNNB1 signaling pathway [10]. Recently, some studies have focused on the oncogenic role of ZRANB1 in promoting cancer progression [11,12,21]. However, the impact and mechanisms of ZRANB1 in HCC remain unclear. Our study is the first to report the mechanism by which ZRANB1 modulates HCC tumorigenesis. We revealed significant overexpression of ZRANB1 in HCC specimens and found that its expression was closely correlated with tumor size, TNM stage, vascular invasion and intrahepatic metastasis. Furthermore, we demonstrated that ZRANB1 facilitated HCC cell growth, migration and invasion in vitro and in vivo, identifying the oncogenic function of ZRANB1 in HCC tumorigenesis.
In our study, we first discovered that LOXL2 is a critical mediator of ZRANB1-induced HCC tumorigenesis. LOXL2 belongs to the lysyl oxidase gene family and has been shown to promote the development of multiple carcinomas [21-23]. As an essential oncogenic protein, LOXL2 can also modify histone tails and reduce cell polarity, which can enhance the capability for carcinoma metastasis [23]. Recent studies have shown that upregulation of LOXL2 promotes HCC cell progression and metastasis and that LOXL2-specific inhibitors can inhibit tumor growth [24]. In the present study, through RNA-seq, we identified LOXL2 as an essential downstream regulated target of ZRANB1 in HCC cell. To obtain a comprehensive understanding of the relationship between ZRANB1 and LOXL2, we analyzed clinical HCC samples and found that LOXL2 expression was significantly correlated with ZRANB1 expression in HCC. More importantly, through a series of gain- and loss-of-function experiments, we revealed that LOXL2 was critical for ZRANB1-mediated HCC proliferation and metastasis.
It has been shown that ZRANB1 is required for the deubiquitylation of EZH2 in breast cancer [11]. Considering the function of ZRANB1 in deubiquitylation, we hypothesized that ZRANB1 could bind with LOXL2 and deubiquitinate it directly. However, our results showed that there was no direct interaction between ZRANB1 and LOXL2. A previous study reported that SP1 can promote LOXL2 expression by binding to the LOXL2 promoter and thus enhance the metastasis of pancreatic ductal adenocarcinoma [17]. Additionally, our laboratory previously demonstrated that the deubiquitinase ubiquitin-specific protease 33 (USP33) can bind with SP1 directly and deubiquitinate SP1 to stabilize it [18]. Furthermore, the transcription factor specificity protein 1 (SP1) belongs to the SP transcription factor family and is highly regulated by post-translational modifications [25]. Contributing to the “hallmarks of cancers”, SP1 is overexpressed in a variety of cancers and is involved in numerous cellular functions, including proliferation, apoptosis and angiogenesis [26,27]. We thus assume that there exists an association between ZRANB1 and SP1. First, we suggested that SP1 was essential for ZRANB1-mediated LOXL2 expression and for HCC cell proliferation and metastasis. Next, given our data showing that ZRANB1 had a significant effect on SP1 protein expression only at the mRNA level, we assumed that ZRANB1 may interact with SP1 in protein level. We therefore performed co-IP and found direct binding between ZRANB1 and SP1. Then, we demonstrated that ZRANB1 can deubiquitinate SP1 and significantly increase its stability. Together, these results suggest a role for the ZRANB1-LOXL2 axis in regulating HCC tumorigenesis.
Furthermore, this is the first time that we identified that ZRANB1, SP1 and LOXL2 are simultaneously overexpressed in HCC samples. Additionally, we analyzed the relationships among ZRANB1, SP1 and LOXL2 and discovered that at the protein level, ZRANB1 expression is highly correlated with SP1 expression, whereas at the mRNA level, there is no significant correlation. SP1 and LOXL2 are markedly correlated with each other at both the mRNA and protein levels.
In summary, our study revealed the novel role and regulatory mechanism of ZRANB1 in HCC tumorigenesis. ZRANB1 targets the SP1-LOXL2 axis to enhance the growth, invasion and migration of HCC cells. Our findings provide strong evidence to highlight the potential role of ZRANB1 as a prognostic indicator and a therapeutic target in HCC.
Acknowledgements
This study was supported by grants from the Project of the Jiangxi Provincial Department of Science and Technology (No. 20171BAB215017) and grants from the Project of the Jiangxi Provincial Department of Education (No. GJJ200244).
Disclosure of conflict of interest
None.
Abbreviations
- HCC
hepatocellular carcinoma
- DUB
deubiquitinases
- ZRANB1
zinc finger RANBP2-type containing 1
- LOXL2
lysyl oxidase-like 2
- SP1
specificity protein 1
- FBS
foetal bovine serum
- cDNA
complementary DNA
- qRT-PCR
quantitative real-time PCR
- IHC
immunohistochemistry
- shRNA
short hairpin RNA
- EdU
5-Ethynyl-20-deoxyuridine assay
- RTCA
Real Time Cellular Analysis
- co-IP
co-immunoprecipitation
- CHX
cycloheximide
Supporting Information
References
- 1.Torre LA, Bray F, Siegel RL, Ferlay J, Lortet-Tieulent J, Jemal A. Global cancer statistics, 2012. CA Cancer J Clin. 2015;65:87–108. doi: 10.3322/caac.21262. [DOI] [PubMed] [Google Scholar]
- 2.Lencioni R, Chen XP, Dagher L, Venook AP. Treatment of intermediate/advanced hepatocellular carcinoma in the clinic: how can outcomes be improved? Oncologist. 2010;15(Suppl 4):42–52. doi: 10.1634/theoncologist.2010-S4-42. [DOI] [PubMed] [Google Scholar]
- 3.Zhu AX, Kang YK, Rosmorduc O, Evans TR, Santoro A, Ross P, Gane E, Vogel A, Jeffers M, Meinhardt G, Pena CE. Biomarker analyses of clinical outcomes in patients with advanced hepatocellular carcinoma treated with sorafenib with or without erlotinib in the SEARCH trial. Clin Cancer Res. 2016;22:4870–4879. doi: 10.1158/1078-0432.CCR-15-2883. [DOI] [PubMed] [Google Scholar]
- 4.Siegel RL, Miller KD, Jemal A. Cancer statistics, 2019. CA Cancer J Clin. 2019;69:7–34. doi: 10.3322/caac.21551. [DOI] [PubMed] [Google Scholar]
- 5.Sacco JJ, Coulson JM, Clague MJ, Urbe S. Emerging roles of deubiquitinases in cancer-associated pathways. IUBMB Life. 2010;62:140–157. doi: 10.1002/iub.300. [DOI] [PMC free article] [PubMed] [Google Scholar]
- 6.Mevissen T, Komander D. Mechanisms of deubiquitinase specificity and regulation. Annu Rev Biochem. 2017;86:159–192. doi: 10.1146/annurev-biochem-061516-044916. [DOI] [PubMed] [Google Scholar]
- 7.Zhou H, Liu Y, Zhu R, Ding F, Cao X, Lin D, Liu Z. OTUB1 promotes esophageal squamous cell carcinoma metastasis through modulating snail stability. Oncogene. 2018;37:3356–3368. doi: 10.1038/s41388-018-0224-1. [DOI] [PubMed] [Google Scholar]
- 8.Pan J, Deng Q, Jiang C, Wang X, Niu T, Li H, Chen T, Jin J, Pan W, Cai X, Yang X, Lu M, Xiao J, Wang P. USP37 directly deubiquitinates and stabilizes c-Myc in lung cancer. Oncogene. 2015;34:3957–3967. doi: 10.1038/onc.2014.327. [DOI] [PubMed] [Google Scholar]
- 9.Afonina IS, Beyaert R. Trabid epigenetically drives expression of IL-12 and IL-23. Nat Immunol. 2016;17:227–228. doi: 10.1038/ni.3388. [DOI] [PubMed] [Google Scholar]
- 10.Kristariyanto YA, Abdul RS, Campbell DG, Morrice NA, Johnson C, Toth R, Kulathu Y. K29-selective ubiquitin binding domain reveals structural basis of specificity and heterotypic nature of k29 polyubiquitin. Mol Cell. 2015;58:83–94. doi: 10.1016/j.molcel.2015.01.041. [DOI] [PMC free article] [PubMed] [Google Scholar]
- 11.Zhang P, Xiao Z, Wang S, Zhang M, Wei Y, Hang Q, Kim J, Yao F, Rodriguez-Aguayo C, Ton BN, Lee M, Wang Y, Zhou Z, Zeng L, Hu X, Lawhon SE, Siverly AN, Su X, Li J, Xie X, Cheng X, Liu LC, Chang HW, Chiang SF, Lopez-Berestein G, Sood AK, Chen J, You MJ, Sun SC, Liang H, Huang Y, Yang X, Sun D, Sun Y, Hung MC, Ma L. ZRANB1 is an EZH2 deubiquitinase and a potential therapeutic target in breast cancer. Cell Rep. 2018;23:823–837. doi: 10.1016/j.celrep.2018.03.078. [DOI] [PMC free article] [PubMed] [Google Scholar]
- 12.Feng X, Jia Y, Zhang Y, Ma F, Zhu Y, Hong X, Zhou Q, He R, Zhang H, Jin J, Piao D, Huang H, Li Q, Qiu X, Zhang Z. Ubiquitination of UVRAG by SMURF1 promotes autophagosome maturation and inhibits hepatocellular carcinoma growth. Autophagy. 2019;15:1130–1149. doi: 10.1080/15548627.2019.1570063. [DOI] [PMC free article] [PubMed] [Google Scholar]
- 13.Xie P, Wang H, Xie J, Huang Z, Chen S, Cheng X, Zhang X, Liu F, Li Y, Huang D. USP7 promotes proliferation of papillary thyroid carcinoma cells through TBX3-mediated p57(KIP2) repression. Mol Cell Endocrinol. 2020;518:111037. doi: 10.1016/j.mce.2020.111037. [DOI] [PubMed] [Google Scholar]
- 14.Liu XY, Jiang W, Ma D, Ge LP, Yang YS, Gou ZC, Xu XE, Shao ZM, Jiang YZ. SYTL4 downregulates microtubule stability and confers paclitaxel resistance in triple-negative breast cancer. Theranostics. 2020;10:10940–10956. doi: 10.7150/thno.45207. [DOI] [PMC free article] [PubMed] [Google Scholar]
- 15.Zhangyuan G, Wang F, Zhang H, Jiang R, Tao X, Yu D, Jin K, Yu W, Liu Y, Yin Y, Shen J, Xu Q, Zhang W, Sun B. VersicanV1 promotes proliferation and metastasis of hepatocellular carcinoma through the activation of EGFR-PI3K-AKT pathway. Oncogene. 2020;39:1213–1230. doi: 10.1038/s41388-019-1052-7. [DOI] [PubMed] [Google Scholar]
- 16.Guntuku L, Gangasani JK, Thummuri D, Borkar RM, Manavathi B, Ragampeta S, Vaidya JR, Sistla R, Vegi N. IITZ-01, a novel potent lysosomotropic autophagy inhibitor, has single-agent antitumor efficacy in triple-negative breast cancer in vitro and in vivo. Oncogene. 2019;38:581–595. doi: 10.1038/s41388-018-0446-2. [DOI] [PubMed] [Google Scholar]
- 17.Kim IK, Lee YS, Kim HS, Dong SM, Park JS, Yoon DS. Specific protein 1(SP1) regulates the epithelial-mesenchymal transition via lysyl oxidase-like 2(LOXL2) in pancreatic ductal adenocarcinoma. Sci Rep. 2019;9:5933. doi: 10.1038/s41598-019-42501-6. [DOI] [PMC free article] [PubMed] [Google Scholar]
- 18.Gan Q, Shao J, Cao Y, Lei J, Xie P, Ge J, Hu G. USP33 regulates c-Met expression by deubiquitinating SP1 to facilitate metastasis in hepatocellular carcinoma. Life Sci. 2020;261:118316. doi: 10.1016/j.lfs.2020.118316. [DOI] [PubMed] [Google Scholar]
- 19.Qin J, Zhou Z, Chen W, Wang C, Zhang H, Ge G, Shao M, You D, Fan Z, Xia H, Liu R, Chen C. BAP1 promotes breast cancer cell proliferation and metastasis by deubiquitinating KLF5. Nat Commun. 2015;6:8471. doi: 10.1038/ncomms9471. [DOI] [PMC free article] [PubMed] [Google Scholar]
- 20.Saldana M, VanderVorst K, Berg AL, Lee H, Carraway KL. Otubain 1: a non-canonical deubiquitinase with an emerging role in cancer. Endocr Relat Cancer. 2019;26:R1–R14. doi: 10.1530/ERC-18-0264. [DOI] [PMC free article] [PubMed] [Google Scholar]
- 21.Wu L, Zhu Y. The function and mechanisms of action of LOXL2 in cancer (review) Int J Mol Med. 2015;36:1200–1204. doi: 10.3892/ijmm.2015.2337. [DOI] [PubMed] [Google Scholar]
- 22.Jourdan-Le SC, Tronecker H, Bogic L, Bryant-Greenwood GD, Boyd CD, Csiszar K. The LOXL2 gene encodes a new lysyl oxidase-like protein and is expressed at high levels in reproductive tissues. J Biol Chem. 1999;274:12939–12944. doi: 10.1074/jbc.274.18.12939. [DOI] [PubMed] [Google Scholar]
- 23.Cuevas EP, Eraso P, Mazon MJ, Santos V, Moreno-Bueno G, Cano A, Portillo F. LOXL2 drives epithelial-mesenchymal transition via activation of IRE1-XBP1 signalling pathway. Sci Rep. 2017;7:44988. doi: 10.1038/srep44988. [DOI] [PMC free article] [PubMed] [Google Scholar]
- 24.Choi J, Chung T, Rhee H, Kim YJ, Jeon Y, Yoo JE, Noh S, Han DH, Park YN. Increased expression of the matrix-modifying enzyme lysyl oxidase-like 2 in aggressive hepatocellular carcinoma with poor prognosis. Gut Liver. 2019;13:83–92. doi: 10.5009/gnl17569. [DOI] [PMC free article] [PubMed] [Google Scholar]
- 25.Dynan WS, Tjian R. The promoter-specific transcription factor Sp1 binds to upstream sequences in the SV40 early promoter. Cell. 1983;35:79–87. doi: 10.1016/0092-8674(83)90210-6. [DOI] [PubMed] [Google Scholar]
- 26.Liao Y, Wang C, Yang Z, Liu W, Yuan Y, Li K, Zhang Y, Wang Y, Shi Y, Qiu Y, Zuo D, He W, Qiu J, Guan X, Yuan Y, Li B. Dysregulated Sp1/miR-130b-3p/HOXA5 axis contributes to tumor angiogenesis and progression of hepatocellular carcinoma. Theranostics. 2020;10:5209–5224. doi: 10.7150/thno.43640. [DOI] [PMC free article] [PubMed] [Google Scholar]
- 27.Beishline K, Azizkhan-Clifford J. Sp1 and the ‘hallmarks of cancer’. FEBS J. 2015;282:224–258. doi: 10.1111/febs.13148. [DOI] [PubMed] [Google Scholar]
Associated Data
This section collects any data citations, data availability statements, or supplementary materials included in this article.