

Abstract
The neurochemical information provided by proton magnetic resonance spectroscopy (MRS) or MR spectroscopic imaging (MRSI) can be severely compromised if strong signals originating from brain water and extracranial lipids are not properly suppressed. The authors of this paper present an overview of advanced water/lipid suppression techniques and describe their advantages and disadvantages. Moreover, they provide recommendations for choosing the most appropriate techniques for proper use. Methods of water signal handling are primarily focused on the VAPOR technique and on MRS without water suppression (metabolite cycling). The section on lipid suppression methods in MRSI is divided into three parts. First, lipid suppression techniques that can be implemented on most clinical MR scanners (volume pre-selection, outer-volume suppression, selective lipid suppression) are described. Second, lipid suppression techniques utilizing the combination of k-space filtering, high spatial resolutions, and lipid regularization are presented. Finally, three promising new lipid suppression techniques, which require special hardware (a multi-channel transmit system for dynamic B1+ shimming, a dedicated second-order gradient system or an outer volume crusher coil) are introduced.
Keywords: VAPOR, metabolite cycling, inversion recovery, high spatial resolution, L-regularization, dynamic B1 shimming, ECLIPSE, crusher coils
1. Introduction
Two consensus papers have been published recently1,2. The first paper by Oz et al.1 deals with relevant clinical applications of MRS and MRSI in neurological disorders. The second paper by Wilson et al.2 is focused on MRS and MRSI methodology and provides recommendations for choosing optimal sequences and parameters for improved performance in order to maximize the neurochemical information content. These recommendations were mostly aimed at spectroscopy users who are limited by broadly available standard techniques on clinical 3T MR scanners. A strong message from the methodology consensus paper was that the performance of these techniques can be significantly improved by implementing advanced methods already available in several academic research institutions specializing in MRS.
The present paper is one part of a Special Issue in NMR in Biomedicine dedicated to advanced methods in MRS and MRSI and is exclusively focused on water and subcutaneous lipid suppression techniques designed for human brain proton MR spectroscopy. The goal of this paper is to make recommendations for choosing and implementing the advanced water/lipid suppression techniques currently available. In addition, this paper also includes basic information about some new techniques that require specific hardware but have already shown great potential for further applications.
1.1. Origin of water and lipid signals in brain proton spectra
The most prominent signal in a proton MR spectrum of healthy brain is the signal of water that resonates at ~4.68 ppm in vivo. Since water is the major component of all brain tissues (70% - 85%), a very strong water signal (if not suppressed) is present in all spectra acquired from any brain region.
In general, lipid resonances are not MR detectable in healthy brain tissue. These MR signals, originating from membrane phospholipids, are affected by line-broadening mechanisms typical of solid-state NMR (chemical shift anisotropy, dipolar coupling), making these signals extremely broad and consequently not detectable by standard in vivo MRS techniques. It is worth mentioning that broad signals underlying resonances of low molecular weight metabolites in short TE spectra, i.e. signals of macromolecules with very short T2 relaxation times (~30 ms), mainly arise from the protons of amino acids within cytosolic proteins, not mobile lipids3.
However, mobile lipids, which are detectable by MRS, may accumulate in the brain due to pathophysiological processes. Indeed, signals of mobile lipids can be observed in MRS spectra acquired from some elderly subjects4 or patients with different brain diseases, including brain tumors5,6, neurodegeneration7, or inflammatory and ischemic diseases8,9. A proper characterization and quantification of these lipid signals may be of diagnostic interest and should then not be affected by lipid suppression techniques. Here, we will mostly focus on the artifactual lipid signals originating from regions outside of the brain, such as subcutaneous fat, which may contaminate brain spectra. These extracranial signals originate predominantly from triglyceride acyl groups, with major resonances of –CH2– and CH3– groups at 1.3 and 0.9 ppm, respectively. However, lipids (in particular with unsaturated fatty acyl groups) give rise to multiple further resonances between 2.0 and 5.5 ppm, possibly overlapping the metabolite signals of interest in this frequency range (see Figure S1 in Supporting Information for a 1H NMR spectrum of a triglyceride containing an unsaturated fatty acyl chain).
Brain water and subcutaneous lipids signals are several orders of magnitude larger than those of MRS-detectable metabolites. The amplitude of these signals, in addition to their spectral position proximal to the metabolites of interest, leads to spectral baseline distortions. By the spectral baseline we understand the curve consisting of smoothly varying signal components underlying all resonances originating from the volume of interest (VOI).10 In addition, satellites of the water signal originating from gradient coil vibrations overlap the spectral region of interest. Finally yet importantly, the shape of the point spread function enables subcutaneous lipid signal leakage into brain MRSI data. Unless these strong resonances are substantially minimized or eliminated (suppressed), they interfere with detection and reliable quantification of brain metabolites.
2. Water suppression
A variety of water suppression (WS) techniques has been developed for 1H NMR spectroscopy aimed at studying 3D structures of proteins in aqueous solutions11. This includes pre-saturation, single inversion recovery (IR), use of binomial composite semi-selective pulses12 and WATERGATE (WATER suppression by GrAdient-Tailored Excitation)13. These methods work successfully for 2D and 3D 1H NMR spectroscopy of proteins dissolved in non-deuterated aqueous solutions measured in sample tubes, but their application for in vivo 1H MRS is complicated for several reasons. First, the limited peak B1+ available on human MR scanners affects the performance of conventional frequency semi-selective composite pulse trains used for avoiding water signal excitation/refocusing. Thus off-resonance effects associated with the limited B1+ must be included in their construction14. Since these pulse trains cannot be used simultaneously for slice selection and water suppression, their use in single voxel localized sequences will prolong the minimum echo time. Second, a deuterium lock, a key factor for maintenance of precise frequency stability in high-resolution NMR spectroscopy of liquids, cannot be used in vivo, making the elimination of unwanted coherences (e.g. utilizing pulse sequence phase cycling) much less efficient. Therefore, these types of WS techniques are generally not found suitable for in vivo single-voxel MRS. However, binomial semi-selective refocusing pulses have been successfully used in combination with other WS techniques in MRSI14,15.
The most critical factor affecting the WS efficiency under in vivo conditions is the spatial B0 and B1+ inhomogeneity and large variations between T1 relaxation times of water in different brain compartments (1.2 – 4.4 s at 7 T)16. Furthermore, the efficiency of WS is challenged by frequency and phase fluctuations induced by physiological motion. Here, WS efficiency is defined as the ratio of the residual water peak relative to the amplitude of the unsuppressed water signal in a reference acquisition acquired with otherwise identical acquisition parameters 10. Ideally, the height of the residual water signal in MRS/MRSI data should be comparable or smaller relative to the tallest metabolite peak in the water-suppressed spectrum.
A number of WS techniques have been developed over the years starting at an early stage of 1H MRS17-22. A typical WS building block consists of a CHemical Shift Selective (CHESS) RF pulse followed by a crusher gradient20. First applications used three identical CHESS pulses separated by the same time delay19. The efficiency of this three-pulse WS technique has been improved by varying the flip angles of these RF pulses18. Furthermore, the sensitivity of WS efficiency to B1 and T1 variations was substantially decreased by using four consecutive WS pulses with numerically optimized flip angles as described in a technique called Water suppression Enhanced through T1 effects (WET)22.
The recently published consensus paper on MRS methodology2 recommends the VAriable Power and Optimized Relaxations delays (VAPOR) WS method for advanced MRS23-25. As VAPOR was specifically optimized to address the most common complications of in vivo water suppression, B1+ inhomogeneity and T1 variations, we chose this technique to be explained in more detail in the following section. In addition, VAPOR parameters optimized for 3 T are also included. Finally, the last section of water signal handling techniques is dedicated to 1H MRS without WS.
2.1. VAPOR water suppression
The original version of VAPOR water suppression24 was developed specifically for high-performance 1H MRS of rodent brain at 9.4 T where transmit/receive surface RF coils are commonly used. The primary goal was to design a WS technique that would be as insensitive as possible to the inhomogeneous transmit B1+ field of a typical surface RF coil. In addition, the timing between frequency-selective RF pulses was chosen in a way that enabled outer-volume suppression (OVS) blocks to be interleaved with the WS pulse train. The optimization process took into account relative flip angles of WS pulses, inter-pulse delays, and a large range of water T1 in different brain compartments (tissue, cerebrospinal fluid). The relative flip angles and inter-pulse time delays of the original VAPOR scheme 24 are:
Relative flip angles: α – α – 1.78α – α – 1.78α – α – 1.78α
Inter-pulse delays (in ms): 150 – 80 – 160 – 80 – 100 – 30 – 26
where α is the nominal flip angle. Large differences in relative flip angles (factor of 1.78 corresponding to 5 dB in B1+) and optimized timing decrease the sensitivity on B1+ and guarantee that Mz magnetizations corresponding to coherence pathways experiencing different B1+ cross zero at the same time24.
2.1.1. VAPOR water suppression for 7 T
The timing and relative flip angles of the original VAPOR WS pulse train were slightly redesigned for applications on human 4T and 7T systems23,25 for two reasons. First, there was not enough time for OVS blocks that become longer due to limited peak B1+ on human MR scanners. Second, the duration of WS pulses was lengthened in order to keep the desired frequency selectivity. In addition, an 8th WS pulse was included into the VAPOR pulse train designed for 1H MRS in human brain. The 7T VAPOR scheme 23,25, shown in Figure 1A, uses these parameters:
Figure 1.

(A) VAPOR pulse sequence scheme with 4 interleaved OVS blocks. Relative flip angles of WS pulses: α – α – 1.78α – α – 1.59α – α – 1.78α – 1.78α, inter-pulse delays (in ms): 150 – 100 – 122 – 105 – 102 – 61 – 67 – 14 (delay between last VAPOR pulse and the first pulse of the localization sequence). (B,C) 1H MR spectra acquired by sLASER (TE = 28 ms, TR = 9 s, VOI = 9 mL, NA = 64) and STEAM (TE = 6 ms, TR = 5 s, NA = 128, VOI = 8 mL) localization methods combined with VAPOR water suppression using volume and half-volume RF coil, respectively. (D) Simulated dependence of the residual water signal on nominal flip angle α of VAPOR pulse train assuming T1 = 1500 ms. Data simulated for VAPOR WS method optimized for 9.4T animal MR scanner24 and for 7T human MR scanner23,25. In addition, the curve of the residual water simulated for 3 x CHESS pulse WS using inter-pulse delays (in ms) 50 – 50 – 20 was added for comparison. Inset: zoomed-in residual water signal dependence on nominal flip angle. (E) Simulated dependence of the residual water signal on nominal flip angle at 7T for tissues with different T1 relaxation times of water (CSF 4425 ms, WM 1220 ms, cortical GM 2132 ms, putamen 1700 ms)16. (F) Simulated dependence of the residual water signal on nominal flip angle for an average tissue T1 of 1500 ms at 7T for different inter-pulse delay between 7th and 8th WS pulse.
Panel A modified with permission from Tkac et al.23 © 2010 Springer Nature 2005.
Relative flip angles: α – α – 1.78α – α – 1.59α – α – 1.78α – 1.78α
Inter-pulse delays (in ms): 150 – 100 – 122 – 105 – 102 – 61 – 67 – 14
Flip angle scaling factors 1.59 and 1.78 correspond to 4 dB and 5 dB in B1+, respectively. This WS scheme has the capability to reduce the residual water signal well below the intensity of major brain metabolites, which is demonstrated by 7T 1H MR spectra acquired by a VAPOR – semi-adiabatic Localization by Adiabatic SElective Refocusing (sLASER) sequence26 from the motor cortex (Fig. 1B) and by a VAPOR – STEAM sequence from the occipital lobe (Fig. 1C). The STEAM sequence offers the option of applying an additional WS pulse during the TM period. This additional TM CHESS pulse increases the WS robustness but also introduces some T1 weighting while also making the sequence a little bit more sensitive to motion. Therefore, the TM duration with such a CHESS pulse should be kept as short as possible. The eight RF pulse VAPOR adds only a small fraction to the power deposition, which is dominated by VOI localization and OVS pulses. For the sLASER sequence with OVS at 7T27, VAPOR contributes only by 0.27 W in comparison with 40.0 W of sLASER and 40.1 W of OVS. This also applies for the STEAM sequence combined with four OVS blocks23,25 (as shown in Figure 1A). VAPOR contributes 0.27 W (as mentioned before), while OVS adds 73.1 W and STEAM 5.2 W.
Figure 1D shows that both versions of VAPOR (designed for animal and human MR scanners) show exceptional WS efficiency over a wide range of nominal flip angles. This makes the VAPOR technique well suited for 1H MRS under conditions with large spatial inhomogeneities in transmit B1+, which that are typical for surface RF coils or human applications at high magnetic fields. This insensitivity to B1+ substantially simplifies and speeds up VAPOR power calibration. A single power calibration on a localized signal from the VOI should be sufficient for the localization sequence as well as for VAPOR WS. Another important feature of a robust WS technique is that the slope of the residual water signal dependence on nominal flip angle, i.e. the derivative d(Mz/M0)/dα is close to zero when the residual magnetization Mz/M0 = 0. This makes the WS technique insensitive to B1+ changes or variations. The dependence of the residual water signal using three CHESS pulses of the same flip angle is shown for comparison to demonstrate this feature (Fig. 1D, inset). The inset clearly shows that the slope of 3 x CHESS zero Mz line is steep (∣d(Mz/M0)/dα∣ >> 0), which makes the WS extremely sensitive to any minor variation in B1+ (<0.1%).
The VAPOR technique is also optimized to maximize the WS efficiency over a wide range of water T1 relaxation times that are typical for animal and human brains. Figure 1E shows the Bloch equation simulation of the residual water signal for a nominal flip angle at 7 T from four different brain compartments. The simulation was performed for white matter (WM) T1 = 1220 ms, cortical gray matter (GM) T1 = 2132 ms, putamen T1 = 1700 ms and cerebrospinal fluid (CSF) T1 = 4425 ms using relaxation parameters for 7 T from Rooney et al.16. It is worth mentioning that residual signals of tissue and CSF water may have opposite amplitudes due to large differences between T1 relaxation times. However, these signals cannot cancel each other if not sufficiently suppressed because resonance frequencies and linewidths of these signals are not identical. The resonance frequency of water protons in CSF is typically shifted slightly upfield due to differences in magnetic susceptibility28,29. The VAPOR technique is capable of suppressing the water signal below 3% over a wide range of nominal flip angles from 50 to 160 deg (Figure 1D,E). While such WS efficiency fails to meet the typical WS requirements in the VOI (<0.05%), it helps to suppress spurious echoes due to water signals from distant regions where the B1+ could be substantially different from that inside the VOI.
As the residual water signal dependence on the nominal flip angle is flat around the optimal setting, superior WS without performing a fine VAPOR power calibration should be feasible. VAPOR power setting based on just one VOI-based B1+ calibration, which is recommended for advanced single-voxel MRS27, should be sufficient for all RF pulses of the sequence, including VAPOR. However, before the sequence is used routinely on a specific MR scanner, it is highly recommended to verify that the power automatically set for VAPOR pulses agrees with the power measured experimentally. This test is important due to the large difference in power requirements between RF pulses used for localization versus WS, and performance of the RF transmit system may slightly deviate from the theoretical response (non-linearity or slope). Therefore, it is recommended to run a VAPOR power calibration over a wide range of B1+ (as in Fig. 1E) and verify that the calculated power (i.e. pre-set nominal flip angle) agrees with the requested power (nominal flip angle) in the center of the flat region around 85 deg (Fig. 1 E,F). Any disagreement between these two values can be easily fixed by use of an appropriate correction factor for automatic VAPOR power setting or by requesting a slightly different value for the VAPOR nominal angle in order to get the correct value experimentally. This calibration can be performed using a phantom with a T1 value of water typical for brain and with similar RF coil loading as a human head. The size of the VOI should be comparable to the size typical for common MRS applications on a particular MR scanner. Because the calibration depends on both hardware performance (RF power amplifier) and also software (how the RF power is calculated for pulses of a different shape and duration), it should be independent of brain regions and RF coils used. Changing the inter-pulse delay between the 7th and 8th VAPOR pulse is more appropriate for a fine VAPOR calibration if necessary. Changes of this delay in a narrow range close to a default value of 67 ms moves the residual water curve up or down without changing its pattern, as shown in Figure 1F.
The frequency selectivity of the VAPOR pulse train is an important parameter for characterizing the performance of this WS technique. The suppression bandwidth should be wide enough to cover frequency variations of the water resonance caused by spatial B0 field inhomogeneity (including the volume outside of the VOI). At the same time, this suppression bandwidth should not be so wide as to suppress resonances of important brain metabolites, such as creatine (3.91 ppm), phosphocreatine (3.93 ppm) or phosphoethanolamine (3.98 ppm). In addition, the suppression bandwidth (expressed in Hz) has to be scaled with the B0 field strength due to chemical shift dispersion. The overall frequency selectivity should be evaluated using the residual longitudinal magnetization Mz (not the excitation bandwidth characterized by Mxy). It should be noted that the overall frequency selectivity of the VAPOR technique is quite different from that of a single WS pulse (Fig. 2), depending not only on the RF pulse shapes and durations but also on the number of pulses in the WS scheme, their flip angles, inter-pulse delays, and on T1 relaxation times of water. Using RF pulses with flatter excitation profiles instead of Gaussian pulses is recommended for the VAPOR technique, as this decreases the sensitivity of WS to frequency offsets of the VAPOR frequency-selective RF pulses. The same asymmetric amplitude-modulated RF pulse (P10), which was used in the 1-ms TE STEAM sequence, was also used in the original VAPOR scheme designed for an 9.4 T animal scanner24. The VAPOR pulse train optimized for a human 7T scanner used a truncated (3-lobe) P10 RF pulse in order to retain the required frequency selectivity, despite the limited pulse duration23,25. The Mz profile of a single, truncated 25-ms P10 RF pulse (P10tr, dashed line) and the overall frequency selectivity of the VAPOR WS pulse train simulated for water in different brain compartments (GM, WM, CSF) are shown in Figure 2 A,B. The frequency selectivity at 50% of Mz is ±0.32 ppm, with suppression <5% outside of the ±0.37 ppm region. This selectivity guarantees that signals of myo-inositol (4.05 ppm), lactate (4.10 ppm) and, if necessary, the signal of glucose (5.23 ppm H1-α) can be detected without saturation. The flat Mz profile (±50 Hz from the VOI water resonance frequency) increases the WS efficiency outside of the VOI, where the water resonance frequency may significantly deviate from the VOI water on-resonance condition.
Figure 2.

Frequency selectivity of VAPOR water suppression. (A) Frequency selectivity simulated for 7T version of VAPOR using truncated (3 lobe) P10 RF pulse (see the inset) of 25-ms duration24. Nominal flip angle was set to 85 degrees. Residual Mz profile was calculated for GM (T1 = 1830 ms), WM (T1 = 1220 ms) and CSF (T1 = 4425 ms)16. In addition, the Mz profile of the truncated P10 pulse (90 deg) was included. (B) Zoomed-in Mz profile shown in panel A. (C) Frequency selectivity simulated for 3T version of VAPOR using a Shinnar – Le Roux (SLR) RF pulse of a 30-ms duration (see the inset). Nominal flip angle was set to 85 degrees. Residual Mz profile was calculated for GM (T1 = 1500 ms), WM (T1 = 840 ms) and CSF (T1 = 4000 ms) assessed from Rooney et al.16. In addition, the Mz profile of the SLR 90 degree pulse was included. (D) Zoomed-in Mz profile shown in panel C.
The timing of the VAPOR scheme was designed to include interleaved OVS modules. Although using OVS is optional and is not a requirement for successful WS, utilization of OVS modules can improve the overall spectral quality in three ways. First, OVS improves the localization performance by suppressing side-lobes of slice selection pulses, which minimizes contamination of spectra by resonances originated from outside the VOI (such as signals of subcutaneous fat). Keep in mind, phase cycling cannot eliminate these types of resonances. Second, OVS has the potential to suppress spurious echoes arising from distant areas where WS pulses totally miss the water resonance because of a large B0 inhomogeneity outside of the VOI. This can happen when higher-order shims are necessary to compensate the B0 inhomogeneity inside the VOI. Third, pre-localization by OVS decreases the demands on crusher gradients of the localization sequence which enables shorter TE and consequently increases SNR and decreases the dependence on T2 relaxation of metabolite signals. However, it is important to emphasize that OVS pulses make a substantial contribution to the overall SAR of the sequence, and including OVS is possible only for long repetition time (TR) conditions. In addition, OVS pulses may affect the water signal intensity through magnetization transfer (MT) mechanisms. An alternative approach for avoiding spurious echoes would be to use dynamic B0 shimming; using global shims during the WS pulse train guarantees that water resonances across the whole brain experience the WS pulses (γ/2π ΔB0 < WS bandwidth). Local shims optimized for a given VOI (determining the spectral resolution) could be applied only during localization and signal acquisition30,31.
2.1.2. VAPOR water suppression optimization for 3 T
The VAPOR timings and RF power originally optimized for 1H MRS of the human brain at 4 T and 7 T23 are less suitable at 3 T due to both shorter T1 relaxation times of water at this field strength and the demands for longer WS RF pulses as required for frequency selectivity. In order to expand the water suppression region where the residual water signal intensity is insensitive to B1 and T1 inhomogeneity at 3 T, the following changes in relative flip angles and inter-pulse delays are proposed for the first time in this report:
Relative flip angles: α – α – 1.78α – α – 1.59α – α – 1.78α – 1.86α
Inter-pulse delays (in ms): 160 – 110 – 132 – 115 – 112 – 71 – 88 – 24
The flip angle of the 8th WS pulse is increased to 1.86α and the inter-pulse delays are slightly increased for longer WS pulses. A Shinnar – Le Roux (SLR) pulse of 30 ms duration and 42 Hz bandwidth (measured in Mz) was suggested for the 3T VAPOR pulse train (available on the CMRR web site: https://www.cmrr.umn.edu/spectro/) as a compromise between the available time windows for WS pulses, their Mz magnetization profiles, and required frequency selectivity (Fig. 2 C,D). The frequency selectivity of this version of VAPOR is ±0.31 ppm at 50% Mz, with suppression <5% outside of the ±0.40 ppm region. As shown in Figure 2, the 3T version of VAPOR with SLR pulses is slightly more sensitive to off-resonance effects than the 7T version with truncated P10 pulses.
The dependence of the residual water signal intensity on nominal flip angle was simulated for water in three different brain compartments having different T1 relaxation times (WM T1 = 840 ms, GM T1 = 1500 ms, CSF T1 = 4000 ms 16) (Fig. 3 A). The increased flip angle for the last WS pulse helped to keep the dependence of the residual water signal with shortest T1 (WM) flat between 80 and 120 degrees of the nominal flip angle. The visualization of water magnetization Mz trajectories during the VAPOR pulse train for three different nominal flip angles can be found in the Supporting Information (Figure S2). In addition, the dependence of the residual water signal on nominal flip angle was also measured experimentally from the posterior cingulate cortex (PCC, Fig. 3 B) using the aforementioned VAPOR parameters. Simulated and experimentally measured data were in good agreement (Fig. 3 A).
Figure 3.

(A) Dependence of the residual water magnetization on nominal flip angle for 3T version of VAPOR simulated for three brain compartments with different T1 relaxation times (WM T1 = 840 ms, GM T1 = 1500 ms, CSF T1 = 4000 ms)16. In addition, experimentally measured dependence of the residual water signal intensity on nominal flip angle was included (VAPOR-sLASER, TE = 28 ms, TR = 3 s, posterior cingulate cortex). Simulated and experimentally measured data are in good agreement. (B) Representative 1H MR spectrum acquired from the posterior cingulate cortex (VOI position shown in the inset) using VAPOR – sLASER sequence at 3 T (TE = 28 ms, TR = 3 s, NA = 64, 32-channel receive-only head array coil).
2.1.3. Advantages and disadvantages of VAPOR
The VAPOR technique is a robust water suppression method, insensitive to T1 and B1+ variations. It provides high WS efficiency by routinely allowing the minimization of the residual water amplitude well below the intensity of major brain metabolites. The WS adjustment is fast and simple. It requires just one local RF power calibration focused on the VOI (e.g. localization sequence pulse) and if necessary, the fine adjustment can be achieved by optimizing the inter-pulse delay between the 7th and 8th VAPOR pulse. The high efficiency of water suppression over a wide range of nominal flip angles (transmit B1+) makes the VAPOR technique ideal for experiments where increased inhomogeneity in transmit B1+ is expected (7 T, half-volume RF coils). This feature of VAPOR enables efficient water suppression also outside of the VOI, where the B1+ can be very different from that within, which helps to suppress the spurious echoes from distant regions. In addition, the VAPOR technique enables the use of interleaved OVS, which improves the localization performance of the sequence and minimizes occurrences of unwanted spurious echoes. However, because of SAR limitations, VAPOR interleaved with OVS can only be used for MRS with sufficiently long TRs (typically >3 s). For example, OVS contributes up to 93% of the total power deposition in the VAPOR-OVS-STEAM pulse sequence23,25 (Figure 1A).
A disadvantage of the VAPOR technique is the fact that it also partially suppresses resonances of groups with exchangeable protons (mostly -NH- groups of secondary amines and amides), affecting the detection and quantification of downfield signals32. In addition, the series of VAPOR WS pulses may affect some metabolite resonances by a water-mediated MT mechanism, which would cause a bias in quantification of these metabolites33-36. A decrease in the assessed concentrations of total creatine (−12%) and glutamate (−8%) due to VAPOR has recently been reported for 3 T.37 It should be noted that this effect is not specific just for VAPOR, but MT effects on metabolites can be expected for any WS technique based on pre-saturation. The VAPOR technique cannot be used for a short-TR acquisition (TR < 1s) because of the overall VAPOR pulse duration (~720 ms). In addition, the overall SAR of the MRS localization sequence with VAPOR can be a limiting factor for data averaging using shorter TRs. In these cases, we recommend using WET22 or slightly modified versions of WET38,39 as an alternative.
2.2. 1H MRS without water suppression
Although optimized water suppression techniques have been essential for the successful development and application of 1H MRS and MRSI, it is important to note the advantages and drawbacks of alternative methods that avoid water pre-saturation and partly aim at the simultaneous detection of metabolite and water signals. Following the initial publications by Kreis and Boesch40 and Hurd et al.41, several authors have proposed different approaches for localized 1H MR spectroscopy without water suppression.
For most applications, the limited dynamic range of the detected MR signal, which had been one of the early arguments for the necessity of water suppression, is no longer a problem if modern analog-to-digital converters with at least 16-bit resolution and digital filtering based on oversampling are applied. However, the problem of artifact signals caused by any kind of small signal modulations during data acquisition, which leads to side bands of the dominant water signal, is more severe. The switching of slice selection or spoiler gradients may cause a frequency modulation of the water signal, either directly by eddy currents or via excitation of mechanical vibrations, that leads to sideband signals overlapping with metabolite spectra. In addition, amplitude or phase jitter in the detection path of the scanner or instabilities in the shim system can also contribute to sideband signals. These sideband signals of the water resonance hamper metabolite quantification. The characteristics of the sideband artifacts in terms of their intensity, reproducibility, and consistency between phantom and in vivo acquisitions depend on the source and nature of the instability (e.g. phase or amplitude modulation, mechanical or electrical unsteadiness).
Besides avoiding water (and sideband) excitation40,42,43, different approaches have been suggested to suppress the sideband artifacts by exploiting their specific properties. Often the sideband signals are antisymmetric, i.e., they occur equidistantly on both sides of the water signal but with a phase difference of 180 deg44. More importantly, the amplitude of the sideband signals scale with the strength and the sign of the applied magnetic field gradients and are in sync with the phase of the signal from which they originate. This property has been exploited by two approaches, which are both two-step methods. One approach addressing gradient-related sidebands combines two measurements performed with opposite gradient polarity40,45. The other method uses chemical shift selective adiabatic RF pulses to invert the metabolite signals in the upfield or downfield part of the spectrum with respect to water in alternating acquisitions46, while leaving the water signal unaffected. In this so-called “metabolite cycling” (MC) method, addition and subtraction of the two signals allow the separation of the metabolite signals from the water and sideband signals (Fig. 4 A, B).
Figure 4.

Principle of water suppression based on metabolite cycling (MC). (A, B) MC MRS is based on two scans during which the all signals in the spectrum range upfield (A) and downfield (B) from water are inverted without perturbing the water signal. In both non-water-suppressed scans, the gradient coil vibration-related sidebands associated with the water signal overwhelm the smaller metabolite signals (see inset with NAA signal). However, since the water signal and related sidebands are identical in both scans, they are suppressed in the difference spectrum (F) = (B) – (A). The water signal is incompletely suppressed and the metabolite signal are broadened due to significant magnetic field drift during the 8 min acquisition (NA = 128, TR = 4 s). The strong water signal present during every transient is ideally suited to determine the (C) frequency and (D) phase stability throughout the scan. (E) Post-acquisition frequency correction greatly improves the water suppression, while simultaneously increasing the spectral resolution. The sum of (A) and (B) provides the water signal, which can be used for a post-acquisition signal correction. Data were acquired from the human occipital cortex at 4 T using a macromolecule-nulled STEAM sequence (TE = 6 ms, TR = 4 s, TI = 200 ms, NA = 128, 16 mL).
The rationale for performing MRS or MRSI without WS is not only to simplify the acquisition sequence by eliminating the water suppression modules that take up scan time (e.g. limiting more condensed data sampling approach in interleaved multi-slice MRSI experiments), but also for utilizing the unsuppressed water signal to improve MRS data acquisition and processing. The simultaneously measured water signal can be used as an internal reference for quantification purposes and for correcting variations in frequency (e.g. drifts in long experiments or after gradient-intense MRI sequences), phase (e.g. related to physiologic motion), or even signal amplitude (in diffusion weighted 1H MRS). The water signal is also very handy for multi-receiver phase correction and amplitude weighting.
Furthermore, the MC technique offers an elegant solution of avoiding possible bias in metabolite quantification caused by MT effects33,47 induced by WS techniques of long overall duration, like VAPOR.
The main applications of MC are those where single water-suppressed acquisitions have insufficient SNR for phase and frequency alignment of individual acquisitions48, where the spectrum phase is highly sensitive to physiological motion, such as diffusion-weighted MRS49,50, where it is too time-consuming to record separate water-unsuppressed scans (MRSI)51, where the water signal carries independent49 or real time52 information of interest, or where signals from exchanging protons are in the focus of the investigation35,36.
However, the obvious advantages of MC have to be weighed against its drawbacks: water suppression efficiency from the 2-step process can be inferior to what can be achieved by optimized water suppression schemes24. This is especially true in the presence of significant phase and frequency drift (Fig. 4 C, D and F). However, post-acquisition alignment of individual spectra can typically restore a high level of water suppression (Fig. 4 E). It can be observed that the water acquired with downfield inversion is generally a few percent smaller than water acquired with upfield inversion. This is likely explained as being due to chemical exchange and Nuclear Overhauser effects (NOE) between exchangeable protons from downfield resonances and water. A small amplitude correction will be required to achieve the highest level of water suppression. For a given MR method, this correction factor is highly reproducible and can be established quantitatively.46,50 The inversion efficiency of the adiabatic pulse is frequency dependent and may introduce a slightly frequency-dependent response profile, particularly at very high field53. Random scan-by-scan instabilities in the overall signal may lead to residual water sidebands.
While more details and illustrations can be found in the review by Dong54, the following example illustrates the recent application of MRS with MC in diffusion MRS (Fig. 5). Diffusion-weighted spectroscopy scans benefit particularly from a simultaneously recorded large SNR reference signal because the large diffusion gradient pulses in combination with even slight patient or tissue motion easily lead to zero-order and time-dependent phase fluctuations that are different for each acquisition. These signal modulations can be corrected by traditional shot-by-shot correction of frequency and phase, and changes in linewidth can readily be derived from the water reference as well. Non-linear motion also leads to loss in signal amplitude for individual acquisitions. This also can be estimated from the individual large SNR water shots when put in perspective to the whole collection of all acquisitions, as long as enough acquisitions with full signal intensity are among the acquired data. It was found that the relative benefit of the amplitude restoration based on the water signal increases with the strength of the diffusion weighting, and can reach a boost in metabolite signal of 50% in certain subjects50. When comparing to diffusion MRS with WS the overall effect may easily be even considerably larger since the SNR in single water-suppressed scans may be insufficient for reliable frequency and phase correction that can lead to destructive or non-ideal signal accumulation.
Figure 5.

Illustration of the benefit of using metabolite cycling instead of water suppression for the case of diffusion spectroscopy. sLASER spectra with two different diffusion weightings (top b = 40 s/mm2; bottom b = 4140 s/mm2) obtained from human occipital gray matter are plotted to demonstrate the effect of eddy current (i.e. time-varying phase) correction and amplitude (motion) compensation based on the co-acquired water signal. The spectra on the left include zero-order phasing of each acquisition (automatically performed by the scanner software), which is probably also somewhat more reliable for the non-water-suppressed signals than for water-suppressed acquisitions where water suppression efficiency may vary from scan to scan. As evident from comparison of the left-most and middle spectra, the effect of eddy-current correction is obviously larger for the high b-value spectrum, which is expected because larger gradient amplitudes lead to larger eddy currents – though this correction does not necessarily need a shot-by-shot correction. The right-most panel demonstrates the effect of an additional amplitude correction (motion-compensation, see text) based on the water signal where each single acquisition is scaled to the expected size (taken from the top quartile of all acquisitions) or discarded if quality criteria are not fulfilled. Again, it is evident that this correction is considerably larger for the high b-value, effectively mitigating motion-induced signal loss that is increasing with gradient amplitude and corresponding bias in the obtained apparent diffusion coefficient (ADC) values. Thus, a systematic overestimation of diffusion coefficients of metabolites can be avoided by using diffusion MRS with MC.
Acquisition parameters: VOI = 28 cm3, healthy female (26 years), a pair of pulsed diffusion gradients placed before and after the last adiabatic slice selection gradient, diffusion gradient length = 11.5 ms, ramp time = 200 μs, diffusion time = 155 ms, diffusion gradient amplitudes of 3 mT/m (b = 40 s/mm2) and 30.7mT/m (b = 4140 s/mm2) on each axis, TE = 200 ms, TR = 3 s, 3T Prisma (Siemens), phased-array receive head coil, number of averages 16 for low and 64 for the high b-value scans). Figure courtesy of André Döring, University Bern, using data recorded in the context of reference50.
2.3. Techniques for water signal handling in MRSI
Advanced MRSI techniques developed for 3T or 7T MR scanners preferentially use WET 31,38,39,55-58 or VAPOR59-64 WS techniques. Each technique has its advantages and disadvantages. Since VAPOR is less sensitive to B1+ variations than WET, the VAPOR technique should be the method of choice for WS in MRSI at ultra-high fields where substantial spatial inhomogeneity in B1+ is expected. Moreover, the VAPOR technique is inherently designed to include OVS pulses interleaved with WS pulses. These OVS pulses can be used for extracranial lipid suppression. However, the overall duration of the VAPOR pulse train of about ~720 ms, can make this method too long for ultra-high resolution MRSI that requires compact data sampling with a very short TR. In addition, eight RF pulses of VAPOR contribute substantially to the overall SAR of the MRSI sequence, which might lead to SAR limitations for a short TR data acquisition. In these cases, the WET WS technique22 might be the best alternative55,65.
The VAPOR technique can provide high WS efficiency over a wide range of B1+ (flip angles) (Fig. 1 and 3). However, efficient WS across a large region of interest (ROI) can be achieved only if the power of the VAPOR pulses is set correctly, i.e. the range of spatial variation in B1+ across the MRSI ROI corresponds to the VAPOR nominal flip angle region with the highest WS efficiency. For automatic setting of optimal VAPOR parameters, having the B1+ mapping data would be extremely useful. Fast MRSI data sampling using a very short TR has a beneficial side effect of saturating (i.e. suppressing) the water signal, particularly from compartments with long T1, such as CSF. This effect improves the WS efficiency of the WET technique when it is used for ultra-high resolution MRSI.
An alternative approach is to acquire the MRSI data without WS. Such an approach calls for the metabolite cycling method, described in the previous section (2.2.). Recently, this technique was successfully applied for high and ultra-high field MRSI51,66. The advantage of this technique is a simultaneous acquisition of both metabolite and water data. The water signal is important not only as an internal quantification reference, but it also provides calibration information for combining phased-array coils and for correcting residual eddy currents, as well as phase and frequency drifts. However, as a difference method, metabolite cycling based MRSI is susceptible to signal changes or fluctuations as already discussed for single-voxel experiments. Furthermore, B0 inhomogeneities may affect the detection of signals close to the water resonance and reduce the quality of separating the water signal from the metabolite spectra, which may cause baseline distortions.66
3. Subcutaneous lipid suppression
Mobile lipids are not detectable in a healthy human brain by 1H MRS or MRSI, however they may appear in the brain as a consequence of a disease. The primary goal of this section is not aimed at these mobile lipids in the brain, but instead is focused on techniques suppressing the artifactual subcutaneous lipid signals originating outside of the brain. If these unwanted extracranial lipid signals are not suppressed, they can contaminate and severely degrade the quality of 1H MRS/MRSI data. However, if mobile lipid detection within the brain is the goal of the study, the extracranial lipid suppression should not inadvertently suppress these signals.
The efficiency of eliminating extracranial lipids from single-voxel MRS data is determined by the localization performance of the used pulse sequence. Advanced single voxel spectroscopy techniques (sLASER, SPECIAL and STEAM, all typically combined with OVS), which are described in another paper of this Special Issue27, meet this requirement. Their outstanding localization performance guarantees the elimination of unwanted lipid signal from outside of the VOI.
The following sections of this paper will describe different subcutaneous lipid suppression techniques used in 1H MRSI. In this case, signal contamination from subcutaneous lipids is mainly affected by the point spread function (PSF) and motion. Due to voxel bleeding, even voxels distant from the skull can be affected which can significantly deteriorate MRSI data quality. In addition, reconstruction errors in methods such as parallel imaging or non-Cartesian trajectories may introduce further lipid artifacts.
Initially, MRSI techniques utilizing volume pre-selection (by sLASER or PRESS localization) will only be discussed briefly because advanced MRSI methods increasingly aim for a whole-slice (whole-slab) coverage. All subsequent sections will be exclusively focused on MRSI techniques capable of providing whole-brain coverage that is critical for many potential clinical applications. At first, lipid suppression techniques that can be implemented on most clinical MR scanners will be described. In a second part, new advanced techniques using high spatial resolution developed for MRSI at ultra-high field will be explained. Finally, three promising new lipid suppression techniques, which require special hardware, will be described.
3.1. MRSI techniques with volume pre-selection
Volume pre-selection has a number of advantages and disadvantages for human brain MRSI. First and foremost, volume pre-selection has the capability to eliminate the contamination of MRSI data by all unwanted signals originating from subcutaneous lipids. Volume pre-selection is especially useful when MRSI investigation is targeting a specific brain region. Such an approach is even more justified when the ROI requires strong B0 shims (i.e. anterior-inferior frontal and anterior temporal) that would deteriorate the B0 homogeneity outside of the ROI. This is a common challenge for MRSI data collection because high-quality B0 homogeneity across the whole brain is not achievable on MRI scanners equipped only with a standard B0 shim set (1st and 2nd-order).
The disadvantage of this approach is that volume pre-selection does not allow for whole-brain coverage. In addition, the volume pre-selection technique with a rectangular shape is not suitable to acquire MRSI data from the brain periphery due to differences in the brain geometry. If the pre-selected volume contains only a fraction of the extracranial tissue, the advantage of using this technique for lipid suppression is lost and other lipid-suppression techniques have to be utilized. Last but not least, intensities of metabolite resonances in MRSI voxels on the periphery of the pre-selected volume are compromised by the chemical shift displacement error (CSDE). The sLASER technique is highly recommended over PRESS for the volume pre-selection at high B0 fields due to considerably reduced CSDE and excellent localization performance (narrow transition zone, negligible contamination from outside of the region of interest (ROI)27,38,39,58.
3.2. MRSI lipid suppression techniques for clinical MR scanners
Proton MRSI of the whole brain, i.e. without volume pre-selection, has considerable advantages in terms of extended spatial coverage, particularly for cortical regions. However, lipid signals from the scalp and other surrounding tissues are three to four orders of magnitude larger than those of brain metabolites. Even when using medium to long echo times, the relatively low spatial resolution of typical MRSI studies, as dictated by SNR constraints, typically requires suppression of these unwanted lipid signals by either acquisition techniques or post processing algorithms. In the following sub-sections, acquisition methods that can be readily implemented on standard clinical scanners without the need of advanced hardware will be reviewed.
3.2.1. Outer-volume suppression
The most common approach for full-slice, multi-slice, or volumetric 1H MRSI is the use of carefully-placed OVS slices to presaturate peripheral lipid-containing tissues67. In this approach, a series of spatially selective saturation pulses are placed tangentially around the skull prior to exciting the metabolite signals (see Fig. 6). Typically, OVS pulses are temporally interleaved with water pre-saturation pulses, with one of the first demonstrations of this approach for multi-slice 1H MRSI presented by Duyn et al.68.
Figure 6.
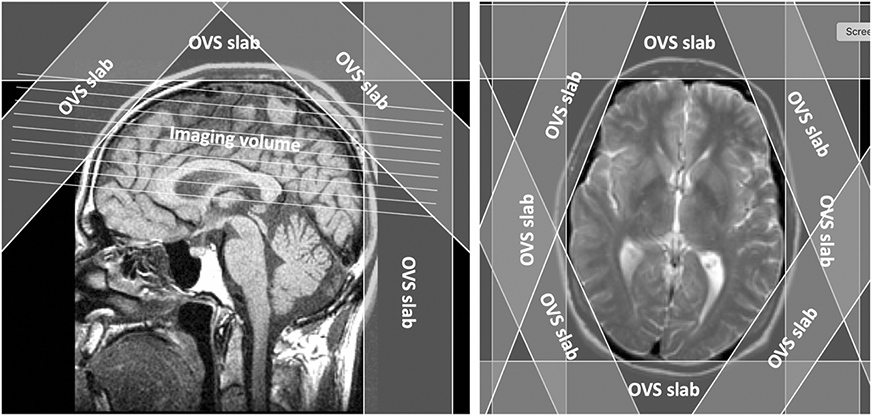
Outer-volume suppression (OVS) pulses used for lipid suppression in whole-head 1H MRSI.
The OVS approach for lipid suppression has now become quite common, with some applications using up to 16 OVS pulses in all three spatial dimensions67,69. Variations of OVS implementations include the use of cosine modulated pulses to simultaneously excite pairs of parallel saturation bands70, multi-pulse sequences to reduce sensitivity to T1 and B1+ variations 62,71.
Conventional OVS pulses are, however, limited by relatively poor edge profiles, B1+ and T1 sensitivity, and susceptibility to chemical shift displacement errors. High-performance Very Selective Saturation (VSS) pulses directly address these drawbacks.72 In general, increasing RF pulse durations while maintaining constant pass bands can increase selectivity (defined as the ratio of the pass to transition bandwidths). VSS pulses achieve high selectivity without increasing RF peak power constraints via the addition of a quadratic phase variations while keeping the B1+ magnitudes relatively constant. As a result, VSS pulses can achieve much higher excitation bandwidths and narrower transition bands than achievable using conventional pulse designs. For example a typical 3 ms VSS pulse can achieve a 6 kHz passband, 350 Hz transition band, and a selectivity factor of 17, as compared to a 5-ms conventional pulse with selectivity of 2.6 based on 1.3 kHz/0.5 kHz pass/transition bandwidths In general, the excellent VSS performance comes at a cost of a nonlinear phase response, which in the case of saturation pulses is irrelevant as dephasing of the excited magnetization is actually desirable. Hence, VSS pulses can be particularly useful for MRSI applications in achieving excellent spectral quality even from tissues located close to subcutaneous lipids.
A current limitation of OVS methods is the need to manually place the OVS slices, a process that can significantly slow down workflow during a clinical exam. However, automatic placement of the OVS pulses using image segmentation and/or machine learning can potentially overcome this limitation67,73. A much more significant limitation of OVS is the lack of robustness towards variations in T1 and B1+. The minimum number of OVS slices (8), provides essentially no compensation towards T1 and B1+. Extending OVS to 16 or 24 pulses improves sensitivity towards T1 and B1+ at the expense of greatly increased SAR and necessitates long TR acquisitions. Therefore, the OVS based subcutaneous lipid suppression becomes unattractive moving towards magnetic fields above 3 T. Practically, whole-slice OVS only provides a 15 - 25 fold mean extracranial lipid suppression factor under in vivo conditions62,71,74. In addition, the overlap of OVS slices increases the probability of spurious echoes generated by stimulated echo mechanisms. Finally, it should be noted that OVS pulses might affect the intensity of the detected water signal through MT mechanisms, which is important to take into account if the water signal is used as an internal reference for quantification.
3.2.2. Inversion recovery
An alternative to OVS pulses is the use of inversion recovery (IR) methods75. Specifically, exploiting the relatively short T1 relaxation times of lipids relative to those of most metabolites, lipid suppression can be obtained by adding a non-selective inversion pulse and by dephasing gradient prior to the spectroscopic acquisition76. This approach, commonly named as Short inversion Time IR or Short Tau IR (STIR), requires minimal user input and is generally quite robust. A side benefit of the STIR method is the nulling of macromolecule signals. When short TRs are used, the relative T1 weighting between metabolites is rather small because shorter TRs compensate for differences in T1 signal attenuation of metabolites at steady state77. A representative 3T whole brain 1H MRSI data set is shown in Figure 7.
Figure 7.

Whole-head 1H MRSI at 3 T using inversion recovery for lipid suppression in combination with a spectral-spatial spiral acquisition. (A) pulse sequence diagram, (B) metabolite maps, and (C) a representative spectrum. Parameters: TR = 2 s, TI = 180 ms, TE = 144 ms, nominal voxel size = 1.2 cm3, total acquisition time = 3.6 min.
Inversion recovery methods, however, do have several important disadvantages. Lipid signals from the brain, e.g. those seen with some pathologies, are also suppressed along with the subcutaneous signals. In addition, B1 inhomogeneities and lipid T1 variations can limit performance, with several investigators suggesting the use of double IR78 or multiple dual-band inversions79. However, the most significant disadvantage is the loss of metabolite signals due to T1 decay during the inversion time. In addition, this approach may increase the sensitivity to metabolite T1 differences between pathological and control tissue. At 3 T, IR-MRSI results in approximately 30% metabolite signal loss. At higher fields, such as 7 T, signal losses are 50% or more depending upon the TR used15,56. However, even with these metabolite signal losses, very robust 7T spectroscopic imaging sequences have been presented. A double IR approach in combination with parallel imaging was used to obtain robust whole-slice 1H MRSI at 7 T56, in which the use of long, low-power inversion pulses reduced SAR requirements, and a tailored frequency sweep for these adiabatic pulses provided a 13-fold mean lipid suppression factor65 with significantly less metabolite signal losses as compared with conventional IR suppression.
3.2.3. Chemical shift selective lipid suppression
As an alternative to avoid the IR metabolite signal losses, one can design frequency-selective saturation RF pulses which selectively excite (and subsequently dephase) the part of the spectrum containing major CH2- and CH3-lipid peaks (~0.9 – 1.3 ppm). While this approach does preclude the measurement of metabolites having resonances in this ppm range (e.g. lactate), the remaining metabolites can be imaged at full sensitivity. This approach may be particularly useful at high magnetic field strength such as 7 T, at which increased chemical shifts relax RF pulse spectral profile constraints. However, it has to be emphasized that lipids, in particular those containing unsaturated fatty acids, have additional resonances in the 2.0 – 5.5 ppm range that compromise the quantification of metabolites, especially glutamate and glutamine. Therefore, this approach might be more suitable for long-TE MRSI. However, it is necessary to keep in mind that strong lipid resonances do not totally disappear even at TEs extending up to 288 ms.
Of course, multiple lipid suppression methods can also be combined. Zhu et al., demonstrated a dual-band water and lipid suppressed multi-slice MRSI sequence consisting of five pre-saturation dual-band frequency-modulated radiofrequency pulses based on hypergeometric functions integrated with eight OVS pulses80, providing a 20-fold mean lipid suppression factor. This approach was later extended to a parallel imaging 7T method using a 32-channel receive array having whole-slice coverage, high SENSitivity Encoding (SENSE) acceleration factors, insensitivity to B1+ inhomogeneities, and minimum chemical shift displacement artifacts81.
3.3. Lipid suppression in MRSI with high spatial resolution
In this section, lipid suppression methods utilizing the combination of k-space filtering, high spatial resolutions, and lipid regularization65,82 are described.
3.3.1. Spatial Filtering in k-space
The theoretical PSF is determined by the measured k-space extent and the k-space weighting83. A filter (or "window") can be applied in k-space by multiplication of data with k-space weighting coefficients. The Fourier transform of the filter weights define the PSF of the filtered image, and thus k-space filtering enables adjusting the PSF to specific needs. Typically, low-pass filters are applied, which have PSFs with suppressed side lobes, and thus reduce voxel bleeding. One such example is the Hamming filter H(n) = 0.54 + 0.46 · cos(2πn/N), where n is the index of the k-space point in one dimension, and N is the number of k-space points. This filter has a PSF with strongly suppressed first side-lobes at the expense of less suppression of the other side-lobes. For more detail on these topics see the paper of Maudsley et al., in this Special Issue84. Figure 8 A shows the lipid contamination in FID-MRSI data when different post-processing lipid handling methods were utilized. In Figure 8 B, four theoretical PSFs are shown, together with experimentally obtained total NAA (tNAA) maps of two volunteers. With no lipid handling, the signal leaks to the whole field of view (FOV) with values around −20 dB for the low resolution, resulting in strong lipid contamination throughout the whole 1D column (Fig. 8 A). Due to close vicinity of NAA signal to lipids, this is reflected also in tNAA maps (Fig. 8 B-I and -III). After applying a Hamming filter (Fig. 8 B-II), the PSF side-lobes are considerably reduced to around −40 dB, however, this is at the expense of increased voxel sizes (broader PSF main lobe). As a result, the lipid artifacts disappear in the center of the brain, but the effective lower resolution can be seen at the edge of the brain, especially for the low resolution (Fig. 8 A; Fig. 8 B-II), resulting in a smaller quantifiable brain volume.
Figure 8.

(A) 1H-FID-MRSI spectra from larger voxel size (red voxels, 11 x 11 x 8 mm3) and smaller voxel size (yellow voxels, 3.4 x 3.4 x 8 mm3) acquired from one volunteer (Vol 2 in B) showing lipid contamination (grey band). Shown are data where no lipid handling was applied, lipid regularization was applied, Hamming filter was applied and both lipid regularization and Hamming filter was applied. Note: Spectra from white voxels are not plotted. The data sets with 11×11 mm2 resolutions were obtained by down-sampling the MRSI data and applying an elliptical filter in k-space in post-processing to simulate accurately how such data would be measured. First order phase error is caused by the acquisition delay of the FID-sequence. (B) tNAA maps of two volunteers for different resolutions, filters, and lipid regularizations (top two rows), together with the corresponding theoretical point spread functions (PSF) in logarithmic scale (lower row). The PSFs are plotted relative to the peak height at the center in dB, for an FOV of 220x220 mm2. Since the main tNAA peak is close to the lipids, the tNAA maps are good indicators for lipid contamination.
If no spatial filter is applied, the PSF shows strong signal spread over the whole FOV, which is reflected in a substantial lipid contamination (A, no lipid handling). Quantification of tNAA may be affected by the huge lipid peaks, which is often manifested as “hotspots” in metabolic maps or areas that were not quantified (I and III). Lipid regularization may not always completely eliminate the lipid signals, especially at lower resolution (A, Lip.Reg.; B-I and B-III). Hamming filtering reduces the strong signal spread, thus improving the spectra in the centre of the brain, however the periphery, also due to larger nominal voxel size still suffers from lipid contamination (A, Hamm. filter) and inaccurate tNAA quantification (lower tNAA at the border of the brain in B-II). Using high resolutions recovers big parts of the tNAA maps at the brain edge (B-IV). In case of strong lipid contamination (i.e. - if lipid signals originate from other sources than the theoretical PSF), additional lipid regularization can help to reduce these artifacts, which often appear as random hotspots in the tNAA map (A, Hamm. & Lip.Reg.; B-IV, vol 2).
3.3.2. High Spatial Resolution
This effect of spatial k-space filters can be reduced by using higher resolutions. Although the PSF ‘shape’ is the same for any spatial resolution and therefore also the number of lipid-affected voxels is the same (Fig.8A), the total volume of all lipid-affected voxels is smaller (simply because the voxel size is smaller)55,85. This is again seen also in the tNAA maps, where the region of ill-quantified voxels (blue voxels close to the skull in Fig.8B-II) is smaller (Fig.8B-III).
Neither of the methods mentioned above suppresses the lipid signal, but both provide a way to control extracranial lipids caused by the sampling PSF. It is important to realize that the PSF in a real measurement is not only influenced by the spatial resolution and k-space filter, but also by measurement inconsistencies such as subject movement. Therefore, k-space filtering or high resolutions cannot reduce lipid artifacts arising from motion (see Fig. 8 B-IV, volunteer 2 with Hamming filter, but without lipid regularization). In such cases, other lipid suppression methods, such as lipid regularization, are necessary.
3.3.3. Reconstruction with lipid regularization
A post-processing lipid handling method exploiting lipid regularized reconstructions has been described86,87 and applied in various MRSI applications51,65,82,88,89. To utilize this method, two conditions have to be met: (a) spatial orthogonality and (b) spectral orthogonality of metabolites and lipids.
In mathematics, two vectors are orthogonal if their dot product equals zero. Generally, orthogonality is a measure of similarity. In the case of MRSI, the spatial orthogonality means that lipid and metabolite signals are detectable only in two mutually exclusive spatial compartments, e.g. the brain and the scalp. In addition, the spectral orthogonality is fulfilled because lipids and metabolites resonate (mostly) at different frequencies, if only the 1.28 ppm lipid peak is considered. In other words, the dot product (the point-wise complex multiplication) of a lipid spectrum and a metabolite spectrum is close to zero. On the other hand, if this vector multiplication is not zero, the two spectra are not orthogonal and are similar.
The described set of methods employs a regularized MRSI reconstruction, where the regularization imposes prior knowledge on the measured data. MRSI reconstruction may be described as solving a linear system A · x = y for x, where A is the observation model (e.g. a Fourier transform), x are the reconstructed data and y are the acquired data. Instead of performing a direct reconstruction, the reconstruction can be formulated as a minimization problem with ordinary least squares: to minimize the sum of squared residuals. In order to give preference to a particular solution with desirable properties, a regularization term can be included in this minimization:
Here α, β are regularization parameters and C is a transform of x. The α and β influence the amount of regularization and can be optimized empirically.
The following paragraph shows how such a minimization problem can be adapted to minimize lipid signal in MRSI. By choosing x = S and A = F, where S consists of all reconstructed spectra, and F is the Fourier transform from image to k-space, the first term in the minimization describes the consistency term. Its purpose is to make sure that the reconstructed spectra S are similar to the acquired spectra y after Fourier transform. By storing all lipid spectra from the scalp in a matrix L, and choosing C = LH with H being the Hermitian conjugation, expression can be used as the regularization term. The Hermitian conjugation is needed due to the definition of the complex dot product between L and S, such that the entries of the matrix LHS describe how similar each individual reconstructed metabolite spectrum is to every lipid spectrum. The matrix norm characterizes the overall similarity (or orthogonality) of the given lipid and metabolite spectra. Therefore, the goal of the reconstruction is to achieve LH · S as close to zero as possible by minimizing or ∥LHS∥1. Simultaneously, the data consistency term is minimized to keep the reconstructed data similar to the measured k-space data y. In total, our minimization for L2-regularization can be written as:
| (1) |
The minimization in Eq. 1 is a well-known mathematical problem. As opposed to L1 regularization, a closed-form solution for L2 regularization exists, which is easy to implement and computationally efficient.
The performance of the described lipid-removal algorithm depends strongly on whether the orthogonality-assumptions are valid. If strong lipid signals in the ppm range of interest (e.g. at 2.24 ppm or 1.25 ppm over some macro-molecule resonances) are present, or lipid signals also occur in the brain (e.g. in a tumor), these assumptions are no longer valid. In such cases, lipid-regularized reconstructions might perform poorly, e.g. by adding lipids to spectra, removing macro-molecules that should not be removed, or removing lipids that should not be removed (e.g. brain tumors). We therefore recommend not to use lipid regularization if MMs will be quantified, or lipids inside the brain are expected and of interest.
Revisiting Figure 8, lipid regularization can clearly remove most of the lipid signal (Fig. 8 A) and improve the tNAA map appearance, even with strong lipid contamination as in volunteer 2. We suspect that substantial movement occurred in this subject so that Hamming filtering and using a high resolution did not sufficiently reduce lipids in the brain. In this volunteer, only the combination of Hamming filtering and lipid regularization provides spectra and metabolic maps of satisfying quality. In practice, L2 lipid regularization provides lipid reduction factors in the order of 10-fold65.
3.4. Lipid suppression using non-standard hardware
The last part of this lipid suppression techniques section is dedicated to novel methods requiring hardware not available on clinical 3T MR scanners. The first method is designed for 7 T and higher field MR systems with multi-channel transmit systems. The next two methods require a unique hardware, a dedicated second-order gradient system or an outer volume crusher coil.
3.4.1. Lipid suppression using dynamic B1+ approach
Human 7T MR scanners are commonly equipped with a multi-channel transmit system to overcome a spatial inhomogeneity in transmit B1+. Typically, 7T systems are configured with 8 independent transmission channels to support both RF shimming and parallel transmission. The gained flexibility in parallel transmit systems opens new avenues for efficient suppression of subcutaneous lipids signals for advanced, whole brain MRSI at 7 T. Two different spatial distributions of RF can be generated by such parallel transmit systems: one for homogeneous excitation, refocusing and water suppression and a second RF distribution (ring distribution), which constrains the RF to the periphery of the head for outer volume suppression (Fig. 9 A).
Figure 9.

(A) B1+ for the homogeneous and ring distributions using a double row transceiver array. (B) MRSI sequence using the two B1+ distributions and a double inversion recovery preparation for suppression of extracerebral signals. (C) Plot of the equilibrium magnetization following a single (dashed line TIR/TR 350/3000ms) and double (solid line, TIR1/TIR2/TR 600/180/1500ms) inversion recovery preparation as a function of T1. (D) in vivo results showing 1H MR spectra spanning the head (left to right) acquired after 2D phase encoding: without any outer volume suppression, with a non-spatially selective IR, with a single or double spatially selective (ring distribution) IR.
Panel C and D modified with permission from Hetherington et al.15 © 2010 Wiley.
For the homogeneous distribution, the generated B1+(r) is given by:
where aj and Φ0j represent the amplitude and phase parameters determined through RF shimming for each coil j. Φ0j is calculated such that Φ0j + Φj(r) = 0 over a small central ROI, and aj is selected such that over the brain is minimized. For the ring distribution, Φ0j + Φj(r) = 3πj/4 for each coil j.
Similar to the homogeneous distribution, which is designed to be maximally constructive in the center of the slice and somewhat destructive at the periphery (i.e. reduces high amplitudes of RF adjacent to the coils to make the fields homogeneous over the entire slice) the ring distribution is maximally constructive at the periphery and completely destructive (B1+ fields cancel) at the center. The RF distribution is also highly efficient in the periphery requiring 40% of the amplitude (or 16% of the power) of the homogeneous distribution15. The maximal local SAR remains similar to that of the homogeneous distribution since the electric fields also combine more effectively at the periphery for the ring distribution.
By utilizing only RF shimming to generate the distribution, spatial selectivity is achieved without the need for gradient selection and with a single pulse15,31. Since RF shimming is utilized (i.e. same waveform to all RF channels) any method for suppression (e.g. inversion recovery – Fig. 9 B, saturation etc.) can be utilized with minimal additional setup. For inversion recovery, two pulses can be applied with optimal timings so as to suppress resonances with a broad range of T1 values (400 – 2000 ms) (Fig. 9 C) with maximal efficiency (>50 fold in mean lipid suppression) (Fig. 9).
Although single row transceiver arrays are limited by their inhomogeneity across the Z-axis of the array, two row transceiver arrays can significantly extend the homogeneous volume 90. In these cases, a single ring distribution can be calculated for the entire brain volume (Fig. 9 A) enabling multi-slice and multiple spatially distinct single slices to be acquired without the need for optimizing individual values for each slice. Notably a 16 channel transmit system was not required, rather 8 individual channels were utilized with a 1 to 2 splitter driving adjacent coils across the two rows.
3.4.2. Lipid suppression by dynamic, second-order B0 fields
A new technique, named as elliptical localization with pulsed second-order fields (ECLIPSE) 74,91, has been introduced, which achieves selective excitation of an elliptical ROI with a single RF pulse (Fig. 10). A dedicated gradient coil insert generates pulsed, high-amplitude magnetic fields described by second-order spherical harmonic functions (Fig. 10 A). In the transverse plane the Z2 spherical harmonic function (2Z2 – (X2 + Y2)) has a circular dependence on position, whereby a combination of Z2 and X2-Y2 functions can extend that to an in-plane elliptical dependence (Fig. 10 C). When used in combination with a frequency-selective RF pulse, the elliptical magnetic field distribution leads to the near-perfect selection of brain while simultaneously eliminating extracranial signals (Figs. 10 B,D). When ECLIPSE volume selection is combined with MRSI, the resulting localized 1H MR spectra are free of lipid contamination (Figs. 10 E,F). ECLIPSE can be executed in a variety of pulse sequence styles, including inner volume selection74,91, outer volume suppression and skull-specific signal nulling through T1 relaxation differences74. In all cases a single ECLIPSE pulse affects all spatial locations equally, leading to equal T1 relaxation recovery and uniform signal suppression. B1 independent mean lipid suppression factors of >100 are routinely observed with all ECLIPSE styles, typically at ~30% of RF power needed by an equivalent, conventional multi-slice lipid suppression method. Future extensions of ECLIPSE are focused on improved ROI shaping by combining ECLIPSE with multi-coil setups92.
Figure 10.

Principle of ECLIPSE lipid suppression. (A) A human head-sized RF coil (gray former) is closely fitted with copper coils that generate Z2 (red), X2Y2 (blue) and possibly other magnetic field distributions. (B) MR image obtained without ECLIPSE. (C) Magnetic field distribution that closely fits the human brain for magnetic field offsets between −0.5 and +2.7 kHz. (D) MR image with ECLIPSE showing the elimination of all extracranial signal with a magnetic field offset greater than +2.66 kHz. (E) Water-suppressed 1H MR spectra acquired from the entire slice in the absence (red) and presence (green) of ECLIPSE. (F) Water-suppressed 1H MR spectra extracted from a 21 x 21 MRSI dataset (1 cm3 nominal resolution) at the positions indicated in (B, D).
3.4.3. Lipid suppression by means of a dedicated crusher coil
This new lipid suppression technique for brain MRSI60 is based on the principle of surface spoiling gradients that generate a very local and inhomogeneous magnetic field in the outer layer of the head. These local fields destroy the phase coherence of the extra cranial signals. This lipid suppression technique can be easily incorporated in MRSI sequences as it requires only a short pulse of the coil (during the echo time) without additional RF pulses or delays. The crusher coil can be powered by an amplifier commonly used for B0 shimming. Outer volume crushing allows for a large increase in sampling efficiency of lipid-suppressed sequences in the brain, which is particularly beneficial at ultra-high field strengths. Voxel-wise lipid suppression factors in the order of 20- to 70- fold have been observed with the method. Disadvantages of lipid suppression based on a crusher coil include reduced signal retention, especially in the axial plane and variable lipid suppression depending on the subject and slice position.
3.5. Lipid suppression techniques summary
While multiple lipid suppression techniques have been reviewed in previous sections, an objective comparison between them is difficult to make because a comprehensive study comparing all these methods under equivalent conditions has not been performed to date. Since each of these techniques has its own set of advantages and disadvantages, it would be inappropriate at this point to choose one single method as the best. Despite these challenges, our attempt here is to help and guide the reader by providing a simplified assessment of strengths and weaknesses of these methods using a wide range of different criteria (Table 1). The choice for using the most appropriate method depends on the type of MRSI application and availability of appropriate hardware. Some techniques, such as the high spatial resolution approach or dynamic B1+ shimming are suitable only for ≥7 T due to requirements for SNR or specific hardware, respectively.
Table 1.
Overview of performance metrics for the extracranial lipid suppression methods described.in this paper.
| Lipid suppression method for MRSI |
Multislice OVS | Inversion recovery |
Selective lipid suppression |
L2-regularization | Dynamic B1+ approach |
ECLIPSE- OVS |
Crusher coil |
|---|---|---|---|---|---|---|---|
| Lipid suppression factor | 15-25-fold | 13-fold | 7-fold | 10-fold | >50-fold | >100-fold | 20-70-fold |
| Edge voxel CSDE | + | ++ | ++ | ++ | − | + | ++ |
| Lipid-brain transition zone fidelity | ++ | ++ | ++ | − | − | ++ | − |
| SAR | − − | + | + | ++ | + | + | ++ |
| Axial slice coverage | + | ++ | ++ | ++ | − | + | − |
| Immunity to B1+ variations | − | ++ | ++ | N/A | + | ++ | ++ |
| Immunity to T1 variations | − | − − | ++ | ++ | ++ | ++ | ++ |
| Provides MM mapping in ROI | Yes | No | No | No | Yes | Yes | Yes |
| Extendable for 3D MRSI | Yes | Yes | Yes | Yes | Yes | Yes | Yes |
| Requires additional hardware | No | No | No | No | Yes | Yes | Yes |
| Full-intensity MRSI method | Yes | No | Yes | Yes | Yes | Yes | Yes |
The number of +/− signs proportionately indicates positive/negative attributes with respect to desirable outcomes with extracranial lipid suppression. The positive/negative attributes are further highlighted by a color code spanning from green (positive), orange (neutral), and red (negative).
Recently developed lipid suppression methods based on spatially shaped B0 and B1 magnetic fields provide superior suppression while simultaneously addressing some limitations of conventional methods. Lipid suppression based on shaped B0 and B1 magnetic fields can, in principle, be achieved with a single RF pulse, thereby eliminating complications due to multiple overlapping slices and differential T1 relaxation. Moreover, by reducing the RF power deposition, these techniques are advantageous for ultra-high fields. While a multi-transmit or parallel transmission technology is not standard with most clinical 3T magnets, it is typically available on ultra-high field MRI systems (B0 ≥7 T). Therefore, a B1+ shimming approach for lipid suppression should be feasible at ultra-high fields. For lipid suppression with the ECLIPSE approach, however, a high amplitude second order gradient insert is required, which is not currently available as an option through MRI system vendors. The availability of high powered and higher-order gradient inserts available through third-party vendors, or by improving the performance of vendor supplied higher-order shim coils, can bring ECLIPSE-based localization to the wider MRI community. Recently, outer volume crusher coils have become commercially available for 3T and 7T research (MR Shim GmbH, Germany). The availability of the crusher coil will lead to more MRSI studies that would demonstrate advantages and disadvantages of this novel, lipid suppression technique.
4. Overall recommendations
The authors of this paper are affiliated with different research institutions and have been directly involved in the development of water and/or fat suppression techniques. Their primary goal is to share their experience, to guide MRS/MRSI users to understand advantages and disadvantages of individual techniques, and to provide recommendations for choosing the most appropriate water/fat suppression techniques and for their proper usage.
4.1. Recommendations for water signal handling
The primary and most important goal of WS techniques is to suppress the water signal to a level at which it will not negatively affect metabolite quantification. Reducing the residual water signal to below the largest metabolite signal is usually sufficient. Moreover, WS techniques for high and ultra-high B0 fields have to be as insensitive to T1 and B1 as possible in order to guarantee an efficient and robust WS efficiency requiring only minimal adjustments. To achieve this goal, the authors of this paper recommend the following:
using WS techniques that provide an in-phase single-frequency residual water signal rather than techniques providing smaller residual signals that are spread out over a wider frequency range or are out-of-phase with respect to the metabolite signals.
using VAPOR water suppression for 1H MRS of brain when longer TRs are used. For a short-TR acquisition approach, we recommend WET technique as an alternative. Warning: WS techniques may affect some resonances through MT effects.
using a newly optimized version of VAPOR for MRS studies at 3 T, which is more robust and better suited for shorter T1 of water (especially in WM) at this field. Decreased sensitivity to B1+ variations makes this version more suitable for a fully automatic parameter setting.
calibrating the automatic setting of the VAPOR RF power to avoid a possible bias when VAPOR is used for the first time for a given MR scanner or if the RF hardware was exchanged. By using the experimentally measured dependence on nominal flip angle for the residual water signal, it is necessary to verify whether the pre-set power agrees with the power corresponding to the middle of the flat region where the derivative d(Mz/M0)/dα is minimal (not necessarily the power corresponding to the smallest residual signal). Such a value should be set automatically in further experiments using the VOI based power calibration (typically some pulses of the localization sequence).
using the inter-pulse delay between the 7th and 8th VAPOR pulse for the fine calibration of VAPOR (if necessary) instead of RF power adjustment.
using WET WS for a dense MRSI data sampling approach with short or ultra-short TRs when VAPOR cannot be used. However, in the case of MRSI, where substantial spatial B1+ inhomogeneities across a large ROI are very common, the VAPOR technique should yield enhanced results compared to WET.
using the metabolite cycling (MC) approach preferentially for 1H MRS acquired from small VOIs when SNR in single acquisitions is not sufficient for performing frequency and phase corrections and when substantial changes in these values are expected (e.g. MRS of spine).
using MC for diffusion-weighted MRS where signal amplitude fluctuations are expected for some acquisitions but not the large majority of them.
using MC with common localization methods or employing localization techniques that do not affect the longitudinal magnetization of water if aiming at the direct detection of exchangeable protons, such as those in secondary amine and amide groups.
using MC when potential magnetization transfer effects have to be avoided.
using single scan averaging for MC which enables alignment of up-field and downfield inverted shots before addition or subtraction.
using a weighting factor for subtracting scans with upfield or downfield inversion in MC.
including a residual water map in MRSI data reporting in order to demonstrate the overall data quality when the WS efficiency is challenged by B0 and B1 spatial inhomogeneity.
4.2. Recommendations for subcutaneous lipid signal handling
The field of lipid suppression techniques is much more diverse than WS techniques and each method has its benefits and limitations. Therefore, it was not possible at this stage to select and recommend just one approach. The general goal of lipid suppression in MRSI is to eliminate the leakage of unwanted signals originating from subcutaneous lipids into brain tissue spectra that can severely obscure metabolite quantification. Choosing the most appropriate lipid suppression technique will depend primarily on the type of clinical/research problem to address and on the availability of non-standard hardware. Here we provide some basic comments and recommendations:
We recommend using lipid suppression based on (adiabatic) inversion recovery for whole-brain MRSI at a clinically-achievable resolution (1 mL). This technique provides not only a robust level of lipid suppression, but also suppresses brain macromolecular resonances (mostly mobile proteins). In addition, this technique minimizes differences in metabolite signal T1-weighting caused by differences in their T1 relaxation times.
We recommend using lipid suppression based on octagonal eight or ten-slice OVS around the brain for 3D-MRSI studies. In order to reduce the sensitivity on B1 and T1 variation, at least two OVS cycles are recommended. However, this approach requires longer TRs because of SAR limitations.
MRSI across a cuboidal volume selected by a single-voxel localization method can be useful for more focal pathologies in the center of the brain, provided that high-bandwidth RF pulses are used to mitigate chemical shift displacement artifacts at edge voxels of the detected MRSI grid. When the pre-localization is used then additional lipid suppression elements are not necessary if the FOV is extended to separated skull from brain spatially; if not, OVS pulses in addition to the pre-localization sequence are recommended.
We highly recommend the use of high-bandwidth RF pulses for localization with OVS, both in MRS and MRSI in order to minimize the CSDE. Frequency-swept RF pulses appear to be the best choice for this application.
High-resolution MRSI at 7 T offers inherent lipid containment due to the more favorable point spread function. In addition, higher-resolution MRSI allows novel reconstruction routines (L2-regularization) to further contain the lipid contamination. However, we do not recommend using such lipid-regularizations when aiming to quantify the lipid content in tumors.
Some of the main limitations of lipid suppression related to RF power deposition, volume coverage, and insensitivity to B1 and T1 can be mitigated with recently developed OVS methods based on spatial ring selection using shaped B0 or B1 magnetic fields.
The level of lipid suppression is strongly dependent on the MRSI spatial resolution and echo-time. In an ideal case, the lipids should be suppressed to the level of spectral noise.
In practice, lipid suppression factors of 15–20-fold can provide adequate MRSI spectra for most spatial positions. As residual lipid signals are ubiquitous in MRSI, inclusion of a residual lipid map in conjunction with the metabolite maps is recommended.
Supplementary Material
Financial information:
The preparation of this manuscript was supported by the US National Institute of Health (P41-EB015894, P41-EB027061, P30-NS076408, IT and DD; P41- EB015909, MP; R01-EB014861, RAG; P41-EB015891, DMS); Swiss National Science Foundation (320030-175984, RK); Austrian Science Fund (J 4110, P30701, BS).
Abbreviations
- ADC
apparent diffusion coefficient
- CHESS
chemical shift selective
- CSDE
chemical shift displacement error
- CSF
cerebrospinal fluid
- ECLIPSE
elliptical localization with pulsed second-order fields
- FOV
field of view
- GABA
γ-aminobutyric acid
- GM
gray matter
- IR
inversion recovery
- OVS
outer-volume suppression
- MC
metabolite cycling
- MT
magnetization transfer
- MRSI
MR spectroscopic imaging
- NOE
nuclear Overhauser effect
- PSF
point spread function
- PCC
posterior cingulate cortex
- ROI
region of interest
- SAR
specific absorption rate
- SENSE
sensitivity encoding
- SLR
Shinnar – Le Roux
- STIR
short tau inversion recovery
- tNAA
total N-acetylaspartate
- TIR
inversion recovery time
- VAPOR
variable pulse power and optimized relaxation delays
- VOI
volume of interest
- VSS
very selective saturation
- WET
water suppression enhanced through T1 effects
- WM
white matter
- WS
water suppression
Data availability:
Data sharing is not applicable for this article.
REFERENCES
- 1.Oz G, Alger JR, Barker PB, et al. Clinical proton MR spectroscopy in central nervous system disorders. Radiology. 2014;270(3):658–679. [DOI] [PMC free article] [PubMed] [Google Scholar]
- 2.Wilson M, Andronesi O, Barker PB, et al. Methodological consensus on clinical proton MRS of the brain: Review and recommendations. Magn Reson Med. 2019;82(2):527–550. [DOI] [PMC free article] [PubMed] [Google Scholar]
- 3.Cudalbu C Contribution of macromolecules to brain 1H MR spectra: Experts' consensus recommendations. NMR Biomed. 2021;34(5):e4393. [DOI] [PMC free article] [PubMed] [Google Scholar]
- 4.McIntyre DJ, Charlton RA, Markus HS, Howe FA. Long and short echo time proton magnetic resonance spectroscopic imaging of the healthy aging brain. J Magn Reson Imaging. 2007;26(6):1596–1606. [DOI] [PubMed] [Google Scholar]
- 5.Delikatny EJ, Chawla S, Leung DJ, Poptani H. MR-visible lipids and the tumor microenvironment. NMR Biomed. 2011;24(6):592–611. [DOI] [PMC free article] [PubMed] [Google Scholar]
- 6.Howe FA, Barton SJ, Cudlip SA, et al. Metabolic profiles of human brain tumors using quantitative in vivo 1H magnetic resonance spectroscopy. Magn Reson Med. 2003;49(2):223–232. [DOI] [PubMed] [Google Scholar]
- 7.Oz G, Tkac I, Charnas LR, et al. Assessment of adrenoleukodystrophy lesions by high field MRS in non-sedated pediatric patients. Neurology. 2005;64(3):434–441. [DOI] [PubMed] [Google Scholar]
- 8.Saunders DE, Howe FA, van den Boogaart A, Griffiths JR, Brown MM. Discrimination of metabolite from lipid and macromolecule resonances in cerebral infarction in humans using short echo proton spectroscopy. J Magn Reson Imaging. 1997;7(6):1116–1121. [DOI] [PubMed] [Google Scholar]
- 9.Zaaraoui W, Rico A, Audoin B, et al. Unfolding the long-term pathophysiological processes following an acute inflammatory demyelinating lesion of multiple sclerosis. Magn Reson Imaging. 2010;28(4):477–486. [DOI] [PubMed] [Google Scholar]
- 10.Kreis R, Boer V, Choi IY, et al. Terminology and concepts for the characterization of in vivo MR spectroscopy methods and MR spectra: Background and experts' consensus recommendations. NMR Biomed. 2021;34(5):e4347. [DOI] [PMC free article] [PubMed] [Google Scholar]
- 11.Zheng G, Price WS. Solvent signal suppression in NMR. Prog Nucl Magn Reson Spectrosc. 2010;56(3):267–288. [DOI] [PubMed] [Google Scholar]
- 12.Hore PJ. Solvent suppression in Fourier-transform nuclear magnetic resonance. J Magn Reson. 1983;55(2):283–300. [Google Scholar]
- 13.Piotto M, Saudek V, Sklenar V. Gradient-tailored excitation for single-quantum NMR spectroscopy of aqueous solutions. J Biomol NMR. 1992;2(6):661–665. [DOI] [PubMed] [Google Scholar]
- 14.Hetherington HP, Pan JW, Mason GF, et al. 2D 1H spectroscopic imaging of the human brain at 4.1 T. Magn Reson Med. 1994;32(4):530–534. [DOI] [PubMed] [Google Scholar]
- 15.Hetherington HP, Avdievich NI, Kuznetsov AM, Pan JW. RF shimming for spectroscopic localization in the human brain at 7 T. Magn Reson Med. 2010;63(1):9–19. [DOI] [PMC free article] [PubMed] [Google Scholar]
- 16.Rooney WD, Johnson G, Li X, et al. Magnetic field and tissue dependencies of human brain longitudinal 1H2O relaxation in vivo. Magn Reson Med. 2007;57(2):308–318. [DOI] [PubMed] [Google Scholar]
- 17.de Graaf RA, Luo Y, Garwood M, Nicolay K. B1-insensitive, single-shot localization and water suppression. J Magn Reson B. 1996;113(1):35–45. [DOI] [PubMed] [Google Scholar]
- 18.Ernst T, Hennig J. Improved water suppression for localized in vivo 1H spectroscopy. J Magn Reson B. 1995;106(2):181–186. [DOI] [PubMed] [Google Scholar]
- 19.Frahm J, Bruhn H, Gyngell ML, Merboldt KD, Hanicke W, Sauter R. Localized high-resolution proton NMR spectroscopy using stimulated echoes: initial applications to human brain in vivo. Magn Reson Med. 1989;9(1):79–93. [DOI] [PubMed] [Google Scholar]
- 20.Haase A, Frahm J, Hanicke W, Matthaei D. 1H NMR chemical shift selective (CHESS) imaging. Phys Med Biol. 1985;30(4):341–344. [DOI] [PubMed] [Google Scholar]
- 21.Mescher M, Tannus A, Johnson MO, Garwood M. Solvent suppression using selective echo dephasing. J Magn Reson A. 1996;123(2):226–229. [Google Scholar]
- 22.Ogg RJ, Kingsley PB, Taylor JS. WET, a T1- and B1-insensitive water-suppression method for in vivo localized 1H NMR spectroscopy. J Magn Reson B. 1994;104(1):1–10. [DOI] [PubMed] [Google Scholar]
- 23.Tkac I, Gruetter R. Methodology of 1H NMR spectroscopy of the human brain at very high magnetic fields. Appl Magn Reson. 2005;29(1):139–157. [DOI] [PMC free article] [PubMed] [Google Scholar]
- 24.Tkac I, Starcuk Z, Choi IY, Gruetter R. In vivo 1H NMR spectroscopy of rat brain at 1 ms echo time. Magn Reson Med. 1999;41(4):649–656. [DOI] [PubMed] [Google Scholar]
- 25.Tkac I, Andersen P, Adriany G, Merkle H, Ugurbil K, Gruetter R. In vivo 1H NMR spectroscopy of the human brain at 7 T. Magn Reson Med. 2001;46(3):451–456. [DOI] [PubMed] [Google Scholar]
- 26.Oz G, Tkac I. Short-Echo, Single-Shot, Full-Intensity Proton Magnetic Resonance Spectroscopy for Neurochemical Profiling at 4 T: Validation in the Cerebellum and Brainstem. Magn Reson Med. 2011;65(4):901–910. [DOI] [PMC free article] [PubMed] [Google Scholar]
- 27.Oz G, Deelchand DK, Wijnen JP, et al. Advanced single voxel 1H magnetic resonance spectroscopy techniques in humans: Experts' consensus recommendations. NMR Biomed. 2021;34(5):e4236. [DOI] [PMC free article] [PubMed] [Google Scholar]
- 28.Duyn JH, Schenck J. Contributions to magnetic susceptibility of brain tissue. NMR Biomed. 2017;30(4): 10.1002/nbm.3546. [DOI] [PMC free article] [PubMed] [Google Scholar]
- 29.Hong D, van Asten JJA, Rankouhi SR, Thielen JW, Norris DG. Implications of the magnetic susceptibility difference between grey and white matter for single-voxel proton spectroscopy at 7T. J Magn Reson. 2018;297:51–60. [DOI] [PubMed] [Google Scholar]
- 30.Carlsson A, Ljungberg M, Starck G, Forssell-Aronsson E. Degraded water suppression in small volume 1H MRS due to localised shimming. MAGMA. 2011;24(2):97–107. [DOI] [PubMed] [Google Scholar]
- 31.Boer VO, Klomp DW, Juchem C, Luijten PR, de Graaf RA. Multislice 1H MRSI of the human brain at 7 T using dynamic B0 and B1 shimming. Magn Reson Med. 2012;68(3):662–670. [DOI] [PMC free article] [PubMed] [Google Scholar]
- 32.Zaiss M, Bachert P. Chemical exchange saturation transfer (CEST) and MR Z-spectroscopy in vivo: a review of theoretical approaches and methods. Phys Med Biol. 2013;58(22):R221–269. [DOI] [PubMed] [Google Scholar]
- 33.de Graaf RA, van Kranenburg A, Nicolay K. Off-resonance metabolite magnetization transfer measurements on rat brain in situ. Magn Reson Med. 1999;41(6):1136–1144. [DOI] [PubMed] [Google Scholar]
- 34.Dreher W, Norris DG, Leibfritz D. Magnetization transfer affects the proton creatine/phosphocreatine signal intensity: in vivo demonstration in the rat brain. Magn Reson Med. 1994;31(1):81–84. [DOI] [PubMed] [Google Scholar]
- 35.MacMillan EL, Chong DG, Dreher W, Henning A, Boesch C, Kreis R. Magnetization exchange with water and T1 relaxation of the downfield resonances in human brain spectra at 3.0 T. Magn Reson Med. 2011;65(5):1239–1246. [DOI] [PubMed] [Google Scholar]
- 36.Fichtner ND, Giapitzakis IA, Avdievich N, et al. In vivo characterization of the downfield part of 1H MR spectra of human brain at 9.4 T: Magnetization exchange with water and relation to conventionally determined metabolite content. Magn Reson Med. 2018;79(6):2863–2873. [DOI] [PubMed] [Google Scholar]
- 37.Deelchand DK, Henry PG. Effect of water suppression and metabolite cycling on quantification of 1H MRS spectra in the human brain at 3 Tesla. Proc 28th Ann Sci Meeting ISMRM (virtual). 2020. [Google Scholar]
- 38.Scheenen TW, Heerschap A, Klomp DW. Towards 1H-MRSI of the human brain at 7T with slice-selective adiabatic refocusing pulses. MAGMA. 2008;21(1-2):95–101. [DOI] [PMC free article] [PubMed] [Google Scholar]
- 39.Scheenen TW, Klomp DW, Wijnen JP, Heerschap A. Short echo time 1H-MRSI of the human brain at 3T with minimal chemical shift displacement errors using adiabatic refocusing pulses. Magn Reson Med. 2008;59(1):1–6. [DOI] [PubMed] [Google Scholar]
- 40.Kreis R, Boesch C. Localized 1H-MRS without water suppression: techniques and initial results for human brain and muscle. Proc 6th Ann Sci Meeting ISMRM, Sydney. 1998. [Google Scholar]
- 41.Hurd RE, Gurr D, Sailasuta N. Proton spectroscopy without water suppression: the oversampled J-resolved experiment. Magn Reson Med. 1998;40(3):343–347. [DOI] [PubMed] [Google Scholar]
- 42.Middleton DA, Hockings PD, Glen S, et al. Image directed proton spectroscopy of gerbil brain at 7 tesla. NMR Biomed. 1995;8(3):118–126. [DOI] [PubMed] [Google Scholar]
- 43.Shemesh N, Dumez JN, Frydman L. Longitudinal relaxation enhancement in 1H NMR spectroscopy of tissue metabolites via spectrally selective excitation. Chemistry. 2013;19(39):13002–13008. [DOI] [PubMed] [Google Scholar]
- 44.Serrai H, Senhadji L, Clayton DB, Zuo C, Lenkinski RE. Water modeled signal removal and data quantification in localized MR spectroscopy using a time-scale postacquistion method. J Magn Reson. 2001;149(1):45–51. [DOI] [PubMed] [Google Scholar]
- 45.Dong Z, Dreher W, Leibfritz D. Experimental method to eliminate frequency modulation sidebands in localized in vivo 1H MR spectra acquired without water suppression. Magn Reson Med. 2004;51(3):602–606. [DOI] [PubMed] [Google Scholar]
- 46.Dreher W, Leibfritz D. New method for the simultaneous detection of metabolites and water in localized in vivo 1H nuclear magnetic resonance spectroscopy. Magn Reson Med. 2005;54(1):190–195. [DOI] [PubMed] [Google Scholar]
- 47.Leibfritz D, Dreher W. Magnetization transfer MRS. NMR Biomed. 2001;14(2):65–76. [DOI] [PubMed] [Google Scholar]
- 48.Hock A, MacMillan EL, Fuchs A, et al. Non-water-suppressed proton MR spectroscopy improves spectral quality in the human spinal cord. Magn Reson Med. 2013;69(5):1253–1260. [DOI] [PubMed] [Google Scholar]
- 49.Doring A, Adalid V, Boesch C, Kreis R. Diffusion-weighted magnetic resonance spectroscopy boosted by simultaneously acquired water reference signals. Magn Reson Med. 2018;80(6):2326–2338. [DOI] [PubMed] [Google Scholar]
- 50.Doring A, Kreis R. Magnetic resonance spectroscopy extended by oscillating diffusion gradients: Cell-specific anomalous diffusion as a probe for tissue microstructure in human brain. Neuroimage. 2019;202:116075. [DOI] [PubMed] [Google Scholar]
- 51.Emir UE, Burns B, Chiew M, Jezzard P, Thomas MA. Non-water-suppressed short-echo-time magnetic resonance spectroscopic imaging using a concentric ring k-space trajectory. NMR Biomed. 2017;30(7):e3714. [DOI] [PMC free article] [PubMed] [Google Scholar]
- 52.Giapitzakis IA, Avdievich N, Murali MS, Fichtner ND, Kreis R, Henning A. Functional magnetic resonance spectroscopy (fMRS) using metabolite cycled semi-LASER at 9.4T: A Pilot Study. Proc 25th Ann Sci Meeting ISMRM, Honolulu. 2017. [Google Scholar]
- 53.Giapitzakis IA, Shao T, Avdievich N, Mekle R, Kreis R, Henning A. Metabolite-cycled STEAM and semi-LASER localization for MR spectroscopy of the human brain at 9.4T. Magn Reson Med. 2018;79(4):1841–1850. [DOI] [PubMed] [Google Scholar]
- 54.Dong Z Proton MRS and MRSI of the brain without water suppression. Prog Nucl Magn Reson Spectrosc. 2015;86-87:65–79. [DOI] [PubMed] [Google Scholar]
- 55.Bogner W, Gruber S, Trattnig S, Chmelik M. High-resolution mapping of human brain metabolites by free induction decay 1H MRSI at 7 T. NMR Biomed. 2012;25(6):873–882. [DOI] [PubMed] [Google Scholar]
- 56.Hangel G, Strasser B, Povazan M, et al. Lipid suppression via double inversion recovery with symmetric frequency sweep for robust 2D-GRAPPA-accelerated MRSI of the brain at 7 T. NMR Biomed. 2015;28(11):1413–1425. [DOI] [PMC free article] [PubMed] [Google Scholar]
- 57.Povazan M, Strasser B, Hangel G, et al. Simultaneous mapping of metabolites and individual macromolecular components via ultra-short acquisition delay 1H MRSI in the brain at 7T. Magn Reson Med. 2018;79(3):1231–1240. [DOI] [PMC free article] [PubMed] [Google Scholar]
- 58.Wijnen JP, van Asten JJ, Klomp DW, et al. Short echo time 1H MRSI of the human brain at 3T with adiabatic slice-selective refocusing pulses; reproducibility and variance in a dual center setting. J Magn Reson Imaging. 2010;31(1):61–70. [DOI] [PubMed] [Google Scholar]
- 59.Adany P, Choi IY, Lee P. B0-adjusted and sensitivity-encoded spectral localization by imaging (BASE-SLIM) in the human brain in vivo. Neuroimage. 2016;134:355–364. [DOI] [PMC free article] [PubMed] [Google Scholar]
- 60.Boer VO, van de Lindt T, Luijten PR, Klomp DW. Lipid suppression for brain MRI and MRSI by means of a dedicated crusher coil. Magn Reson Med. 2015;73(6):2062–2068. [DOI] [PubMed] [Google Scholar]
- 61.Coello E, Noeske R, Burns BL, et al. High-resolution echo-planar spectroscopic imaging at ultra-high field. NMR Biomed. 2018;31(11):e3950. [DOI] [PubMed] [Google Scholar]
- 62.Henning A, Fuchs A, Murdoch JB, Boesiger P. Slice-selective FID acquisition, localized by outer volume suppression (FIDLOVS) for 1H-MRSI of the human brain at 7 T with minimal signal loss. NMR Biomed. 2009;22(7):683–696. [DOI] [PubMed] [Google Scholar]
- 63.Iqbal Z, Wilson NE, Thomas MA. 3D spatially encoded and accelerated TE-averaged echo planar spectroscopic imaging in healthy human brain. NMR Biomed. 2016;29(3):329–339. [DOI] [PubMed] [Google Scholar]
- 64.Schreiner SJ, Kirchner T, Wyss M, et al. Low episodic memory performance in cognitively normal elderly subjects is associated with increased posterior cingulate gray matter N-acetylaspartate: a 1H MRSI study at 7 Tesla. Neurobiol Aging. 2016;48:195–203. [DOI] [PubMed] [Google Scholar]
- 65.Hangel G, Strasser B, Povazan M, et al. Ultra-high resolution brain metabolite mapping at 7 T by short-TR Hadamard-encoded FID-MRSI. Neuroimage. 2018;168:199–210. [DOI] [PubMed] [Google Scholar]
- 66.Chang P, Nassirpour S, Avdievitch N, Henning A. Non-water-suppressed 1H FID-MRSI at 3T and 9.4T. Magn Reson Med. 2018;80(2):442–451. [DOI] [PubMed] [Google Scholar]
- 67.Posse S, Otazo R, Dager SR, Alger J. MR spectroscopic imaging: principles and recent advances. J Magn Reson Imaging. 2013;37(6):1301–1325. [DOI] [PMC free article] [PubMed] [Google Scholar]
- 68.Duyn JH, Gillen J, Sobering G, van Zijl PC, Moonen CT. Multisection proton MR spectroscopic imaging of the brain. Radiology. 1993;188(1):277–282. [DOI] [PubMed] [Google Scholar]
- 69.Chu A, Alger JR, Moore GJ, Posse S. Proton echo-planar spectroscopic imaging with highly effective outer volume suppression using combined presaturation and spatially selective echo dephasing. Magn Reson Med. 2003;49(5):817–821. [DOI] [PubMed] [Google Scholar]
- 70.Osorio JA, Xu D, Cunningham CH, et al. Design of cosine modulated very selective suppression pulses for MR spectroscopic imaging at 3T. Magn Reson Med. 2009;61(3):533–540. [DOI] [PMC free article] [PubMed] [Google Scholar]
- 71.Henning A, Schar M, Schulte RF, Wilm B, Pruessmann KP, Boesiger P. SELOVS: brain MRSI localization based on highly selective T1- and B1-insensitive outer-volume suppression at 3T. Magn Reson Med. 2008;59(1):40–51. [DOI] [PubMed] [Google Scholar]
- 72.Tran TK, Vigneron DB, Sailasuta N, et al. Very selective suppression pulses for clinical MRSI studies of brain and prostate cancer. Magn Reson Med. 2000;43(1):23–33. [DOI] [PubMed] [Google Scholar]
- 73.Ozhinsky E, Vigneron DB, Nelson SJ. Improved spatial coverage for brain 3D PRESS MRSI by automatic placement of outer-volume suppression saturation bands. J Magn Reson Imaging. 2011;33(4):792–802. [DOI] [PMC free article] [PubMed] [Google Scholar]
- 74.Kumaragamage C, De Feyter HM, Brown P, McIntyre S, Nixon TW, de Graaf RA. Robust outer volume suppression utilizing elliptical pulsed second order fields (ECLIPSE) for human brain proton MRSI. Magn Reson Med. 2019;83(5):1539–1552. [DOI] [PMC free article] [PubMed] [Google Scholar]
- 75.Bydder GM, Young IR. MR imaging: clinical use of the inversion recovery sequence. J Comput Assist Tomogr. 1985;9(4):659–675. [PubMed] [Google Scholar]
- 76.Spielman DM, Pauly JM, Macovski A, Glover GH, Enzmann DR. Lipid-suppressed single- and multisection proton spectroscopic imaging of the human brain. J Magn Reson Imaging. 1992;2(3):253–262. [DOI] [PubMed] [Google Scholar]
- 77.Hetherington HP, Mason GF, Pan JW, et al. Evaluation of cerebral gray and white matter metabolite differences by spectroscopic imaging at 4.1T. Magn Reson Med. 1994;32(5):565–571. [DOI] [PubMed] [Google Scholar]
- 78.Ebel A, Govindaraju V, Maudsley AA. Comparison of inversion recovery preparation schemes for lipid suppression in 1H MRSI of human brain. Magn Reson Med. 2003;49(5):903–908. [DOI] [PubMed] [Google Scholar]
- 79.Gu M, Spielman DM. B1 and T1 insensitive water and lipid suppression using optimized multiple frequency-selective preparation pulses for whole-brain 1H spectroscopic imaging at 3T. Magn Reson Med. 2009;61(2):462–466. [DOI] [PMC free article] [PubMed] [Google Scholar]
- 80.Zhu H, Ouwerkerk R, Barker PB. Dual-band water and lipid suppression for MR spectroscopic imaging at 3 Tesla. Magn Reson Med. 2010;63(6):1486–1492. [DOI] [PMC free article] [PubMed] [Google Scholar]
- 81.Zhu H, Soher BJ, Ouwerkerk R, Schar M, Barker PB. Spin-echo magnetic resonance spectroscopic imaging at 7 T with frequency-modulated refocusing pulses. Magn Reson Med. 2013;69(5):1217–1225. [DOI] [PMC free article] [PubMed] [Google Scholar]
- 82.Strasser B, Povazan M, Hangel G, et al. (2 + 1)D-CAIPIRINHA accelerated MR spectroscopic imaging of the brain at 7T. Magn Reson Med. 2017;78(2):429–440. [DOI] [PMC free article] [PubMed] [Google Scholar]
- 83.Skoch A, Jiru F, Bunke J. Spectroscopic imaging: basic principles. Eur J Radiol. 2008;67(2):230–239. [DOI] [PubMed] [Google Scholar]
- 84.Maudsley AA, Andronesi OC, Barker PB, et al. Advanced magnetic resonance spectroscopic neuroimaging: Experts' consensus recommendations. NMR Biomed. 2021;34:e4309. [DOI] [PMC free article] [PubMed] [Google Scholar]
- 85.Boer VO, Siero JC, Hoogduin H, van Gorp JS, Luijten PR, Klomp DW. High-field MRS of the human brain at short TE and TR. NMR Biomed. 2011;24(9):1081–1088. [DOI] [PubMed] [Google Scholar]
- 86.Bilgic B, Chatnuntawech I, Fan AP, et al. Fast image reconstruction with L2-regularization. J Magn Reson Imaging. 2014;40(1):181–191. [DOI] [PMC free article] [PubMed] [Google Scholar]
- 87.Bilgic B, Gagoski B, Kok T, Adalsteinsson E. Lipid suppression in CSI with spatial priors and highly undersampled peripheral k-space. Magn Reson Med. 2013;69(6):1501–1511. [DOI] [PMC free article] [PubMed] [Google Scholar]
- 88.Hingerl L, Bogner W, Moser P, et al. Density-weighted concentric circle trajectories for high resolution brain magnetic resonance spectroscopic imaging at 7T. Magn Reson Med. 2018;79(6):2874–2885. [DOI] [PMC free article] [PubMed] [Google Scholar]
- 89.Nassirpour S, Chang P, Henning A. High and ultra-high resolution metabolite mapping of the human brain using 1H FID MRSI at 9.4T. Neuroimage. 2018;168:211–221. [DOI] [PubMed] [Google Scholar]
- 90.Avdievich NI. Transceiver-Phased Arrays for Human Brain Studies at 7 T. Appl Magn Reson. 2011;41(2-4):483–506. [DOI] [PMC free article] [PubMed] [Google Scholar]
- 91.de Graaf RA, Brown PB, De Feyter HM, McIntyre S, Nixon TW. Elliptical localization with pulsed second-order fields (ECLIPSE) for robust lipid suppression in proton MRSI. NMR Biomed. 2018;31(9):e3949. [DOI] [PMC free article] [PubMed] [Google Scholar]
- 92.Juchem C, Nixon TW, McIntyre S, Boer VO, Rothman DL, de Graaf RA. Dynamic multi-coil shimming of the human brain at 7 T. J Magn Reson. 2011;212(2):280–288. [DOI] [PMC free article] [PubMed] [Google Scholar]
Associated Data
This section collects any data citations, data availability statements, or supplementary materials included in this article.
Supplementary Materials
Data Availability Statement
Data sharing is not applicable for this article.