Abstract
Objective
Epithelial-mesenchymal transition (EMT) exerts a key function in cancer initiation and progression. Herein, we aimed to develop an EMT-based prognostic signature in gastric cancer.
Methods
The gene expression profiles of gastric cancer were obtained from TCGA dataset as a training set and GSE66229 and GSE84437 datasets as validation sets. By LASSO regression and Cox regression analyses, key prognostic EMT-related genes were screened for developing a risk score (RS) model. Potential small molecular compounds were predicted by the CMap database based on the RS model. GSEA was employed to explore signaling pathways associated with the RS. ESTIMATE and seven algorithms (TIMER, CIBERSORT, CIBERSORT-ABS, QUANTISEQ, MCPCOUNTER, XCELL, and EPIC) were applied to assess the RS and immune microenvironment.
Results
This study developed an EMT-related gene signature comprised of SERPINE1, PCOLCE2, MATN3, and DKK1. High-RS patients displayed poorer survival outcomes than those with low RS. ROC curves demonstrated the robustness of the model in predicting the prognosis. After external validation, the RS model was an independent risk factor for gastric cancer. Several compounds were predicted for gastric cancer treatment based on the RS model. ECM receptor interaction, focal adhesion, pathway in cancer, TGF-beta, and WNT pathways were distinctly activated in high-RS samples. Also, high RS was significantly associated with increased stromal and immune scores and increased infiltration of CD4+ T cell, CD8+ T cell, cancer-associated fibroblast, and macrophage in gastric cancer tissues.
Conclusion
Our findings suggested that the EMT-related gene model may robustly predict gastric cancer prognosis, which could improve the efficacy of personalized therapy.
1. Introduction
Gastric cancer represents a common aggressive malignancy and a common cause of cancer-related deaths globally due to its rapid progress to advanced stages and badly metastatic characteristics [1]. The incidence and prevalence of gastric cancer vary geographically [2]. Despite the improvement in clinical outcomes by implementing standard D2 lymphadenectomy as well as development of chemotherapy and targeted therapy, the overall survival rate of gastric cancer patients is <30% [3]. As a heterogeneous malignancy [4], survival outcomes may greatly vary even for subjects with similar clinical characteristics and therapy regimens, indicating that traditional clinicopathologic characteristics are inadequate for prognosis prediction and risk stratification [5]. Hence, it is important to develop novel clinical tools for predicting the prognosis of gastric cancer.
Epithelial-mesenchymal transition (EMT), a well-characterized embryological process, is a critical molecular step during the process of distant metastases [6–8]. Clinically, EMT is in relation to unfavorable survival outcomes of gastric cancer [9]. During the EMT process, gastric cancer cells lose the expression of cellular adhesion proteins like E-cadherin and tight junction proteins as well as express many mesenchymal markers like N-cadherin, Vimentin, and ZEB1 [10]. The mesenchymal phenotype also may raise resistance to chemotherapy and contribute to a desirable prognosis [11]. Therefore, an in-depth comprehension on the mechanisms of the EMT process in gastric cancer is required for promoting the progress of specific treatment strategies. Because various large datasets are easily accessible, exploring the gene signatures underlying the mechanisms of gastric cancer has flourished [12–14]. Despite the extensive research on the mechanisms of EMT in gastric cancer, the prognostic value of EMT-related genes is still inconclusive. Hence, this study constructed an EMT-based signature for predicting survival outcomes of gastric cancer patients. After external verification, this signature might be a robust prognostic prediction tool and assist clinical strategy.
2. Materials and Methods
2.1. Gene Expression Profiles and Data Processing
RNA-sequencing (RNA-seq) profiles of 32 normal samples and 350 gastric cancer samples were downloaded from The Cancer Genome Atlas (TCGA) via Genomic Data Commons (GDC; https://portal.gdc.cancer.gov/). Also, the matched clinical information was also retrieved. RNA-seq data were converted to transcripts per kilobase million (TPM) values. This dataset was used as the training set. From the Gene Expression Omnibus (GEO; http://www.ncbi.nlm.nih.gov/geo/), microarray expression profiling and clinical information of 400 cases of gastric cancer were retrieved from the GSE66229 dataset on the GPL570 platform ([HG-U133_Plus_2] Affymetrix Human Genome U133 Plus 2.0 Array) [15]. Furthermore, expression profiles and clinical features of 433 gastric cancer were obtained from the GSE84437 dataset on the GPL6947 platform (Illumina HumanHT-12 V3.0 expression beadchip) [16]. The raw microarray data were adjusted by background, normalized, and log transformed. The GSE66229 and GSE84437 datasets were employed as the validation sets. The “HALLMARK_EPITHELIAL_MESENCHYMAL_TRANSITION” gene set was retrieved from the Gene Set Enrichment Analysis (GSEA) database (http://software.broadinstitute.org/gsea/index.jsp) [17] (Supplementary Table 1).
2.2. Differential Expression Analysis
The expression of EMT-related genes in 350 gastric cancer tissue specimens was compared with 32 normal tissues in TCGA dataset using the limma package [18]. The ∣log fold‐change | >1 and adjusted p < 0.05 were set as cutoff criteria. Differentially expressed EMT-related genes were visualized into volcano plots and heatmaps.
2.3. Functional and Pathway Enrichment Analysis
Biological functions of differentially expressed EMT-related genes were analyzed via the clusterProfiler package, containing Gene Ontology (GO) and Kyoto Encyclopedia of Genes and Genomes (KEGG) pathway enrichment analysis [19]. Terms with false discovery rate (FDR) < 0.05 were significantly enriched.
2.4. Small Molecular Compound Prediction
Differentially expressed genes with ∣log fold‐change | >1 and adjusted p < 0.05 were screened between the high- and low-RS groups. Then, up- and downregulated tags were separately uploaded onto Connectivity Map (CMap) [20]. The match between these genes and small molecular compounds from CMap was evaluated through a connectivity score from −1 to 1. Positive scores denote stimulative effects of compounds on the query signatures. Meanwhile, negative scores implicate inhibitory effects of compounds on the query signatures.
2.5. Generation and Verification of a Risk Score (RS) Model
In TCGA dataset, differentially expressed EMT-related genes with prognostic value were filtered via univariate Cox regression analyses. Genes with p < 0.05 were included for least absolute shrinkage and selection operator (LASSO) Cox regression model analyses using the glmnet package [21]. The penalized Cox regression model with LASSO penalty was employed for achieving shrinkage and variable selection. Tenfold cross-validation was presented for determining the optimal value of the penalty parameter λ. Based on λ value, factors with the matched coefficients were chosen. RS of each patient was determined on the basis of the expression levels of genes and their coefficients. According to the median value, patients were split into the high- and low-RS groups. Kaplan-Meier curves and log-rank test were employed for analyzing the overall survival (OS) difference between the high- and low-RS groups. Receiver operating characteristic (ROC) analysis was conducted for detecting the predictive accuracy of this RS model in the prognosis. Furthermore, the RS model was externally validated in the GSE66229 and GSE84437 datasets.
2.6. Screening Independent Prognostic Factors
Univariate Cox regression analysis was applied for evaluating the significance of the RS model and clinical characteristics in predicting gastric cancer patients' OS. Factors with p < 0.05 were included for multivariable logistic regression analysis, and confounding factors were excluded. The hazard ratio (HR) and 95% confidence interval (CI) were calculated. The results were visualized into a forest plot.
2.7. Subgroup Analysis
To evaluate the predictive sensitivity of the RS model in gastric cancer OS, patients were split into subgroups based on clinical features, as follows: age (>65 and ≤65), gender (female and male), M (M0 and M1), N (N0 and N1-3), T (T1-2 and T3-4), and stage (I-II and III-IV). The survival difference between the high- and low-RS samples was compared in each subgroup.
2.8. Development of a Prognostic Nomogram
RS and traditional clinicopathological characteristics were included in the nomogram through the rms package. To assess the performance of the nomogram in predicting 1-, 3-, and 5-year OS time, nomogram-predicted OS probability was compared with actual survival time by calibration curves. Furthermore, the predictive efficacy of this nomogram was externally verified in the GSE66229 and GSE84437 datasets.
2.9. GSEA
The GSEA method was applied for exploring the potential KEGG pathways activated in high-RS gastric cancer samples. The reference gene set was retrieved from “c2.cp.kegg.v7.1.symbols” file. The significantly enriched pathways were screened with FDR < 0.05.
2.10. Estimation of Immune Score, Stromal Score, and Tumor Purity
The immune score, stromal score, and tumor purity were estimated in gastric cancer tissue specimens via the Estimation of STromal and Immune cells in MAlignant Tumor tissues using Expression data (ESTIMATE) algorithm [22].
2.11. Analysis of Immune Cell Infiltrations
To reveal the associations of the risk score and diverse tumor-infiltrating immune cells, seven algorithms including TIMER, CIBERSORT, CIBERSORT-ABS, QUANTISEQ, MCPCOUNTER, XCELL, and EPIC were applied for quantifying the infiltration levels. Differences in immune-infiltrating cell fractions were estimated between the high- and low-risk groups.
2.12. Statistical Analysis
All statistical analyses were conducted using R software (version 3.6.2; https://www.r-project.org/). Comparisons between groups were carried out with Student's t-test and Wilcoxon rank-sum test. The Spearman correlation test was applied to assess the correlation between immune cells. p values < 0.05 were considered statistically significant.
3. Results
3.1. Identification of Dysregulated EMT-Related Genes and Their Functions in Gastric Cancer
Following the comparison of expression of EMT-related genes between gastric cancer and normal tissues, 79 differentially expressed EMT-related genes with ∣log fold‐change | >1 and adjusted p < 0.05 were identified (Supplementary Table 2). Among them, 67 EMT-related genes were upregulated and 12 were downregulated in gastric cancer (Figures 1(a) and 1(b)). GO enrichment analyses were conducted to elucidate the functional characteristics of these differentially expressed EMT-related genes. Our data showed that these genes were markedly enriched in extracellular matrix (ECM) organization, extracellular structure organization, and collagen fibril organization (Figure 1(c)). Meanwhile, these genes were distinctly related to several key pathways like focal adhesion, ECM-receptor interaction, PI3K-Akt signaling pathway, and proteoglycans in cancer (Figure 1(d)). Hence, it is required to illustrate their clinical implications in gastric cancer.
Figure 1.
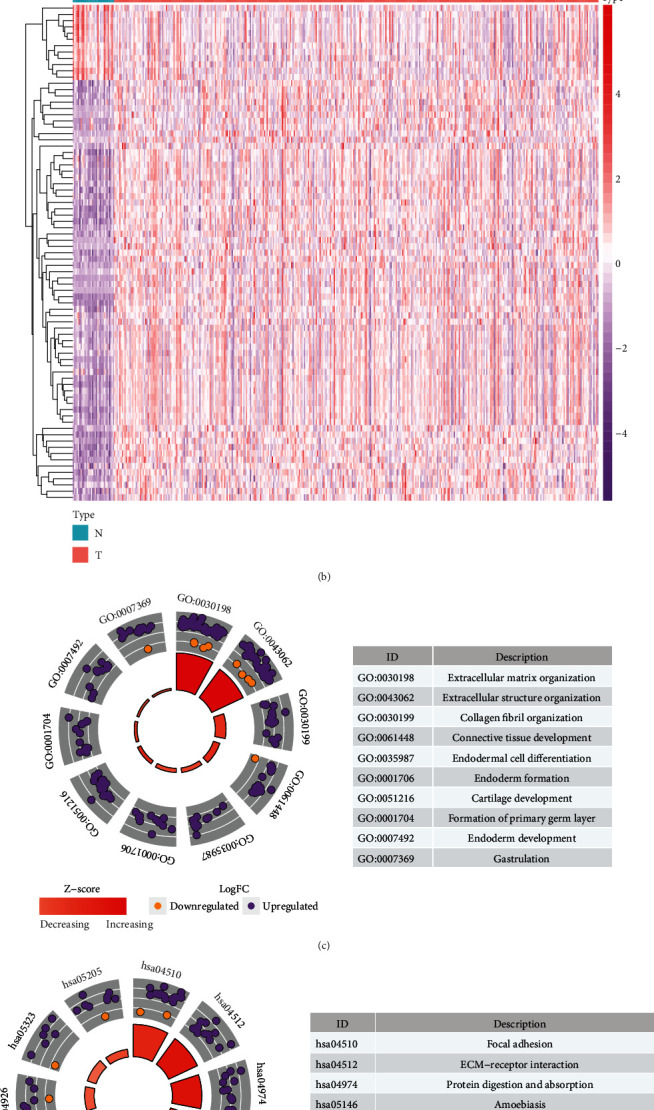
Identification of dysregulated EMT-related genes, biological functions in gastric cancer. (a) Volcano plot depicting the dysregulated EMT-related genes between gastric cancer and normal tissues. X-axis represents log fold-change, and Y-axis indicates -log10 (adjusted p value). Red and green dots represent up- and downregulated EMT-related genes in gastric cancer, and black dots represent no significant genes. (b) Heatmaps for dysregulated EMT-related genes between tumor and normal tissues. X-axis represents the sample type, and Y-axis depicts dysregulated EMT-related genes. Red and blue show up- and downregulation in gastric cancer, respectively. (c, d) The top ten GO and KEGG terms enriched by dysregulated EMT-related genes.
3.2. Generation of a Prognostic EMT-Related RS Model for Gastric Cancer
By the mRNA expression profiling of TCGA dataset, we screened 35 EMT-related genes associated with OS of gastric cancer with univariable Cox regression analysis (Figure 2(a); Table 1). These genes were further analyzed using LASSO Cox regression model analysis. As a result, we generated a 4-EMT-related gene model for gastric cancer (Figures 2(b) and 2(c)). The RS was determined for each gastric cancer, as follows: RS = 0.127258355254692∗SERPINE1 expression + 0.04303645817321∗PCOLCE2 expression + 0.128510051263955∗MATN3 expression + 0.0116209970037921∗DKK1 expression. Because the median RS was convenient for clinical application, this study set the median value as the cutoff value, and patients were split into the high- and low-RS groups (Figure 2(d)). We compared the survival status between groups. In Figure 2(e), more deaths occurred in the high-RS group. Furthermore, for each patient, high RS was indicative of an unfavorable prognosis (p = 8.321e − 05; Figure 2(f)). However, there was no significant difference in clinical characteristics between the high- and low-RS groups (Table 2). The area under the curve (AUC) of the RS model was 0.763, indicating good performance in predicting patients' OS (Figure 2(g)). Our univariate Cox regression analysis showed that age (p = 0.033), stage (p = 0.002), N (p = 0.022), and RS (p < 0.001) were distinctly associated with a poor prognosis (Figure 2(h)). Under multivariate Cox regression analysis, age (p = 0.004), stage (p = 0.005), and RS (p < 0.001) were independent risk factors for the gastric cancer prognosis (Figure 2(i)).
Figure 2.
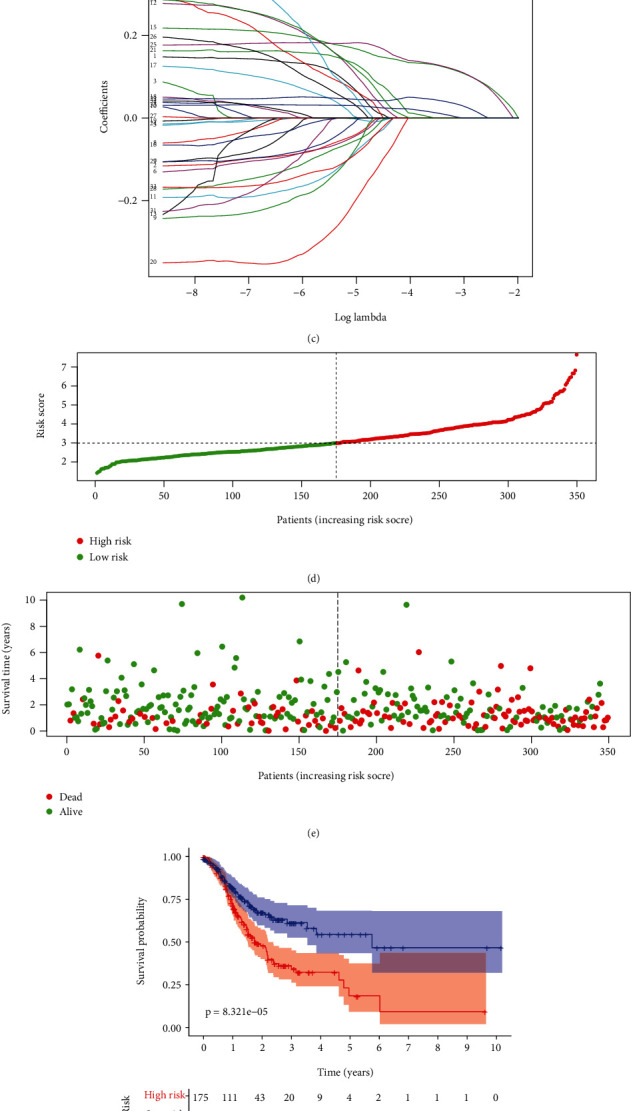
Generation of a prognostic EMT-related gene model for gastric cancer in TCGA dataset. (a) Univariate Cox regression analysis for prognosis-related EMT-related genes in gastric cancer. (b) Selecting the optimal parameter (λ) in the LASSO model using 10-fold cross-verification. (c) LASSO coefficient profiles of prognosis-related EMT genes. (d) Distribution of RS in gastric cancer patients and determination of the cutoff value of high-RS (red) and low-RS (green) groups according to RS median. (e) Distribution of survival status (dead: red and alive: green) in high- and low-RS groups. (f) Kaplan-Meier OS curves for the high- and low-RS groups. (g) The time-dependent ROC for the RS model. (h) Univariate and (i) multivariate Cox regression analyses of RS and other clinical features.
Table 1.
Prognosis-related EMT-related gene signatures for gastric cancer by univariate Cox regression analysis.
| ID | HR | HR.95L | HR.95H | p value | ID | HR | HR.95L | HR.95H | p value |
|---|---|---|---|---|---|---|---|---|---|
| CTHRC1 | 1.200409 | 1.06768 | 1.349637 | 0.002248 | THBS2 | 1.119698 | 1.015975 | 1.234009 | 0.022637 |
| INHBA | 1.177176 | 1.033914 | 1.340289 | 0.013751 | SFRP1 | 1.090971 | 1.002915 | 1.186759 | 0.042586 |
| COL1A1 | 1.12936 | 1.013576 | 1.25837 | 0.027503 | COL5A1 | 1.142209 | 1.006216 | 1.296582 | 0.039804 |
| BGN | 1.179647 | 1.039263 | 1.338995 | 0.010597 | LOX | 1.25252 | 1.090202 | 1.439005 | 0.001475 |
| COL4A1 | 1.215442 | 1.027667 | 1.437527 | 0.022685 | PCOLCE2 | 1.249504 | 1.085789 | 1.437903 | 0.001879 |
| TIMP1 | 1.186359 | 1.00804 | 1.396222 | 0.039751 | CDH11 | 1.208569 | 1.052499 | 1.387781 | 0.007247 |
| COL5A2 | 1.193086 | 1.03962 | 1.369208 | 0.011969 | SFRP4 | 1.078954 | 1.005406 | 1.157882 | 0.034891 |
| THY1 | 1.204512 | 1.039918 | 1.395158 | 0.013062 | MATN3 | 1.278741 | 1.131943 | 1.444577 | 7.75E-05 |
| FAP | 1.167508 | 1.031661 | 1.321244 | 0.014135 | NID2 | 1.235369 | 1.057539 | 1.443103 | 0.007689 |
| COL3A1 | 1.150473 | 1.027265 | 1.288458 | 0.015291 | MYL9 | 1.093798 | 1.005017 | 1.190421 | 0.037909 |
| CALU | 1.260293 | 1.001195 | 1.586444 | 0.048823 | FN1 | 1.124577 | 1.018254 | 1.242003 | 0.020507 |
| ADAM12 | 1.183344 | 1.044276 | 1.340931 | 0.008311 | PRRX1 | 1.140897 | 1.011825 | 1.286434 | 0.031407 |
| COL1A2 | 1.151805 | 1.024302 | 1.29518 | 0.018221 | LUM | 1.19584 | 1.054413 | 1.356237 | 0.005352 |
| SPARC | 1.263289 | 1.09289 | 1.460256 | 0.00157 | DCN | 1.159358 | 1.031313 | 1.303301 | 0.013275 |
| SERPINE1 | 1.24028 | 1.117038 | 1.377119 | 5.51E-05 | FBLN1 | 1.110247 | 1.017339 | 1.21164 | 0.019002 |
| PDGFRB | 1.189439 | 1.028726 | 1.375258 | 0.019162 | MFAP5 | 1.117742 | 1.010726 | 1.236089 | 0.030178 |
| VCAN | 1.23074 | 1.079319 | 1.403403 | 0.001938 | ACTA2 | 1.119472 | 1.016273 | 1.23315 | 0.02219 |
| DKK1 | 1.067624 | 1.002775 | 1.136667 | 0.040693 |
Table 2.
Clinical characteristics of high- and low-RS gastric cancer patients in TCGA dataset.
| Characteristics | High risk (N = 175) | Low risk (N = 175) | Total (N = 350) | p value | |
|---|---|---|---|---|---|
| Age | <65 | 81 | 69 | 150 | 0.2348 |
| ≥65 | 94 | 106 | 200 | ||
| Stage | Stage I | 21 | 28 | 49 | 0.619 |
| Stage II | 55 | 56 | 111 | ||
| Stage III | 79 | 76 | 155 | ||
| Stage IV | 20 | 15 | 35 | ||
| T | T1 | 3 | 13 | 16 | 0.0757 |
| T2 | 39 | 35 | 74 | ||
| T3 | 78 | 83 | 161 | ||
| T4 | 52 | 43 | 95 | ||
| TX | 3 | 1 | 4 | ||
| M | M0 | 155 | 157 | 312 | 0.9404 |
| M1 | 12 | 11 | 23 | ||
| MX | 8 | 7 | 15 | ||
| N | N0 | 49 | 55 | 104 | 0.8117 |
| N1 | 45 | 48 | 93 | ||
| N2 | 36 | 36 | 72 | ||
| N3 | 40 | 31 | 71 | ||
| NX | 5 | 5 | 10 | ||
| Gender | Female | 60 | 64 | 124 | 0.7374 |
| Male | 115 | 111 | 226 | ||
| Grade | G1 | 4 | 5 | 9 | 0.9717 |
| G2 | 62 | 63 | 125 | ||
| G3 | 104 | 103 | 207 | ||
| GX | 5 | 4 | 9 | ||
3.3. Subgroup Analysis of the Prognostic Value of the EMT-Related RS Model
SERPINE1, PCOLCE2, MATN3, and DKK1 expression was compared between the high- and low-RS groups. In Figure 3(a), there were increased expression levels in the high- than low-RS groups. To assess whether the EMT-related RS model could sensitively predict gastric cancer patients' prognosis, we carried out subgroup analysis. Our data showed that high RS was predictive of undesirable survival outcomes compared with low RS in each subgroup including age ≥ 65 (p = 0.002; Figure 3(b)) and age < 65 (p = 0.009; Figure 3(c)), female (p = 0.024; Figure 3(d)) and male (p = 0.002; Figure 3(e)), M0 (p < 0.001; Figure 3(f)) and M1 (p = 0.590; Figure 3(g)), N0 (p = 0.001; Figure 3(h)) and N1-3 (p = 0.005; Figure 3(i)), T1-2 (p = 0.003Figure 3(j)) and T3-4 (p = 0.006; Figure 3(k)), stage I-II (p < 0.001; Figure 3(l)) and stage III-IV (p = 0.042; Figure 3(m)).
Figure 3.
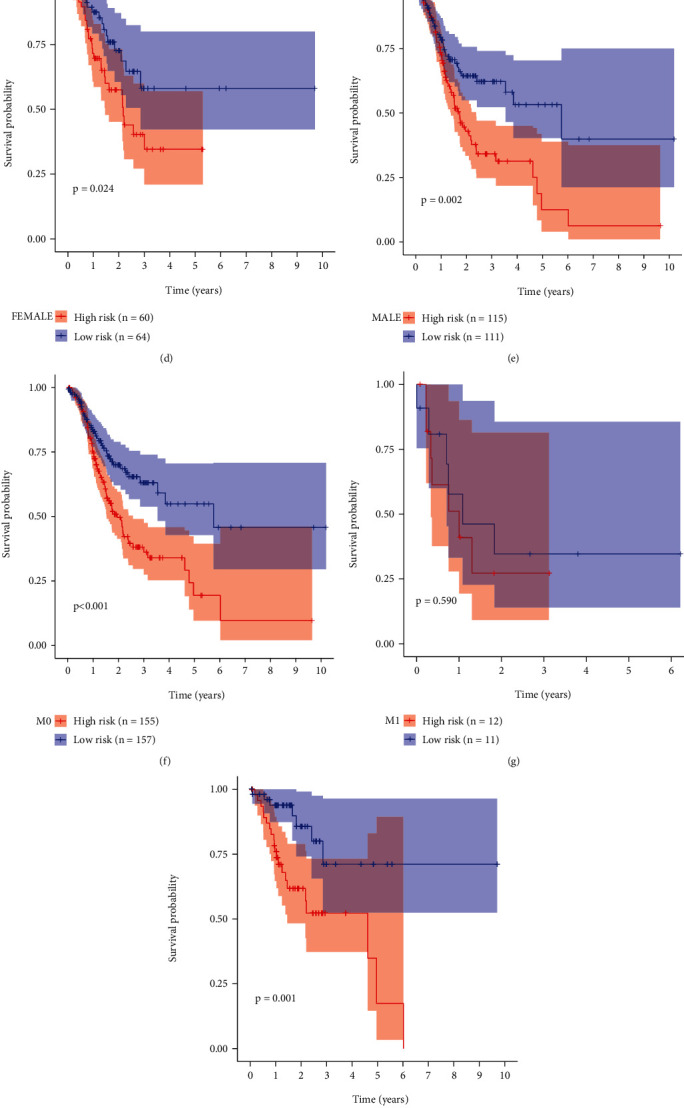
Subgroup analysis of the prognostic value of the EMT-related RS model. (a) Heatmap of the expression of SERPINE1, PCOLCE2, MATN3, and DKK1 in high- and low-RS groups. Red and green show up- and downregulation. Kaplan-Meier curves between high- and low-RS gastric cancer patients in different subgroups including (b) age ≥ 65 and (c) age < 65; (d) female and (e) male; (f) M0 and (g) M1; (h) N0 and (i) N1-3; (j) T1-2 and (k) T3-4; (l) stage I-II and (m) stage III-IV.
3.4. External Validation of the EMT-Related RS Model
The predictive efficacy of the EMT-related RS model was externally verified in the GSE66229 and GSE84437 datasets. With the same formula, we calculated the RS of each patient. In the GSE66229 dataset, patients were split into the high- and low-RS groups based on the median value (Figure 4(a)). As expected, more deaths were found in the high-RS group (Figure 4(b)). The clinical features between groups were compared, and we found that high RS was in relation to late stage, T, and M (Table 3). Furthermore, high-RS patients exhibited more undesirable survival outcomes (p = 7.802e − 07; Figure 4(c)). AUC of the RS model was 0.675 (Figure 4(d)). Similarly, we split patients in the GSE84437 dataset into the high- and low-RS groups (Figure 4(e)). There were more patients with dead status in the high-RS group (Figure 4(f)). In Figure 4(g), high RS was distinctly related to poor prognosis (p = 5.333e − 03). And AUC of the model was 0.637 (Figure 4(h)). Consistent with TCGA dataset, increased SERPINE1, PCOLCE2, MATN3, and DKK1 expression was detected in the high-RS group than the low-RS group in GSE66229 (Figure 5(a)) and GSE84437 (Figure 5(b)) datasets. Following univariate (Figure 5(c)) and multivariate (Figure 5(d)) Cox regression analyses, the RS model was markedly correlated with gastric cancer prognosis in the GSE66229 dataset. Consistently, in the GSE84437 dataset, the RS model was also a risk factor for prognosis according to univariate (Figure 5(e)) and multivariate (Figure 5(f)) Cox regression analyses. Collectively, the EMT-related RS model displayed good generalizability in clinical practice.
Figure 4.
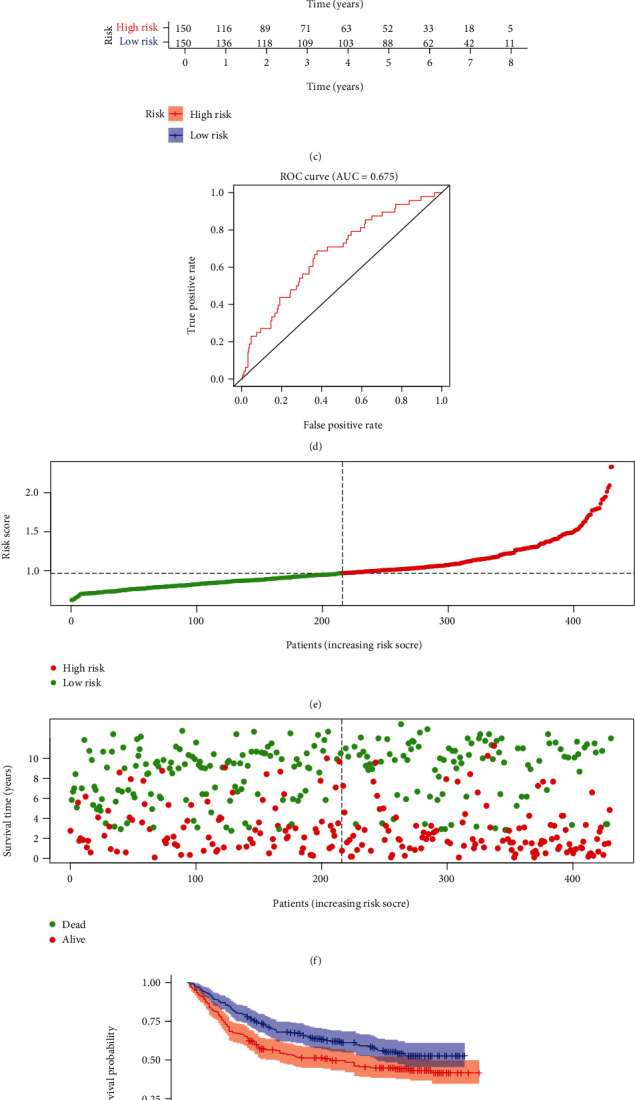
External validation of the EMT-related RS model in GSE66229 and GSE84437 datasets. (a) Distribution of RS in gastric cancer samples and determination of the cutoff value of high-RS (red) and low-RS (green) groups according to RS median in the GSE66229 dataset. (b) Distribution of survival status (red: dead and green: alive) in high- and low-RS groups in GSE66229 dataset. (c) Kaplan-Meier OS curves of high- and low-RS groups in GSE66229 dataset. (d) ROC curves of the RS model in GSE66229 dataset. (e) Distribution of RS in gastric cancer samples and determination of the cutoff value of high-RS (red) and low-RS (green) groups according to RS median in GSE84437 dataset. (f) Distribution of survival status (red: dead and green: alive) in high- and low-RS groups in GSE84437 dataset. (g) Kaplan-Meier OS curves of high- and low-RS groups in GSE84437 dataset. (h) ROC curves of the RS model in GSE84437 dataset.
Table 3.
Clinical characteristics of gastric cancer patients in the GSE66229 dataset.
| Characteristics | High risk (N = 150) | Low risk (N = 150) | Total (N = 300) | p value | |
|---|---|---|---|---|---|
| Age | <65 | 87 | 74 | 161 | 0.1647 |
| ≥65 | 63 | 76 | 139 | ||
| Stage | Stage I | 9 | 21 | 30 | 0.0073 |
| Stage II | 40 | 56 | 96 | ||
| Stage III | 55 | 40 | 95 | ||
| Stage IV | 45 | 32 | 77 | ||
| NA | 1 | 1 | 2 | ||
| T | T2 | 75 | 111 | 186 | <0.0001 |
| T3 | 60 | 31 | 91 | ||
| T4 | 14 | 7 | 21 | ||
| NA | 1 | 1 | 2 | ||
| M | M0 | 131 | 142 | 273 | 0.0437 |
| M1 | 19 | 8 | 27 | ||
| N | N0 | 14 | 24 | 38 | 0.1309 |
| N1 | 62 | 69 | 131 | ||
| N2 | 47 | 33 | 80 | ||
| N3 | 27 | 24 | 51 | ||
| Gender | Female | 53 | 48 | 101 | 0.6251 |
| Male | 97 | 102 | 199 | ||
Figure 5.
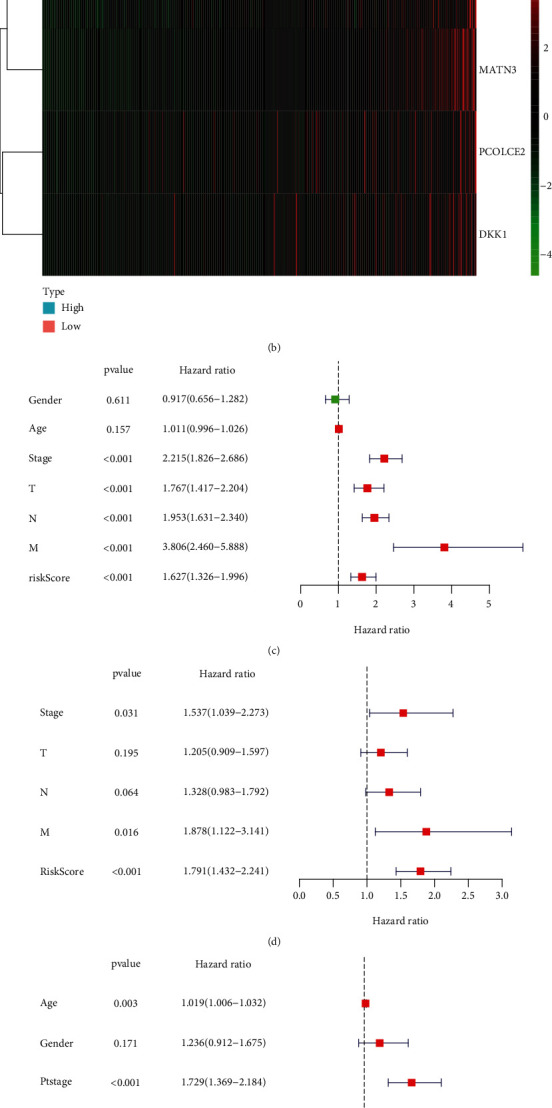
External validation of the independency of the EMT-related RS model in predicting prognosis in GSE66229 and GSE84437 datasets. (a, b) Heatmap of the expression of SERPINE1, PCOLCE2, MATN3, and DKK1 in high- and low-RS groups in (a) GSE66229 and (b) GSE84437 datasets. Red and green indicate up- and downregulation. (c) Univariate and (d) multivariate Cox regression analyses of the RS model and other clinicopathological characteristics in GSE66229 dataset. (e) Univariate and (f) multivariate Cox regression analyses of the RS model and other clinicopathological characteristics in GSE84437 dataset.
3.5. Development of a Prognostic Nomogram Based on the EMT-Related RS Model
Independent risk factors were included in the prognostic nomogram for gastric cancer. In TCGA dataset, the nomogram including age, stage, and RS was constructed for predicting patients' survival duration (Figure 6(a)). The calibration curves confirmed that the nomogram-predicted 1-, 3-, and 5-year survival probabilities were in accord with observed survival duration (Figures 6(b)–6(d)). Similarly, the nomogram was developed in the GSE66229 dataset (Figure 6(e)). The well predictive efficacy was verified by the calibration curves (Figures 6(f)–6(h)). Meanwhile, the nomogram was validated in the GSE84437 dataset (Figures 6(i)–6(l)).
Figure 6.
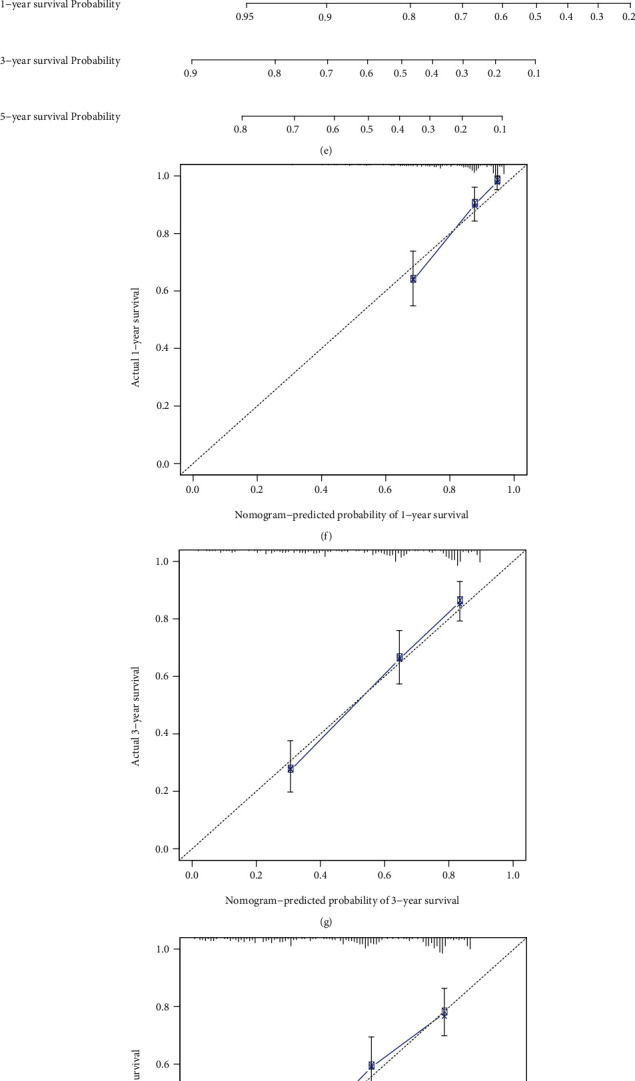
Discovery and verification of a prognostic nomogram based on the EMT-related RS model. (a) Establishment of a prognostic nomogram in TCGA dataset. (b–d) The calibration curves for the relationships between the nomogram-predicted and actual 1-, 3-, and 5-year survival probabilities. (e) Validation of the prognostic nomogram in GSE66229 dataset and (f–h) the calibration curves for the relationships between the nomogram-predicted and actual 1-, 3-, and 5-year survival probabilities. (i) Validation of the prognostic nomogram in GSE84437 dataset and (j–l) the calibration curves for the relationships between the nomogram-predicted and actual 1-, 3-, and 5-year survival probabilities.
3.6. Prediction of Underlying Small Molecular Compounds for Gastric Cancer Based on Dysregulated EMT-Related Genes
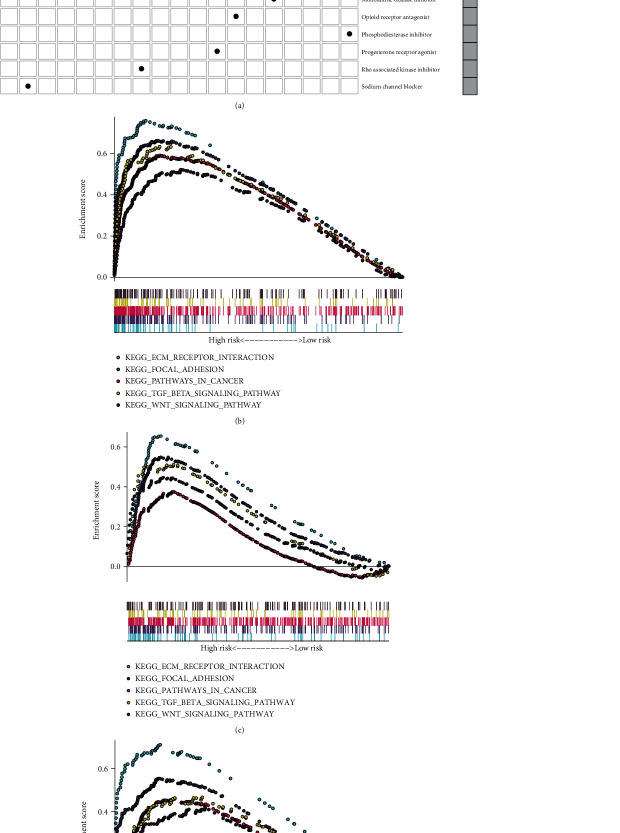
Totally, 209 differentially expressed genes were identified between the high- and low-RS groups (Supplementary Table 3). Based on them, underlying compounds were predicted by the CMap database, as listed in Table 4. The mechanism of action analysis was then conducted to investigate the shared mechanisms among the compounds. In Figure 7(a), estrogen receptor agonist was shared by dienestrol and diethylstilbestrol.
Table 4.
Potential small compounds for treating gastric cancer based on dysregulated EMT-related genes.
| Rank | CMap name | Mean | n | Enrichment | p | Specificity | Percent nonnull |
|---|---|---|---|---|---|---|---|
| 1 | Puromycin | 0.694 | 4 | 0.929 | 0.00004 | 0.0562 | 100 |
| 2 | Trolox C | 0.461 | 4 | 0.89 | 0.00014 | 0 | 75 |
| 3 | Cloxacillin | -0.487 | 4 | -0.869 | 0.0006 | 0 | 75 |
| 4 | Indoprofen | -0.307 | 4 | -0.815 | 0.00213 | 0.0333 | 50 |
| 5 | Diethylstilbestrol | -0.338 | 6 | -0.663 | 0.00407 | 0.0082 | 50 |
| 6 | Caffeic acid | 0.398 | 3 | 0.853 | 0.00605 | 0 | 66 |
| 7 | Benzamil | -0.302 | 6 | -0.629 | 0.0081 | 0 | 50 |
| 8 | STOCK1N-35874 | -0.613 | 2 | -0.916 | 0.01447 | 0.0331 | 100 |
| 9 | Fasudil | -0.469 | 2 | -0.904 | 0.01863 | 0 | 100 |
| 10 | Amrinone | 0.51 | 4 | 0.688 | 0.01975 | 0.0147 | 75 |
| 11 | 5155877 | 0.419 | 4 | 0.675 | 0.02441 | 0.1313 | 75 |
| 12 | Eticlopride | -0.279 | 4 | -0.673 | 0.0257 | 0.0758 | 50 |
| 13 | Meropenem | 0.309 | 4 | 0.668 | 0.02711 | 0.0163 | 50 |
| 14 | 16-Phenyltetranorprostaglandin E2 | -0.486 | 4 | -0.667 | 0.02765 | 0.0476 | 75 |
| 15 | Thapsigargin | -0.496 | 3 | -0.757 | 0.02934 | 0.2194 | 66 |
| 16 | Pronetalol | 0.265 | 4 | 0.657 | 0.03191 | 0.0089 | 50 |
| 17 | Chloropyrazine | -0.328 | 4 | -0.639 | 0.04048 | 0.0649 | 50 |
| 18 | Naltrexone | -0.418 | 5 | -0.576 | 0.04133 | 0.0899 | 60 |
| 19 | Oxolamine | -0.355 | 4 | -0.636 | 0.04255 | 0.1 | 50 |
| 20 | Oxybenzone | -0.313 | 4 | -0.635 | 0.04335 | 0.1268 | 50 |
| 21 | Carisoprodol | -0.365 | 4 | -0.633 | 0.04406 | 0.0248 | 50 |
| 22 | Piperine | -0.393 | 4 | -0.627 | 0.04782 | 0.0118 | 50 |
Figure 7.
Screening potential small molecular compounds and activated pathways associated with RS model in gastric cancer. (a) Candidate small molecular compounds that were predicted by the CMAP database based on differentially expressed EMT-related genes. X-axis shows mechanism of action, and y-axis represents small compounds. (b–d) Activated pathways in high-RS gastric cancer samples in (b) TCGA, (c) GSE66229, and (d) GSE84437 datasets.
3.7. Identification of the EMT-Related Gene Model Associated Signaling Pathways
In TCGA dataset, ECM receptor interaction (NES = 2.24, FDR = 0.004), focal adhesion (NES = 2.13, FDR = 0.007), pathway in cancer (NES = 2.06, FDR = 0.011), TGF-beta signaling pathway (NES = 2.01, FDR = 0.011), and Wnt signaling pathway (NES = 1.79, FDR = 0.033) were markedly activated in high-RS gastric cancer specimens (Figure 7(b)). The above activated pathways were confirmed in the GSE66229 (Figure 7(c)) and GSE84437 (Figure 7(d)) datasets.
3.8. Associations between the EMT-Related RS Model and Immune Microenvironment of Gastric Cancer
Using the ESTIMATE algorithm, we estimated the stromal score, immune score, and tumor purity of gastric cancer tissues from TCGA dataset and analyzed their relationships with the RS. Our data showed that high RS was distinctly related to increased stromal and immune scores as well as lowered tumor purity in gastric cancer (Figure 8(a)). Seven algorithms including TIMER, CIBERSORT, CIBERSORT-ABS, QUANTISEQ, MCPCOUNTER, XCELL, and EPIC were employed to estimate the immune cell infiltrations in each sample. We compared the differences in immune cell infiltrations between the high- and low-RS groups. In Figure 8(b), higher infiltration levels of CD4+ T cell, CD8+ T cell, cancer-associated fibroblast, and macrophage were found in the high-RS group than the low-RS group.
Figure 8.
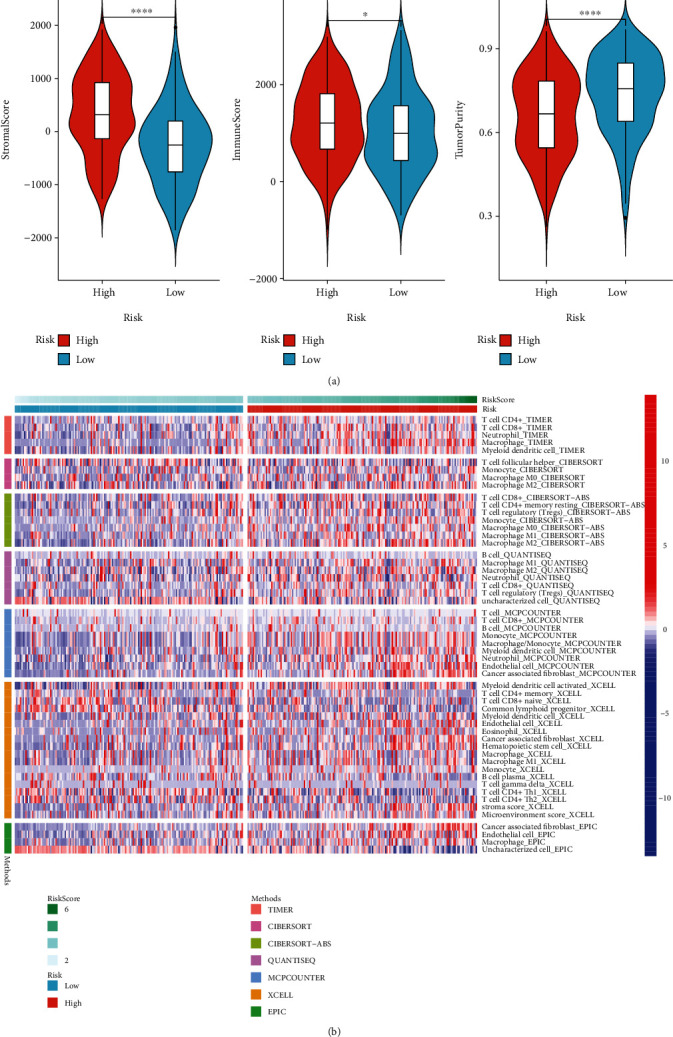
The relationships between the EMT-related RS model and immune microenvironment of gastric cancer. (a) Violin plots of stromal score, immune score, and tumor purity in high- and low-RS groups. (b) Heatmap showing infiltration levels of immune cells in high- and low-RS groups using seven algorithms including TIMER, CIBERSORT, CIBERSORT-ABS, QUANTISEQ, MCPCOUNTER, XCELL, and EPIC. ∗p < 0.05; ∗∗∗∗p < 0.0001.
4. Discussion
EMT-based gene signatures have been developed in bladder cancer [23], glioma [24], and colorectal cancer [25]. EMT is determined to be closely associated with gastric cancer progression and prognosis. Increased motility and invasiveness mediated by the EMT process are key during the initiation of cancer metastasis. However, no studies have reported the prognostic value of EMT-based signatures in gastric cancer. Here, we developed an EMT-related RS model that was comprised of SERPINE1, PCOLCE2, MATN3, and DKK1 in gastric cancer via the LASSO method, which may classify gastric cancer patients into the high- and low-risk categories. This LASSO method has been widely applied for analyzing high-dimensional data, which may screen feature signatures with robust prognostic potential and weak correlations among them to avoid overfitting [26].
Alterations in gene expression are in relation to the carcinogenic process. Here, we screened 67 upregulated and 12 downregulated EMT-related genes in gastric cancer. These genes were distinctly enriched in ECM organization, extracellular structure organization, and collagen fibril organization as well as several cancer-related pathways like focal adhesion, ECM-receptor interaction, PI3K-Akt signaling pathway, and proteoglycans in cancer, highlighting their critical implications in gastric cancer pathogenesis. By the LASSO method, we generated an EMT-based signature containing SERPINE1, PCOLCE2, MATN3, and DKK1. After validation, this signature was independently predictive of survival outcomes. Previously, SERPINE1 upregulation was found in gastric cancer and in relation to unfavorable prognoses [27]. Furthermore, it was tightly correlated to the EMT process in gastric cancer [28]. As an oncogene, it may facilitate tumor cell proliferation, migration, and invasion in gastric cancer through mediating the EMT process [29]. The roles of SERPINE1 on angiogenesis and metastasis in gastric cancer were also found [30]. MATN3 was aberrantly methylated and dysregulated in gastric cancer and related to an undesirable prognosis [31]. DKK1, as an inhibitor of Wnt signaling, was also in relation to survival outcomes of gastric cancer [32]. Nevertheless, more research should be conducted for investigating the roles of PCOLCE2 in gastric cancer progression. To facilitate personalized prediction of the patient's prognosis, we generated the nomogram by incorporating the RS model and traditional clinicopathological characteristics. These model-predicted survival probabilities were highly consistent with actual survival probabilities.
Several small molecular compounds were predicted for treating gastric cancer based on the RS model such as puromycin, trolox C, cloxacillin, indoprofen, diethylstilbestrol, and caffeic acid. In our future studies, we will verify the therapeutic effects of these compounds on antigastric cancer by experiments. Our GSEA demonstrated that ECM receptor interaction, focal adhesion, pathway in cancer, TGF-beta signaling pathway, and Wnt signaling pathway were markedly activated in high-RS gastric cancer, indicating that this model was in relation to these pathways. The immune microenvironment exerts a key role in tumor progression. Our further analysis found tight associations between this model and immune microenvironment. This indicated that EMT might participate in reshaping the immune microenvironment of gastric cancer, which will be validated in our future research.
5. Conclusion
Collectively, our study established an EMT-based signature that may robustly predict gastric cancer prognosis and improve the efficacy of personalized therapy. The predictive performance will be verified in a larger cohort of gastric cancer.
Acknowledgments
This research was supported by the Medical and Health Guidance Project of Xiamen (3502Z20184041 and 3502Z20184042).
Abbreviations
- EMT:
Epithelial-mesenchymal transition
- RNA-seq:
RNA-sequencing
- TCGA:
The Cancer Genome Atlas
- GDC:
Genomic Data Commons
- TPM:
Transcripts per kilobase million
- GEO:
Gene Expression Omnibus
- GSEA:
Gene Set Enrichment Analysis
- GO:
Gene Ontology
- KEGG:
Kyoto Encyclopedia of Genes and Genomes
- RS:
Risk score
- LASSO:
Least absolute shrinkage and selection operator
- OS:
Overall survival
- ROC:
Receiver operating characteristic
- HR:
Hazard ratio
- CI:
Confidence interval
- CMap:
Connectivity Map
- ESTIMATE:
Estimation of STromal and Immune cells in MAlignant Tumor tissues using Expression data.
Contributor Information
Lianghua Feng, Email: flh9453@126.com.
Hui Zhang, Email: zhanghui20092021@126.com.
Fengbing Su, Email: tmyysfb@163.com.
Data Availability
The data used to support the findings of this study are included within the supplementary information files.
Conflicts of Interest
The authors declare no conflicts of interest.
Authors' Contributions
Huiyong Xu and Huilai Wan contributed equally to this work.
Supplementary Materials
Supplementary Table 1: a list of EMT-related gene signatures.
Supplementary Table 2: differentially expressed EMT-related genes in gastric cancer.
Supplementary Table 3: differentially expressed genes between high- and low-RS groups.
References
- 1.Smyth E. C., Nilsson M., Grabsch H. I., van Grieken N. C. T., Lordick F. Gastric cancer. Lancet . 2020;396(10251):635–648. doi: 10.1016/S0140-6736(20)31288-5. [DOI] [PubMed] [Google Scholar]
- 2.Russo A. E., Strong V. E. Gastric cancer etiology and management in Asia and the West. Annual Review of Medicine . 2019;70(1):353–367. doi: 10.1146/annurev-med-081117-043436. [DOI] [PubMed] [Google Scholar]
- 3.Li S., Cong X., Gao H., et al. Tumor-associated neutrophils induce EMT by IL-17a to promote migration and invasion in gastric cancer cells. Journal of Experimental & Clinical Cancer Research . 2019;38(1):p. 6. doi: 10.1186/s13046-018-1003-0. [DOI] [PMC free article] [PubMed] [Google Scholar]
- 4.Wang R., Dang M., Harada K., et al. Single-cell dissection of intratumoral heterogeneity and lineage diversity in metastatic gastric adenocarcinoma. Nature Medicine . 2021;27(1):141–151. doi: 10.1038/s41591-020-1125-8. [DOI] [PMC free article] [PubMed] [Google Scholar]
- 5.Liu Y., Wu J., Huang W., et al. Development and validation of a hypoxia-immune-based microenvironment gene signature for risk stratification in gastric cancer. Journal of Translational Medicine . 2020;18(1):p. 201. doi: 10.1186/s12967-020-02366-0. [DOI] [PMC free article] [PubMed] [Google Scholar]
- 6.Aiello N. M., Kang Y. Context-dependent EMT programs in cancer metastasis. The Journal of Experimental Medicine . 2019;216(5):1016–1026. doi: 10.1084/jem.20181827. [DOI] [PMC free article] [PubMed] [Google Scholar]
- 7.De Craene B., Berx G. Regulatory networks defining EMT during cancer initiation and progression. Nature Reviews. Cancer . 2013;13(2):97–110. doi: 10.1038/nrc3447. [DOI] [PubMed] [Google Scholar]
- 8.Pastushenko I., Blanpain C. EMT transition states during tumor progression and metastasis. Trends in Cell Biology . 2019;29(3):212–226. doi: 10.1016/j.tcb.2018.12.001. [DOI] [PubMed] [Google Scholar]
- 9.Yang X. Z., Cheng T. T., He Q. J., et al. LINC01133 as ceRNA inhibits gastric cancer progression by sponging miR-106a-3p to regulate APC expression and the Wnt/β-catenin pathway. Molecular Cancer . 2018;17(1):p. 126. doi: 10.1186/s12943-018-0874-1. [DOI] [PMC free article] [PubMed] [Google Scholar]
- 10.Yue B., Song C., Yang L., et al. METTL3-mediated N6-methyladenosine modification is critical for epithelial-mesenchymal transition and metastasis of gastric cancer. Molecular Cancer . 2019;18(1):p. 142. doi: 10.1186/s12943-019-1065-4. [DOI] [PMC free article] [PubMed] [Google Scholar]
- 11.Kim N. Chemoprevention of gastric cancer by Helicobacter pylori eradication and its underlying mechanism. Journal of Gastroenterology and Hepatology . 2019;34(8):1287–1295. doi: 10.1111/jgh.14646. [DOI] [PubMed] [Google Scholar]
- 12.Guan K., Liu X., Li J., et al. Expression status and prognostic value of M6A-associated genes in gastric cancer. Journal of Cancer . 2020;11(10):3027–3040. doi: 10.7150/jca.40866. [DOI] [PMC free article] [PubMed] [Google Scholar]
- 13.Wang H., Wu X., Chen Y. Stromal-immune score-based gene signature: a prognosis stratification tool in gastric cancer. Frontiers in Oncology . 2019;9:p. 1212. doi: 10.3389/fonc.2019.01212. [DOI] [PMC free article] [PubMed] [Google Scholar]
- 14.Zhang X., Zhang W., Jiang Y., Liu K., Ran L., Song F. Identification of functional lncRNAs in gastric cancer by integrative analysis of GEO and TCGA data. Journal of Cellular Biochemistry . 2019;120(10):17898–17911. doi: 10.1002/jcb.29058. [DOI] [PubMed] [Google Scholar]
- 15.Oh S. C., Sohn B. H., Cheong J. H., et al. Clinical and genomic landscape of gastric cancer with a mesenchymal phenotype. Nature Communications . 2018;9(1):p. 1777. doi: 10.1038/s41467-018-04179-8. [DOI] [PMC free article] [PubMed] [Google Scholar]
- 16.Yoon S. J., Park J., Shin Y., et al. Deconvolution of diffuse gastric cancer and the suppression of CD34 on the BALB/c nude mice model. BMC Cancer . 2020;20(1):p. 314. doi: 10.1186/s12885-020-06814-4. [DOI] [PMC free article] [PubMed] [Google Scholar]
- 17.Subramanian A., Tamayo P., Mootha V. K., et al. Gene set enrichment analysis: a knowledge-based approach for interpreting genome-wide expression profiles. Proceedings of the National Academy of Sciences of the United States of America . 2005;102(43):15545–15550. doi: 10.1073/pnas.0506580102. [DOI] [PMC free article] [PubMed] [Google Scholar]
- 18.Ritchie M. E., Phipson B., Wu D., et al. limma powers differential expression analyses for RNA-sequencing and microarray studies. Nucleic Acids Research . 2015;43(7, article e47) doi: 10.1093/nar/gkv007. [DOI] [PMC free article] [PubMed] [Google Scholar]
- 19.Yu G., Wang L. G., Han Y., He Q. Y. clusterProfiler: an R package for comparing biological themes among gene clusters. OMICS . 2012;16(5):284–287. doi: 10.1089/omi.2011.0118. [DOI] [PMC free article] [PubMed] [Google Scholar]
- 20.Lamb J., Crawford E. D., Peck D., et al. The Connectivity Map: using gene-expression signatures to connect small molecules, genes, and disease. Science . 2006;313(5795):1929–1935. doi: 10.1126/science.1132939. [DOI] [PubMed] [Google Scholar]
- 21.Engebretsen S., Bohlin J. Statistical predictions with glmnet. Clinical Epigenetics . 2019;11(1):p. 123. doi: 10.1186/s13148-019-0730-1. [DOI] [PMC free article] [PubMed] [Google Scholar]
- 22.Yoshihara K., Shahmoradgoli M., Martínez E., et al. Inferring tumour purity and stromal and immune cell admixture from expression data. Nature Communications . 2013;4(1):p. 2612. doi: 10.1038/ncomms3612. [DOI] [PMC free article] [PubMed] [Google Scholar]
- 23.Cao R., Yuan L., Ma B., Wang G., Qiu W., Tian Y. An EMT-related gene signature for the prognosis of human bladder cancer. Journal of Cellular and Molecular Medicine . 2020;24(1):605–617. doi: 10.1111/jcmm.14767. [DOI] [PMC free article] [PubMed] [Google Scholar]
- 24.Tao C., Huang K., Shi J., Hu Q., Li K., Zhu X. Genomics and prognosis analysis of epithelial-mesenchymal transition in glioma. Frontiers in Oncology . 2020;10:p. 183. doi: 10.3389/fonc.2020.00183. [DOI] [PMC free article] [PubMed] [Google Scholar]
- 25.Zhang Z., Zheng S., Lin Y., et al. Genomics and prognosis analysis of epithelial-mesenchymal transition in colorectal cancer patients. BMC Cancer . 2020;20(1):p. 1135. doi: 10.1186/s12885-020-07615-5. [DOI] [PMC free article] [PubMed] [Google Scholar]
- 26.Peng K., Chen E., Li W., et al. A 16-mRNA signature optimizes recurrence-free survival prediction of stages II and III gastric cancer. Journal of Cellular Physiology . 2020;235(7-8):5777–5786. doi: 10.1002/jcp.29511. [DOI] [PubMed] [Google Scholar]
- 27.Nie K., Shi L., Wen Y., et al. Identification of hub genes correlated with the pathogenesis and prognosis of gastric cancer via bioinformatics methods. Minerva Medica . 2020;111(3):213–225. doi: 10.23736/S0026-4806.19.06166-4. [DOI] [PubMed] [Google Scholar]
- 28.Xu B., Bai Z., Yin J., Zhang Z. Global transcriptomic analysis identifiesSERPINE1as a prognostic biomarker associated with epithelial-to-mesenchymal transition in gastric cancer. Peer J . 2019;7, article e7091 doi: 10.7717/peerj.7091. [DOI] [PMC free article] [PubMed] [Google Scholar]
- 29.Yang J. D., Ma L., Zhu Z. SERPINE1 as a cancer-promoting gene in gastric adenocarcinoma: facilitates tumour cell proliferation, migration, and invasion by regulating EMT. Journal of Chemotherapy . 2019;31(7-8):408–418. doi: 10.1080/1120009X.2019.1687996. [DOI] [PubMed] [Google Scholar]
- 30.Teng F., Zhang J. X., Chen Y., et al. LncRNA NKX2-1-AS1 promotes tumor progression and angiogenesis via upregulation of SERPINE1 expression and activation of the VEGFR-2 signaling pathway in gastric cancer. Molecular Oncology . 2021;15(4):1234–1255. doi: 10.1002/1878-0261.12911. [DOI] [PMC free article] [PubMed] [Google Scholar]
- 31.Zhang C., Liang Y., Ma M. H., Wu K. Z., Dai D. Q. KRT15, INHBA, MATN3, and AGT are aberrantly methylated and differentially expressed in gastric cancer and associated with prognosis. Pathology, Research and Practice . 2019;215(5):893–899. doi: 10.1016/j.prp.2019.01.034. [DOI] [PubMed] [Google Scholar]
- 32.Wall J. A., Klempner S. J., Arend R. C. The anti-DKK1 antibody DKN-01 as an immunomodulatory combination partner for the treatment of cancer. Expert Opinion on Investigational Drugs . 2020;29(7):639–644. doi: 10.1080/13543784.2020.1769065. [DOI] [PubMed] [Google Scholar]
Associated Data
This section collects any data citations, data availability statements, or supplementary materials included in this article.
Supplementary Materials
Supplementary Table 1: a list of EMT-related gene signatures.
Supplementary Table 2: differentially expressed EMT-related genes in gastric cancer.
Supplementary Table 3: differentially expressed genes between high- and low-RS groups.
Data Availability Statement
The data used to support the findings of this study are included within the supplementary information files.


