Abstract
Glioma intratumoral heterogeneity enables adaptation to challenging microenvironments and contributes to therapeutic resistance. We integrated 914 single-cell DNA methylomes, 55,284 single-cell transcriptomes, and bulk multi-omic profiles across 11 adult IDH-mutant or IDH-wild-type gliomas to delineate sources of intratumoral heterogeneity. We show that local DNA methylation disorder associates with cell-to-cell DNA methylation differences, is elevated in more aggressive tumors, links with transcriptional disruption, and is altered during environmental stress response. Glioma cells under in vitro hypoxic and irradiation stress increased local DNA methylation disorder and shifted cell states. We identified a positive association between genetic and epigenetic instability that was supported in bulk longitudinally collected DNA methylation data. Increased DNA methylation disorder associated with accelerated disease progression, and recurrently selected DNA methylation changes were enriched for environmental stress response pathways. Our work identifies an epigenetically facilitated adaptive stress response process and highlights the importance of epigenetic heterogeneity in shaping therapeutic outcomes.
Introduction:
Diffuse gliomas are the most common malignant brain tumors in adults and remain incurable. Extensive molecular characterization of glioma has defined genomic drivers and clinically relevant subtypes such as based on the presence of IDH1/2 gene mutations (i.e., IDH-mutant and IDH-wild-type)1–3. Inter- and intra-tumoral heterogeneity are salient features across glioma subtypes that contribute to the universal therapeutic resistance. The heterogeneity observed in surgical resection specimens reflects each tumor’s evolutionary path that is driven by competition between subpopulations harboring diverse genetic, epigenetic, and transcriptional aberrations4–8. Thus, understanding how these different layers of heterogeneity integrate to define clonal lineages and drive glioma evolution may provide insights into treatment failure.
The study of tumor heterogeneity is complicated by cellular plasticity that enables cancer cells to reversibly transition between distinct cellular states in response to genetic, microenvironmental, and therapeutic stimuli9. Single-cell RNA sequencing studies have previously identified such dynamic cellular states in IDH-wild-type gliomas10–13. Cell states of IDH-mutant gliomas were found to display a more restricted plasticity along a hierarchical differentiation axis14,15. Epigenetic modifications, such as DNA methylation (DNAme) at cytosine followed by guanine dinucleotides (i.e., CpGs), are mitotically heritable marks, encode cellular states, and dynamic 16. For example, the transition from a differentiated-like state to an undifferentiated, or stem-like, state following chemotherapy in glioma was accompanied by epigenetic reprogramming17. However, the epigenetic mechanisms that enable cellular plasticity and regulate glioma cell states remain poorly understood.
Aberrant DNAme resulting from errors in the placement or removal of epigenetic marks can provide genetically identical cells the diversity needed to respond to environmental stressors. These stochastic errors in DNAme replication result in increased local DNAme disorder (DNAme disorder)18. DNAme disorder is present in non-tumor cells, potentially reflecting active epigenetic remodeling, DNAme drift associated with age, or environmental exposures19. DNAme disorder may accumulate in cancer cells as passenger events or be evolutionarily selected by destabilizing gene expression programs9. Previous studies of glioma have demonstrated associations between bulk tumor epigenetic heterogeneity metrics and clinical outcomes2,5,20. Together, these findings suggest that stochastic DNAme alterations contribute to tumor heterogeneity and cellular plasticity that may drive evolution of treatment-resistant phenotypes.
Here, we integrated single-cell DNA methylomes, single-cell transcriptomes, and single-cell copy number profiles with bulk genomic profiles across a cohort of 11 glioma patient samples to dissect heterogeneous cell populations21–24 and define epigenetic states that contribute to tumor evolution18,24. We combined these in vivo analyses with in vitro perturbations to identify the gene regulatory regions most susceptible to stochastic DNAme alterations, the epigenetic modulation of transcriptional networks involved in glioma cellular identity, and that DNAme disorder may aid cellular stress response. Our work provides insights into the sources of intratumoral heterogeneity that fuel glioma evolution.
Results:
scDNAme links DNAme disorder with epigenetic heterogeneity
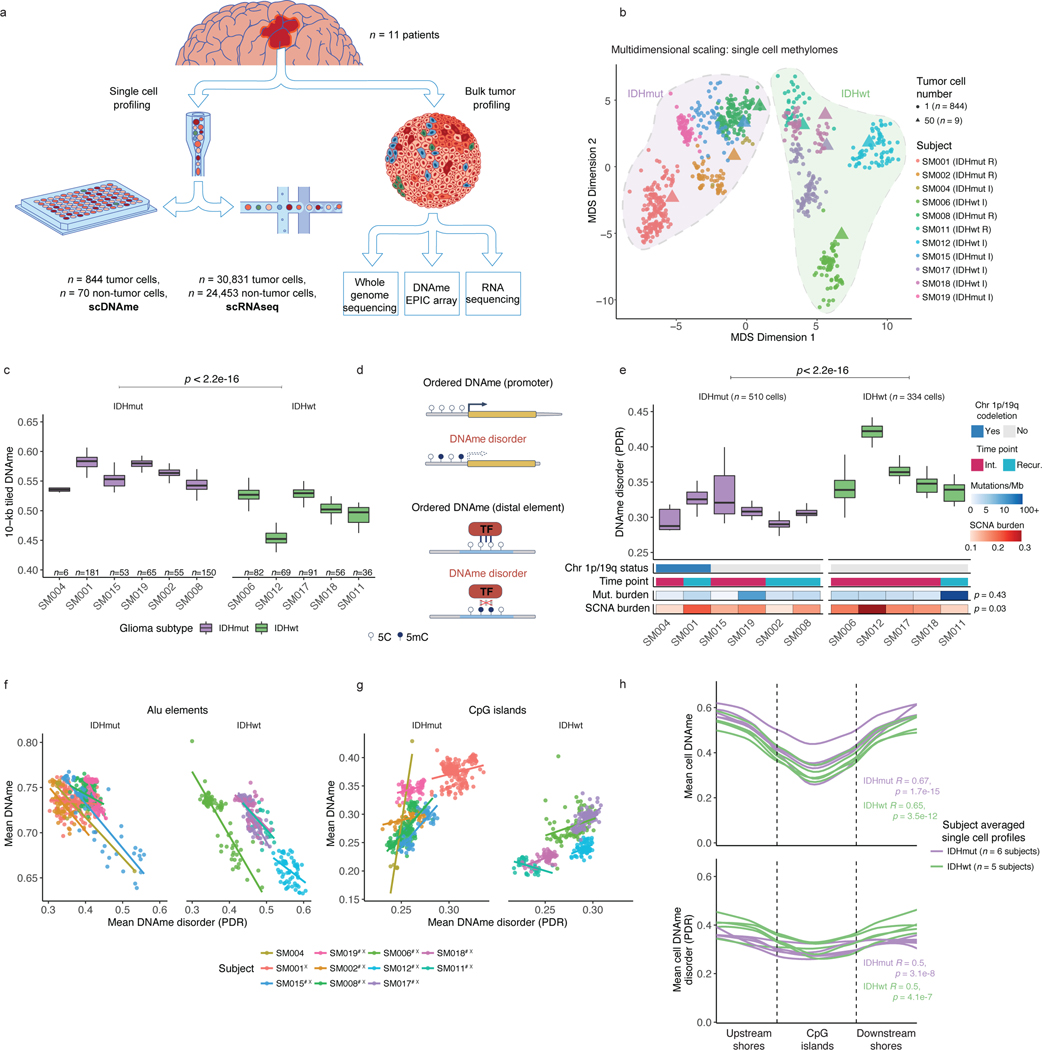
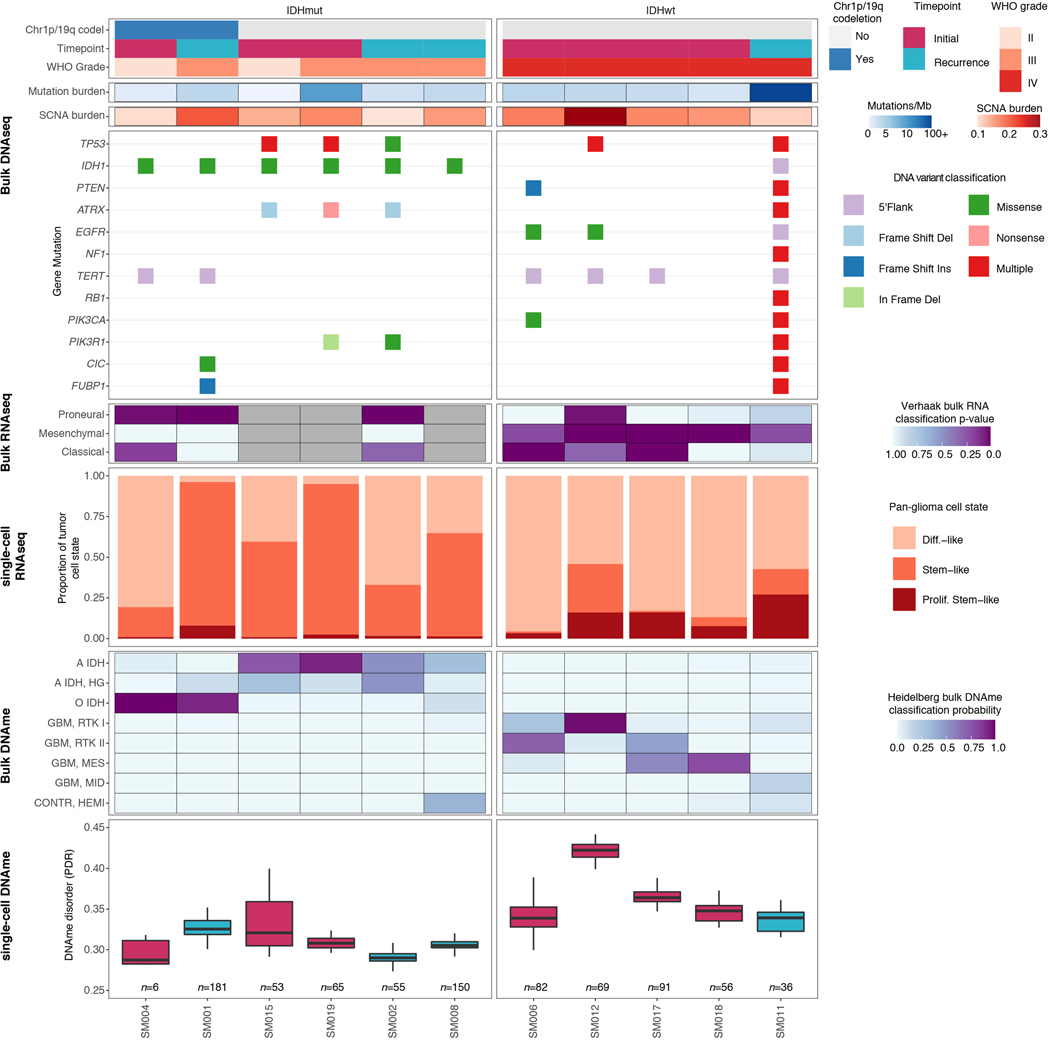
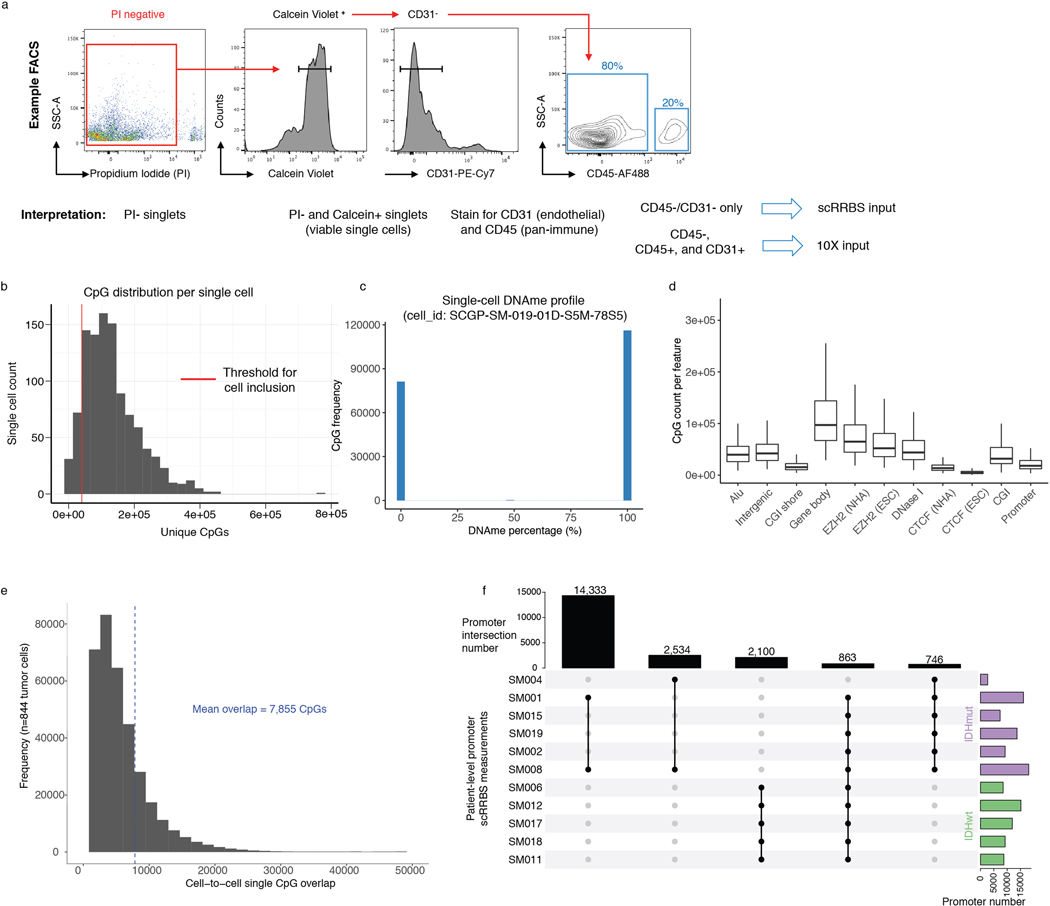
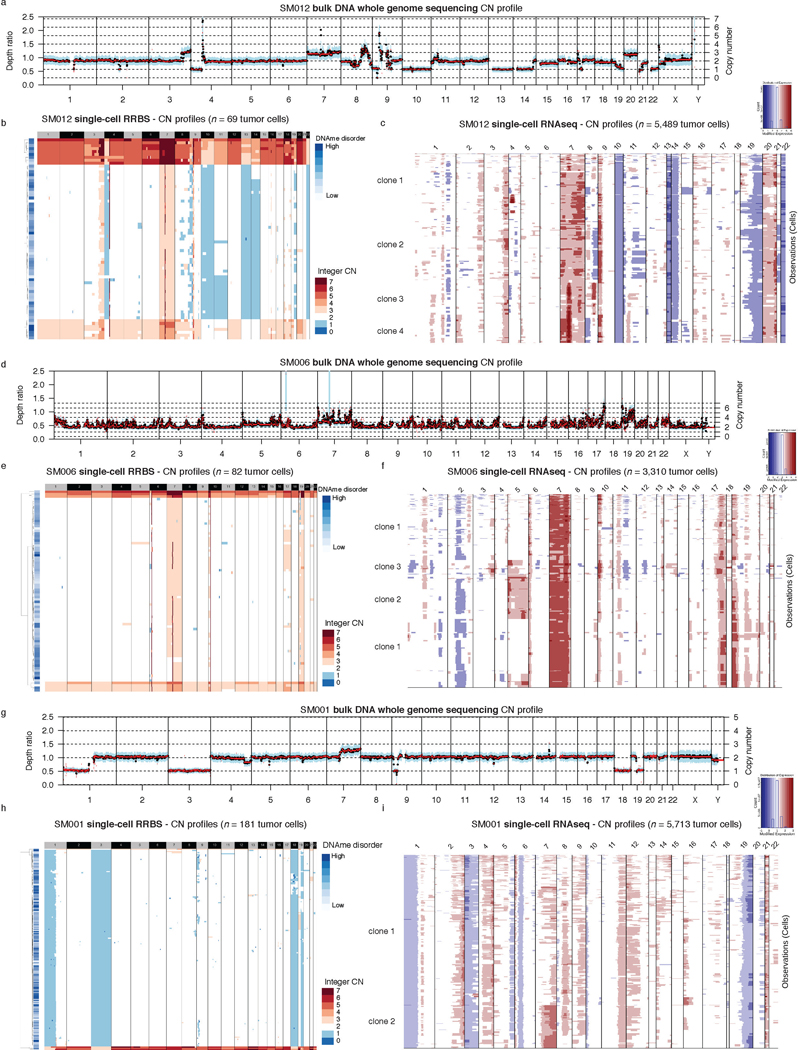
To investigate glioma heterogeneity, we performed single-cell DNAme, single-cell gene expression, as well as accompanying bulk whole genome sequencing, RNA sequencing, and DNAme microarray in 11 adult patients with glioma (Figure 1a). Both principal molecular subtypes (IDH-mutant and IDH-wild-type) and distinct clinical time points (i.e., unmatched initial and recurrent tumors, Supplementary Table 1 and Extended Data Fig. 1) were represented. We mechanically dissected tumor specimens from the same geographic region dissociating tissue for single-cell protocols and flash-freezing tissue for bulk genomic assays (Figure 1a). We applied single-cell reduced representation bisulfite sequencing (scRRBS), and 10X Genomics’ single-cell transcriptomics on cells from the same dissociation (Extended Data Fig. 2a)25,26. Viable CD45- (i.e., pan-immune cell marker) cells were plated for scRBBS, while single-cell transcriptomics was performed on all viable cells, arriving at a set of 914 single-cell methylomes and 55,284 single-cell transcriptomes. On average, ~150,000 mean unique CpG dinucleotides or 2,340 expressed genes were measured per cell. On average, ~8,000 mean CpGs were shared between any two cells (Extended Data Fig. 2b-f). Tumor and normal cells were grouped by inferred copy number alterations resulting in a final set of 844 DNAme and 30,831 transcriptomic tumor cell profiles (Methods, Extended Data Fig. 3a-i).
Figure 1. Single-cell DNA sequencing highlights association between epigenetic intratumoral heterogeneity and local DNAme disorder.
a, Schematic diagram detailing tumor sample processing and molecular profiling of single cells and bulk tumor samples (n = 11 subjects). b, Multidimensional scaling (MDS) analysis using pairwise individual CpG distance metrics calculated between individual cells. Shapes represent whether a sample was a single tumor cell (n = 844 cells) or 50-tumor cells, n = 9/11 subjects). Colors indicate individual subjects, shaded regions indicated IDH1-mutation status of tumor, and annotation is provided indicating clinical timepoint (I = initial, R = recurrence). c, Boxplots depict single-cell mean 10-kb tiled DNAme with subjects in columns and separated by IDH mutation status (color). Each box spans the 25th and 75th percentile, center lines indicate the median, and the whiskers represent the absolute range (minima/maxima), excluding outliers. Two-sided Wilcoxon rank sum test p-value presented to compared IDHmut vs. IDHwt cells. d, Schematic depiction of local DNAme disorder in different genomic contexts. Top panel; the promoter region where DNAme disorder is associated with disrupted gene expression. Bottom panel; an example of disrupted transcription factor binding due to DNAme disorder. e, Boxplots of glioma cell DNAme disorder grouped by subject. Two-sided Wilcoxon rank sum p-value represents comparison between IDHmut and IDHwt DNAme disorder. Each subject is annotated with clinical and molecular metrics with p-values indicating the relationship between sample mean DNAme disorder and whole-genome sequencing derived somatic mutation burden or somatic copy number alteration burden (Spearman correlation). f, Alu repeat element and g, CpG island-specific single cell DNAme disorder and DNAme are shown in scatterplots with linear regression lines colored per subject. Subject-specific Spearman correlation coefficients and p values are presented in Supplementary Table 2. h, Mean DNAme values (top panel) and DNAme disorder (bottom panel) across CpG islands with upstream and downstream CpG island shores. Each subject is represented by a single curve and colored by its IDH mutation subtype. Subtype-specific Spearman correlation coefficient and p-values indicate relationship between distance from CGI center and increase in mean cell DNAme disorder.
Unsupervised clustering and multidimensional scaling of the pairwise distances between single-cell DNAme patterns grouped tumor cells by IDH1 mutation status (Figure 1b), as IDH-mutant tumors display greater genome-wide DNAme levels (Figure 1c, Wilcoxon rank sum test p<2.2e-16)27. The co-localization of cells from different patients suggested shared epigenetic states. The isolated patient-specific grouping of 1 of 6 IDH-mutant and 2 of 5 IDH-wild-type tumors may reflect epigenetic diversity that is also influenced by genetic intertumoral heterogeneity (Figure 1b, Extended Data Fig. 1, Extended Data Fig. 4a).
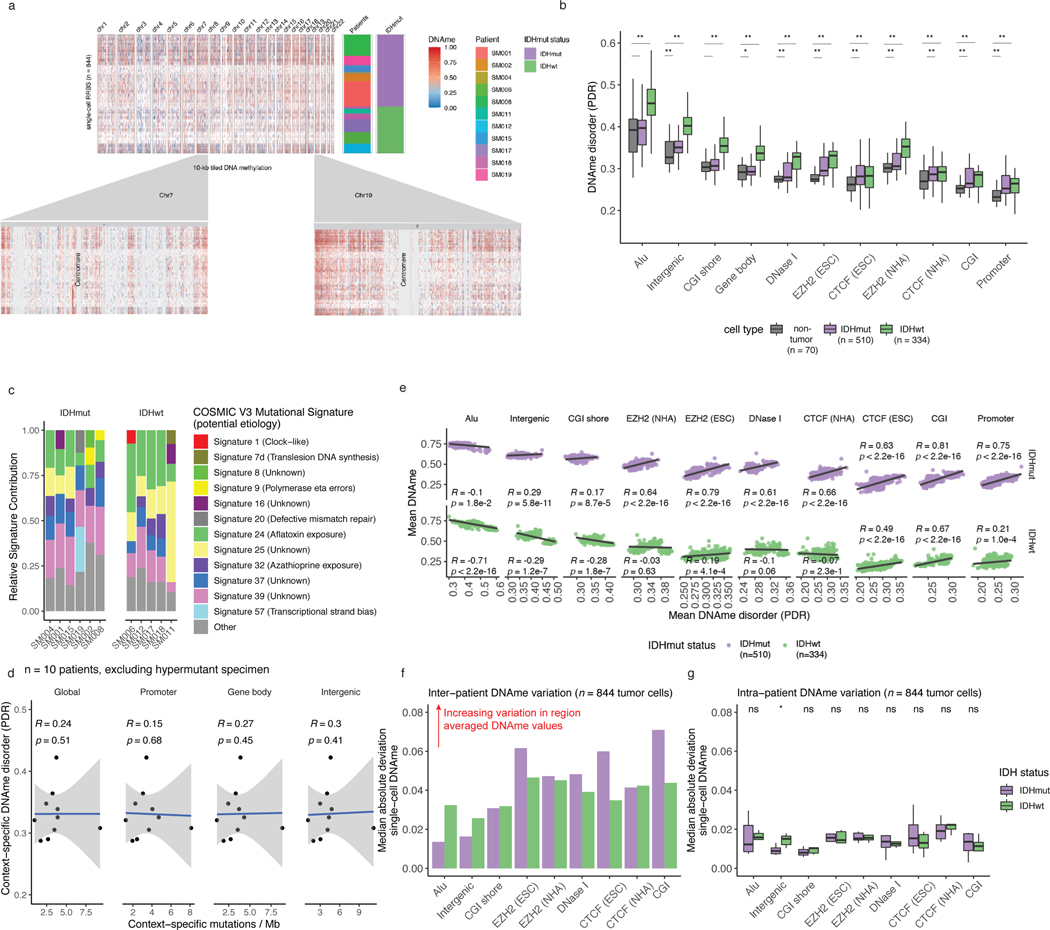
We next evaluated intratumoral epigenetic heterogeneity by quantifying stochastic DNAme alterations in each single cell. In normal cells, DNAme congruence in nearby CpGs reflects tightly ordered gene regulation (Figure 1d top panel)28. Local DNAme disorder may disrupt both proximal and distal gene regulation (Figure 1d bottom panel)16. We defined DNAme disorder within a cell and across specific genomic compartments as the proportion of sequencing reads discordant for DNAme status (PDR) as previously described5,18,29. Cell-to-cell DNAme disorder variation differed by tumor (Figure 1e) and was increased in tumor cells compared with non-tumor cells (Wilcoxon rank sum test p<0.0001, Extended Data Fig. 4b). Total somatic single nucleotide variant burden, reflecting patient age30 and mutational processes (Extended Data Fig. 4c), did not associate with mean DNAme disorder (Spearman correlation rho = 0.26, p = 0.43), independent of sequence context (Extended Data Fig. 4d). However, DNAme disorder did associate with the fraction of the genome with somatic copy number alterations (SCNA burden) (Spearman correlation rho=0.66, p=0.03, Figure 1e). Cell cycle checkpoint deregulation, which generates SCNAs through a cell’s compromised ability to correct mis-segregations31, may continue to drive stochastic DNAme replication errors during evolution rather than being elevated in the tumor cell of origin.
To examine whether local DNAme disorder associates with broad DNAme heterogeneity, we calculated the DNAme disorder and DNAme status for each cell across specific genomic contexts including: CpG islands (CGIs) and CGI shores, Alu repeat elements, and chromatin remodelers (EZH2 and CTCF, Extended Data Fig. 4e). In high DNAme regions (e.g., Alu repeat elements), increased DNAme disorder associated with decreased DNAme, while lower DNAme regions (e.g. CGIs) an increased DNAme disorder was associated with increased DNAme (Extended Data Fig. 4e, Spearman correlation p<0.01). These associations persisted in individual tumors (Figure 1f-g, Spearman correlation p<0.01), highlighting how local DNAme disorder may reflect epigenetically dynamic regions that contribute to the observed intratumoral epigenetic heterogeneity32,33. To compare inter- and intratumoral DNAme variation, median absolute deviations were calculated across single cells grouping cells by subtype (Extended Data Fig. 4f) and by patient (Extended Data Fig. 4g). Consistent with the results of unsupervised clustering (Figure 1b), intertumoral heterogeneity was ~2–3 times greater (IDH-wild-type) than intratumoral heterogeneity (Extended Data Fig. 4f-g) with promoters/CGIs representing variably methylated regions within a tumor. The DNAme disorder tended to increase moving away from CGI centers (Spearman correlation R=0.5, p=3.1e-8 IDH-mutant and R=0.6, p=4.1e-7 IDH-wild-type) suggesting selection may reduce DNAme disorder that impairs cellular fitness at these tightly regulated regions (Figure 1h). Taken together, single cell DNAme profiling suggests that the variability observed at critical gene regulatory regions is influenced by DNAme disorder, and higher levels of disorder may reflect epigenetic remodeling.
Elevated DNAme disorder in cell identity and stress pathways
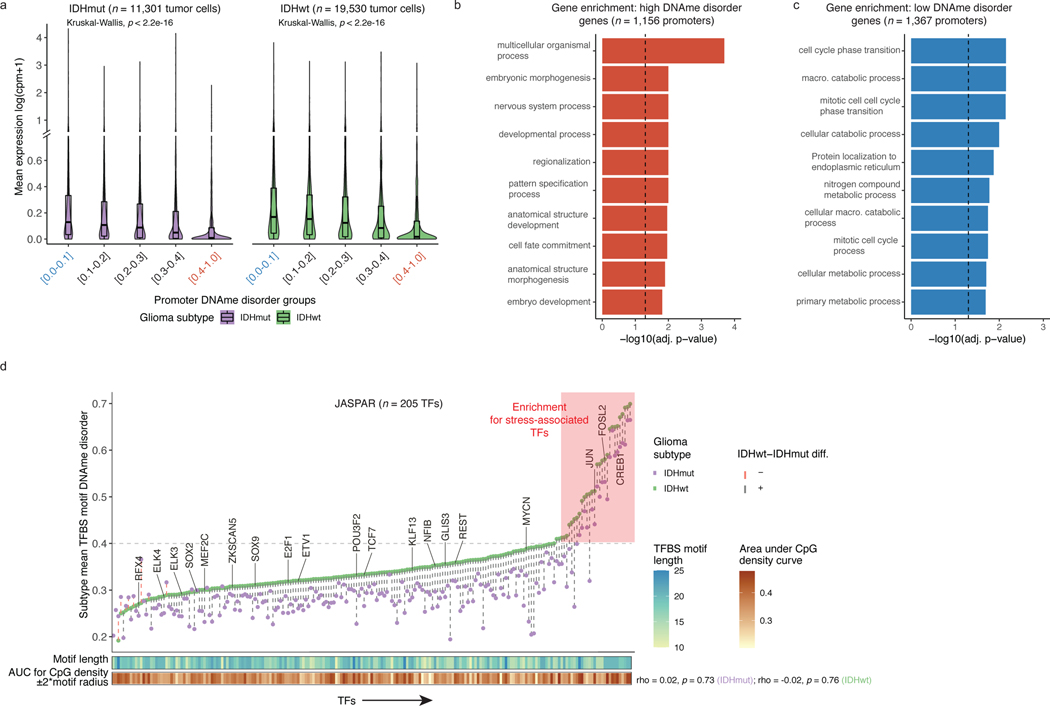
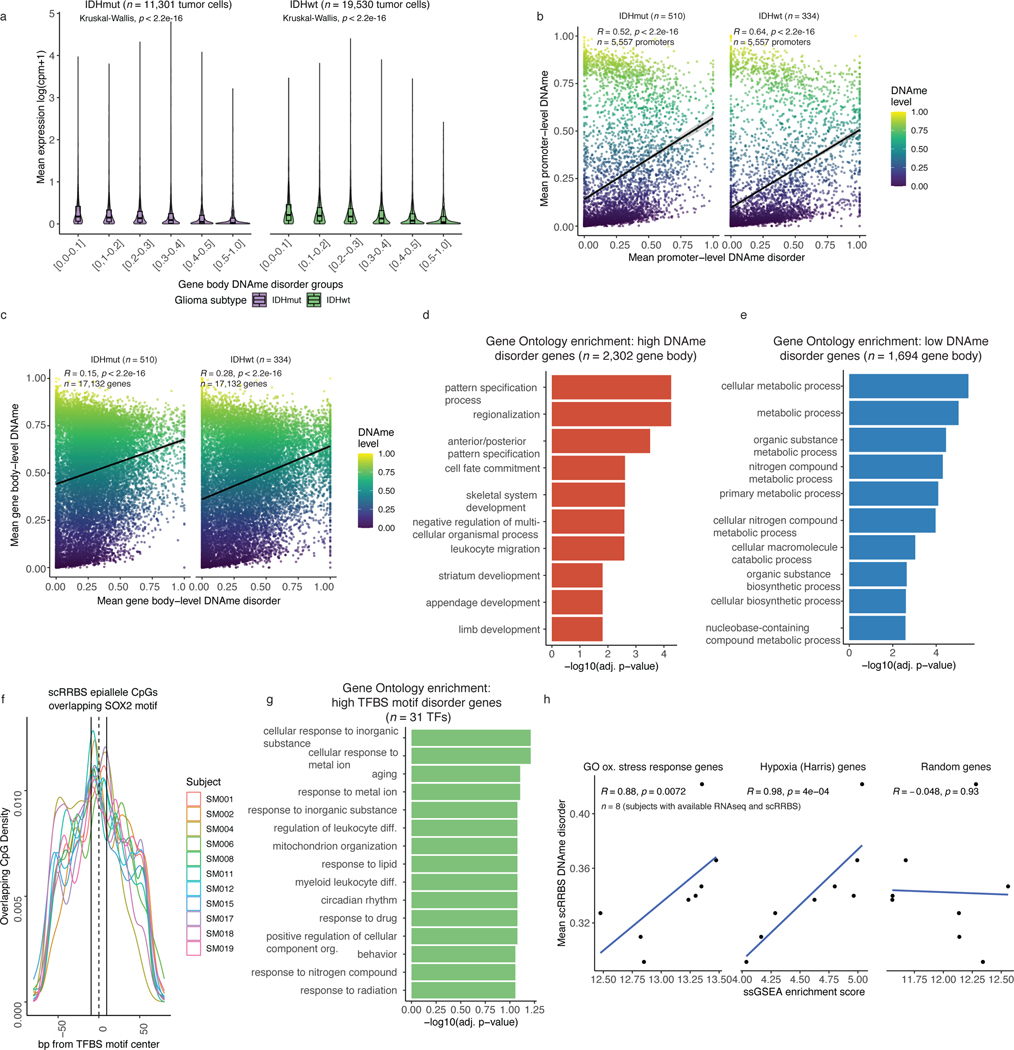
DNAme disorder may disrupt transcriptional programs18. Using companion single-cell RNAseq data, we examined the association between DNAme disorder and gene expression. Mean expression was reduced (Kruskal Wallis p<2.2e-16, Figure 2a) with increased levels of DNAme disorder at both promoters and gene bodies (Kruskal Wallis p<2.2e-16, Figure 2a, Extended Data Fig. 5a). Previous CpG island observations (Figure 1g) suggest that DNAme disorder at gene regulatory regions usually results in repressive DNAme (Extended Data Fig. 5b-c), contributing to gene expression dysregulation. Gene Ontology enrichment analysis on genes with high DNAme disorder (i.e., DNAme disorder > 0.4) and genes with low DNAme disorder (i.e., DNAme disorder 0.0–0.1) (Methods), found high DNAme disorder genes associate with cellular differentiation processes (Fisher’s exact test adj. p <0.05, Figure 2b) and low DNAme disorder genes associate with critical cell cycle and metabolic processes (Fisher’s exact test adj. p <0.05, Figure 2c). The enrichment results were consistent when using promoter or gene body DNAme disorder groupings (Extended Data Fig. 5d-e).
Figure 2. DNAme disorder at gene regulatory elements is associated with cell identity and stress response pathways.
a, Boxplots of gene expression values from single-cell RNAseq data across different promoter DNAme disorder groups. Each box spans the 25th and 75th percentile, center lines indicate the median, and the whiskers represent the absolute range (minima/maxima), excluding outliers. Surrounding violins represent the distribution for each condition. Kruskal-Wallis rank sum test p-values are presented for each subtype. The y-axis includes a line break to improve visibility of violin tails. b-c, Gene Ontology enrichment analyses for b, high DNAme disorder genes and c, low DNAme disorder genes using promoter DNAme disorder values with correction for false discovery rate. d, Scatterplot of mean single-cell DNAme disorder calculated across transcription factor binding site (TFBS) motifs within IDH subtype, ordered by IDHwt TFBS motif DNAme disorder. Each column represents a single transcription factor (TF) with a colored dotted line connecting IDHmut and IDHwt values. Names of TFs previously indicated to confer fitness advantages to glioma cells (MacLeod et al.)35 are listed above their TFBS motif DNAme disorder estimate. TFs with high DNAme disorder are shaded in red and annotation tracks are provided for motif length and motif CpG density (CpG density AUC within ±2*motif radius). P-values represent Spearman correlation for IDHmut (p=0.73) and IDHwt (p=0.76).
Changes in DNAme patterns at DNA-binding motifs can positively or negatively impact transcription factor binding34. We identified regulatory elements susceptible to DNAme changes by determining DNAme disorder of transcription factor binding site (TFBS) motifs (Figure 2d). Most transcription factor binding sites showed higher DNAme disorder in IDH-wild-type compared with IDH-mutant cells, consistent with general subtype differences. Transcription factors essential for glioma stem-cell maintenance (e.g., SOX2, SOX935) had lower than median binding site motif DNAme disorder independent of surrounding motif CpG density, implying selection against DNAme changes at these target regions (Figure 2d, Extended Data Fig. 5f). In contrast, transcription factors with higher binding site DNAme disorder (Methods) were related with response to extracellular stimuli (Extended Data Fig. 5g). Increased DNAme disorder levels at environmental stress response regulators may facilitate an adaptive response to stressors such as hypoxia, which is common in glioma36. To substantiate this association, we performed single-sample Gene Set Enrichment Analyses using bulk RNAseq data and demonstrated positive associations between tumor average DNAme disorder and upregulated stress response (Spearman correlation R = 0.9, p<0.01) or cellular response to hypoxia (Spearman correlation R =0.98, p<0.001), but not randomly selected genes (Spearman correlation R=−0.05, p>0.05, Extended Data Fig. 5h). Taken together, these results suggest that intratumoral variability in single-cell DNAme disorder may facilitate the adoption of distinct epigenetic states in response to stress stimuli.
scMulti-omics identifies epigenetic cell state regulators
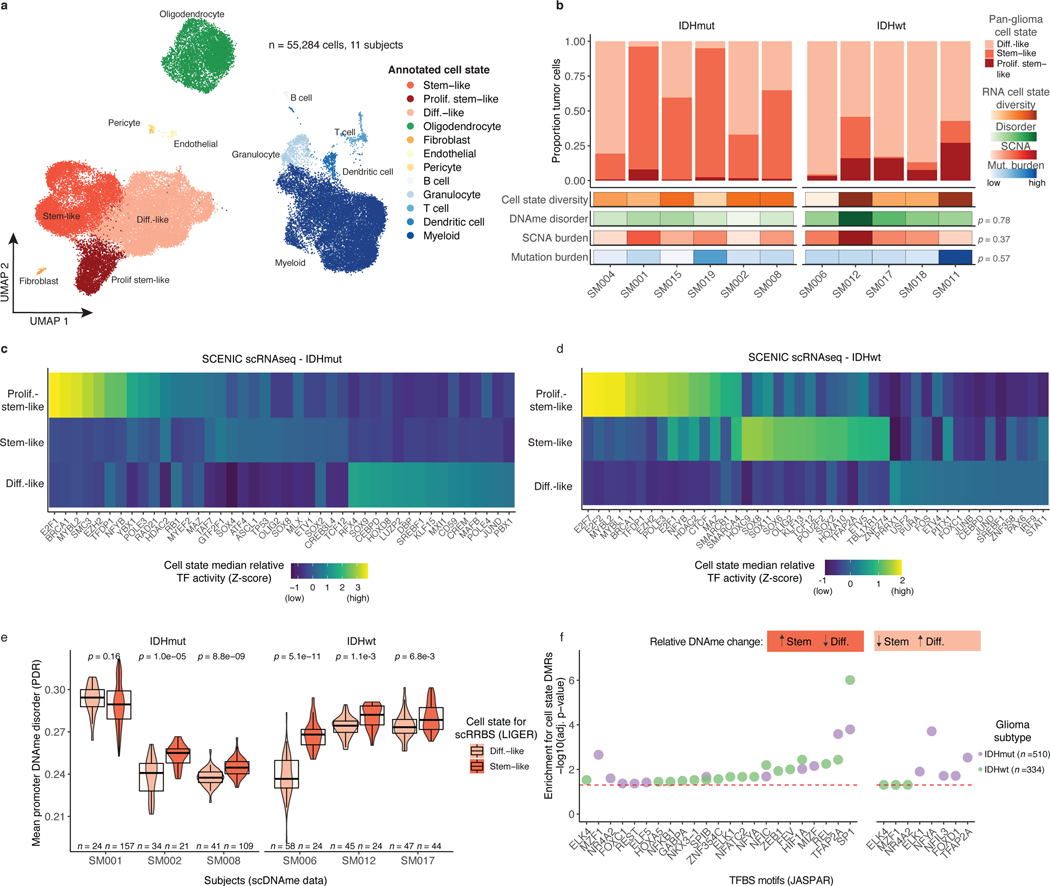
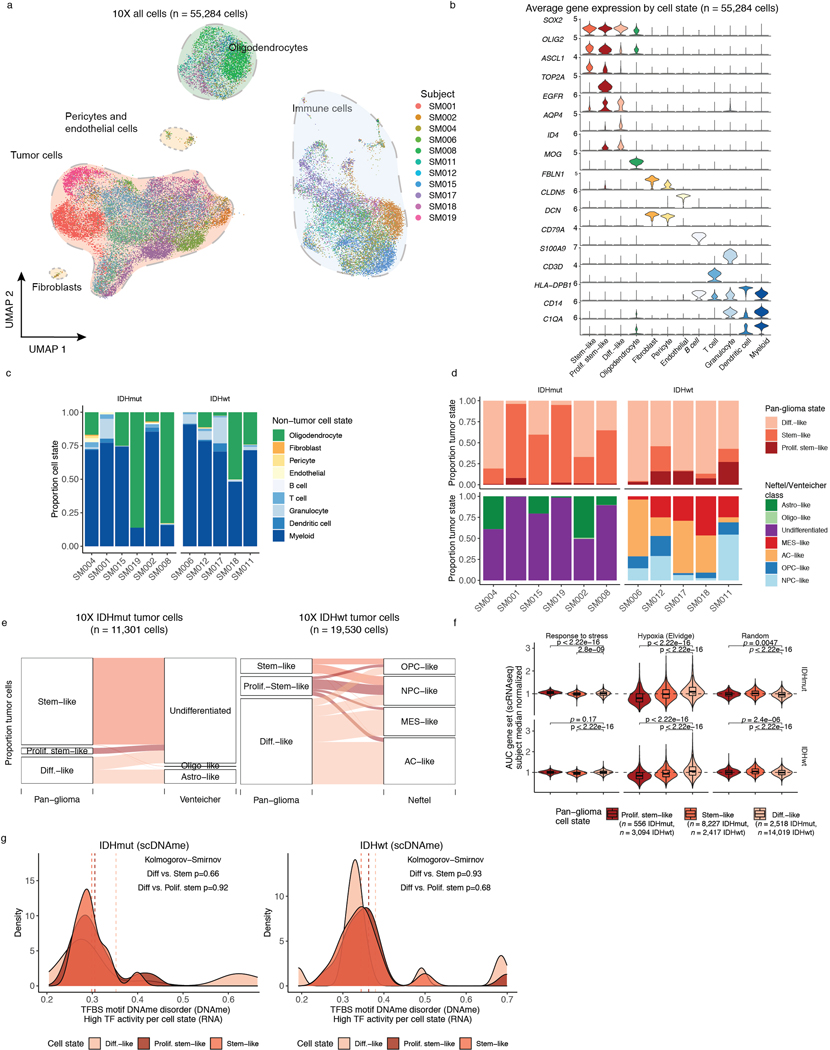
To evaluate how DNAme, stress response, and cellular states are associated, we defined each tumor’s cellular composition using single-cell transcriptional profiles. We performed single-cell unsupervised clustering analysis and annotated clusters using marker genes (Figure 3a, Extended Data Fig. 6a-d), to define glial, immune, stromal, and malignant populations10,12. Malignant cells were distributed over three canonical stem cell marker SOX2 expressing cell states (Extended Data Fig. 6b) and existed across both IDH-mutant and IDH-wild-type tumors. We labeled these pan-glioma cell states 1. differentiated-like, 2. stem-like, and 3. proliferating stem-like tumor cells (Figure 3a, Extended Data Fig. 6b, Supplementary Table 3). Enumerating the proportion of pan-glioma malignant states showed that IDH-mutant gliomas are enriched for stem-like cells (median 61%), while IDH-wild-type gliomas contained predominantly differentiated-like cells (median 83%) and significantly more proliferating stem-like cells (median 16% IDH-wild-type vs. 2% IDH-mutant, Wilcoxon rank sum test p=0.02, Figure 3b). The previously described malignant Astrocyte-like and Oligodendrocyte-like IDH-mutant glioma cell types15 corresponded to “differentiated-like” cells, as well as the Astrocyte-like and Mesenchymal-like IDH-wild-type glioma cellular states11 (Figure 3b, Extended Data Fig. 6e). The “proliferating stem-like” and “stem-like” states align closely with Undifferentiated IDH-mutant cells and oligodendrocyte progenitor-like, neural progenitor-like IDH-wild-type cells, respectively (Extended Data Fig. 6e), highlighting consistency of these pan-glioma signatures with existing glioma signatures11,15.
Figure 3. Integrative single-cell gene expression and DNAme analyses nominate epigenetic regulators of glioma cell state variability.
a, Uniform Manifold Approximation and Projection (UMAP) dimensionality reduction plot of scRNAseq data (n = 55,284 cells, n = 11 subjects) showing the clustering of cell populations by transcriptionally defined cell state (point color) and labelled according to marker gene expression (Extended Data Fig. 6b). b, Stacked bar plots representing the proportion of cellular states per tumor for pan-glioma malignant cell classification. Each sample is annotated with molecular metrics with p-values indicating the relationship between cell type diversity, measured by Shannon’s entropy, and sample mean DNAme disorder, whole-genome sequencing derived somatic alteration burden, or whole-genome sequencing derived somatic mutation burden (Spearman correlation). c-d, Enriched transcription factor activity across pan-glioma cellular states determined using SCENIC algorithm and displayed as a heatmap of cell state median relative z-scores. Visualization is presented for the top 15 most active TFs of 5,000 randomly downsampled tumor cells in both c, IDHmut and d IDHwt. e, Promoter DNAme disorder for tumors with at least 10 cells per inferred cell state. Each box spans the 25th and 75th percentile, center lines indicate the median, and the whiskers represent the absolute range (minima/maxima), excluding outliers. Surrounding violins represent the distribution for each condition. Two-sided Wilcoxon rank sum test p-values are presented for each tumor. f, Region set enrichment analysis for differentially methylated regions (DMRs, 10-kb tiles) with higher DNAme in Stem-like (left panel) or Differentiated-like cells (right panel). Enrichment was determined by Locus Overlap Analysis (LOLA). Individual points represent enrichment of specific TFs in differentially methylated regions, color indicates results for specific IDH subtype, and dotted line represents the statistical significance threshold (adj. p-value < 0.05).
We next inferred gene regulatory networks from single-cell expression profiles to identify transcription factors (TFs) governing cell states37, which predicted a key set of TFs for each of the three pan-glioma cell states (Figure 3c-d). Stem-like tumor cells demonstrated the highest activity for known stem-cell regulators such as SOX2, SOX8, and OLIG2 (Figure 3c-d). In addition to high SOX2/SOX8/OLIG2 activity, proliferating stem-like cells showed overrepresentation of chromatin remodeling and DNA repair gene networks as directed by EZH2 and BRCA1 (Figure 3c-d). In contrast, differentiated-like cells demonstrated high TF activity in astrocyte differentiation (i.e., SOX9) and stress response (i.e., JUND, FOS) processes. We confirmed that differentiated-like cells had significantly greater stress and hypoxic transcriptional response compared with stem-like cells (Wilcoxon rank sum test, p<2.8e-9, Extended Data Fig. 6f). DNAme disorder did not significantly differ between cell state-specific TFs (Kolmogorov-Smirnov test p>0.05, Extended Data Fig. 6g). However, high binding site motif DNAme disorder levels were observed for several differentiated-like cell state TFs (e.g., JUND, and SREBF1), nominating them as cellular fitness regulators whose activity may be influenced by DNAme patterns (Figure 3c-d).
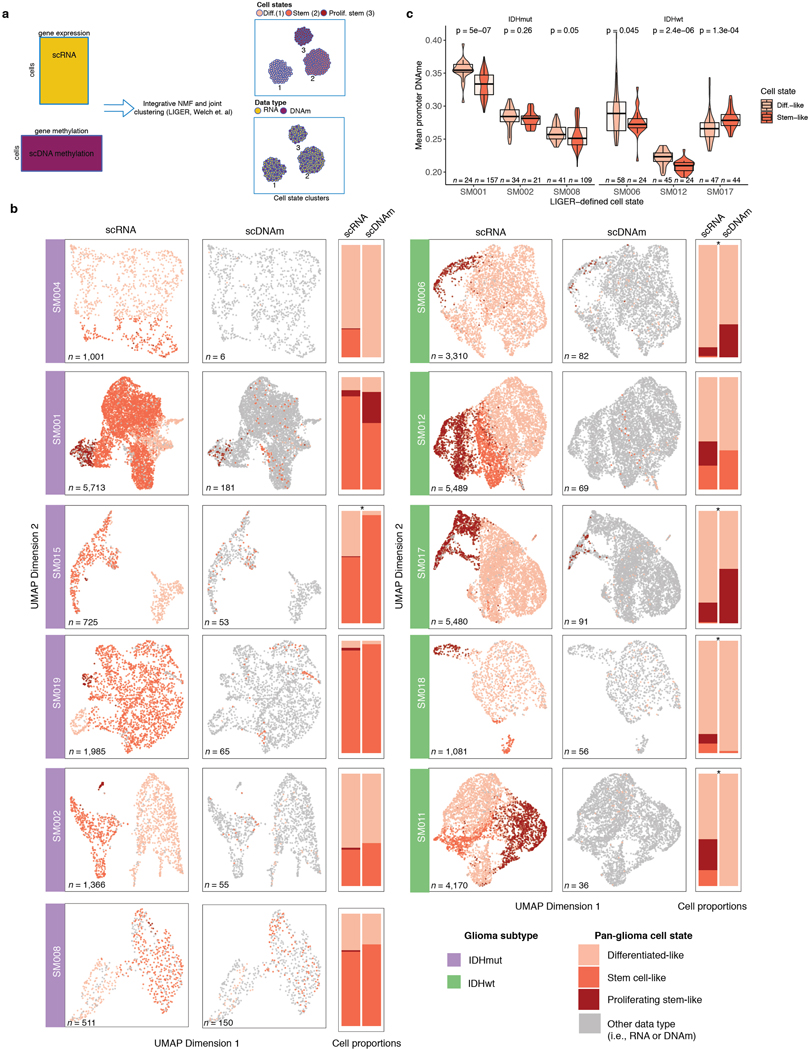
To define the epigenetic states of stem-like and differentiated-like cells, we used the linked inference of genomic experimental relationships (LIGER) method38 to identify shared properties between single-cell gene expression and DNAme data (Extended Data Fig. 7a). scDNAme and scRNA integration displayed a similar malignant cell state distribution within each sample, as expected when derived from the same tissue dissociation (Extended Data Fig. 7b). We next investigated the DNAme disorder and DNAme properties of stem-like (combining stem-like and proliferating stem-like) and differentiated-like cell state classifications. In tumors with both populations, stem-like cells displayed significantly increased promoter DNAme disorder (5/6 tumors, Wilcoxon rank sum test p<0.05; Figure 3e left panel) and decreased promoter DNAme (4/6 tumors, Wilcoxon rank sum test, p<0.05, Extended Data Fig. 7c), potentially reflecting stem-like cells’ greater transcriptional diversity. To identify DNAme changes between stem-like and differentiated-like cells we used a linear mixed effect model with tumor of origin as the random effect (Methods). Regions with differential DNAme across cell states were enriched for SP1 and TFAP2A binding sites, two TFs that frequently co-regulate developmentally associated genes (Figure 3f)39. We also identified increased DNAme at binding sites of HIF1A/ARNT, the master transcriptional regulator of hypoxic response, in stem-like cells (Figure 3f). As increased DNAme at binding sites may reduce transcription factor binding efficiency, these results suggest that elevated cell stress TF activity in differentiated-like cells may occur via epigenetic remodeling (Figure 3f). Together, these results suggest that perturbing epigenetic control via DNAme disorder may promote the cell state plasticity necessary to tolerate diverse stressful microenvironments, including hypoxia40 and therapy17,41,42.
In vitro stress perturbations increase local DNAme disorder
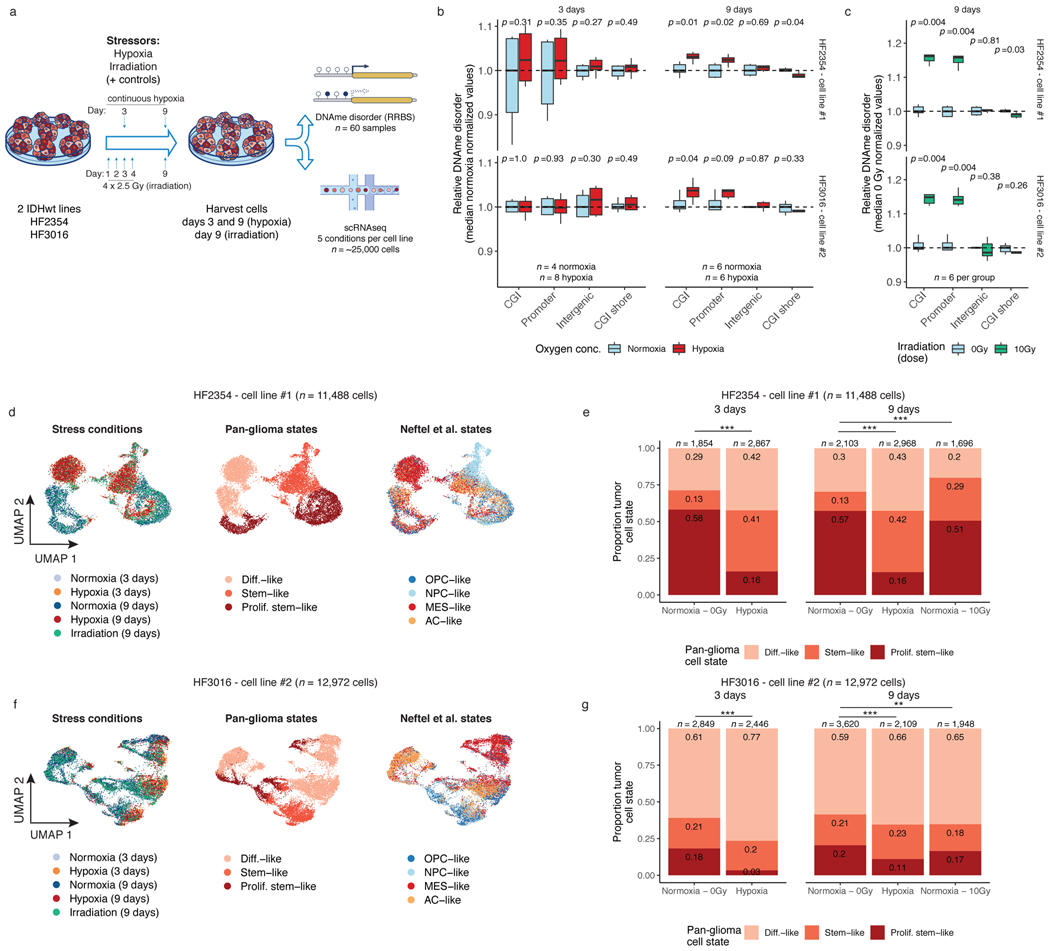
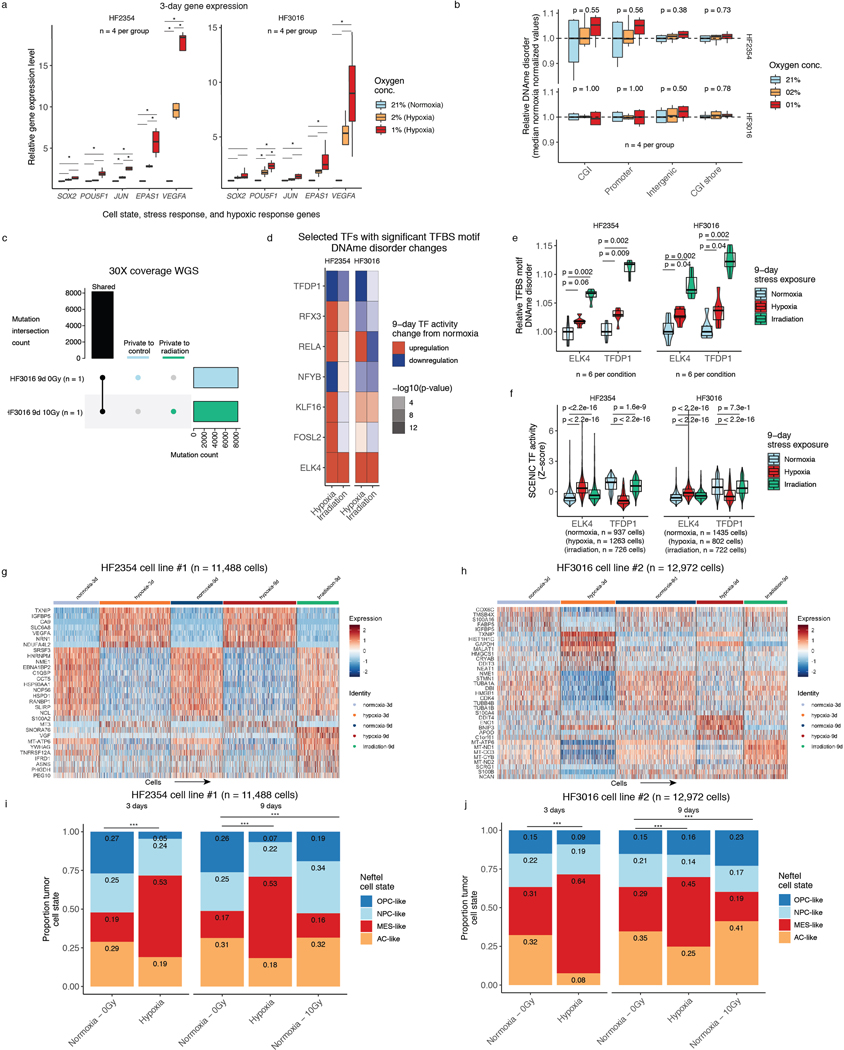
To directly determine whether environmental stressors impact DNAme disorder and cellular states, we subjected glioma patient-derived sphere-forming cells independently to a common tumor stress exposure (i.e., hypoxia) and therapeutic exposure (i.e., irradiation) (Figure 4a). For both experiments, we used bulk RRBS with biological replicates (n=6 average per condition, 60 total replicates), and gene expression with single-cell RNAseq. Importantly, each bulk RRBS sequencing read comes from a single cell at single-allele resolution enabling DNAme disorder comparisons with our scRRBS data. We exposed two glioma cell lines to normoxic and hypoxic conditions and harvested cells at 3 days and 9 days. Candidate gene expression analyses via real-time PCR demonstrated that a robust cellular stress response was already present at the 3-day timepoint with an observed hypoxia dosage effect (Extended Data Fig. 8a-b). No hypoxia-associated DNAme disorder changes were detectable at the 3-day time point (Wilcoxon rank sum test p>0.05, Figure 4b left panel). However, there were significant hypoxia-associated DNAme disorder increases in both cell lines at the 9-day time point, suggesting that DNAme disorder accumulates with successive cell divisions (Wilcoxon rank sum test p<0.05, Figure 4b right panel). In parallel, we also irradiated the two glioma models with 2.5Gy per day for four consecutive days (10Gy total) and then harvested these cells at the 9-day time point. Unlike the hypoxia exposure, the irradiation stressor was not continuous, and measurements were taken after five days of recovery. The cells exposed to irradiation also demonstrated significant increases in DNAme disorder at CpG island and promoter regions (Wilcoxon rank sum test. p<0.01, Figure 4c) compared with the 9-day normoxia (0Gy) samples. We confirmed through whole genome sequencing that irradiated and control cells shared highly similar mutational profiles suggesting the DNAme disorder increases were not due to underlying genetic changes (Extended Data Fig. 8c). In both hypoxia and irradiation experiments, there was reduced stress-associated DNAme disorder in regions flanking CpG islands (shores) in one cell line, but no significant changes at intergenic regions indicating that DNAme disorder may confer different selective advantages dependent on genomic context (Figure 4b and Figure 4c). DNAme disorder increases under direct stress (hypoxia) and following recent stress exposure (irradiation) suggests a common stress response mechanism that is retained even after stress removal. This is further supported by increased DNAme disorder at binding site motifs of TFs whose activity is associated with cell fitness (Extended Data Fig. 8d), including upregulated ELK4 that contributes to the malignant phenotype through c-Fos regulation43 and downregulated TFDP1 that promotes transcription from E2F target genes44, whose altered activity levels may enable survival under stress (Extended Data Fig. 8 e).
Figure 4. Environmental stressors increase local DNAme disorder in vitro and are associated with cellular state shifts.
a, in vitro experimental workflow. Patient-derived glioma sphere-forming cells were exposed to continuous stress (hypoxia, 3-day and 9-day), stress followed by recovery (irradiation, 4-day stress exposure and 5-day recovery), and no stress/normoxia controls. Biological replicates were then profiled with bulk RRBS (n=6 average per condition) and scRNAseq. b, Boxplot of relative DNAme disorder (normalized to controls) for hypoxia at the 3-day time point (left) and 9-day time point (right). Each box spans the 25th and 75th percentile, center lines indicate the median, and the whiskers represent the absolute range (minima/maxima), excluding outliers. Two-sided Wilcoxon rank sum test p-values are presented for different genomic contexts. Each row represents a distinct IDHwt patient-derived cell line (HF2354 and HF3016). c, Relative DNAme disorder for irradiated (10Gy) compared with no exposure controls (normoxia, 0 Gy). d, UMAP dimensionality reduction plot of scRNAseq for HF2354 exposed to 3-day hypoxia, 9-day hypoxia, and 9-day irradiation with no treatment controls. The inset UMAP projections are identical with different annotations to demonstrate the different stress conditions, the pan-glioma cell states described here, and the proliferation independent cell states (Neftel et al.)11 e, Stacked bar plot for the pan glioma cell states summarized by stress exposure and time point for HF2354 (n = 11,488 cells). Chi-Square tests for significant changes in cellular proportions between exposures is presented (*** = p < 2.2e-16, ** = p < 0.01). f-g, The same analysis as d-e, is presented for the second independent cell line HF3016 (n = 12,972 cells).
We next assessed whether stress-associated DNAme disorder increases are linked with cellular state shifts using single-cell RNA sequencing (10 total replicates, n=5 conditions for 2 cell lines each, n=24,460 cells). Unsupervised clustering by cell line demonstrated that stressed cells did not adopt novel cell states but manifested as population cell state distribution shifts (Figure 4d-g). This was supported by relatively few stress-specific differentially expressed genes (hypoxia=166 (H2354); 68 (HF3016); irradiation=27 (H2354); 26 (HF3016), Wilcoxon rank sum test adj. p<0.05) that tended to be highly expressed across all states within a condition (e.g., TXNIP in hypoxia, Extended Data Fig. 8g-h). We observed that there were hypoxia-associated increases in differentiated-like cell and reductions in proliferating stem-like cell proportions across both cell lines (Chi-squared p<2.2e-16, Figure 4e,g). Response to irradiation resulted in an increased stem-like compartment for HF2354 and a greater differentiated-like cell compartment for HF3016 (Chi-squared test p<0.01). After nine days, cell state distributions of both irradiated cell models and the hypoxia condition for HF3016 were more comparable to controls, suggesting that stress-induced transcriptional shifts can be transient. We confirmed these stress-associated cell state shifts using a proliferation independent IDH-wild-type-specific cell classifier (Extended Data Fig. 8i-j). Taken together, stress-associated increases in DNAme disorder suggests that distinct microenvironmental pressures contribute to intratumoral epigenetic heterogeneity that may facilitate or stabilize adaptive cell state shifts.
SCNAs are positively correlated with DNAme disorder
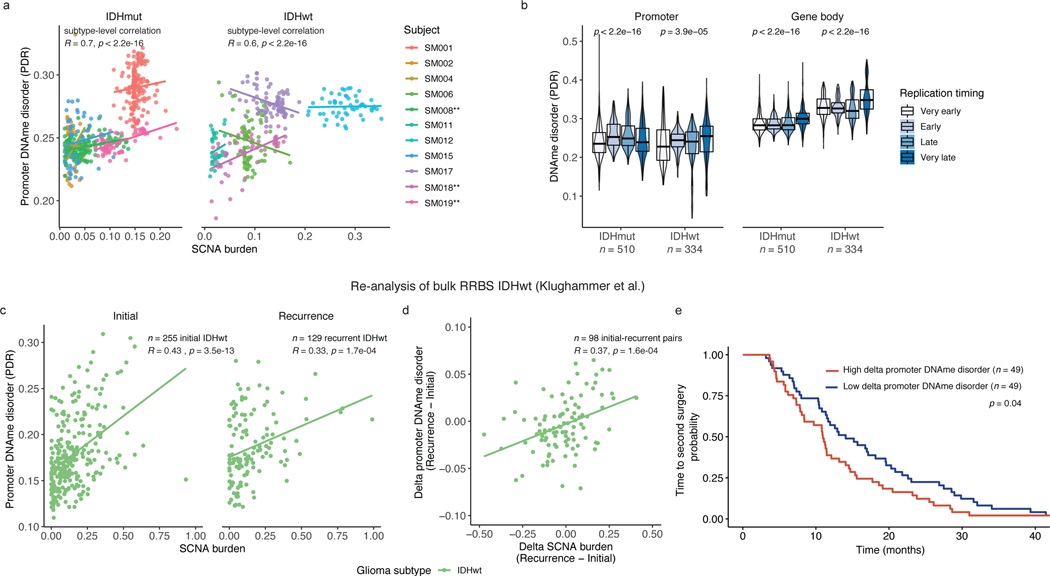
We next investigated whether cellular stress resulting from genetic stimuli, in addition to environmental stimuli, could further explain DNAme disorder variability across a tumor. The fraction of genome with SCNAs correlated with DNAme disorder at the bulk level (Spearman correlation rho=0.66, p=0.03, Figure 1e) as well as at the single-cell level for promoter-specific DNAme disorder and single-cell inferred SCNAs (Spearman correlation rho=0.70, p<2.2e-16 IDH-mutant and rho=0.6, p<2.2e-16 IDH-wild-type, Figure 5a). There were three significant intratumoral positive associations (Spearman correlation, p<0.05, Figure 5a) indicating a weaker genetic effect or greater influence of microenvironmental stressors within a single tumor (Figure 5a). To determine whether this relationship was driven by greater DNAme disorder in copy number altered regions, we calculated the DNAme disorder by cell in copy number altered and non-altered regions. We did not observe a consistent relationship between DNAme disorder and the copy number status in single-cell DNAme data (paired Wilcoxon rank sum test p > 0.05). This suggests aneuploidy does not directly account for epigenetic diversity increases, but that genetic and epigenetic events are shaped by similar biological processes (e.g., DNA replication stress). Late replicating regions of the genome accumulate more DNA mutations and structural rearrangements45, and we observed a positive association between single-cell promoter and gene body DNAme disorder with later replicating regions (Kruskal Wallis p<1e-04, Figure 5b). Late replicating genomic regions may have reduced capacity to correct aberrant methylation leading to their preferential accumulation in a largely stochastic manner.
Figure 5. Somatic copy number alterations are associated with DNAme disorder during disease evolution.
a, Scatterplot depicting the association between single-cell (n = 790 non-polyploid tumor cells) derived somatic copy number alteration (SCNA) and promoter DNAme disorder by IDHmut (left panel) and IDHwt (right panel) subtypes. Points and linear regression lines are colored by subject. Spearman correlation coefficients represent subtype-specific estimates. Patient-specific significant positive correlations are indicated with a ** (Spearman correlation p < 0.05). b, Boxplots with surrounding violins of DNAme disorder calculated across the promoter (left panel) and gene body regions (right panel) based on different DNA replication times in IDHmut (n = 510) and IDHwt (n = 334) single cells. Each box spans the 25th and 75th percentile, center lines indicate the median, and the whiskers represent the absolute range (minima/maxima), excluding outliers. Surrounding violins represent the distribution for each condition. Kruskal-Wallis p-values indicate a test for differences across the replication time groupings separately for IDHmut and IDHwt cells c, Scatterplot with subtype-level linear regression lines depicting the re-analysis of bulk promoter DNAme disorder and SCNA burden in IDHwt initial (n = 255) and recurrent (n = 129) tumors (Klughammer et al.). Spearman correlation coefficients and p-values are presented for each independent timepoint. d, Scatterplot and linear regression line depicting the association between bulk delta (subject-specific recurrence – initial estimates) SCNA burden and delta promoter DNAme disorder in longitudinally profiled IDHwt tumors (n = 98 subjects, Klughammer et al.) Spearman correlation coefficient and p-value are presented. e, Kaplan-Meier curve depicting time to second surgery in subjects where the change in promoter DNAme disorder between initial and recurrent disease was above (high, red) and below (low, blue) the median. Log-rank p-value for univariate analysis is presented within the figure. Hazard Ratio and p-value for change in DNAme disorder are presented for multi-variate Cox proportional hazard model including subject age and sex as predictors in Supplementary Table 4.
To validate the relationship between SCNA and DNAme disorder, we re-analyzed the bulk RRBS and copy number profiles of initial (n=255 patients) and recurrent (n=129 patients) IDH-wild-type gliomas, including matched pairs (n=98 patients)5. SCNA burden was positively associated with DNAme disorder at both initial and recurrent time points, confirming our findings (Spearman correlation rho=0.43, p=3.5e-13 initial; R=0.33, p=1.7e-04 recurrence, Figure 5c). We repeated our analysis using only paired initial and recurrent samples and observed a positive association between increases in SCNA burden and DNAme disorder (Spearman correlation R=0.37, p=0.0002, Figure 5d). Furthermore, the greatest changes in DNAme disorder between initial and the recurrent tumor were associated with a shorter time to second surgery in both univariate (log-rank test p=0.04, Figure 5e) and multivariate survival analyses (Cox proportional hazard model, HR=1.55 95% CI (1.39–2.34), p=0.03, Table S3) supporting that increased epigenetic instability is associated with accelerated disease progression. We did not observe a significant positive association with overall survival (Cox proportional hazard model, HR=1.43 95% CI (0.93–2.20), p=0.10, Supplementary Table 4). SCNA burden or aneuploidy results from errors in mitotic checkpoints, which may further perpetuate DNAme disorder and epigenetic heterogeneity through aneuploidy-induced metabolic and replication stress31.
Genomic alterations influence but do not define cell states
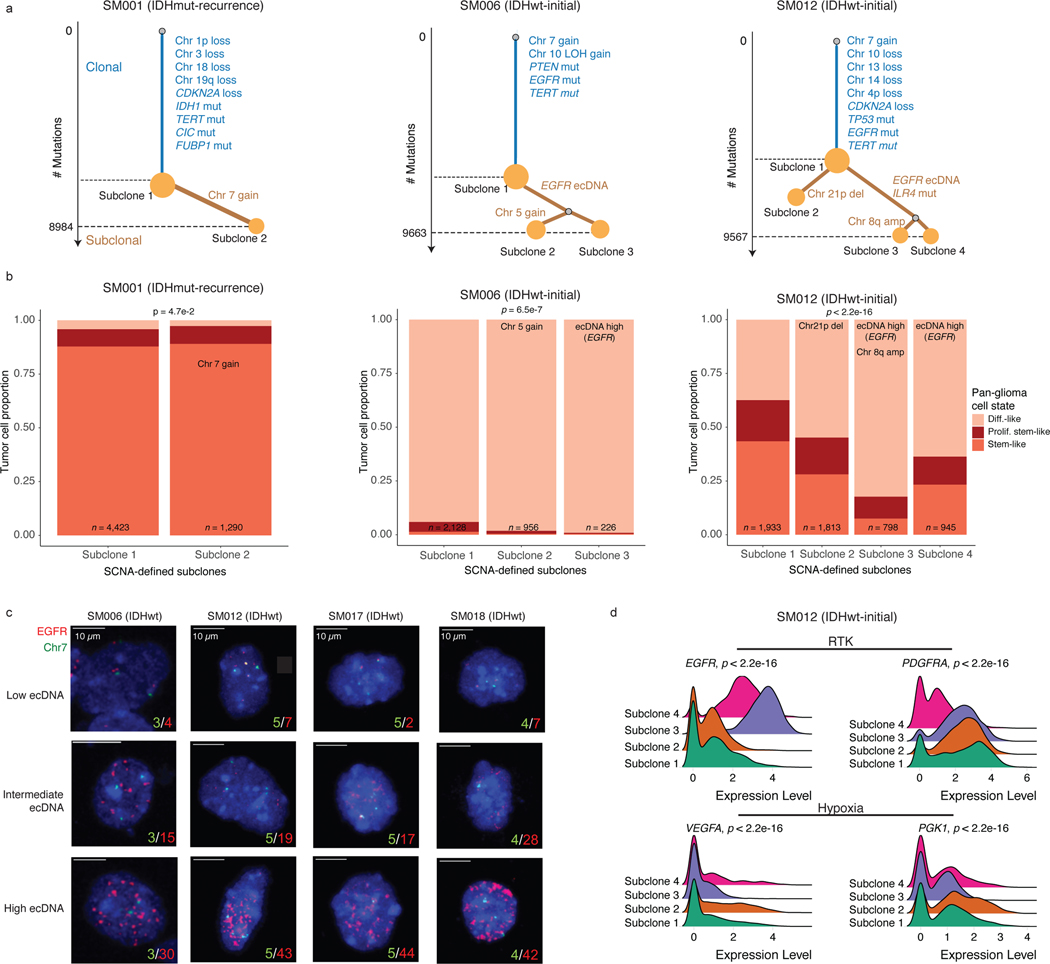
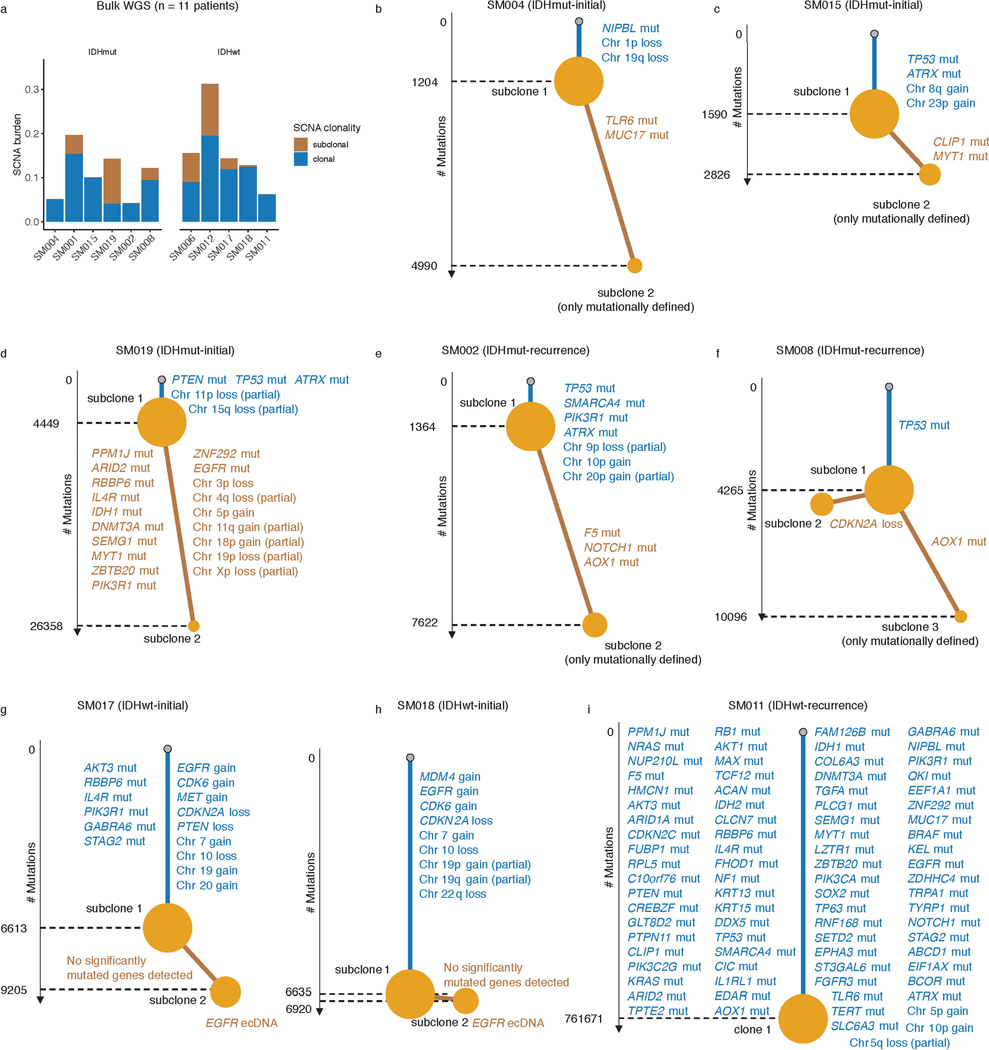
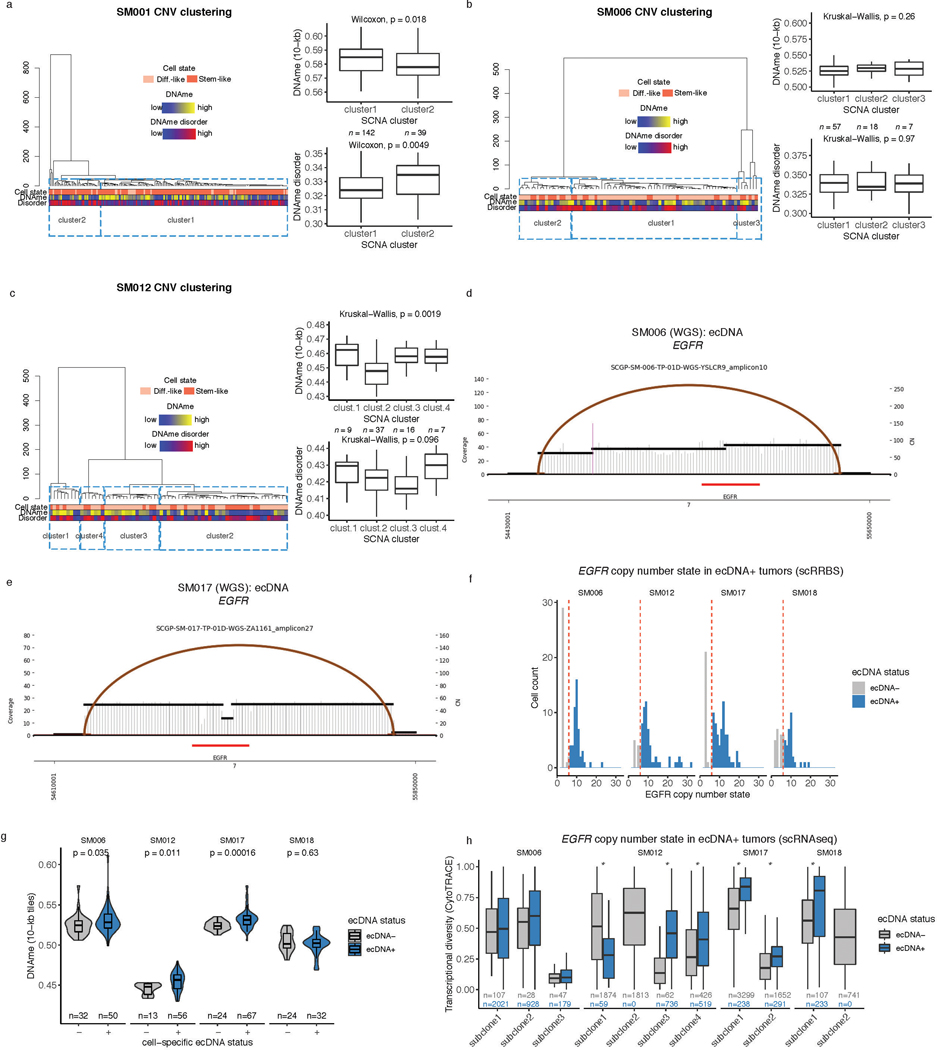
The processes driving genetic, epigenetic, and transcriptomic heterogeneity may act at different times with dynamic effects on cellular state distributions. To evaluate the timing and relative impact of genetic alterations on epigenetic and transcriptomic intratumoral heterogeneity, we inferred clonal phylogenies from bulk whole genome sequencing data. One to four subclonal populations were detected per tumor (Figure 6a), with linear and branched evolutionary patterns consistent with previous reports1,6. Chromosomal arm-level SCNA events were more likely to be classified as clonal/early (Fisher’s exact test p=0.03, Extended Data Fig. 9a), while mutations at genes significantly mutated in glioma were more evenly distributed across subclones (56.1% classified as clonal in non-hypermutant tumors) (Methods, Extended Data Fig. 9b-i). To determine how strongly intratumoral genetic heterogeneity is linked with epigenetic heterogeneity we compared the distribution of cell states, DNA methylation, and DNAme disorder across single cell copy number-based hierarchal clustering (scRRBS, Extended Data Fig. 10a-c). DNAme and DNAme disorder levels differed across copy number clusters, suggesting genetic and epigenetic co-evolution (Wilcoxon rank sum test p<0.05, Extended Data Fig. 10a-c). However, LIGER-defined cell state DNAme patterns were distributed across distinct copy number profiles suggesting a convergence on shared epigenetic states. We next asked whether genetic tumor subclones associated with transcriptional diversity. We inferred single-cell transcriptome copy number profiles and found that three of eleven tumors (SM001, SM006, and SM012) had at least two distinct clones with chromosome arm-level alterations (Figure 6b, Extended Data Fig. 3). These tumors demonstrated significant cell state distribution shifts across clones suggesting that the genetic heterogeneity also increases transcriptomic heterogeneity (per sample Fisher’s Exact test, p<0.05, Figure 6b). Collectively, these results suggest that large-scale copy number alterations occurring early in tumor development affect the observed epigenetic and transcriptomic diversity.
Figure 6. Clonal evolution analyses highlight that genetic alterations influence, but do not determine cellular states.
a, Examples of phylogenetic trees constructed from bulk whole genome sequencing data (mutations and SCNAs) and further annotated using single cell inferred copy number alterations (scRRBS + scRNAseq). Tree nodes represent alterations specific to the given clone, with node size corresponding to the estimated fraction of tumor cells with the associated alterations. Branch length scales with the number of mutations attributed to that clone. Clonal alterations are colored in blue, with subclonal alterations colored in gold. Genes significantly mutated in TCGA analyses 2 and chromosomal arm-level gain and loss events are presented. b, Single-cell RNAseq-derived cellular proportions separated by copy number-defined tumor subclone (Extended Data Fig. 3). Reported p-values represent two-sided Fisher’s exact test comparing the cellular state distributions across tumor subclones. c, Representative Fluorescence in situ hybridization (FISH) images for IDHwt tumors computationally predicted to harbor EGFR extrachromosomal DNA (ecDNA) by whole genome sequencing (n = 4 patients). FISH images show EGFR amplifications (red) that occur distal to control chromosome 7 probes (green) indicating extrachromosomal status and high variability in copy number status across tumor cells. Scale bars = 10 microns. d, Ridge plots of subject SM012 single-cell expression of receptor tyrosine kinase and hypoxia-associated genes, grouped by copy number-defined subclones. Reported p-values represent two-sided Wilcoxon rank sum tests comparing the gene expression of cells across tumor subclones.
EGFR-amplifying extrachromosomal DNA (ecDNA) elements in IDH-wild-type gliomas amplify oncogenes and enhancer elements and drive genetic heterogeneity46–49. We hypothesized that the impact of ecDNA on genomic heterogeneity extends to fueling epigenetic and transcriptomic diversity48,50. We detected ecDNAs using whole-genome sequencing and validated their presence by fluorescence in situ hybridization (Figure 6c, Extended Data Fig. 10d-e). EGFR ecDNAs, like chromosomal arm level events (e.g., chr7 amplification in SM001) distinguished subsets of tumor cells (e.g. EGFR ecDNA in SM012) (Figure 6b, Extended Data Fig. 10d-e). We classified both single-cell DNAme and RNA profiles as ecDNA+ or ecDNA- based on EGFR copy number level (Extended Data Fig. 10f). EcDNA+ cells had increased genome-wide DNAme in 3 of 4 cases (Wilcoxon rank sum test p<0.05, Extended Data Fig. 10g) and greater transcriptional diversity using gene count signatures compared with ecDNA- cells (Wilcoxon rank sum test p<0.05, Extended Data Fig. 10h, Methods)51. The tumor with the highest number of genetic subclones and DNAme disorder (SM012) contained an EGFR amplifying ecDNA assigned to subclones 3 and 4 which were marked by differential expression of a receptor tyrosine kinase gene signature. EcDNA- subclone 2 most closely associated with hypoxia gene expression (Wilcoxon rank sum test p<2.2e-16, Figure 6d), providing an example of how genetic heterogeneity may shape epigenetic and transcriptional reprogramming. In summary, our evolutionary analyses show that intratumoral genetic heterogeneity influences but does not determine epigenetic or transcriptomic cell states.
External pressures shape adaptive DNAme changes
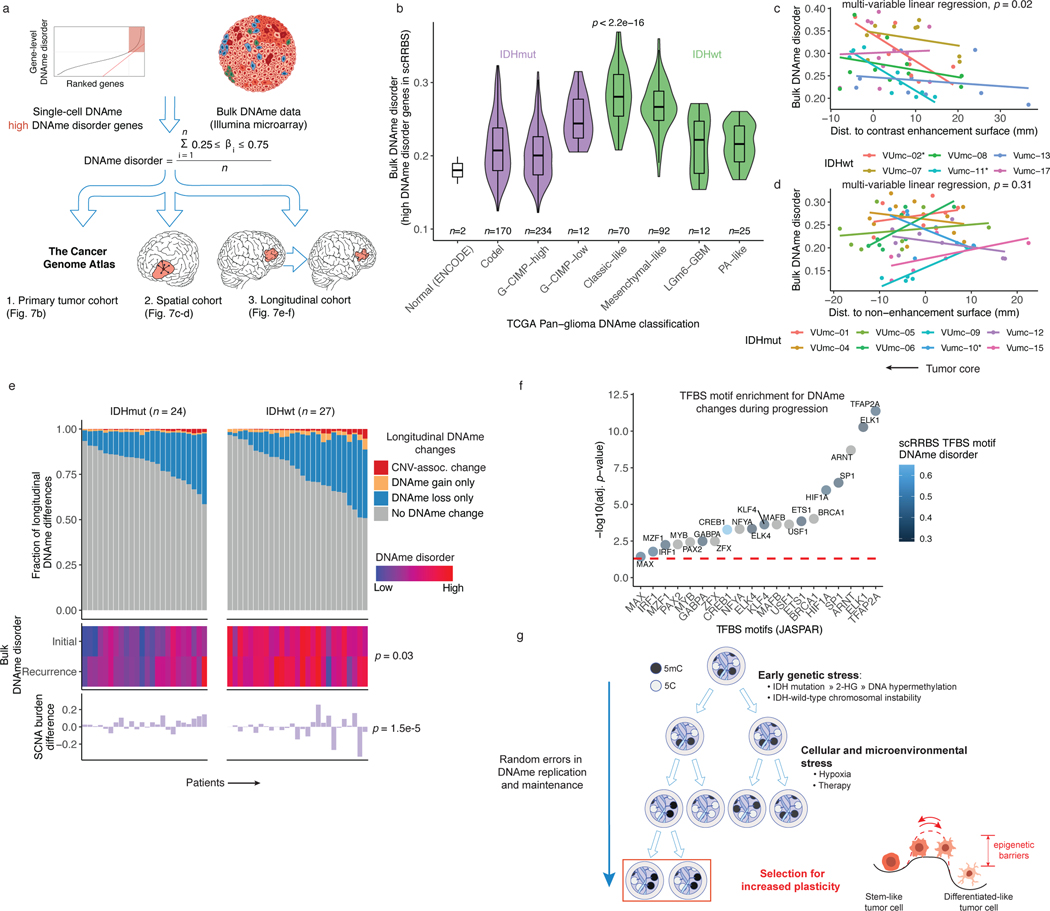
We next asked whether epigenetic diversity accelerates tumor evolution by promoting cell survival in resource-deprived tumor environments (e.g., hypoxia or therapeutic exposures). To address this question and extend the generalizability of our findings, we analyzed DNAme profiles from large-scale microarray-based bulk glioma studies2,4,52. We inferred a microarray metric from the single-cell DNAme data that quantified the DNAme disorder-susceptible gene regions (Figure 7a). We reasoned that regions prone to DNAme changes would reflect this stochasticity in bulk data by assuming intermediate DNAme values (Figure 7a). This bulk DNAme disorder metric approximated single-cell DNAme disorder averages across our cohort (Spearman correlation R=0.65 p=0.02). Applying this DNAme disorder metric to The Cancer Genome Atlas (TCGA) data identified differences across TCGA-defined subtypes2, with IDH-wild-type tumors displaying the highest levels (Kruskal Wallis p<2.2e-16, Figure 7b). Integrating matching DNAme and RNAseq samples from 568 TCGA samples showed that high bulk DNAme disorder samples showed increased transcriptional activity of oxidative stress response genes, corroborating our earlier positive associations between epigenetic instability and stress response regulation (Spearman R=0.47, p<2.2e-16, n=516 IDH-mutant initial tumors, R=0.31, p=0.03, n=52, IDH-wild-type initial tumors).
Figure 7. Integrated molecular trajectories support adaptive DNAme changes under microenvironmental and therapeutic stress.
a, Workflow for construction of a DNAme disorder metric in bulk cohorts informed by regions of high DNAme disorder in single-cell DNAme data. b, Boxplots with surrounding violins displaying the bulk DNAme disorder metric calculated across previously described DNA-methylation based TCGA classifications2 and ENCODE normal cell types (astrocyte and embryonic stem cell). Each box spans the 25th and 75th percentile, center lines indicate the median, and the whiskers represent the absolute range (minima/maxima), excluding outliers. Violins represent the distribution for each condition. Kruskal-Wallis test for differences in distributions across classification is reported (n = 615 primary gliomas, p < 2.2e-16). c-d, Scatterplots depicting distance from radiographic features plotted against the DNAme disorder. Colors represent spatially separated biopsies from a single patient at initial clinical timepoint for c, IDHwt tumors (n = 57 biopsies, n = 6 subjects) and d, IDHmut tumors (n = 62 biopsies, n = 8 subjects). Linear regression lines colored by patient demonstrate the relationship between DNAme disorder and radiographic features (i.e., contrast enhancement surface). The p-value reported from a multivariable linear regression model adjusting for subject represents the subtype-specific association between DNAme disorder and radiographic feature. * indicates patient-specific correlation p < 0.05 (Spearman correlation). Biopsies taken closer to the tumor’s center (i.e., core) have the lowest value. e, Each column represents an individual patient sampled across initial and recurrent timepoints and is separated into IDHmut (n = 24 subjects) and IDHwt (n = 27 subjects). Top panel, stacked bar plot represents the proportion of CpGs sites that experienced DNAme change. All associated p-values represent Spearman correlations between absolute change in associated metric and the fraction of longitudinal DNAme differences. f, Enrichment analysis for differentially methylated CpGs between initial and recurrent time points when adjusting for cellular composition, glioma subtype, and subject. Individual points represent enrichment of specific TFs in differentially methylated positions, color indicates the average TFBS motif DNAme disorder from single-cell RRBS data (Figure 2d), and dotted line represents the statistical significance threshold (adj. p-value < 0.05). g, Model of DNAme disorder, stress adaptation, eroded epigenetic barriers, plasticity, and glioma evolution.
We next applied the bulk DNAme disorder metric to 119 image-guided stereotactic biopsies taken from spatially distinct regions across IDH-wild-type (n=57 biopsies, 6 patients) and IDH-mutant (n=62 biopsies, n=8 patients) tumors52. This quantified the physical distance between each sample and the tumor’s center, based on specific radiographic features (e.g., magnetic resonance imaging contrast-enhanced region,). DNAme disorder was increased closer to the tumor’s center across IDH-wild-type tumors while adjusting for patient (multivariable linear regression p=0.02, Figure 7c), a region frequently characterized by hypoxia. The link between radiographic features and epigenetic shifts supports the association between cellular fitness and increased epigenetic plasticity. We did not observe a consistent relationship between tumor location and bulk DNAme disorder in IDH-mutant tumors (multivariable linear regression p=0.31, Figure 7d) where hypoxia is less prevalent.
The environmental pressures that tumors face may vary over time. We analyzed initial and recurrent tumor samples from the Glioma Longitudinal AnalySiS (GLASS) consortium for which DNA sequencing and DNAme data were available (n=102 tumors, n=51 patients), to relate DNAme instability to genetic alterations. We catalogued individual CpG sites where copy number or DNAme changed between the initial tumor and its matched recurrence. Overall, we observed that DNAme changes were mostly decreased in DNAme consistent with previous findings7,53, and that DNAme changes mainly occurred in regions that remained copy number stable (Figure 7e). We then tested for DNAme changes following treatment while accounting for differences in cellular composition of the tumor microenvironment (Methods). We discovered that regions with consistently altered DNAme independent of changes in microenvironment cell type distribution were enriched for the binding site motifs of TFs that regulate cellular stress response, particularly hypoxia (e.g., HIF1A, Figure 7f). We also observed the enrichment for differential binding site DNAme among TFs that differed between stem-like and differentiated-like states in our single-cell data (e.g., SP1 and TFAP2A, Figure 7f and Figure 3f). These observations support our single-cell findings that regions with greatest DNAme disorder are involved with processes regulating cellular differentiation and stress signaling. In summary, we find that stochastic DNAme alterations can provide the variability necessary to enable or stabilize transition to adaptive epigenetic phenotypes that are responsive to cellular stress (Figure 7g).
Discussion:
Here, we integrated multimodal single-cell DNAme and transcriptomic profiles along with bulk profiles to interrogate the association between epigenetic heterogeneity, genetic alterations, cellular states, and glioma stress response. We found that early genetic alterations were associated with DNAme disorder, whose accumulation throughout the genome was linked with altered cellular states and response to environmental pressures. Elevated DNAme disorder highlights a mechanism to overcome cell stress, increase cellular plasticity, and ultimately enhance treatment resistance. Taken together, epigenetic intratumoral heterogeneity provides a plastic intermediate between genetic subclones and adaptive phenotypic cell states.
Random errors in the DNAme replication machinery leads to DNAme disorder and increased intratumoral epigenetic diversity5,29,54. We found that genetic and environmental stimuli further exacerbate epigenetic variability and hypothesize a convergence for both stimuli on altered cellular metabolism. Deregulated metabolism is a hallmark of both IDH-mutant, which produce the oncometabolite 2-hydroxyglutarate (2HG) that interferes with DNA demethylation2,27,55–57, and IDH-wild-type glioma where hypoxia is common. Additional genetic stimuli include broad chromosomal alterations that were positively associated with DNAme disorder. Through cross-platform evolutionary comparisons, we found that chromosomal alterations are early events possibly leading to the observed non-genetic diversity by generating metabolic disruption via reactive oxygen species31, and thereby increasing the likelihood of aberrant DNAme. Our study shows that environmental stimuli, such as hypoxia and irradiation, increase DNAme disorder extending previous studies reporting repressed enzymatic activity of DNAme regulators following hypoxia58. Tumor hypoxia is common across many cancers and could more broadly shape the phenotype of cells resistant to therapy through DNAme disorder59. Collectively, increased genomic instability and resource-poor microenvironments represent stressors that may explain the greater cell state plasticity in IDH-wild-type relative to IDH-mutant gliomas.
In a non-tumor setting, a cell’s epigenome reflects the tissue of origin and serves to stabilize cell state-specific gene expression60. A disrupted epigenetic landscape eroded by DNAme disorder may facilitate adaptive cell state transitions or increase cellular plasticity9. Glioma cell states fall along axes of differentiation and proliferating potential10–12,15. In accordance with prior reports, we observed pan-glioma malignant cell states that were found within each tumor and in vitro models. Our single-cell epigenetic profiles revealed that cell state-defining transcription factor activity may be perturbed by DNAme disorder. Thus, diverse DNAme marks help to sustain multiple cell states that each confer their own context-dependent fitness advantages and together accelerate disease progression.
Intratumoral heterogeneity in glioma reflects subclonal competition driven by limited nutrient access. While single-cell transcriptome-based phenotypes have investigated glioma transcriptomic heterogeneity10–12,14,15, we have only limited knowledge on the degree of epigenetic variability. The intratumoral epigenetic variation defined here provides a link between subclonal competition and phenotypic state changes by enabling diverse responses to selective pressures such as hypoxia and treatment. Future studies will be needed to fully elucidate the mechanisms by which increased DNAme disorder provides competitive advantages under stress. While we identified shared cell states that were present across different modalities, future studies employing simultaneous epigenome/transcriptome characterization will refine these cellular state classifications and identify additional determinants that shape glioma cell identity. A better understanding of therapeutically vulnerable cell states in glioma will foster development of more effective therapeutic interventions. In summary, single-cell epigenetic profiles show that diverse DNAme marks encode cellular states in glioma, permit cell state plasticity, and reflect environmental stress exposures.
Methods:
Experimental Methods
Description of human tumor specimens.
Human glioma resection specimens were obtained with informed consent from the University of Connecticut Health Center (Farmington, CT, USA) and from St. Michael’s Hospital (Toronto, ON, Canada). All tissue donations were approved by the Institutional Review Board of the Jackson Laboratory and clinical institutions involved. This work was performed with ethics board approval (2018-NHSR-018) and in accordance with the Declaration of Helsinki principles. Patients were not compensated for their participation in this research study. Initial pathological diagnosis was confirmed with tumor DNAme classification according to the Molecular Neuropathology Tool61. Clinical characteristics for this population are provided in Supplementary Table 1.
Sample preparation and sorting for single-cell experiments.
Tumor specimens were collected directly from the operating room and immediately placed into MACS tissue storage solution at 4° C (Miltenyi, Cat. no. 130–100-008). Tumor specimens from the same spatial region were then minced and partitioned into single-cell and bulk fractions (Figure 1a). Any remaining tumor tissue was deposited into freezing media consisting of 90% heat-inactivated fetal bovine serum (FBS) (Invitrogen) and 10% dimethyl sulfoxide (Sigma-Aldrich), and gradually frozen in a freezing container (Mr. Frosty, Corning) over 24 hours before being stored in liquid nitrogen for future experiments (i.e., Fluorescence in situ hybridization). Bulk tissue specimens were immediately flash frozen for subsequent DNA and RNA extraction. The specimen fraction for single cell analyses was further mechanically and enzymatically dissociated using the Brain Tumor Dissociation Kit (P) according to the manufacturer’s protocol (Miltenyi Cat. No. 130–095-942)11,14,15.
Single cell suspensions were blocked with human BD Fc Block (BioLegend) for 5 min on ice, prior to antibody staining, and labelled via incubation with 1:100 dilution of Alexa Fluor 488 conjugated anti-CD45 antibody (Cat. no. 304017, BioLegend) and 1:100 dilution of PECy7-conjugated anti-CD31 antibody (Cat. no. 303117, BioLegend) for 30 minutes at 4 C. Cells were washed with Hank’s buffered saline solution and resuspended in 2mM EDTA/ 2% BSA/ PBS buffer containing [2μg/mL] propidium iodide (PI) (BD Biosciences, Cat. No. 556364) and [1μM] Calcein violet (Invitrogen) for 20 minutes at 4 C. Fluorescence activated cell sorting (FACS) was performed using a BD FACSAria Fusion instrument with an 130μm nozzle and using the lowest event rate. Single cell mode was selected to further ensure stringency of sorting. Fluorescence compensation and FACS data visualization was performed using FlowJo (10.3) (https://www.flowjo.com/). For the generation of 10X sequencing libraries, 50,000–150,000 PI-, Calcein+ viable single cells were collected in 20% FBS/HBSS buffer. CD45+ cells were limited to no more than 20% of the total viable sort to enrich for tumor cells (Extended Data Fig. 2a). For the generation of single-cell DNAme libraries, we sorted viable (PI- and Calcein+), non-immune (CD45-), and non-endothelial (CD31-) cells into 96-well plates that were pre-loaded with 5 μL of 1X Tris-EDTA buffer (Extended Data Fig. 2a). Once the cells had been sorted, 96-well plates were either immediately processed through the single-cell DNAme protocol or frozen and stored at −80C.
scRRBS library preparation.
Single-cell DNAme profiling was performed using a modified version of a previous scRRBS protocol25,26. Single-cell DNAme experiments were performed with sorted viable, non-immune, non-endothelial (PI-, Calcein+, CD45-, CD31-) cells in a 96-well plate containing 5 μL pre-loaded Tris-EDTA buffer with an empty well control. For 9 out of 11 tumors, the protocol was also applied to a small population control of 50-cells (PI-, Calcein+, CD45-, CD31-). Sorted 96-well plates were frozen at −80° C until processing when cells were lysed with 0.2 μL 1 M KCl (Millipore Sigma), 0.2uL 10% Triton X-100 (Millipore Sigma), 0.3 μL 20mg/mL protease (Qiagen), and nuclease-free water in a total volume of 6 μL for 3 hours at 50 C. The protease was then heat-inactivated at 75° C for 15 minutes. The DNA was incubated with 50 units of MspI (NEB) and TaqI (NEB) with CutSmart buffer (NEB) for 3 hours at 37 C. 60fg of unmethylated Lambda bacteriophage DNA (Promega) was added to each well to serve as a control for bisulfite conversion efficiency assessment. The solution was heated to 80° C for 20 minutes to heat-inactivate the restriction enzymes and placed on ice. 5 units of Klenow Fragment (3’→ 5’ exo-, NEB), CutSmart buffer (NEB), and end-repair dNTP mix (40uM dATP, 4uM dGTP, and 4uM dCTP; NEB) totaling 2 μL per reaction were added to perform end-repair and dA-tailing. 1:250X diluted NEXTflex methylated adapters (BiooScientific) were added to each quadrant of the 96-well plate (n = 24 unique adapters) with a ligation mixture of 40 Weiss U T4 ligase (NEB), 1mM ATP (ThermoFisher Scientific), and nuclease-free water to a final volume of 4 μL per reaction. TruSeq methylated adapters (Illumina) were also used in a single sample (SM001) using the same protocol. The ligation reaction proceeded at 16° C for 30 minutes followed by an incubation of 4° C for at least 8 hours. The ligation reaction was stopped by heat-inactivation at 65° C for 20 minutes. Post-adapter ligation, 24 individual cells with unique ligated adapters were pooled from each plate quadrant for the protocol’s remainder. Excess adapter was removed using a 1:1 volumetric ratio of Ampure beads (Beckman Coulter). Bisulfite conversion was performed using the EZ-DNAme kit (Zymo) according to the manufacturer’s instructions except with one-half volumes due to reduced DNA input. The solution was incubated at 98° C for 8 minutes, 64° C for 3.5 hours, and held at 4° C once the reaction was complete. 10ng of tRNA (Roche) was added prior to column elution to serve as a protective carrier. PCR enrichment was performed using the PfuTurbo Cx hotstart (Agilent), PfuTurbo Cx hotstart buffer (Agilent), primer mix (Bioo Scientific), dNTP mix (Promega), and nuclease-free water under the following conditions: 95 degrees Celsius for 2 minutes, 32 cycles of 95° C for 20 seconds, 60° C for 30 seconds, and 72° C for 60 seconds. The PCR reaction was terminated by incubating at 72° C for 5 minutes. The libraries were purified in a 1:1 volumetric ratio of Ampure beads (Beckman Coulter), Pippin size selection was performed between 200–1000bp (Sage Science), and quantified by qPCR (Kapa Biosystems / Roche). scRRBS libraries were paired-end sequenced alongside bulk whole genome libraries on an Illumina HiSeq4000 using 1% PhiX spike-in and 75bp reads.
Single-cell RNA library preparation.
Sorted cells were washed and resuspended in 0.04% BSA/PBS buffer. Cells were counted on a Countess II automated cell counter and were loaded on a 10X Chromium chip with a target cell recovery of 6,000 cells per lane. Sequencing libraries were performed using the single-cell 3’ mRNA kit according to the manufacturer’s protocol (10X Genomics). cDNA and library quality were examined on an Agilent 4200 TapeStation and quantified by qPCR (Kapa Biosystems / Roche). Illumina sequencing (NovaSeq) was performed using a paired-end 100bp protocol. Libraries were sequenced to a median depth of 50,000 unique reads per cell.
Whole genome sequencing of tumors and matched normal blood.
Genomic DNA was extracted from the same tumor region as the single-cell analyses using the Qiagen AllPrep kit and matched normal blood using DNeasy kit (Qiagen). Briefly, 400ng of DNA was sheared to 400bp using a LE220 focused-ultrasonicator (Covaris) and size selected using SPRI beads (Beckman Coulter). The fragments were treated with end-repair, A-tailing, and ligation of unique adapters (Illumina) using the KAPA HyperPrep Kit (Roche). This was followed by 5 cycles of PCR amplification. DNA sequencing was performed using paired-end 75bp protocol according to the manufacturer’s protocol (Illumina HiSeq4000). The tumor samples were sequenced to an average depth of 44X and tumor-matched normal blood to 30X.
Bulk Illumina EPIC DNAme microarrays.
250 ng of genomic tumor DNA was subject to bisulfite conversion using the EZ DNAme kit (Zymo) and genome-wide DNAme was assessed by the Infinium MethylationEPIC kit according to the manufacturer’s protocol (Illumina).
Bulk RNA sequencing.
Bulk tumor RNA was extracted from samples with sufficient tissue using the AllPrep kit (Qiagen). Samples with RIN values > 5 as assessed by TapeStation (Agilent Technologies) were prepared with KAPA mRNA HyperPrep kit (Roche). Libraries were sequenced using a paired-end 150bp protocol on a NovaSeq to 50 million reads according to the manufacturer’s protocol (Illumina).
Fluorescent in situ hybridization (FISH) analysis.
Tissue slides were prepared by tumor touch prep method46. Positively charged glass slides were pressed against the surface of thawed frozen tissues. The slides were then immediately fixed by cold Carnoy’s fixative (3:1 methanol:glacial acetic acid, v/v) for 30 minutes and then air-dried. Slides were denatured in hybridization buffer (Empire Genomics) mixed with EGFR-Chr7 probe (EGFR-CHR07–20-ORGR, Empire Genomics) at 75°C for 5 minutes and then incubated at 37°C overnight. The post-hybridization wash was with 0.4x SSC at 75°C for 3 minutes followed by a second wash with 2x SSC/0.05% Tween20 for 1 minute. The slides were then briefly rinsed by water and air-dried. The VECTASHIELD mounting medium with DAPI (Vector Laboratories) was applied and the coverslip was mounted onto a glass slide. Tissue images were scanned under Leica STED 3X/DLS Confocal with 100x magnification.
Glioma sphere-forming cell lines and in vitro perturbations.
Patient-derived IDH-wild-type spheroids (HF2354 and HF3016) were cultured in neurosphere medium (NMGF): 500 mL DMEM/F12 medium (Invitrogen 11330) supplemented with N-2 (Gibco, 17502–048), 250 mg bovine serum albumin (BSA, Sigma, A4919), 12.5 mg gentamicin reagent (Gibco, 15710–064), 2.5 ml Antibiotic/Antimycotic (Invitrogen), 20 ng/mL EGF (Peprotech, 100–15), and 20 ng/mL bFGF (Peprotech, 100–18B). Previous comprehensive characterization of patient tumor and matched patient-derived spheroids demonstrated faithful propagation of genomic and transcriptomic profiles to the cell lines46.
To induce hypoxia, glioma cells were cultured in hypoxia chambers (Thermo Scientific) under atmospheric normoxic (21% oxygen) and hypoxic (2%, and 1% oxygen) conditions. Cells assayed at the 3-day timepoint were cultured under the three different oxygen conditions (n = 4 per group). 9-day timepoint data were restricted to 21% and 1% (n = 6 per group) after observing oxygen concentration dosage effects at 3-day (Extended Data Fig. 9a-b). The 3-day and 9-day timepoints were selected due to the 2–3 day doubling time of these cell lines. Irradiation was delivered using Gammacell Irradiator model 1000A (Atomic Energy of Canada Limited) at a daily dose of 2.5 Gy for 4 consecutive days for a total of 10 Gy followed by a recovery period of 5 days62. Irradiated cells were harvested at the 9-day time point (n = 6 per group). DNA and RNA for all conditions were isolated using the AllPrep DNA/RNA Mini Kit (Qiagen).
Patient-derived spheroid candidate gene expression.
Real-time PCR was performed with primers specific for candidate cell state (SOX2, POU5F1), stress response (JUN), and hypoxia marker genes (EPAS1 (HIF2A) and VEGFA) at the 3-day timepoint. Relative gene expression was normalized to the housekeeping genes ACTB and B2M. All primers were purchased from Integrated DNA Technologies (IDT). Primer sequences are provided in Supplementary Table 5.
Cell line reduced representation bisulfite sequencing.
Sequencing library preparation was performed using the Premium RRBS kit (Diagenode, C02030033) according to the manufacturer’s protocol. Libraries were sequenced on a NovaSeq 6000 using a paired-end 2×100 strategy for all replicates (n = 60). The mean sequencing depth was 38 million reads per sample.
Patient-derived cell line single-cell RNA sequencing.
For each cell line and time point, both a perturbed (i.e., hypoxia and irradiated) and a control replicate were dissociated into single cells for single cell gene expression profiling. Briefly, cells were harvested at the 3-day and 9-day time points for hypoxia experiments and the 9-day timepoint for the irradiation experiments. To minimize batch effects when comparing perturbed and control conditions, cells were labelled with oligo-tagged antibodies, flow sorted to enrich for viable cells, and multiplexed on the same 10X Chromium lane (10X Genomics)63. Libraries were sequenced using the single-cell 3’ mRNA kit in the same manner described for the patient tumor specimens.
Analytical methods.
Single-cell and cell line DNAme processing.
Raw sequencing reads were trimmed to remove adapters and low-quality bases using trim_galore with the `-- rrbs` and `-- paired` parameters (version 0.4.0 https://github.com/FelixKrueger/TrimGalore). The trimmed reads were then aligned to the GRCh37 (hg19) genome using Bismark (version 0.19.1) with parameters `-N 1 -- bowtie2 -- score_min L,0,−0.4`64. For single-cell data, PCR duplicates were removed with the `deduplicate_bismark` command. Bisulfite conversion efficiency was determined using the spike-in unmethylated lambda DNA. For single-cell data, cells with fewer than 40,000 unique CpGs detected and bisulfite conversion rates below 95% were removed from analysis. 914 single cells were retained for downstream analysis (n = 914 / 1,076 total cells sequenced) with a mean of 145,000 CpGs per cell and mean bisulfite conversion rate of 98.4% (Supplementary Table 6). All 60 cell line RRBS samples were retained for downstream analysis, with a mean of 10,228,198 unique CpGs per sample and a mean bisulfite conversion rate of 98.9% (Supplementary Table 7).
Unsupervised clustering of scRRBS data.
Unsupervised clustering of the DNAme data was performed using pairwise comparisons of individual CpGs across all cell-to-cell comparisons (PDclust)65. Briefly, this method performs pairwise comparisons of single-CpG methylation measurements to create a pairwise dissimilarity (PD) value that reflects the average absolute difference in methylation values at CpGs covered in any two cells. The pairwise dissimilarity values were used as input features for the Multidimensional Scaling (MDS) analysis for which visualization of cells in close proximity reflects greater similarity than cells further apart (Figure 1b).
DNAme disorder as a measure of epigenome instability.
DNAme disorder was determined by identifying DNAme concordance of nearby CpGs on a single sequencing read for bulk and single-cell DNAme data18,29,54. Briefly, in order for a sequencing read to be considered for this analysis it required a minimum of 4 CpGs located on the same sequencing read. Sequencing reads containing at least 4 CpGs, referred to as “epialleles”, were extracted from aligned BAM files using Samtools v1.966 for downstream analysis. An epiallele is considered discordant if any of the CpGs on that sequencing read have different methylation states (e.g., three methylated CpGs and an unmethylated CpG). The DNAme disorder metric reflects the sum of discordant epialleles divided by the total number of epialleles considered for analysis (i.e., the proportion of discordant reads)18,29,54. The DNAme disorder metric can be calculated across the entire genome (i.e., “DNAme disorder”) or restricted to specific genomic regions where the metric considers only the epialleles overlapping that particular genomic context. A linear regression model was used to assess the impact of the total number of epialleles considered for analysis on the DNAme disorder. The DNAme disorder metric was very weakly associated with epiallele count in that an additional 10,000 epialleles was associated with an 0.001 increase in the DNAme disorder metric. For analyses associating DNAme disorder with metrics derived from bulk WGS data, sample-level DNAme disorder was calculated as the median of single-cell DNAme disorder values. For analyses of patient-derived cell line RRBS data, DNAme disorder was calculated separately for each CpG by determining the proportion of discordant reads overlapping the given CpG, and CpGs with a sequencing depth less than 20x or at least 100 * 95th percentile of sequencing depth were excluded from analysis.
DNAme and DNAme disorder over genomic annotations.
To determine region-specific DNAme or DNAme disorder, measured CpGs or epialleles were intersected with the genomic coordinates of interest before methylation value or DNAme disorder calculation, respectively. For analyses of patient-derived cell line RRBS data, region-specific DNAme disorder was calculated as the weighted average of per-CpG DNAme disorder values, with weights proportional to sequencing depth. All coordinates were mapped against the hg19 human genome assembly. Regions of interest considered for analyses included CpG islands, adjacent CpG island shores, promoter, gene body, intergenic, Alu repeat, normal cell-specific CTCF and EZH2 binding sites (ENCODE: normal human astrocyte (NHA) and embryonic stem cells (H1-hESC)), DNaseI hypersensitivity regions, TF binding site motifs, replication timing domains, and 5kb and 10kb tiled regions. CpG island shores were defined as +/− 2kb from CpG island. Promoters were defined as 1kb upstream and 500bp downstream of FANTOM567 TSS that mapped to Ensembl release-96 genes. If multiple TSSs mapped to a given gene, the TSS with the lowest genomic coordinate was selected. Gene body annotations were obtained from the Ensembl Genome Browser68. Intergenic regions were annotated by selecting regions not overlapping Ensembl gene body coordinates. DNaseI hypersensitivity region annotations were obtained from the UCSC Genome Browser69. TF binding site motifs were obtained from the JASPAR 2020 Core Vertebrate database70 of non-redundant TF binding motifs. Each binding site is assigned a score of 0–1000, which corresponds to the p-value for the relative position weight matrix score of a TF binding site motif prediction. For a given TF, all identified target binding site coordinates were aggregated, and binding sites were excluded if they had a relative score less than 400, corresponding to a p-value greater than 0.0001, or if the any binding site lacked a CpG dinucleotide. TFBS motif DNAme disorder analyses required that a given epiallele included at least one CpG overlapping the TFBS motif, and subsequently epialleles considered for analysis included both CpGs within and adjacent to the motif. Analysis of DNAme disorder grouping CpGs by whether they lie at or adjacent to motifs revealed consistent DNAme disorder across epialleles overlapping TFBS motifs. Replication timing of genes was retrieved from MutSigCV71, and gene-specific annotations for replication timing domains were generated by binning gene coordinates into quartiles based on the replication timing score. Methylation values were also calculated for non-overlapping windows of 5kb or 10kb. Ranks of high DNAme disorder levels were determined by applying the ROSE software (https://bitbucket.org/young_computation/rose) for both gene-level and transcription factor binding sites.
SCNA estimation from single-cell DNAme data.
To provide evidence for somatic copy number alterations in single-cell DNAme sequencing data, the Gingko algorithm72 was applied to single cells that passed the scRRBS quality control filters mentioned above. Briefly, this method bins mapped reads by chromosomal location, performs Lowess normalization to correct for GC biases, adjusts for potential amplification artifacts, and segments the genome to determine chromosomal regions with consistent copy number states. Here, the genome for each sample was divided into 2,597 variable-length bins with a median length of 1Mb. Segmentation was performed using independent normalized read counts and the parameter `mask bad bins` (i.e., bins with consistent pileups) was enabled. Cells were considered “non-tumor” if less than 1% of the genome had a copy number state that was not 2. Copy number plots were generated using the R package “gplots” (3.0.1.1). Hierarchal clustering and annotation of single-cell SCNA profiles was performed using the dendextend (1.13.4) R package 73.
Single-cell RNA processing and analysis.
The Cell Ranger pipeline (v3.0.2) was used to convert Illumina base call files to FASTQ files and align FASTQs to hg19 10X reference genome (version 1.2.0). Preprocessing was performed using the Scanpy package (1.3.7)74. The gene expression profiles of each cell at the 1500 most highly variable genes (as measured by dispersion 75) were used for neighborhood graph generation (using 33 nearest neighbors) and dimensionality reduction with UMAP76. Clustering was performed on this neighborhood graph using the Leiden community detection algorithm77. The neighborhood graph was batch-corrected using the batch correction software BBKNN78. These defined clusters were then labelled with particular cell states based on marker gene expression and previously described cell states10,11,14. A similar analytic framework was also applied to each of the two patient-derived spheroid scRNAseq datasets each using a different number of most variable genes and nearest neighbors. Cell state classification of malignant cells was also performed using previously developed classifiers for both IDH-wild-type11 and IDH-mutant tumors15. The Seurat R package was used for downstream analyses and visualizations79. Inference of gene regulatory networks was performed using SCENIC for a random set of 5,000 cells per analysis, with only 9-day stress cells presented in Extended Data Fig 8d-8f37. SCNA estimation from single-cell RNAseq data was performed using InferCNV (1.6.0) 11,14,15. Briefly, the InferCNV method provides evidence for large-scale somatic copy number alterations by comparing averaged gene expression intensity values compared with non-tumor cells (based on marker gene expression) from the same specimen. Subclusters of cells were partitioned into clones on the basis of shared copy number patterns (https://github.com/broadinstitute/inferCNV). Single-cell gene set activity was determined using AUCell (1.12.0) 37. Single-cell RNA diversity comparisons using gene count signatures were performed using the R package CytoTRACE (0.1.0) across cells from the same tumor clone51.
Joint scRNA and scDNAme integration.
Single-cell RNA and DNAme malignant cell profiles were integrated within the same specimen leveraging by jointly clustering gene expression with gene-level methylation features using the R package ‘liger’ (0.4.2).38
Analysis of publicly available brain tumor DNAme data.
Data re-analysis of longitudinal glioma resources was accessed for Klughammer et al. (http://www.medical-epigenomics.org/papers/GBMatch/)5 and the Glioma Longitudinal AnalySiS consortium (GLASS, http://synapse.org/glass)4. Magnetic Resonance Imaging guided biopsies taken from spatially distinct regions and subjected to bulk DNAme Illumina methylation microarray collected by our group was also accessed EGAS0000100543452. DNAme microarrays (450K) were also retrieved The Cancer Genome Atlas initial glioma samples 2. All Illumina methylation microarrays were processed using the R package minfi (1.30.0). The recurrent DNAme changes between the initial and recurrent tumors were determined by fitting a linear mixed effect model (R nlme package, 3.1–140) to each individual CpG modeled as a logit transformed M-value with independent variables of timepoint, subtype, cancer cell proportion, immune proportion, and subject included as the random effect. The cancer and immune cell proportions in the GLASS bulk Illumina methylation microarray data were determined using the glioma signature in the R package MethylCIBERSORT (0.2.0) 80.
Gene and genomic region enrichment analyses.
Enrichment of genes were performed using the R package topGO (2.42.0). Enrichment of genomic regions were determined using the Locus Overlap Analysis (LOLA, 1.14.0) R package81. LOLA enrichment analyses used all features considered for analysis as the background sets.
Variant detection and copy number calling.
Variant detection and bulk copy number determination was performed in accordance with the GATK Best practices using GATK 4.1.0.0 (Mutect2). Bulk tissue sequencing computational pipelines were developed using snakemake (5.2.2)82.
Mutational signature identification
Mutational signatures were identified in bulk WGS samples using the MutationalPatterns R package (1.10.0) 83. The trinucleotide context of single base substitutions was extracted for each sample in order to construct a mutational profile. For each mutational profile, the contribution of mutational signatures from the Catalogue of Somatic Mutations in Cancer (COSMIC v3) was quantified. Known signatures were ranked by order of relative contribution to the sample mutational profile; for visualization the top 5 signatures per sample were listed, with the remaining signatures collapsed into an “Other” category.
Phylogenetic reconstruction bulk WGS clonality.
To reconstruct the evolutionary history and subclonal composition of tumors, PhyloWGS (1.0-rc2) 84 was applied to bulk WGS samples. PhyloWGS incorporates SCNAs with simple somatic mutations (SSMs) in inferred phylogenies by converting SCNAs into pseudo SSMs prior to subclonal reconstruction. For input, phyloWGS requires VCF format variant calls, SCNA segments, and estimates of tumor purity, which were generated using Mutect2 (4.1.0.0) 71, TITAN (1.19.1)85, and Sequenza (2.1.2)86, respectively. If a tumor contained more than 5000 variants, input variants were subsampled to 5000, ensuring all variants overlapping previously identified significantly mutated genes were included2,4. For each phyloWGS run, multiple Markov chain Monte Carlo chains were initiated with differing start values, and the optimum solution was selected based on negative normalized log likelihood. Cancer cell fractions (CCF) were calculated for each tumor subpopulation as the cellular prevalence for a given subpopulation divided by the maximum cellular prevalence for that tumor, which corresponds to the estimated tumor purity. Events were defined as clonal if they have a CCF of 1 or subclonal otherwise. SCNA subpopulation assignments and cellular prevalence estimates derived from phyloWGS were further informed by scRNAseq and scRRBS-derived copy number profiles.
Bulk RNA sequencing processing.
FASTQ files were pre-processed with fastp (v0.20.0) to assess quality control and were aligned to the hg19 genome using kallisto v0.46.0 with default parameters87. The bulk RNA Verhaak classification and simplicity scores were determined using the ssgsea.GBM.classification (1.0) R package8. Single sample gene set enrichment analysis for particular pathways was performed using the GVSA (1.32.0) R package88.
Detection of extrachromosomal DNA.
Amplicon architect (version used in original paper89) was used to detect extrachromosomal DNA in tumor whole genome sequencing data. Briefly, this method characterizes the architecture of amplified regions that are larger than 10kb and have more than four copies greater than the median sample ploidy.
DNAme-based tumor classification.
Probabilistic estimates of tumor classification were defined both by the Molecular Neuropathology classification tool (version 11b4)61.
Statistics and reproducibility.
All data analyses were conducted in R 3.6.1. Statistical analyses are described in the respective Methods subsection and briefly described in the figure legends. P-values were false discovery rate corrected for multiple hypotheses testing where indicated. For boxplot representations, data points located outside the whisker plots are not shown to aid readability but are included in statistical analyses. No statistical methods were used to predetermine study sample size. Data subsets are explicitly mentioned when used. The experiments were not randomized. The investigators were not blinded to allocation during experiments and outcome assessment. p-values of < 0.05 were considered statistically significant.
Data availability.
All deidentified, non-protected access somatic variant calls, single-cell gene expression profiles, regional single-cell DNAme data, and single-cell DNAme disorder data are accessible via Synapse (https://synapse.org/singlecellglioma ). Raw bulk and single-cell sequencing data and methylation microarray data are available through the European Genome-phenome Archive (EGA) under the accession number EGAS00001005300. The GRCh37 (hg19) reference genome was obtained from GATK (https://gatk.broadinstitute.org/).
Code availability.
Major analysis scripts are available on github (https://github.com/TheJacksonLaboratory/singlecellglioma-verhaaklab) and Zenodo (https://doi.org/10.5281/zenodo.4967364).
Extended Data
Extended Data Fig. 1. Integrated molecular profiles of patient samples.
Each patient is in a single column with data presented to indicate clinical features (top), followed by genetic alterations defined from bulk whole genome sequencing data, bulk RNA sequencing based subtype classification probabilities (Wang et al., n = 8 available), single-cell RNA tumor cellular state proportions, bulk DNAme microarray subtype classification probabilities (Capper et al.), and boxplots of single-cell DNAme disorder (n = 844 tumor cells) with samples colored by clinical timepoint. Each box spans the 25th and 75th percentile, center lines indicate the median, and the whiskers represent the absolute range (minima/maxima), excluding outliers.
Extended Data Fig. 2. Sample pre-processing and metrics related to single-cell DNAme data assessment.
a, Representative fluorescence activated cell sorting (FACS) data and strategy for viable cell enrichment for both single-cell protocols and tumor cell enrichment in scRRBS. b, The number of unique CpGs detected per single cell, with the red line indicating the threshold (minimum 40,000 unique CpGs) for inclusion in the dataset presented herein, c, Representative distribution of single locus DNAme estimates for a single cell. DNAme percentage of 0 represents an unmethylated locus, while a percentage of 100 represents a methylated locus, d, Boxplots represent single-cell CpG count per genomic feature for tumor cells (n = 844 cells). Each box spans the 25th and 75th percentile, center lines indicate the median, and the whiskers represent the absolute range (minima/maxima), excluding outliers, e, Histogram representing the cell-to-cell CpG overlap of all single cells in this dataset, f, Upset plot of patient-level unique gene promoter overlap. The top bar plot represents the promoter intersection number measured across all patients (center portion) indicated by a filled bullet point. The right histogram represents the total number of unique promoters measured across all cells from a given tumor with IDH mutation status indicated by color.
Extended Data Fig. 3. Somatic copy number alteration examples estimated from whole genome sequencing, single-cell Reduced Representation Bisulfite Sequencing, and single-cell RNA-sequencing.
a-c, Representative images of copy number alterations derived from SM012 (IDHwt initial) whole genome sequencing (WGS) data, a, Depth ratio for each segment with copy number status determined as compared with germline (normal blood) WGS data, b, SM012 Single-cell DNAme-based copy number estimates (n = 69 tumor cells) with copy number integer depicted by color (blue = CN loss, white = neutral CN, and red = CN gain). Each row is a single cell with annotation for DNAme disorder provided, c, SM012 Single-cell RNAseq based copy number inference (n = 5,489) identifying major copy number events found in WGS with labelled subclones as presented in Figure 6a. d-f, Similar example profiles as presented in a-c, for tumor sample SM006 (IDHwt initial, n = 82 scRRBS cells, n = 3,310 sc RNAseq cells), g-i, Similar example profiles as presented in a-c for tumor sample SM001 (IDHmut recurrence, n = 181 scRRBS cells, n = 5,713 scRNAseq cells)
Extended Data Fig. 4. Distribution and relationship of DNAme and DNAme disorder throughout the glioma genome.
a, Visualization of inter-tumoral and intra-tumoral variation in DNAme (10kb tiled DNAme). Genome-level and chromosome-level DNAme across 844 single tumor cells. Each row represents a single cell clustered based on pairwise dissimilarity between methylomes as presented in main Figure 1b and each column represents a single 10kb tile over which DNAme has been averaged as indicated by heatmap color (methylated = red, unmethylated = blue). The tile color for a cell that does not have a measurement for a given tile is represented by white and a tile without a measurement across any cells is represented by grey. Row annotation for both patient identifier and IDH mutation status are presented for each cell. b, Boxplots highlighting the single-cell DNAme disorder estimates calculated across different genomic contexts with Kruskal-Wallis p-values indicating the differences in distributions across the groups. Each box spans the 25th and 75th percentile, center lines indicate the median, and the whiskers represent the absolute range (minima/maxima), excluding outliers. c, The dominant Catalogue of Somatic Mutations in Cancer (COSMIC v3) mutational signatures are presented for each subject. The stacked bar plots represent the relative contribution of each mutational signature to the tumor’s mutational burden. Colors indicate distinct mutational signatures, which are further annotated with their proposed etiology. d, Scatterplots and linear regression lines with standard error showing the relationship between genomic context-specific single-cell DNAme disorder (sample-specific scRRBS average) and genomic context-specific mutation burden derived from whole genome sequencing (n = 10 excluding hypermutant sample). Panels are separated into global (i.e., all regions), promoter, gene body, and intergenic regions (Spearman correlations p > 0.05 for all comparisons). e, Scatterplot and linear regression lines of the context-specific DNAme disorder (x-axis) vs. the average DNAme value (beta-value) for each genomic compartment. Subtype level Spearman correlation coefficients and p-values are presented. f, The median absolute deviation of DNAme across all cells from the same subtype (inter-patient heterogeneity) and g, all cells from the same patient (intra-patient heterogeneity). Two-sided Wilcoxon rank sum tests comparing median absolute deviation levels between IDHmut and IDHwt are presented for intra-patient DNAme heterogeneity.
Extended Data Fig. 5. Association between DNAme disorder and disrupted transcriptional programs.
a, Boxplots of gene expression values, in log(counts per million+1), from single-cell RNAseq data across different sets of gene body regions defined by gene-derived DNAme disorder groups. Each box spans the 25th and 75th percentile, center lines indicate the median, and the whiskers represent the absolute range (minima/maxima), excluding outliers. Surrounding violins represent the distribution for each group. Gene DNAme disorder groups are defined by the determining the mean DNAme disorder value across a single gene. Color indicates IDH mutation status. b-c, Scatterplots and linear regression lines with standard error depicting single-cell gene-level DNAme disorder average plotted against the gene-level methylation estimates in both b, promoter regions and c, gene body regions. d-e, Gene Ontology enrichment analyses with false discovery rate correction for high DNAme genes and low DNAme disorder genes using gene body estimates. f, Representative density curves of distribution of epiallele CpGs in each patient overlapping a specific TFBS motif (e.g., SOX2), with curves annotated by patient identifier. g, Gene Ontology enrichment analysis of TFs with high DNAme disorder in their binding sites with false discovery rate correction. h, Scatterplot and linear regression lines depicting the association between average single-cell DNAme disorder estimate and single-sample Gene Set Enrichment Score for stress response, hypoxia, and random genes from bulk RNAseq data. Spearman correlation coefficient and p-values are indicated.
Extended Data Fig. 6. Pan-glioma cell state assignment and characteristics.
a, UMAP dimensionality reduction plot of all scRNAseq data, including tumor and non-tumor cells (n = 55,248 cells). Each dot depicts a single cell and colors represent the tumor of origin. Shaded regions represent cell state classification, b, Stacked violin plots of average single-cell gene expression for cells presented in Extended Data Fig. 6a. Selected genes presented are informative for cell state classification, c, Stacked bar plots representing the proportion of non-tumor cellular states d, Stacked bar plots representing the proportion of tumor cellular states per tumor for pan-glioma classification (top row) and previously published classifications (lower left row; Venteicher et al. and lower right Neftel et al.) e, Sankey plot representing the proportion of IDHmut tumor cells with pan-glioma classification and associated classification described in Venteicher et al. (left). Sankey plot representing the proportion of IDHwt tumor cells with pan-glioma classification and associated classification described in Neftel et al.(right). f, scRNAseq area under the curve (AUC) estimates for selected gene sets (i.e., proportion of expressed genes in signature per cell). The AUC estimates are presented for response to stress, hypoxia, and random gene set signatures summarized by pan-glioma cell state and separated by IDH mutation subtype. All cells from a single patient are normalized to its median AUC value for a given signature. Higher relative values indicate greater enrichment score for each signature. P-values represent two-sided Wilcoxon rank sum tests comparing differentiated-like tumor cells with stem-like and proliferating stem-like, g, Density plots representing TFBS motif DNAme disorder (scRRBS data) in IDHmut (left) and IDHwt (right) single-cell DNAme data for TFs whose activity (scRNAseq based SCENIC analysis in Figure 6c-d) characterizes a specific cell state (n = 15 TFs per cell state). Kolmogorov-Smirnov p-value tests for differences in TFBS motif DNAme disorder across the cellular states. Dotted lines represent the median TFBS motif DNAme disorder value for cell state definina TFs.
Extended Data Fig. 7. LIGER integrated tumor-specific clustering of single-cell RNA and single-cell DNAme data.
a, Schematic diagram representing LIGER workflow to jointly cluster single-cell RNAseq and DNAme data generated from the same tumor dissociation, b, Joint single-cell RNAseq (scRNA) and single-cell DNAme (scDNAm) clustering and UMAP projections highlighting similar cellular state distributions across platforms. Sample annotation is presented on the left of each paired UMAP plot, each dot is an individual single cell, and cell number for each technology is presented in the lower-left hand corner. UMAP coordinate space remains the same for both scRNA and scDNAm visualizations with cellular states for that platform represented by a colored dot and data for the other platform represented by a gray dot. Stacked bar plots enumerating the proportion of cellular states detected by each platform are presented to the right of each paired UMAP plot. ‘*’ indicate specimens in which the cellular proportions across the two platforms are significantly different (two-sided Fisher’s Exact test, p < 0.05). c, Promoter DNAme for samples with sufficient number of cells in each state. Each box spans the 25th and 75th percentile, center lines Indicate the median, and the whiskers represent the absolute range (minima/maxima), excluding outliers. Surrounding violins represent the distribution for each condition Two-sided Wilcoxon rank sum test p-values are presented for each tumor.
Extended Data Fig. 8. Stress-associated changes in DNAme disorder are associated with altered population-level transcriptional dynamics and not related with genetic changes.
a, Relative gene expression levels for two patient-derived glioma sphere-forming cells for candidate genes reflecting cell state (SOX2, POU5F1) and cell stress (JUN, EPAS1 (HIF2A), VEGFA) via RT-PCR. Normoxia and varying levels of hypoxia (2% and 1% oxygen, n = 4 per group) were assessed. Statistical significance (p < 0.05, Tukey HSD) is indicated by an asterisk, b, Relative DNAme disorder in hypoxia conditions (2% and 1%) compared with normoxia. P-values for Kruskal-Wallis tests are presented across specific genomic contexts (n = 4 per group), c, Upset plot of shared mutations for a randomly selected replicate from cell line HF3016 cultured under normoxia and irradiation (10 Gy). Mutations were determined in reference to subject normal blood. The mutational overlap is presented by the black bar with the mutations called private to irradiation and control also presented, d, Heatmap representing transcription factors that were determined to have consistently different TFBS motif DNAme disorder levels in stress conditions (hypoxia and irradiation) compared with controls across both cell lines (p < 0.1 two-sided Wilcoxon rank sum test across all cell lines and two stressors) are presented with their change in inferred TF activity (SCENIC, methods), e-f, ELK4 and TFDP1 are presented for TFBS motif DNAme disorder (RRBS) and TF activity (scRNAseq), which demonstrated consistent changes in TFBS motif DNAme disorder and stress altered TF activity. Each box spans the 25th and 75th percentile, center lines indicate the median, and the whiskers represent the absolute range (minima/maxima), excluding outliers. Violins surrounding boxplots reflect distributions. Two-sided Wilcoxon rank sum test p-values are presented, g-h, scRNAseq scaled gene expression heatmaps for the top 5 differentially expressed genes per stress exposure and time point, i-j, Stacked bar plots comparing the cell state proportions for the Neftel et al. proliferation-independent IDHwt classifier across different stress conditions, time points, and cell lines. Statistical differences are presented for Chi-Square test (*** = p < 0.001).
Extended Data Fig. 9. Whole genome sequencing phylogenetic inference of tumor samples.
a, Stacked bar plots representing the proportion of whole-genome sequencing (WGS) derived somatic copy number alteration (SCNA) burden attributed to clonal vs. subclonal events, b-i, Phylogenetic trees constructed from whole genome sequencing data (mutations and somatic copy number alterations) using phyloWGS and further annotated using single-cell inferred copy number alterations (scRRBS + scRNAseq). Tree nodes represent alterations specific to the given clone, with node size corresponding to the estimated fraction of tumor cells with the associated alterations. Branch length scales with the number of mutations attributed to that clone. Clonal alterations are colored in blue, with subclonal alterations colored in gold. Genes considered significantly mutated in TCGA analyses and chromosomal arm-level events are presented. Arm-level events are defined as spanning at least 80 percent of the chromosome arm, while partial events span at least 40 percent.
Extended Data Fig. 10. Genetic influences on epigenetic and transcriptional diversity in glioma cells.
a-c, SCNA phylogenetic trees annotated with scRRBS-derived cell state. Adjacent boxplots are presented for DNAme and DNAme disorder across cuts in the dendrograms, d-e, Extrachromosomal DNA circular amplicon reconstruction displaying genomic rearrangements predicted from whole genome sequencing. Coverage depth is represented as a histogram across a genomic interval with segment copy number (CN) estimation provided on the right y-axis. Discordant read pair clusters are indicated by arcs and colors highlight read pair orientation (e.g., brown = everted read pairs). Amplicon intervals are provided at the bottom of the plot with annotation for known oncogenes (e.g., EGFR). f, EGFR copy number estimation from single-cell RRBS data in ecDNA+ tumors. Cells with EGFR copy number greater than 6 were classified as EGFR ecDNA+ (blue), g, Single-cell 10-kb tiled DNAme separated by EGFR ecDNA status. Single cells with inferred copy number status greater than 6 were classified as ecDNA+ (blue). Two-sided Wilcoxon rank sum test p-values comparing DNAme across ecDNA status are reported for each patient tumor, h, Boxplots depicting transcriptional diversity using gene count signatures calculated in sc RNAseq data for each tumor, with cells separated based on inferred EGFR copy number status (gray = EGFR ecDNA-, blue = EGFR ecDNA+). Transcriptional diversity was compared based on predicted ecDNA status within each tumor subclone. Stars (*) indicate statistically significant differences based on two-sided Wilcoxon rank sum test (p < 0.05). Each box plot in this figure spans the 25th and 75th percentile, center lines indicate the median, and the whiskers represent the absolute range (minima/maxima), excluding outliers. Surrounding violins represent the distribution for each condition.
Supplementary Material
Acknowledgements:
We would like to thank the patients and their families for their generous donation to biomedical research. We would also like to thank the staff in the following groups at The Jackson Laboratory for Genomic Medicine: single cell biology laboratory, flow cytometry core, and genomic technology core for assistance in data generation. We thank Matt Wimsatt and Zoe Reifsnyder for assistance in graphic design. We thank the University of Texas MD Anderson Epigenomics Profiling Core for their assistance in helping troubleshoot the scRRBS protocol. We thank Henry Ford Hospital (Detroit, MI) for sharing the patient-derived glioma spheroids. This work was supported by NIH grants R01 CA237208, R21 NS114873 and Cancer Center Support Grant P30 CA034196; Department of Defense W81XWH1910246 (R.G.W.V); Jackson Laboratory Cancer Center Fast Forward funds. F.S.V. is supported by a postdoctoral fellowship from The Jane Coffin Childs Memorial Fund for Medical Research. F.P.B. is supported by the National Cancer Institute (K99 CA226387). E.Y. is a fellow of the American Brain Tumor Association. K.C.J. is the recipient of an American Cancer Society Fellowship (130984-PF-17–141-01-DMC). The funders had no role in study design, data collection and analysis, decision to publish or preparation of the manuscript.
Competing Interest Statement: R.G.W.V. is a co-founder of and has received research support from Boundless Bio, Inc. The remaining authors declare no other conflicts of interest.
References
- 1.Cancer Genome Atlas Research, N. et al. Comprehensive, Integrative Genomic Analysis of Diffuse Lower-Grade Gliomas. N Engl J Med 372, 2481–98 (2015). [DOI] [PMC free article] [PubMed] [Google Scholar]
- 2.Ceccarelli M. et al. Molecular Profiling Reveals Biologically Discrete Subsets and Pathways of Progression in Diffuse Glioma. Cell 164, 550–63 (2016). [DOI] [PMC free article] [PubMed] [Google Scholar]
- 3.Louis DN et al. The 2016 World Health Organization Classification of Tumors of the Central Nervous System: a summary. Acta Neuropathol 131, 803–20 (2016). [DOI] [PubMed] [Google Scholar]
- 4.Barthel FP et al. Longitudinal molecular trajectories of diffuse glioma in adults. Nature (2019). [DOI] [PMC free article] [PubMed] [Google Scholar]
- 5.Klughammer J. et al. The DNA methylation landscape of glioblastoma disease progression shows extensive heterogeneity in time and space. Nat Med 24, 1611–1624 (2018). [DOI] [PMC free article] [PubMed] [Google Scholar]
- 6.Korber V. et al. Evolutionary Trajectories of IDH(WT) Glioblastomas Reveal a Common Path of Early Tumorigenesis Instigated Years ahead of Initial Diagnosis. Cancer Cell 35, 692–704 e12 (2019). [DOI] [PubMed] [Google Scholar]
- 7.Mazor T. et al. DNA Methylation and Somatic Mutations Converge on the Cell Cycle and Define Similar Evolutionary Histories in Brain Tumors. Cancer Cell 28, 307–317 (2015). [DOI] [PMC free article] [PubMed] [Google Scholar]
- 8.Wang Q. et al. Tumor Evolution of Glioma-Intrinsic Gene Expression Subtypes Associates with Immunological Changes in the Microenvironment. Cancer Cell 32, 42–56 e6 (2017). [DOI] [PMC free article] [PubMed] [Google Scholar]
- 9.Flavahan WA, Gaskell E. & Bernstein BE Epigenetic plasticity and the hallmarks of cancer. Science 357, eaal2380 (2017). [DOI] [PMC free article] [PubMed] [Google Scholar]
- 10.Bhaduri A. et al. Outer Radial Glia-like Cancer Stem Cells Contribute to Heterogeneity of Glioblastoma. Cell Stem Cell 26, 48–63 e6 (2020). [DOI] [PMC free article] [PubMed] [Google Scholar]
- 11.Neftel C. et al. An Integrative Model of Cellular States, Plasticity, and Genetics for Glioblastoma. Cell 178, 835–849 e21 (2019). [DOI] [PMC free article] [PubMed] [Google Scholar]
- 12.Wang L. et al. The Phenotypes of Proliferating Glioblastoma Cells Reside on a Single Axis of Variation. Cancer Discov 9, 1708–1719 (2019). [DOI] [PMC free article] [PubMed] [Google Scholar]
- 13.Yuan J. et al. Single-cell transcriptome analysis of lineage diversity in high-grade glioma. Genome Med 10, 57 (2018). [DOI] [PMC free article] [PubMed] [Google Scholar]
- 14.Tirosh I. et al. Single-cell RNA-seq supports a developmental hierarchy in human oligodendroglioma. Nature 539, 309–313 (2016). [DOI] [PMC free article] [PubMed] [Google Scholar]
- 15.Venteicher AS et al. Decoupling genetics, lineages, and microenvironment in IDH-mutant gliomas by single-cell RNA-seq. Science 355(2017). [DOI] [PMC free article] [PubMed] [Google Scholar]
- 16.Easwaran H, Tsai HC & Baylin SB Cancer epigenetics: tumor heterogeneity, plasticity of stem-like states, and drug resistance. Mol Cell 54, 716–27 (2014). [DOI] [PMC free article] [PubMed] [Google Scholar]
- 17.Liau BB et al. Adaptive Chromatin Remodeling Drives Glioblastoma Stem Cell Plasticity and Drug Tolerance. Cell Stem Cell 20, 233–246 e7 (2017). [DOI] [PMC free article] [PubMed] [Google Scholar]
- 18.Gaiti F. et al. Epigenetic evolution and lineage histories of chronic lymphocytic leukaemia. Nature 569, 576–580 (2019). [DOI] [PMC free article] [PubMed] [Google Scholar]
- 19.Hernando-Herraez I. et al. Ageing affects DNA methylation drift and transcriptional cell-to-cell variability in mouse muscle stem cells. Nat Commun 10, 4361 (2019). [DOI] [PMC free article] [PubMed] [Google Scholar]
- 20.Johnson KC et al. 5-Hydroxymethylcytosine localizes to enhancer elements and is associated with survival in glioblastoma patients. Nat Commun 7, 13177 (2016). [DOI] [PMC free article] [PubMed] [Google Scholar]
- 21.Angermueller C. et al. Parallel single-cell sequencing links transcriptional and epigenetic heterogeneity. Nat Methods 13, 229–232 (2016). [DOI] [PMC free article] [PubMed] [Google Scholar]
- 22.Argelaguet R. et al. Multi-omics profiling of mouse gastrulation at single-cell resolution. Nature 576, 487–491 (2019). [DOI] [PMC free article] [PubMed] [Google Scholar]
- 23.Farlik M. et al. DNA Methylation Dynamics of Human Hematopoietic Stem Cell Differentiation. Cell Stem Cell 19, 808–822 (2016). [DOI] [PMC free article] [PubMed] [Google Scholar]
- 24.Bian S. et al. Single-cell multiomics sequencing and analyses of human colorectal cancer. Science 362, 1060–1063 (2018). [DOI] [PubMed] [Google Scholar]
- 25.Guo H. et al. Profiling DNA methylome landscapes of mammalian cells with single-cell reduced-representation bisulfite sequencing. Nat Protoc 10, 645–59 (2015). [DOI] [PubMed] [Google Scholar]
- 26.Guo H. et al. Single-cell methylome landscapes of mouse embryonic stem cells and early embryos analyzed using reduced representation bisulfite sequencing. Genome Res 23, 2126–35 (2013). [DOI] [PMC free article] [PubMed] [Google Scholar]
- 27.Turcan S. et al. IDH1 mutation is sufficient to establish the glioma hypermethylator phenotype. Nature 483, 479–83 (2012). [DOI] [PMC free article] [PubMed] [Google Scholar]
- 28.Kelsey G, Stegle O. & Reik W. Single-cell epigenomics: Recording the past and predicting the future. Science 358, 69–75 (2017). [DOI] [PubMed] [Google Scholar]
- 29.Landau DA et al. Locally disordered methylation forms the basis of intratumor methylome variation in chronic lymphocytic leukemia. Cancer Cell 26, 813–825 (2014). [DOI] [PMC free article] [PubMed] [Google Scholar]
- 30.Alexandrov LB et al. The repertoire of mutational signatures in human cancer. Nature 578, 94–101 (2020). [DOI] [PMC free article] [PubMed] [Google Scholar]
- 31.Zhu J, Tsai HJ, Gordon MR & Li R. Cellular Stress Associated with Aneuploidy. Dev Cell 44, 420–431 (2018). [DOI] [PMC free article] [PubMed] [Google Scholar]
- 32.Hughes LAE et al. The CpG Island Methylator Phenotype: What’s in a Name? Cancer Research 73, 5858 (2013). [DOI] [PubMed] [Google Scholar]
- 33.Luo Y, Lu X. & Xie H. Dynamic Alu Methylation during Normal Development, Aging, and Tumorigenesis. BioMed Research International 2014, 784706 (2014). [DOI] [PMC free article] [PubMed] [Google Scholar]
- 34.Yin Y. et al. Impact of cytosine methylation on DNA binding specificities of human transcription factors. Science 356(2017). [DOI] [PMC free article] [PubMed] [Google Scholar]
- 35.MacLeod G. et al. Genome-Wide CRISPR-Cas9 Screens Expose Genetic Vulnerabilities and Mechanisms of Temozolomide Sensitivity in Glioblastoma Stem Cells. Cell Rep 27, 971–986 e9 (2019). [DOI] [PubMed] [Google Scholar]
- 36.Jin X. et al. Targeting glioma stem cells through combined BMI1 and EZH2 inhibition. Nat Med 23, 1352–1361 (2017). [DOI] [PMC free article] [PubMed] [Google Scholar]
- 37.Aibar S. et al. SCENIC: single-cell regulatory network inference and clustering. Nat Methods 14, 1083–1086 (2017). [DOI] [PMC free article] [PubMed] [Google Scholar]
- 38.Welch JD et al. Single-Cell Multi-omic Integration Compares and Contrasts Features of Brain Cell Identity. Cell 177, 1873–1887 e17 (2019). [DOI] [PMC free article] [PubMed] [Google Scholar]
- 39.Orso F. et al. Identification of functional TFAP2A and SP1 binding sites in new TFAP2A-modulated genes. BMC Genomics 11, 355 (2010). [DOI] [PMC free article] [PubMed] [Google Scholar]
- 40.Li Z. et al. Hypoxia-inducible factors regulate tumorigenic capacity of glioma stem cells. Cancer Cell 15, 501–13 (2009). [DOI] [PMC free article] [PubMed] [Google Scholar]
- 41.Shaffer SM et al. Rare cell variability and drug-induced reprogramming as a mode of cancer drug resistance. Nature 546, 431–435 (2017). [DOI] [PMC free article] [PubMed] [Google Scholar]
- 42.Sharma SV et al. A chromatin-mediated reversible drug-tolerant state in cancer cell subpopulations. Cell 141, 69–80 (2010). [DOI] [PMC free article] [PubMed] [Google Scholar]
- 43.Peng C. et al. Cyclin-dependent kinase 2 (CDK2) is a key mediator for EGF-induced cell transformation mediated through the ELK4/c-Fos signaling pathway. Oncogene 35, 1170–9 (2016). [DOI] [PMC free article] [PubMed] [Google Scholar]
- 44.Kent LN & Leone G. The broken cycle: E2F dysfunction in cancer. Nat Rev Cancer 19, 326–338 (2019). [DOI] [PubMed] [Google Scholar]
- 45.Koren A. et al. Differential relationship of DNA replication timing to different forms of human mutation and variation. Am J Hum Genet 91, 1033–40 (2012). [DOI] [PMC free article] [PubMed] [Google Scholar]
- 46.deCarvalho AC et al. Discordant inheritance of chromosomal and extrachromosomal DNA elements contributes to dynamic disease evolution in glioblastoma. Nat Genet 50, 708–717 (2018). [DOI] [PMC free article] [PubMed] [Google Scholar]
- 47.Morton AR et al. Functional Enhancers Shape Extrachromosomal Oncogene Amplifications. Cell 179, 1330–1341 e13 (2019). [DOI] [PMC free article] [PubMed] [Google Scholar]
- 48.Wu S. et al. Circular ecDNA promotes accessible chromatin and high oncogene expression. Nature 575, 699–703 (2019). [DOI] [PMC free article] [PubMed] [Google Scholar]
- 49.Kim H. et al. Extrachromosomal DNA is associated with oncogene amplification and poor outcome across multiple cancers. Nat Genet 52, 891–897 (2020). [DOI] [PMC free article] [PubMed] [Google Scholar]
- 50.Verhaak RGW, Bafna V. & Mischel PS Extrachromosomal oncogene amplification in tumour pathogenesis and evolution. Nat Rev Cancer 19, 283–288 (2019). [DOI] [PMC free article] [PubMed] [Google Scholar]
- 51.Gulati GS et al. Single-cell transcriptional diversity is a hallmark of developmental potential. Science 367, 405–411 (2020). [DOI] [PMC free article] [PubMed] [Google Scholar]
- 52.Verburg N. et al. Spatial concordance of DNA methylation classification in diffuse glioma. Neuro Oncol (2021). [DOI] [PMC free article] [PubMed] [Google Scholar]
- 53.de Souza CF et al. A Distinct DNA Methylation Shift in a Subset of Glioma CpG Island Methylator Phenotypes during Tumor Recurrence. Cell Rep 23, 637–651 (2018). [DOI] [PMC free article] [PubMed] [Google Scholar]
- 54.Landan G. et al. Epigenetic polymorphism and the stochastic formation of differentially methylated regions in normal and cancerous tissues. Nat Genet 44, 1207–14 (2012). [DOI] [PubMed] [Google Scholar]
- 55.Losman JA & Kaelin WG Jr. What a difference a hydroxyl makes: mutant IDH, (R)-2-hydroxyglutarate, and cancer. Genes Dev 27, 836–52 (2013). [DOI] [PMC free article] [PubMed] [Google Scholar]
- 56.Dang L. et al. Cancer-associated IDH1 mutations produce 2-hydroxyglutarate. Nature 462, 739–44 (2009). [DOI] [PMC free article] [PubMed] [Google Scholar]
- 57.Noushmehr H. et al. Identification of a CpG island methylator phenotype that defines a distinct subgroup of glioma. Cancer Cell 17, 510–22 (2010). [DOI] [PMC free article] [PubMed] [Google Scholar]
- 58.Thienpont B. et al. Tumour hypoxia causes DNA hypermethylation by reducing TET activity. Nature 537, 63–68 (2016). [DOI] [PMC free article] [PubMed] [Google Scholar]
- 59.Heddleston JM et al. Hypoxia inducible factors in cancer stem cells. Br J Cancer 102, 789–95 (2010). [DOI] [PMC free article] [PubMed] [Google Scholar]
- 60.Roadmap Epigenomics C. et al. Integrative analysis of 111 reference human epigenomes. Nature 518, 317–30 (2015). [DOI] [PMC free article] [PubMed] [Google Scholar]
References (Methods)
- 61.Capper D. et al. DNA methylation-based classification of central nervous system tumours. Nature 555, 469–474 (2018). [DOI] [PMC free article] [PubMed] [Google Scholar]
- 62.Bhat KPL et al. Mesenchymal differentiation mediated by NF-kappaB promotes radiation resistance in glioblastoma. Cancer Cell 24, 331–46 (2013). [DOI] [PMC free article] [PubMed] [Google Scholar]
- 63.Stoeckius M. et al. Cell Hashing with barcoded antibodies enables multiplexing and doublet detection for single cell genomics. Genome Biol 19, 224 (2018). [DOI] [PMC free article] [PubMed] [Google Scholar]
- 64.Krueger F. & Andrews SR Bismark: a flexible aligner and methylation caller for Bisulfite-Seq applications. Bioinformatics 27, 1571–2 (2011). [DOI] [PMC free article] [PubMed] [Google Scholar]
- 65.Hui T. et al. High-Resolution Single-Cell DNA Methylation Measurements Reveal Epigenetically Distinct Hematopoietic Stem Cell Subpopulations. Stem Cell Reports 11, 578–592 (2018). [DOI] [PMC free article] [PubMed] [Google Scholar]
- 66.Danecek P. et al. Twelve years of SAMtools and BCFtools. GigaScience 10(2021). [DOI] [PMC free article] [PubMed] [Google Scholar]
- 67.Forrest ARR et al. A promoter-level mammalian expression atlas. Nature 507, 462–470 (2014). [DOI] [PMC free article] [PubMed] [Google Scholar]
- 68.Hunt SE et al. Ensembl variation resources. Database 2018(2018). [DOI] [PMC free article] [PubMed] [Google Scholar]
- 69.Raney BJ et al. Track data hubs enable visualization of user-defined genome-wide annotations on the UCSC Genome Browser. Bioinformatics 30, 1003–1005 (2013). [DOI] [PMC free article] [PubMed] [Google Scholar]
- 70.Fornes O. et al. JASPAR 2020: update of the open-access database of transcription factor binding profiles. Nucleic Acids Res 48, D87–D92 (2020). [DOI] [PMC free article] [PubMed] [Google Scholar]
- 71.Lawrence MS et al. Mutational heterogeneity in cancer and the search for new cancer-associated genes. Nature 499, 214–218 (2013). [DOI] [PMC free article] [PubMed] [Google Scholar]
- 72.Garvin T. et al. Interactive analysis and assessment of single-cell copy-number variations. Nat Methods 12, 1058–60 (2015). [DOI] [PMC free article] [PubMed] [Google Scholar]
- 73.Galili T. dendextend: an R package for visualizing, adjusting and comparing trees of hierarchical clustering. Bioinformatics 31, 3718–20 (2015). [DOI] [PMC free article] [PubMed] [Google Scholar]
- 74.Wolf FA, Angerer P. & Theis FJ SCANPY: large-scale single-cell gene expression data analysis. Genome Biol 19, 15 (2018). [DOI] [PMC free article] [PubMed] [Google Scholar]
- 75.Satija R, Farrell JA, Gennert D, Schier AF & Regev A. Spatial reconstruction of single-cell gene expression data. Nat Biotechnol 33, 495–502 (2015). [DOI] [PMC free article] [PubMed] [Google Scholar]
- 76.Becht E. et al. Dimensionality reduction for visualizing single-cell data using UMAP. Nat Biotechnol (2018). [DOI] [PubMed] [Google Scholar]
- 77.Traag VA, Waltman L. & van Eck NJ From Louvain to Leiden: guaranteeing well-connected communities. Sci Rep 9, 5233 (2019). [DOI] [PMC free article] [PubMed] [Google Scholar]
- 78.Polanski K. et al. BBKNN: fast batch alignment of single cell transcriptomes. Bioinformatics 36, 964–965 (2020). [DOI] [PMC free article] [PubMed] [Google Scholar]
- 79.Stuart T. et al. Comprehensive Integration of Single-Cell Data. Cell 177, 1888–1902 e21 (2019). [DOI] [PMC free article] [PubMed] [Google Scholar]
- 80.Chakravarthy A. et al. Pan-cancer deconvolution of tumour composition using DNA methylation. Nat Commun 9, 3220 (2018). [DOI] [PMC free article] [PubMed] [Google Scholar]
- 81.Sheffield NC & Bock C. LOLA: enrichment analysis for genomic region sets and regulatory elements in R and Bioconductor. Bioinformatics 32, 587–9 (2016). [DOI] [PMC free article] [PubMed] [Google Scholar]
- 82.Koster J. & Rahmann S. Snakemake-a scalable bioinformatics workflow engine. Bioinformatics 34, 3600 (2018). [DOI] [PubMed] [Google Scholar]
- 83.Blokzijl F, Janssen R, van Boxtel R. & Cuppen E. MutationalPatterns: comprehensive genome-wide analysis of mutational processes. Genome medicine 10, 33–33 (2018). [DOI] [PMC free article] [PubMed] [Google Scholar]
- 84.Deshwar AG et al. PhyloWGS: Reconstructing subclonal composition and evolution from whole-genome sequencing of tumors. Genome Biology 16, 35 (2015). [DOI] [PMC free article] [PubMed] [Google Scholar]
- 85.Ha G. et al. TITAN: inference of copy number architectures in clonal cell populations from tumor whole-genome sequence data. Genome Res 24, 1881–93 (2014). [DOI] [PMC free article] [PubMed] [Google Scholar]
- 86.Favero F. et al. Sequenza: allele-specific copy number and mutation profiles from tumor sequencing data. Annals of oncology : official journal of the European Society for Medical Oncology 26, 64–70 (2015). [DOI] [PMC free article] [PubMed] [Google Scholar]
- 87.Bray NL, Pimentel H, Melsted P. & Pachter L. Near-optimal probabilistic RNA-seq quantification. Nat Biotechnol 34, 525–7 (2016). [DOI] [PubMed] [Google Scholar]
- 88.Hanzelmann S, Castelo R. & Guinney J. GSVA: gene set variation analysis for microarray and RNA-seq data. BMC Bioinformatics 14, 7 (2013). [DOI] [PMC free article] [PubMed] [Google Scholar]
- 89.Deshpande V. et al. Exploring the landscape of focal amplifications in cancer using AmpliconArchitect. Nat Commun 10, 392 (2019). [DOI] [PMC free article] [PubMed] [Google Scholar]
Associated Data
This section collects any data citations, data availability statements, or supplementary materials included in this article.
Supplementary Materials
Data Availability Statement
All deidentified, non-protected access somatic variant calls, single-cell gene expression profiles, regional single-cell DNAme data, and single-cell DNAme disorder data are accessible via Synapse (https://synapse.org/singlecellglioma ). Raw bulk and single-cell sequencing data and methylation microarray data are available through the European Genome-phenome Archive (EGA) under the accession number EGAS00001005300. The GRCh37 (hg19) reference genome was obtained from GATK (https://gatk.broadinstitute.org/).


