

Abstract
Induced pluripotent stem cells (iPSCs) provide an extraordinary tool for disease modeling owing to their potential to differentiate into the desired cell type. The differentiation of iPSCs is typically performed on 2-dimensional monolayers of stromal cell or animal tissue derived extracellular matrices. Recent advancements in disease modeling have utilized iPSCs in 3-dimensional (3D) cultures to study diseases such as muscular dystrophy, cardiomyopathy, and pulmonary fibrosis. However, these approaches are yet to be explored in modeling the hematological malignancies. Transient myeloproliferative disorder (TMD) is a preleukemic stage, which is induced in 10–20% of children with trisomy 21 possessing the pathognomonic mutation in the transcription factor GATA1. In this study, we established a synthetic 3D iPSC culture system for modeling TMD via hematopoietic differentiation of customized iPSCs. A chemically cross-linkable PEG hydrogel decorated with integrin binding peptide was found to be permissive of hematopoietic differentiation of iPSCs. It provided a cost-effective system for the generation of hematopoietic stem and progenitor cells (HSPCs) with higher yield of early HSPCs compared to traditional 2D culture on Matrigel coated dishes. Characterization of the HSPCs produced from the iPSC lines cultured in 3D showed that the erythroid population was reduced whereas the megakaryoid and myeloid populations were significantly increased in GATA1 mutant trisomic line compared to disomic or trisomic lines with wild-type GATA1, consistent with TMD characteristics. In conclusion, we have identified a cost-effective tunable 3D hydrogel system to model TMD.
Keywords: Hematopoietic differentiation, transient myeloproliferative disorder, leukemia, hydrogel, PEG, RGD peptide, induced pluripotent stem cells, GATA1s, three-dimensional culture
Graphical Abstract
Introduction
Chromosomal abnormalities along with specific genetic mutations are recognized as major players in initiating oncogenic transformation.1 GATA1 mutation in hematopoietic stem and progenitor cells (HSPCs) with trisomy 21 results in transient myeloproliferative disorder (TMD).2, 3 TMD is a pre-leukemic condition characterized by the presence of a high number of immature megakaryoblasts owing to a block in megakaryocytic differentiation.4, 5 Acquisition of additional mutations in this genetic background leads to frank leukemia generally referred to as Down syndrome myeloid leukemia (DS-ML).6 Due to step-wise acquisition of mutations leading to DS-ML, modeling this disease provides an excellent opportunity to study the initiation and progression of the disease.
Induced pluripotent stem cells (iPSCs) provide a model system to study hematopoietic development, disease progression and drug resistance.7 Hematopoietic differentiation of iPSCs to produce HSPCs has been achieved using three approaches: 1) embryoid body (EB) formation8, 9, 2) feeder cell co-culture10, and 3) extracellular matrix (ECM) coated dishes11. These approaches are an upgrade from traditional 2-dimensional cultures on tissue culture polystyrene (TCPS) as they facilitate the development of cell-cell (EB formation and co-cultures) or cell-matrix interactions (ECM coating). However, these systems fail to capture both cell-cell and cell-matrix interactions that are important during hematopoietic differentiation of iPSCs.12, 13 Engineered stem cell niches in 3-dimensional (3D) culture systems provide an opportunity to explore the biophysical and biochemical cues that control stem cell fate. The 3D biomaterial model offers the dimensionality and stiffness that can alter the viability, motility, morphology, differentiation efficiency, and functionality of differentiated cells and the cell response to biochemical cues.14
Natural protein-based hydrogels (Matrigel, collagen, fibrin) or synthetic polymer-based hydrogels (polyethylene glycol or PEG) are being used to study the behavior and fate of stem cells including iPSCs, HSPCs, mesenchymal stem cells (MSCs), and neural progenitor cells (NPCs).15–17 In particular, the role of 3D environment in controlled iPSC differentiation into various lineages is the area of focus for many researchers. The 3D collagen-based hydrogel has been employed in generating insulin-producing cells from iPSCs with increased expression of pancreatic markers in 3D compared to 2D.18 The inherent batch-to-batch variability, high cost of production and animal origin (Matrigel) are some of the disadvantages of using natural ECM as substrates.19 For example, a proteomics study of different batches of Matrigel showed only 53% consistency in the matrix components.20 Chitosan and alginate are two common polysaccharide-based hydrogels used for iPSC encapsulation and differentiation into various cell lineages such as hepatocytes21, insulin-producing cells22, retinal cells23, and NPCs24, 25. Although inexpensive, these are physical gels (crosslinked via ionic interactions) that suffer from low mechanical resistance and uncontrollable pore sizes.26, 27 The hematopoietic differentiation of iPSC in 3D has so far been reported in alginate hydrogel28, and a self-assembling peptide hydrogel13. Like alginate, self-assembling peptide hydrogels are not mechanically stable. They are formed by noncovalent bonds of peptides29 and can collapse from slight pressure such as water flow during gel formation. Therefore, a stable, tunable and cost-effective material is needed to study the hematopoietic differentiation of iPSCs and model hematological disorders. The synthetic polymers provide a base material with tunable mechanical properties, bio inertness and accessibility for chemical modification.30, 31 The PEG based hydrogels have not only been employed to generate iPSCs in 3D with higher reprogramming efficiency32, but also to study the role of 3D environment and the presence of different cell-binding ligands on differentiation of iPSCs to NPCs.33, 34 Thus, synthetic hydrogels provide certain advantages over natural hydrogels, namely a lower cost of production, tunability, reproducibility and origination from an animal free matrix.19
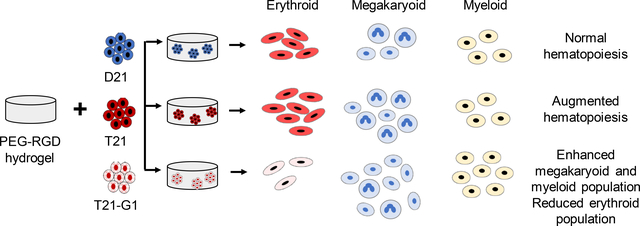
The aim of the present study was to develop a synthetic polymer-based 3D hydrogel containing integrin-binding motif to model TMD. Specifically, we utilized PEG based synthetic hydrogels formed by Michael-type addition reaction between vinyl and thiol groups. The PEG hydrogels were decorated with the integrin-binding peptide (RGD), which promotes cell adhesion by binding to various integrins35–39, specifically β1 integrin, which is shown to be important for iPSC survival in 3D culture.34 We encapsulated isogenic euploid or trisomy 21 iPSCs along with trisomy 21 iPSCs bearing GATA1 mutation and subjected them to hematopoietic differentiation. HSPCs generated from trisomy 21 iPSC line with mutated GATA1 showed the characteristics of TMD with increased megakaryoid and myeloid population compared to disomic or trisomic iPSC lines with wild-type GATA1.
Results and Discussion
Design and synthesis of hydrogels
Hydrogel was generated using Michael-type addition reaction between vinyl and thiol groups.40 A 4-arm star PEG (PEG4Ac and PEG4SH) formed the backbone of the hydrogel, which was decorated with a cysteine-conjugated integrin-binding peptide (GRGDSPC) and crosslinked with an enzymatically cleavable, bis-acrylamide functionalized peptide (GGPQGIWGQGKG). While maintaining the concentration of RGD and PQ peptides at 2mM, hydrogels were formed with polymer (PEG4Ac and PEG4SH) content varying from 7wt% to 19wt%. The ratio of vinyl to thiol group was maintained at 1:1 to avoid stoichiometric defects and form a stable hydrogel. Rheological measurements were performed on the hydrogels to determine the gelation time and modulus for this system. The gel point defined as a crossover point where storage modulus (G’) equals the loss modulus (G″) point, was achieved within 5 min for 7wt% and almost instantaneously for 13wt% and 19wt% hydrogels. The gelation rate and modulus can be tuned as a function of PEG concentration and varied from 0.5–10 kPa (Fig. 1A), which is within the range of the modulus of embryonic tissues (0.1–10 kPa).41 Owing to its hydrophilic structure, PEG hydrogel can extensively swell in water-based media.42 Similar to the in-situ modulus, the equilibrium modulus of hydrogel also varied as a function of PEG concentration and crosslinking density (Fig. 1B). The equilibrium modulus of 7wt% hydrogel was 88.3±2.2 Pa, for 13wt% was 3584.5±121.2 Pa and for 19wt% was 4815.5±76.2 Pa. The modulus of this magnitude was targeted because of its general physiological relevance during embryonic development.41, 43 Subsequent cell studies were conducted in low (7wt%) modulus hydrogel.
Fig. 1. Rheological characterization of PEG-peptide hydrogels.
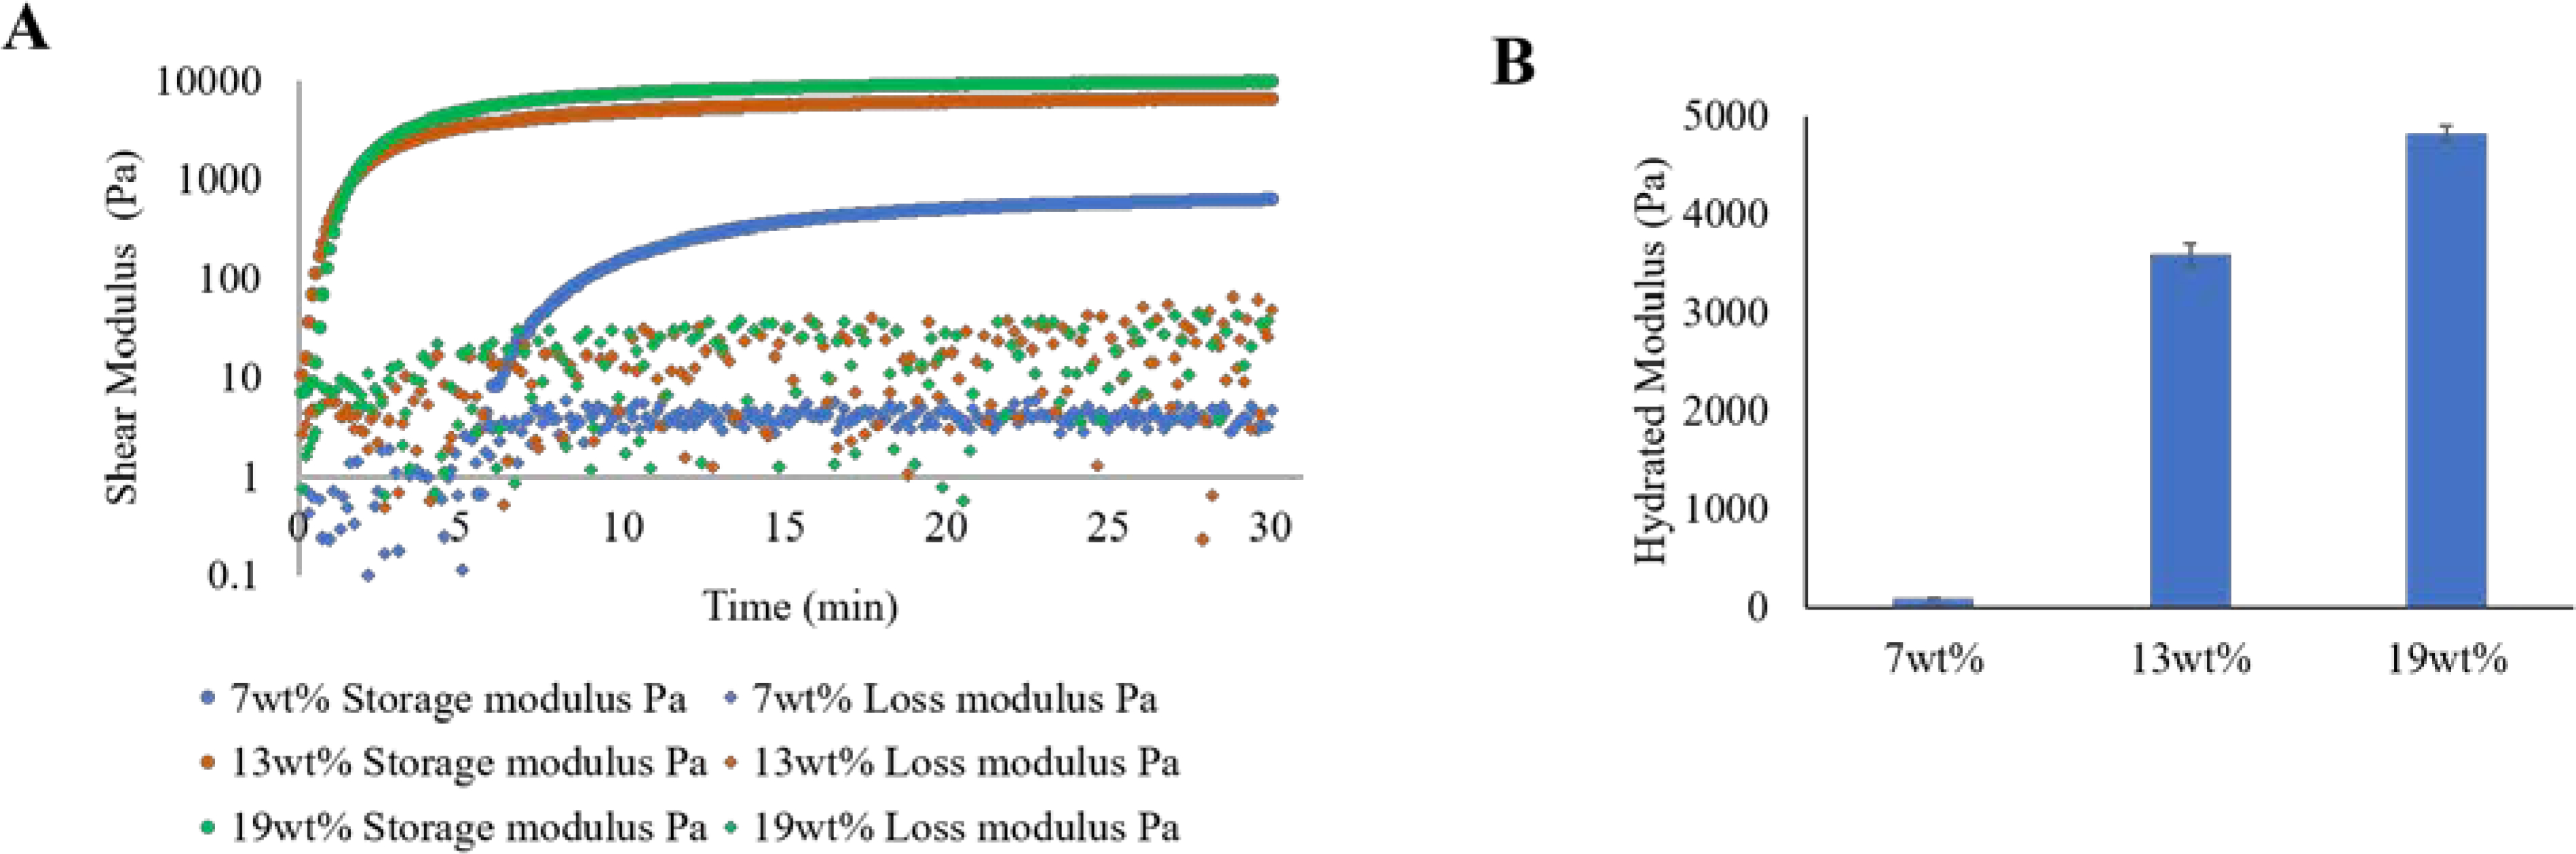
A) Representative plot showing in situ time sweep measurement of shear modulus of 7wt%, 13wt% and 19wt% hydrogels showing the gel point for each hydrogel composition. The experiment was repeated three times with different batches of PEG4Ac and PEG4SH. The average shear modulus from three independent trials was 0.7±0.03kPa (for 7wt%), 6.6±0.4kPa (for 13wt%) and 10.2±0.4 (for 19wt%). B) Equilibrium modulus of swollen hydrogels after 24 h. Average data from 3 independent experiments is plotted. Error bars indicate standard error of the mean.
Impact of 3D encapsulation on iPSC phenotype
The cyto-compatibility of PEG hydrogels was evaluated by 3D encapsulation of iPSCs in PEG hydrogels. iPSCs are generally cultured on ECM-coated (Matrigel, vitronectin, laminin) tissue culture dishes in chemically defined conditions to maintain their pluripotency and directed differentiation towards specific lineages.44–46 In this study, we used Matrigel was used as a reference for comparison of viability and growth of the iPSC colonies in 2D and 3D cultures. The morphological characterization of iPSC colonies encapsulated in 3D showed notable differences when compared to 2D cultured iPSC colonies. The 3D encapsulated colonies acquired more compact morphology compared to flattened morphology in 2D owing to the planar nature and rigidity of 2D surfaces (Fig. 2A). The viability of the encapsulated colonies was evaluated in-situ using cytotoxicity kit. The 3D encapsulation did not have an adverse effect on the viability and growth of iPSCs as compared to 2D surfaces (Fig. 2B). We also observed that the presence of integrin binding peptide supported iPSC survival in agreement with previous studies.34, 47 The average diameter of colonies cultured in 2D and 3D systems was not significantly different (Fig. 2C). However, the colony aspect ratio differed significantly between 2D and 3D, with average aspect ratio of 2.47±0.80, 1.04±0.05 and 1.13±0.10 for 2D surface, 3D Matrigel and 3D PEG gels, respectively. This indicates the morphological differences of flattened colonies in 2D vs spheroidal colonies in 3D hydrogels. The 3D hydrogel-based systems have reported the iPSC spheroid formation with sizes ranging from 40–750 μm.33, 48
Fig. 2. Effect of 3D encapsulation on iPSC morphology and viability.
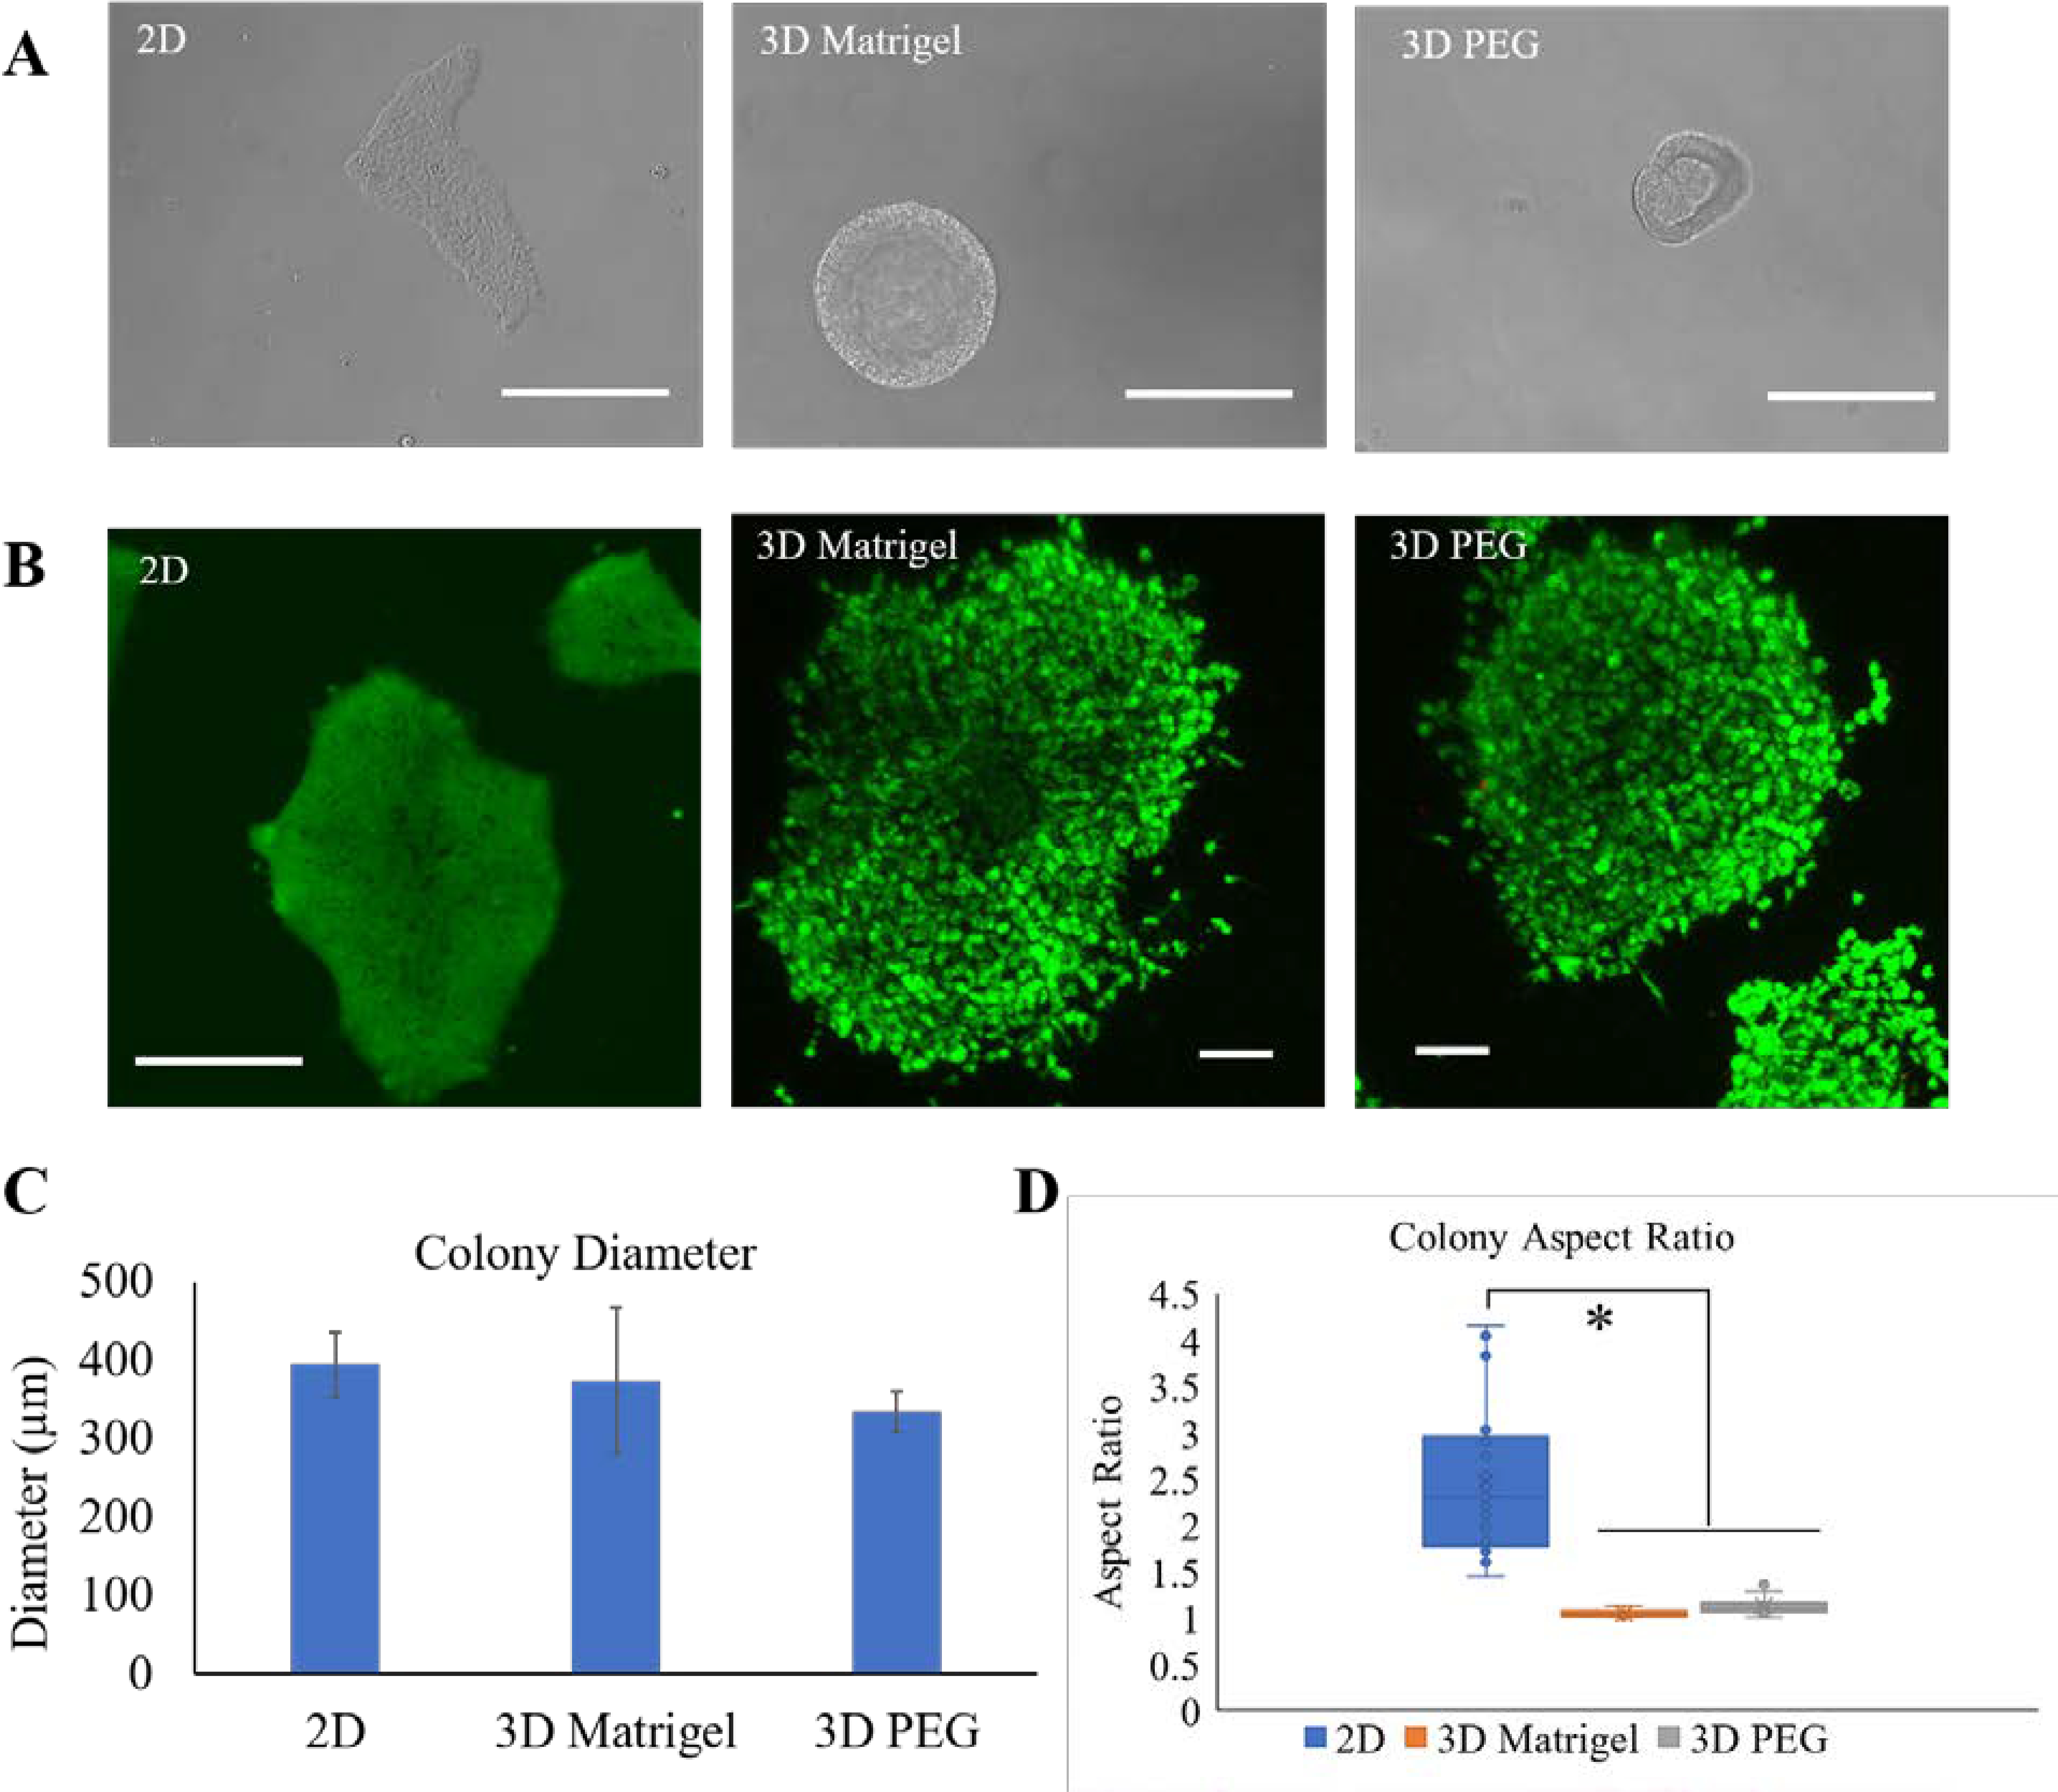
A) Representative optical images of iPSC colonies showing the morphology of iPSC colonies on 2D surface, 3D Matrigel and 3D PEG hydrogel. Scale bar = 100 μm. B) Representative confocal images of the encapsulated colonies stained with calcein violet 450 AM (green, live cells) and ethidium homodimer-1 (red, dead cells). Scale bars = 100 μm. C) Quantification of diameter of iPSC colonies on 2D surface, 3D Matrigel and 3D PEG hydrogel using Fiji software. Average data from 3 independent experiments is plotted. Error bars indicate standard error. D) Box and whisker plot showing iPSC colony aspect ratio. Average data from three independent experiments was plotted. The box shows the interquartile range, whiskers represent minimum and maximum values, circles represent each data point, the crosses represent the mean, and the line inside the box represents the median. *p<0.01.
The pluripotency of the encapsulated iPSCs was assessed via alkaline phosphatase staining and flow cytometry analysis of pluripotency markers, Tra-1–60 and SSEA-4. Alkaline phosphatase is one of the key markers for identification of pluripotency.49 Undifferentiated iPSC colonies stained positive for alkaline phosphatase as shown by the intense purple stain as compared to differentiating colonies (Fig. S1A). When maintained in the mTeSR1 medium, 96% cells stained positive for both Tra-1–60 and SSEA-4 (Fig. S1B). The high level of pluripotency is reported in various 3D hydrogel systems when maintained in chemically defined medium.33, 48, 50 Taken together, the PEG-peptide hydrogel was permissive in maintaining the viability and pluripotency of the encapsulated iPSCs.
Hematopoietic differentiation of iPSC in 3D PEG-peptide hydrogels
To evaluate the permissiveness of 3D hydrogel to differentiate iPSCs into HSPCs, the hydrogel encapsulated iPSC colonies were subjected to hematopoietic differentiation. We examined differentiation in a low modulus (0.7kPa) and a high modulus (2kPa) hydrogel. The morphological observation of colony growth on day 3 revealed the outward migration of cells from the colonies in a low modulus gel compared to no outward growth in a high modulus gel. The colonies continued to grow outwards and by day 12, round hematopoietic cells emerged in the low modulus hydrogels (Fig. S2A). On the contrary, the colonies in the high modulus hydrogel continued to become dense and grew as a spheroid body without the presence of round hematopoietic cells, suggesting that the hematopoietic differentiation was hampered in high modulus hydrogel. Mesoderm formation is a critical step during hematopoietic differentiation and is followed by hemangioblast formation, eventually leading to the production of HSPCs. Immunostaining with mesoderm marker, HAND1, on day 3 differentiating colonies showed the absence of mesoderm formation in high modulus hydrogels with varying RGD concentration (2mM, 3mM, 4mM) (Fig S2B). The expression of hemangioblast surface marker, VEGFR2, was also downregulated substantially in the high modulus hydrogel, irrespective of the RGD concentration (Fig S2C). The mechanism by which the modulus regulates HAND1 and VEGFR2 expression needs to be studied. Subsequent analysis of day 12 cells collected from the hydrogels showed absence of HSPCs from high modulus hydrogel (Fig. S2D) confirming the lack of differentiation in high modulus hydrogel. A self-assembling peptide hydrogel produced approximately 70% CD34+ cells in a previous study13 These self-assembling peptide hydrogels have been reported to have more liquid like property with very low storage modulus (5Pa).51 The PEG based 3D hydrogels have been shown to be permissive of survival and differentiation of iPSCs in various lineages.33, 34 However, depending on the culture conditions, differentiation potential could also be hampered. For example, iPSC cultured in fibrin hydrogel (~0.7kPa) showed reduced differentiation potential towards MSCs compared to TCPS or 2D fibrin hydrogel whereas neural differentiation is upregulated in 3D environment.52 Although the modulus of the material showed negligible effect on iPSC survival and proliferation, the early differentiation was regulated by the stiffness of the hydrogel, consistent with other studies.53
During development, the anatomical site of hematopoiesis changes from yolk sac to fetal liver, and finally to bone marrow postnatally.54, 55 The mesoderm germ layer gives rise to cells of the hematopoietic lineage. The studies in chick and murine embryo identified the modulus of mesoderm and fetal liver ranging from 0.150–1kPa and 0.03–0.43kPa, respectively.56, 57 The rheological and atomic force microscopic assessment of bone marrow revealed that the inner marrow is softer (E=0.1–1kPa).58 The low hydrogel modulus (0.7kPa) is consistent with the physiological modulus of the sites of hematopoiesis during development.. Thus, the low modulus synthetic matrix not only supported the iPSC viability but also permitted hematopoietic differentiation.
Morphological characterization of differentiating cells in 3D PEG hydrogel (0.7kPa) and 3D Matrigel, revealed a similar pattern of colony growth outwards and emergence of round hematopoietic cells by day 12 (Fig. S3A). The modulus of Matrigel was 50–80Pa as reported in literature and from our own data.51 The visual inspection of hydrogels revealed weakening of the PEG hydrogel and almost complete degradation of Matrigel by day 12. Flow analysis indicated that more than 80% of cells expressed hematopoietic markers CD34 and/or CD45 in 3D Matrigel as well as PEG hydrogel (Fig. S3B). Additionally, neuronal markers such as N-cadherin, CD24, CD56 59, 60, adipogenic marker, CD137 61 and osteogenic marker, CD10 62 were also tested. While a large percentage of cells were positive for hematopoietic marker CD45, there was no substantial staining for markers of other lineages (Fig S3C). Thus, the low modulus 3D hydrogels not only support the iPSC growth but also permit specific hematopoietic differentiation of iPSCs under given conditions.
Hematopoietic differentiation of disomic iPSC line, D21, was compared between 2D cultured and 3D encapsulated colonies. The yield of hematopoietic cells per differentiating iPSC colony generated from 3D PEG hydrogel was 3-fold higher than 2D (Fig. S4). The immunophenotype analysis using flow cytometry revealed a 1.7-fold higher percentage of CD34+CD45+CD38-CD45RA- cells generated from 3D PEG hydrogels (83.4±1.8%) as compared to 2D (48.3±8.2%) differentiated cells (Fig. 3A). We further delineated the sub-populations in HSPC compartment as early HSPCs (based on the presence of CD49f)63, intermediate HSPCs (CD90+CD49f-), and multi potent progenitors (MPPs) (CD90-CD49f-).64, 65 The immunophenotype analysis of HSPCs from 2D and 3D hydrogel revealed a significantly higher population of early HSPCs in 3D (59.0±4.1%) as compared to 2D (30.2±5.5%) (Fig. 3A). Additionally, the cells in CD90-CD49f- compartment representing MPPs were also higher in 3D HSPCs (20.0±2.1%) compared to 2D HSPCs (9.2±5.1%). Further analysis of lineage specific markers in day 12 HSPCs revealed similar propensity of erythroid and megakaryoid population in 3D HSPCs compared to a dominant erythroid population in 2D HSPCs (Fig. 3B).
Fig. 3. Characterization of hematopoietic differentiation of iPSC in 2D and 3D.
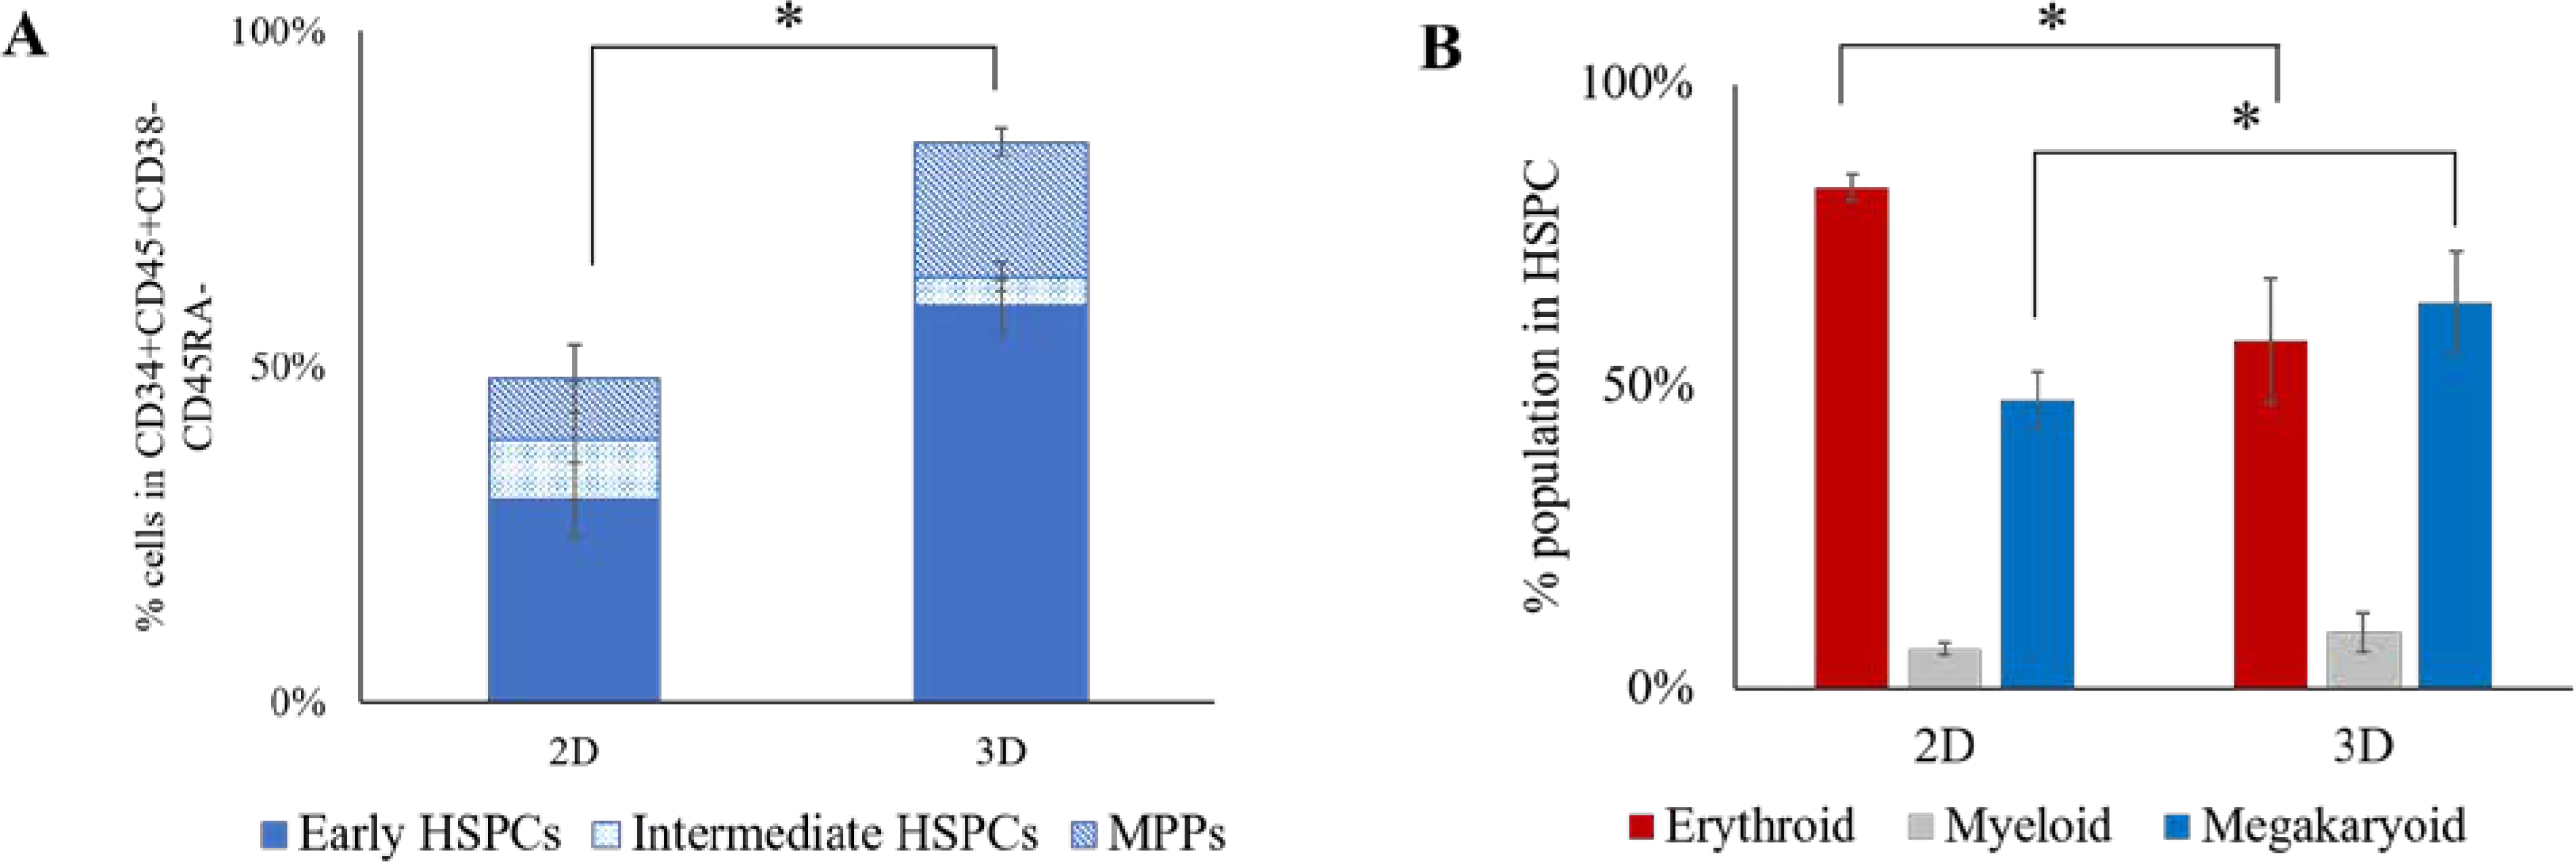
A) Quantification of percentage of CD34+CD45+CD38-CD45RA-CD90+/−CD49f+/− population in day 10 HSPCs generated from hematopoietic differentiation of iPSCs. *p<0.05. B) Quantification of percentage of erythroid population (CD71+CD235+), megakaryoid (CD41+CD34+/CD41+) and myeloid population (CD18+CD45+) in day 12 HSPCs generated from iPSCs. Average data from 4 independent experiments is plotted. Error bars indicate standard deviation. *p<0.05.
The presence of early HSPCs generated from 3D hydrogel was confirmed using CFU assay. The 3D generated HSPCs gave rise to a greater number of CFU-GEMM (mixed) colonies (62±11) compared to 2D (30±12), whereas the number of BFU-E (erythroid) colonies were lower in 3D generated HSPCs (26±8) compared to 2D (68±9) (Fig. 4A). Consistent with these data, the immunophenotype analysis of the cells collected from the dissociation of Methocult colonies showed a lower percentage of erythroid population (CD71+CD235+) in 3D (69.88±2.97%) compared to 2D (84.35±1.03%) and a higher percentage of myeloid population (CD18+CD45+) in 3D (13.56±0.71%) compared to 2D (4.41±0.32%) confirming the presence of higher number of mixed colonies from 3D HSPCs (Fig. 4B).
Fig. 4. Colony forming unit assay of 2D and 3D generated HSPCs.
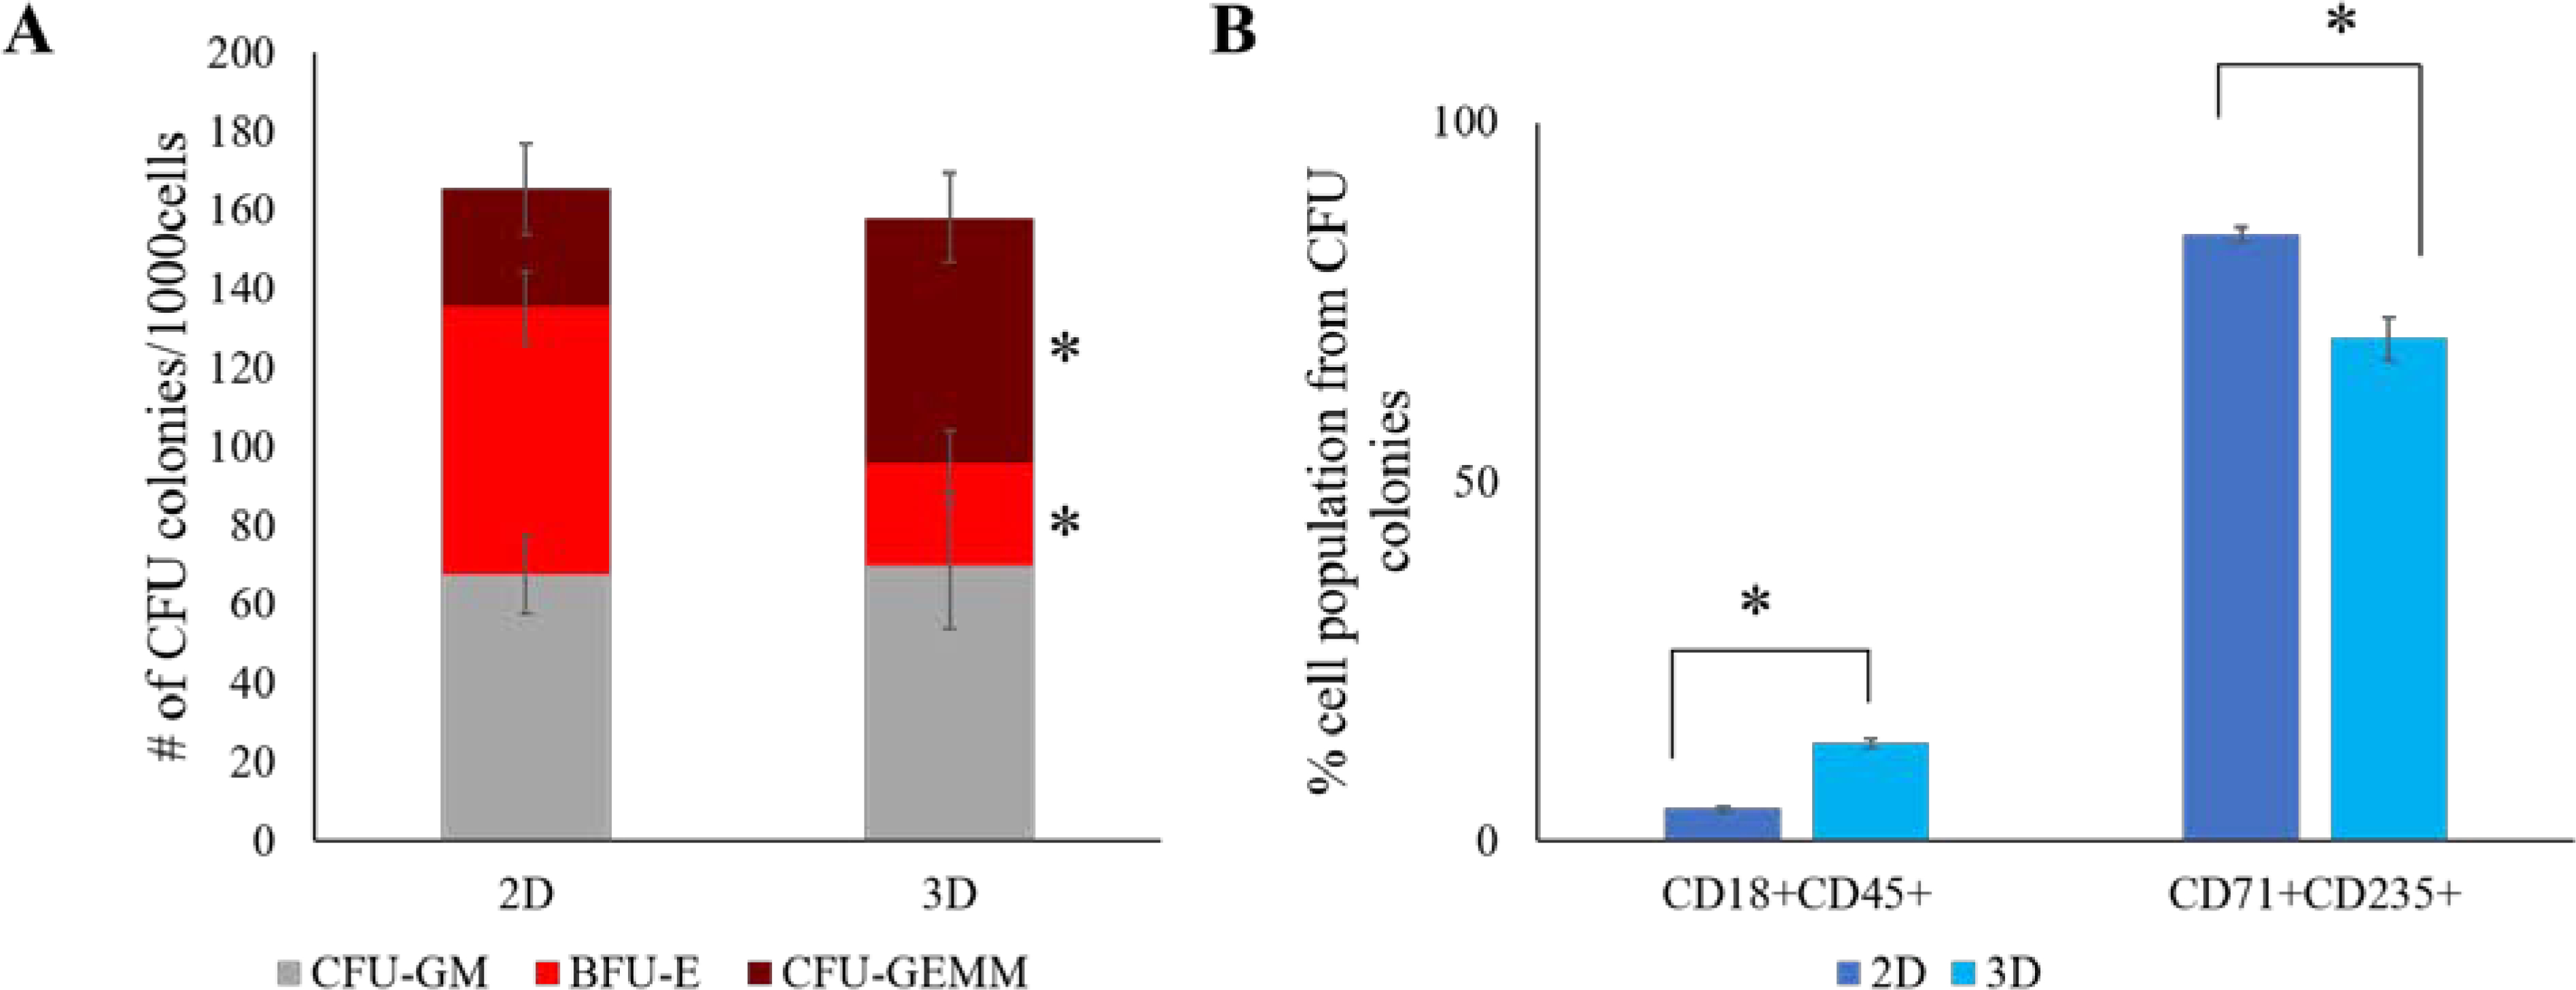
A) Graphs show the distribution of hematopoietic colonies and CFU subtypes. Error bars indicate standard deviation. *p<0.05. B) Quantification of percentage of erythroid population (CD71+CD235+) and myeloid population (CD18+CD45+) from cells isolated from Methocult. Average data from 3 independent experiments is plotted. Error bars indicate standard deviation. *p<0.05.
Development of a 3D PEG-peptide hydrogel model for TMD
After establishing a low modulus (0.7kPa) PEG hydrogel 3D system for iPSC hematopoietic differentiation, we subsequently used the same system for modeling TMD using disomic and isogenic trisomy 21 iPSC lines bearing pathologic mutation in GATA1 transcription factor to produce its oncogenic form, GATA1s. Our previous study showed that GATA1s (N-terminally truncated mutant GATA1) decreases erythroid population and increases immature megakaryoid and myeloid population when iPSCs grown on 2D Matrigel are subjected to hematopoietic differentiation.66 Similar to 2D studies, the erythroid population (CD71+ CD235+) was reduced in GATA1 mutated trisomic lines (Fig. 5), confirming the role of GATA1 in the development of erythroid population.67 The total number of erythroid cells (CD71+ CD235+) on day 12 were also significantly reduced in T21-G1 as compared to the wild-type counterpart (Fig. S5A). Differentiation of iPSC lines harboring GATA1 mutation in 3D showed a high percentage of myeloid population (CD18+CD45+) compared to the iPSC lines with wild-type GATA1 (Fig. 6). The GATA1 mutation resulted in an increase in the megakaryoid population (immature blast) as characterized by the percentage of CD34+CD41+ population within the total CD41+ population (Fig. 7). The GATA1 mutation affected the megakaryocytic differentiation resulting in significantly lower number of cells in the CD34-CD41+ (committed stage) and CD34+CD41+ (intermediate stage) compartments in T21-G1 compared to T21. The number of CD34+CD41- (early stage) cells was significantly higher in T21-G1 (Fig. S5B). Because, an increased immature megakaryoid population is a hallmark of TMD68, our data indicates that the hematopoietic differentiation of T21-G1 in 3D hydrogel recapitulated TMD characteristics.
Fig. 5. Effect of trisomy 21 and GATA1 mutation on erythroid population.
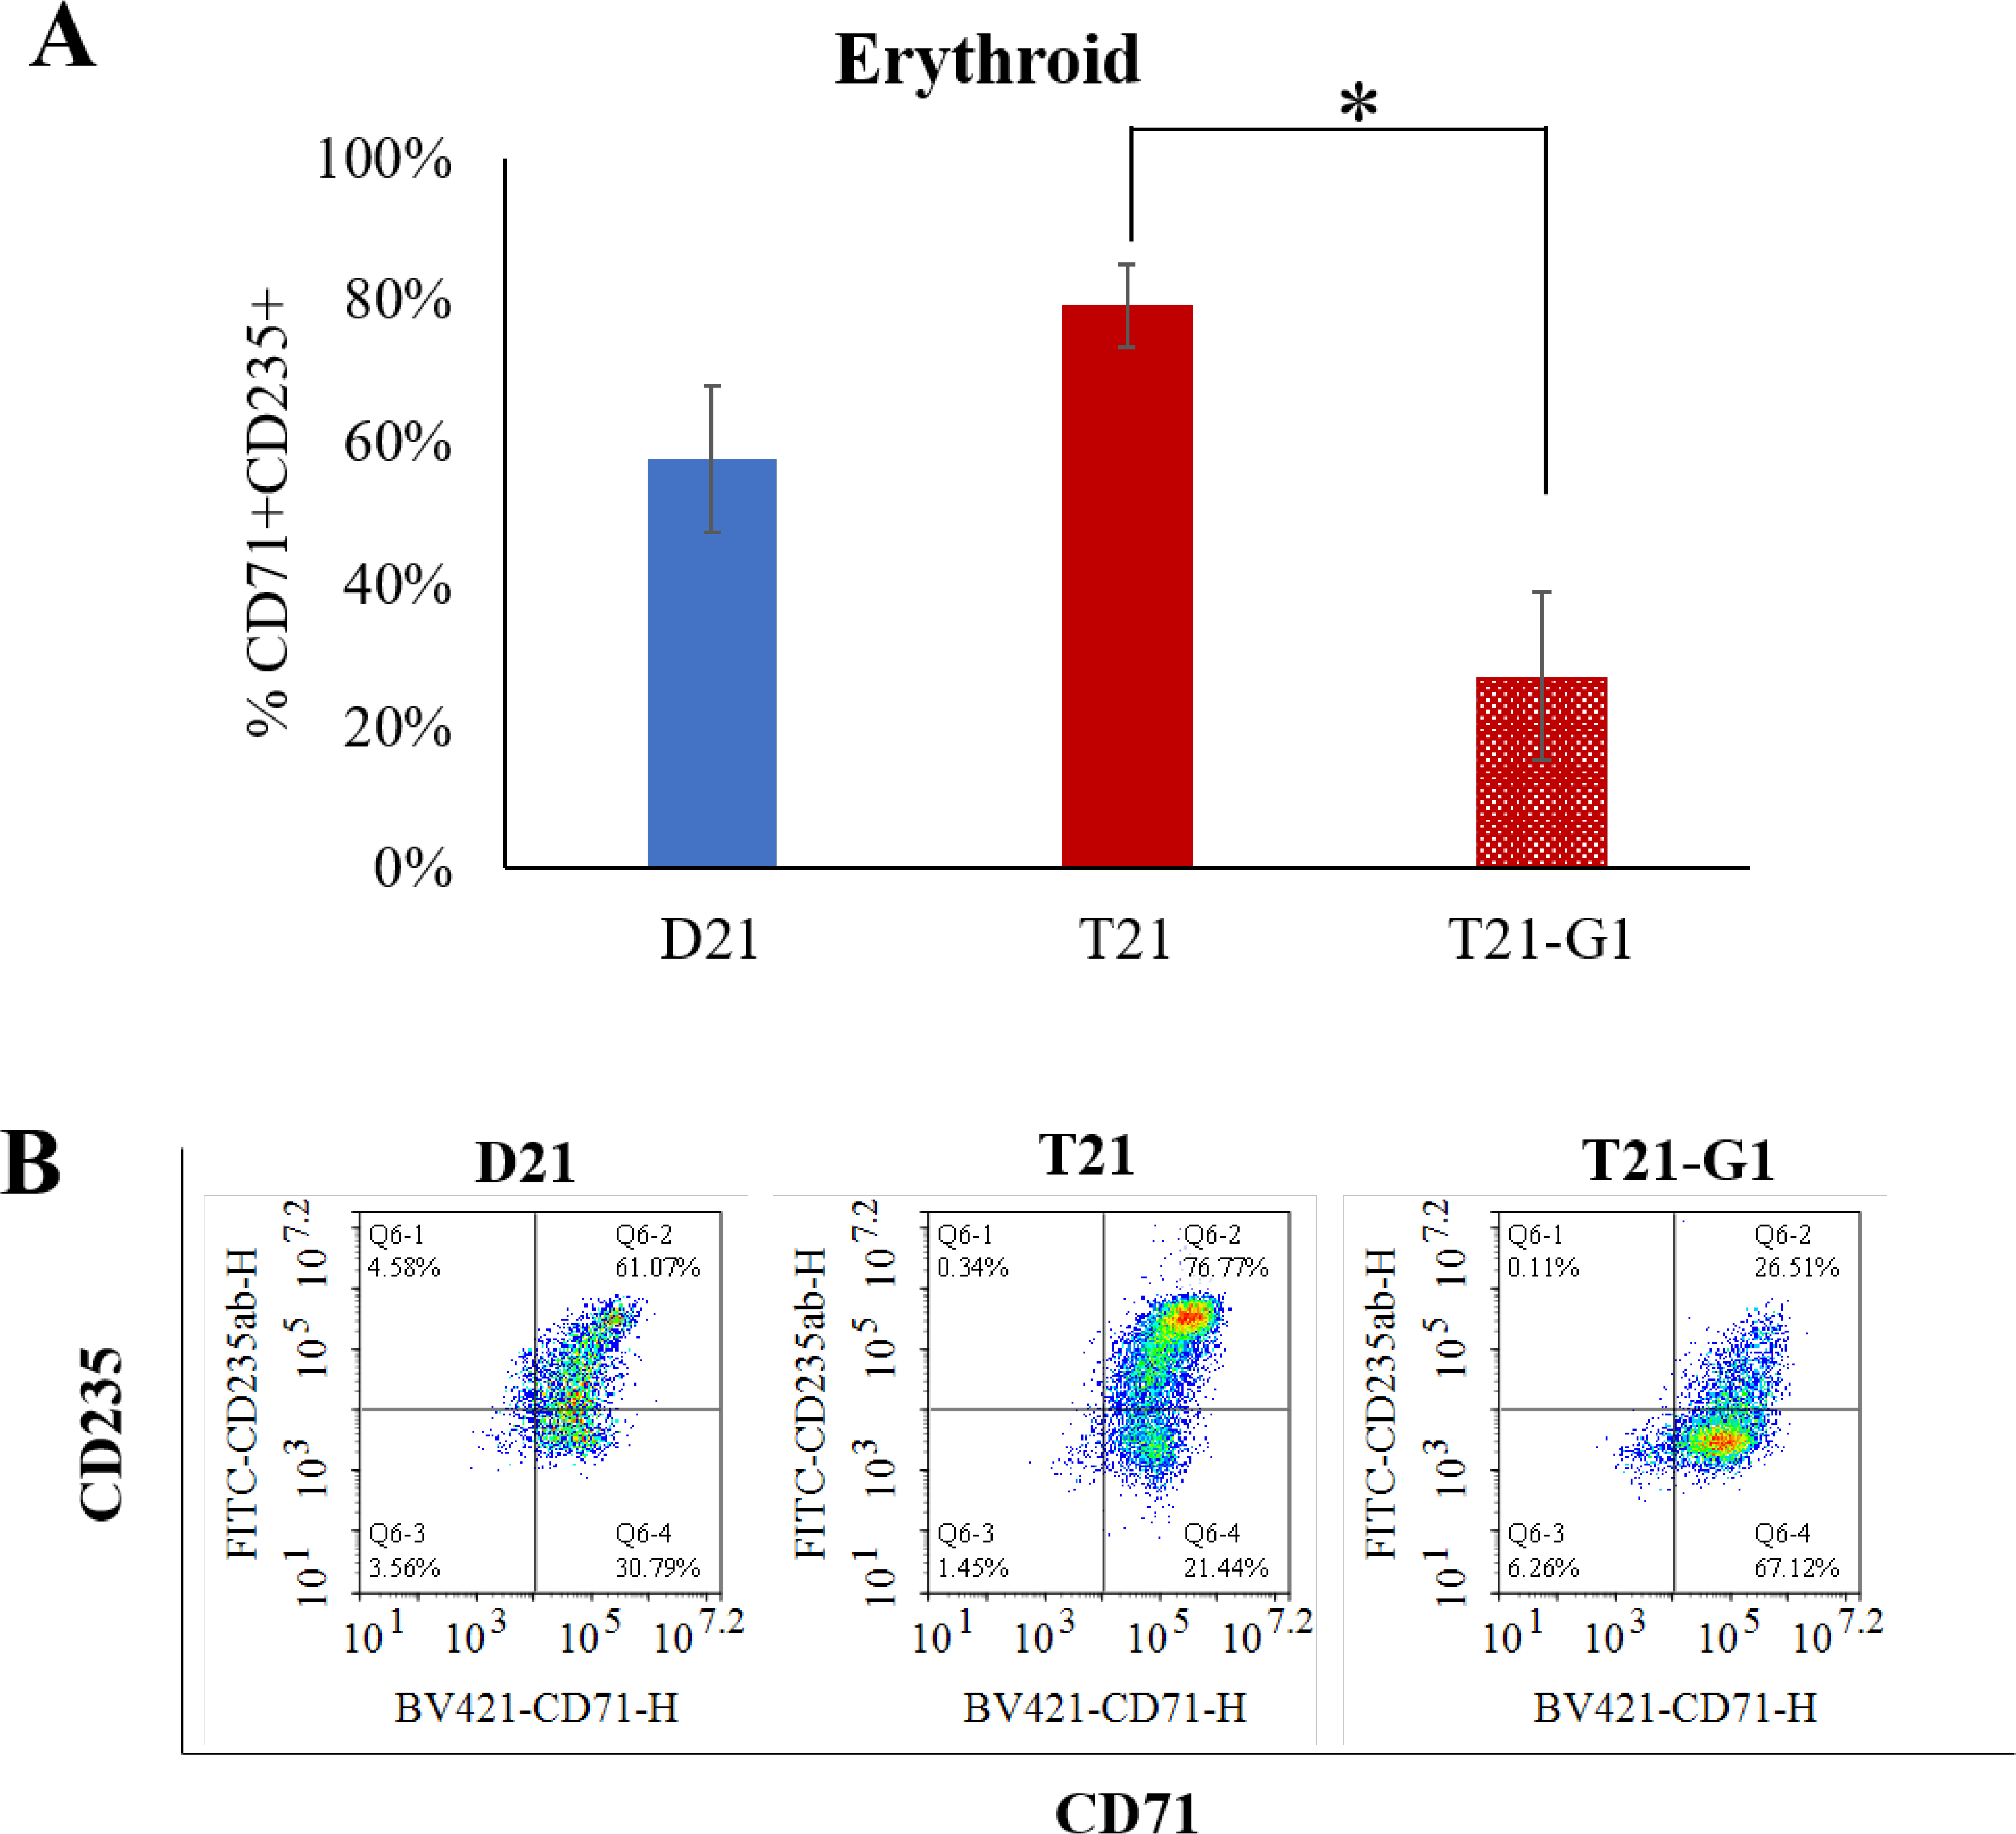
A) Graphs show the percentage of erythroid population (CD71+CD235+) in day 12 HSPCs generated from isogenic disomic (D21) and trisomic (T21) iPSC lines with wild-type GATA1 or trisomic iPSC line with GATA1 mutation (T21-G1). Average data from 4–6 independent experiments is plotted (N=5, D21; N=4, T21; N=6, T21-G1). Error bars indicate standard deviation. *p<0.05. B) Representative flow plots showing the erythroid population in day 12 HSPCs.
Fig. 6. Effect of trisomy 21 and GATA1 mutation on myeloid population.
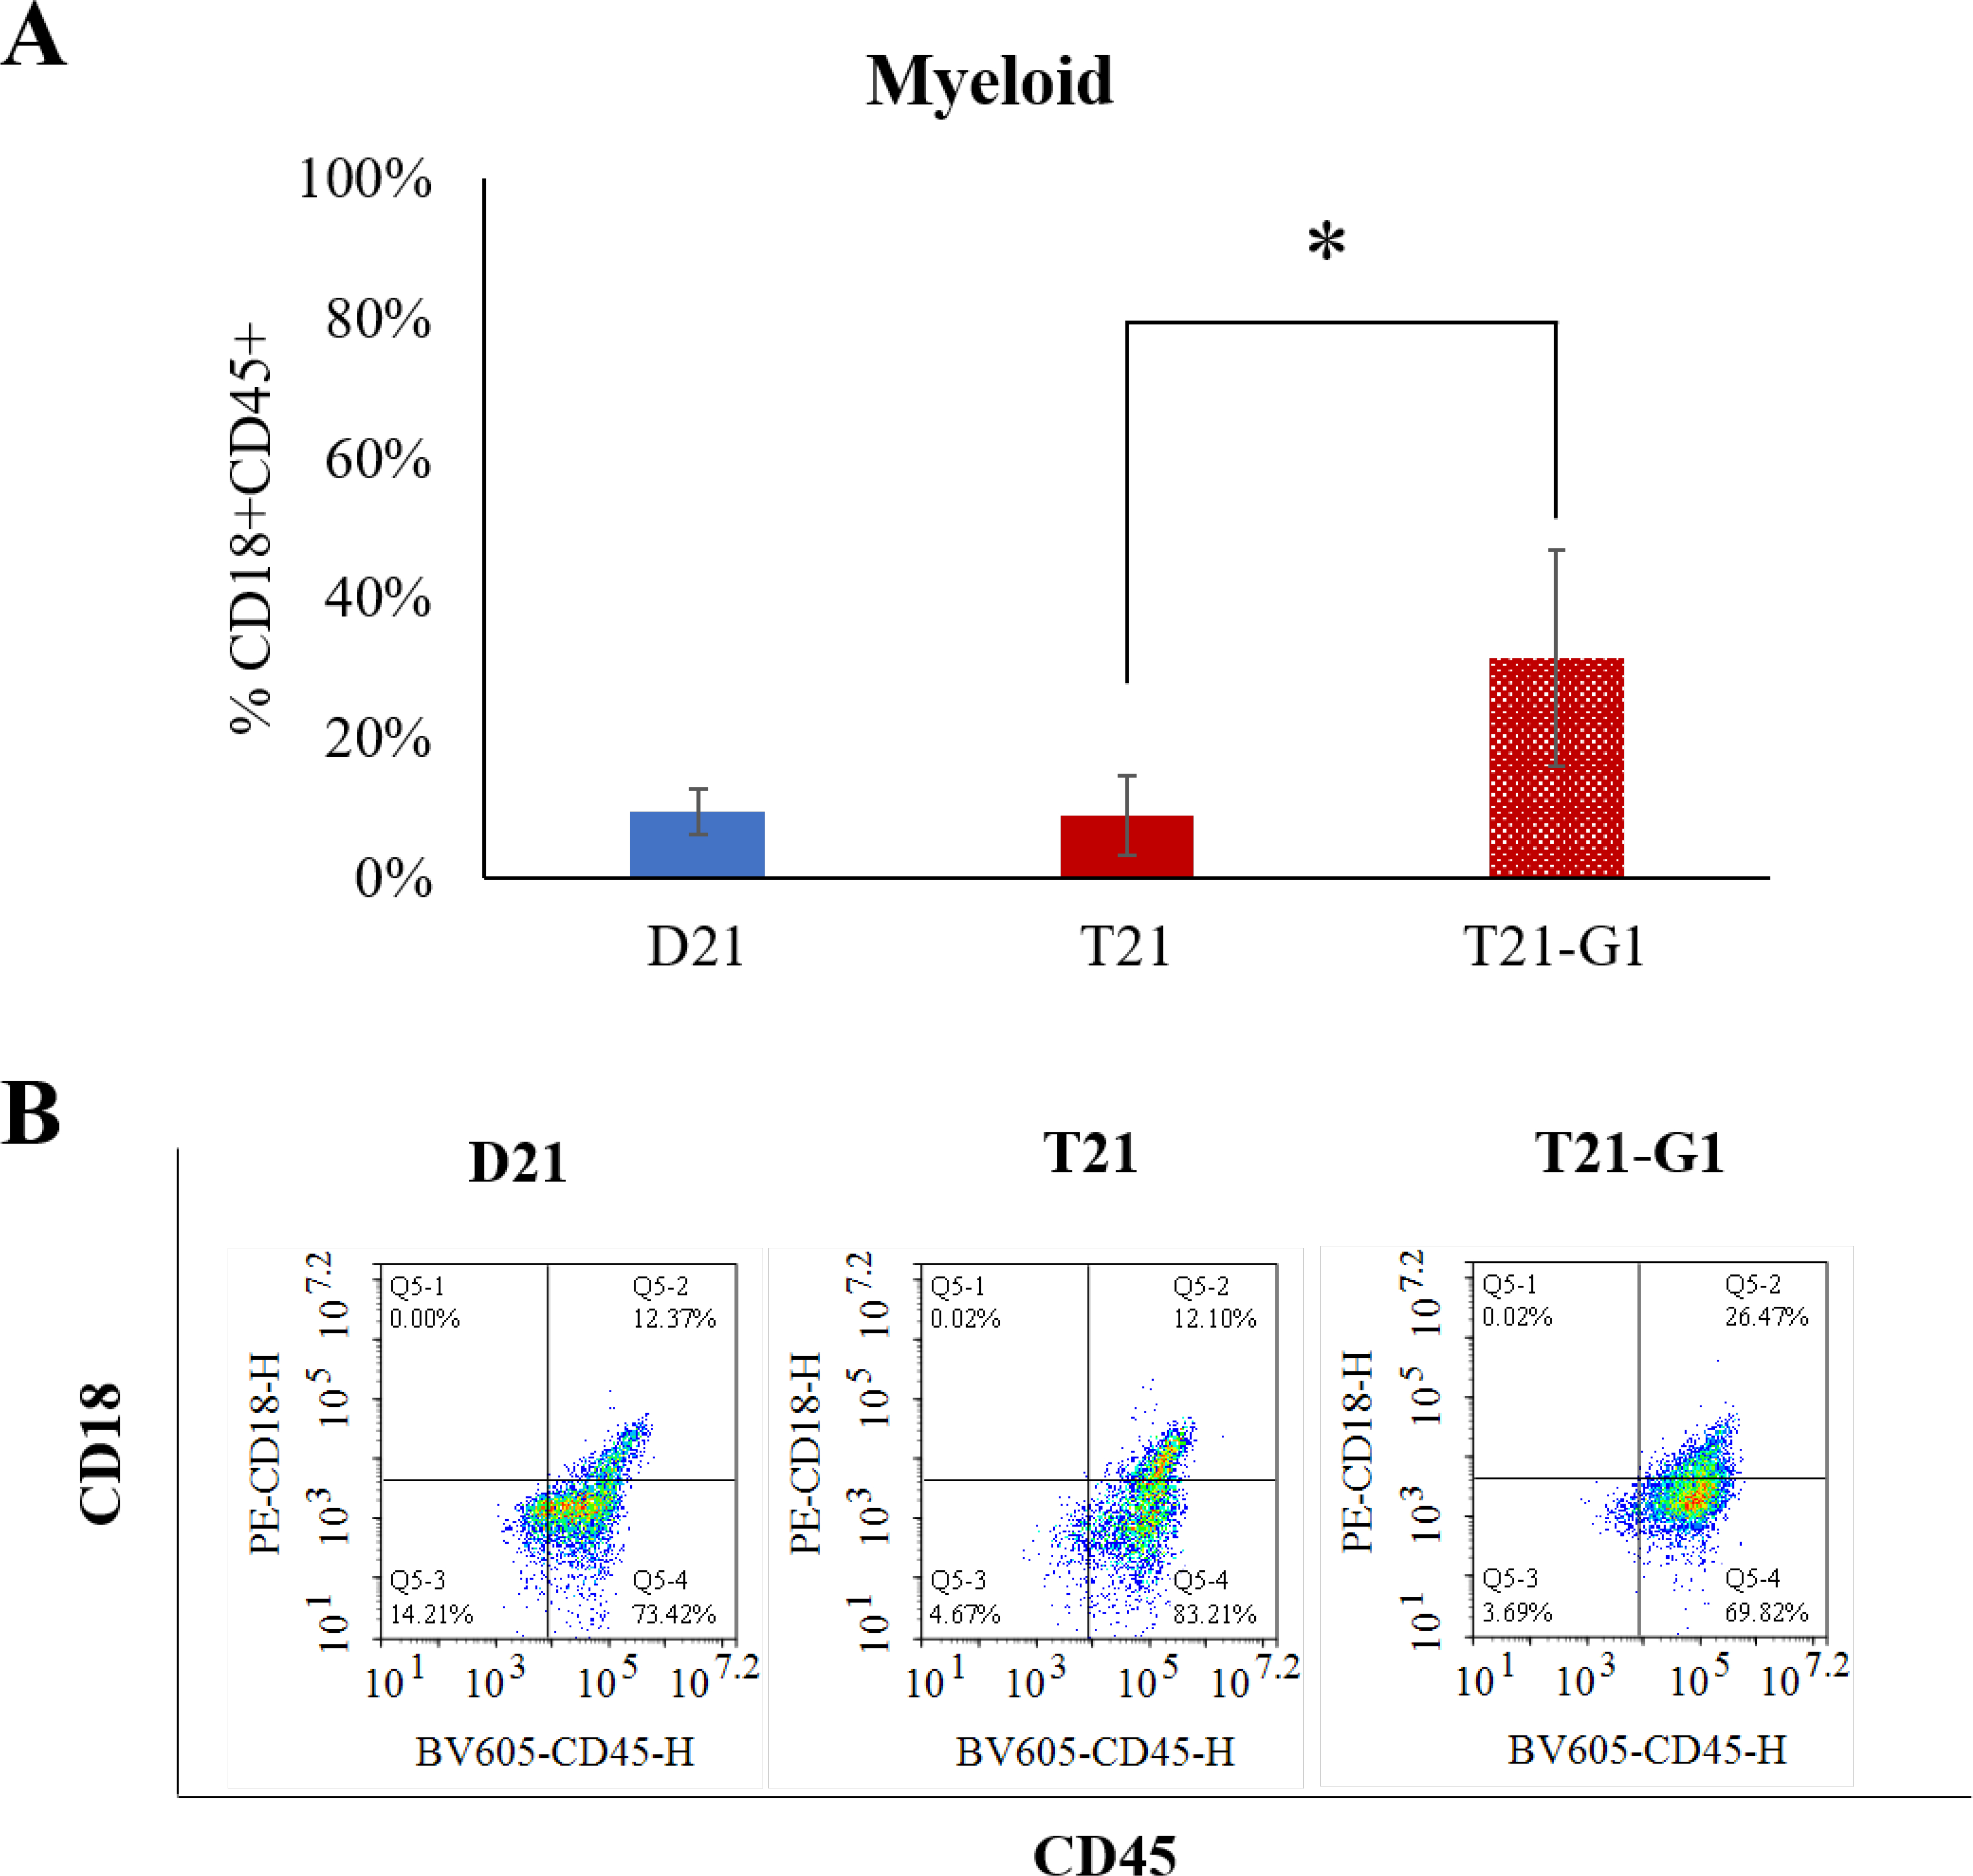
A) Graphs show the percentage of myeloid population (CD18+CD45+) in day 12 HSPCs generated from isogenic disomic (D21) and trisomic (T21) iPSC lines with wild-type GATA1 or trisomic iPSC line with GATA1 mutation (T21-G1). Average data from 4–6 independent experiments is plotted (N=5, D21; N=4, T21; N=6, T21-G1). Error bars indicate standard deviation. *p<0.05. B) Representative flow plots showing the myeloid population in day 12 HSPCs.
Fig. 7. Effect of trisomy 21 and GATA1 mutation on megakaryoid population.
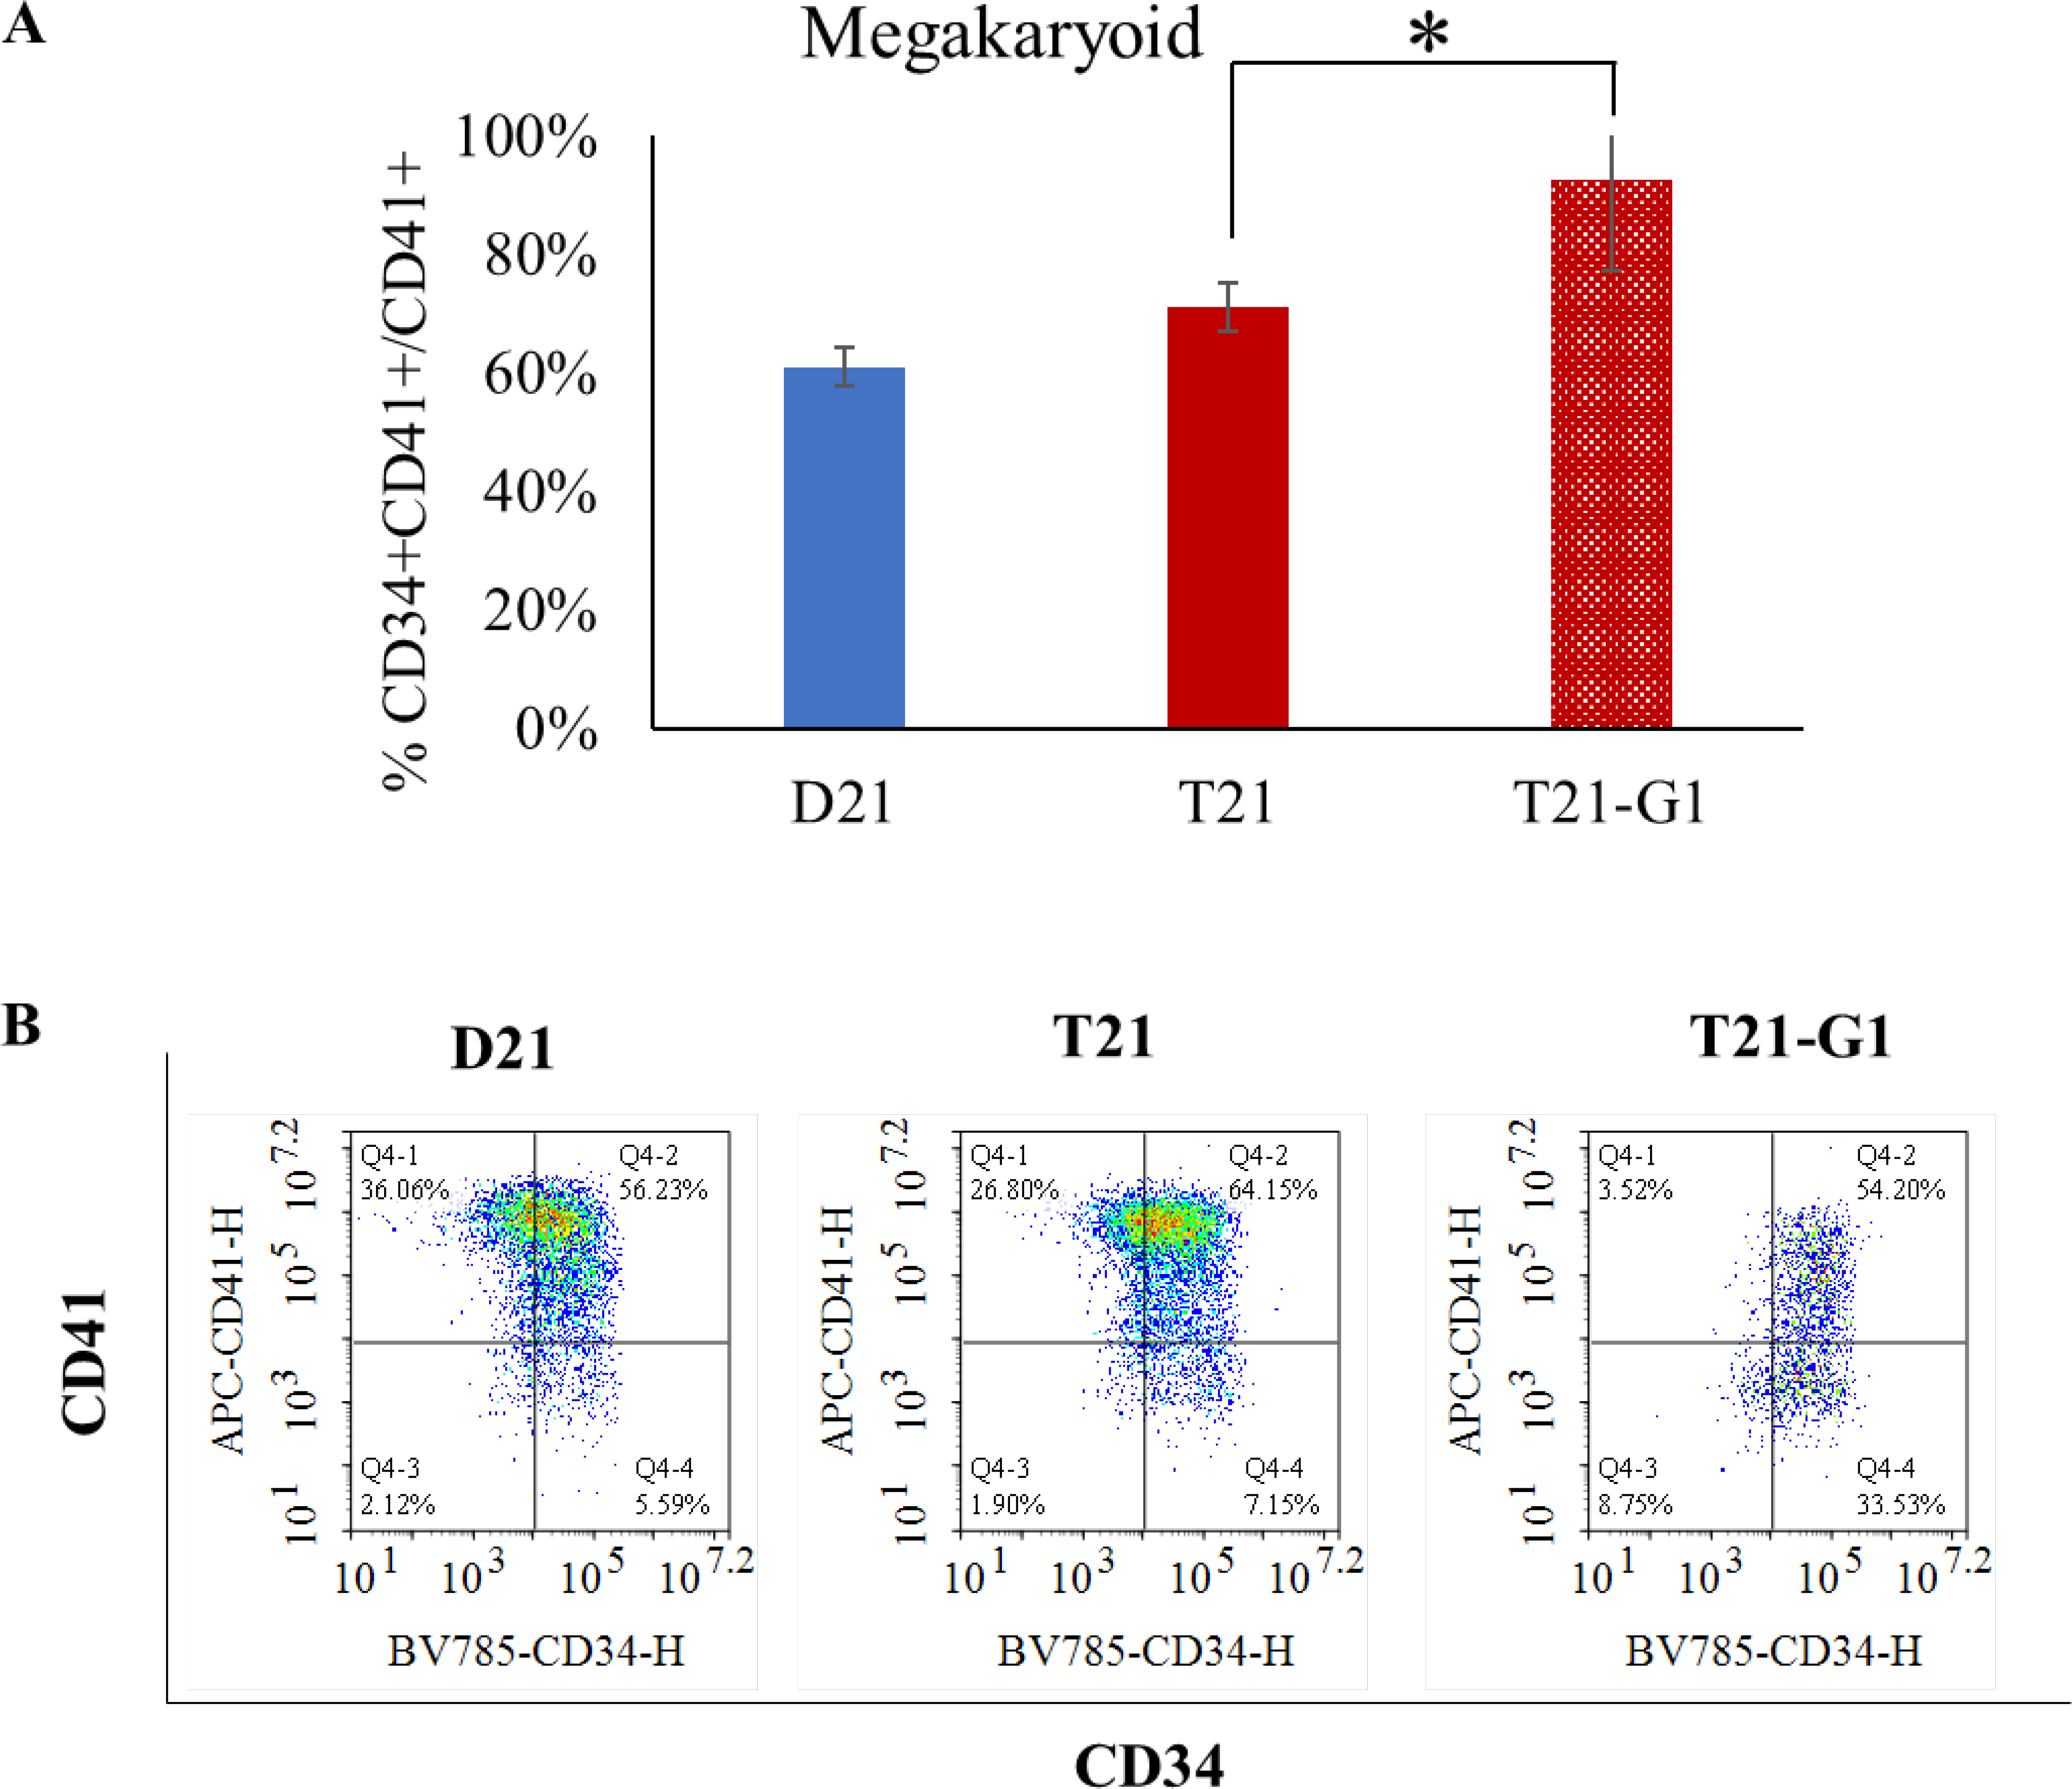
A) Graphs show the percentage of megakaryoid population (CD41+CD34+/CD41+) in day 12 HSPCs generated from isogenic disomic (D21) and trisomic (T21) iPSC lines with wild-type GATA1 or trisomic iPSC line with GATA1 mutation (T21-G1). Average data from 4–6 independent experiments is plotted (N=4, D21; N=3, T21; N=6, T21-G1). Error bars indicate standard deviation. *p<0.05. B) Representative flow plots showing the CD41+/− and CD34+/− population in day 12 HSPCs.
To test the ability of these HSPCs to form colonies, CFU assay was performed. We observed a high number of CFU-GEMM and BFU-E in trisomic as compared to disomic HSPCs in 3D, consistent with what was reported previously in 2D.69 HSPCs that originated from GATA1 mutant line produced CFU-GM colonies that lacked a central hemoglobinized zone, consistent with study reported earlier67 and seen in our prior 2D studies66 (Fig. 8A, 8B and 8C). The immunophenotype analysis of the cells collected from Methocult showed 7.6% erythroid population (CD71+CD235+) in T21-G1 as compared to 69.9% and 83.8% in GATA1 wild-type D21 and T21 respectively (Fig. 8D). On the other hand, the myeloid population (CD18+CD45+) was significantly higher in T21-G1 (59.7%) compared to 13.6% and 4.4% in wild-type D21 and T21 respectively. Taken together, these data indicate the absence of CFU-GEMM and BFU-E colonies from T21-G1 HSPCs.
Fig. 8. Colony forming unit assay of 3D generated HSPCs.
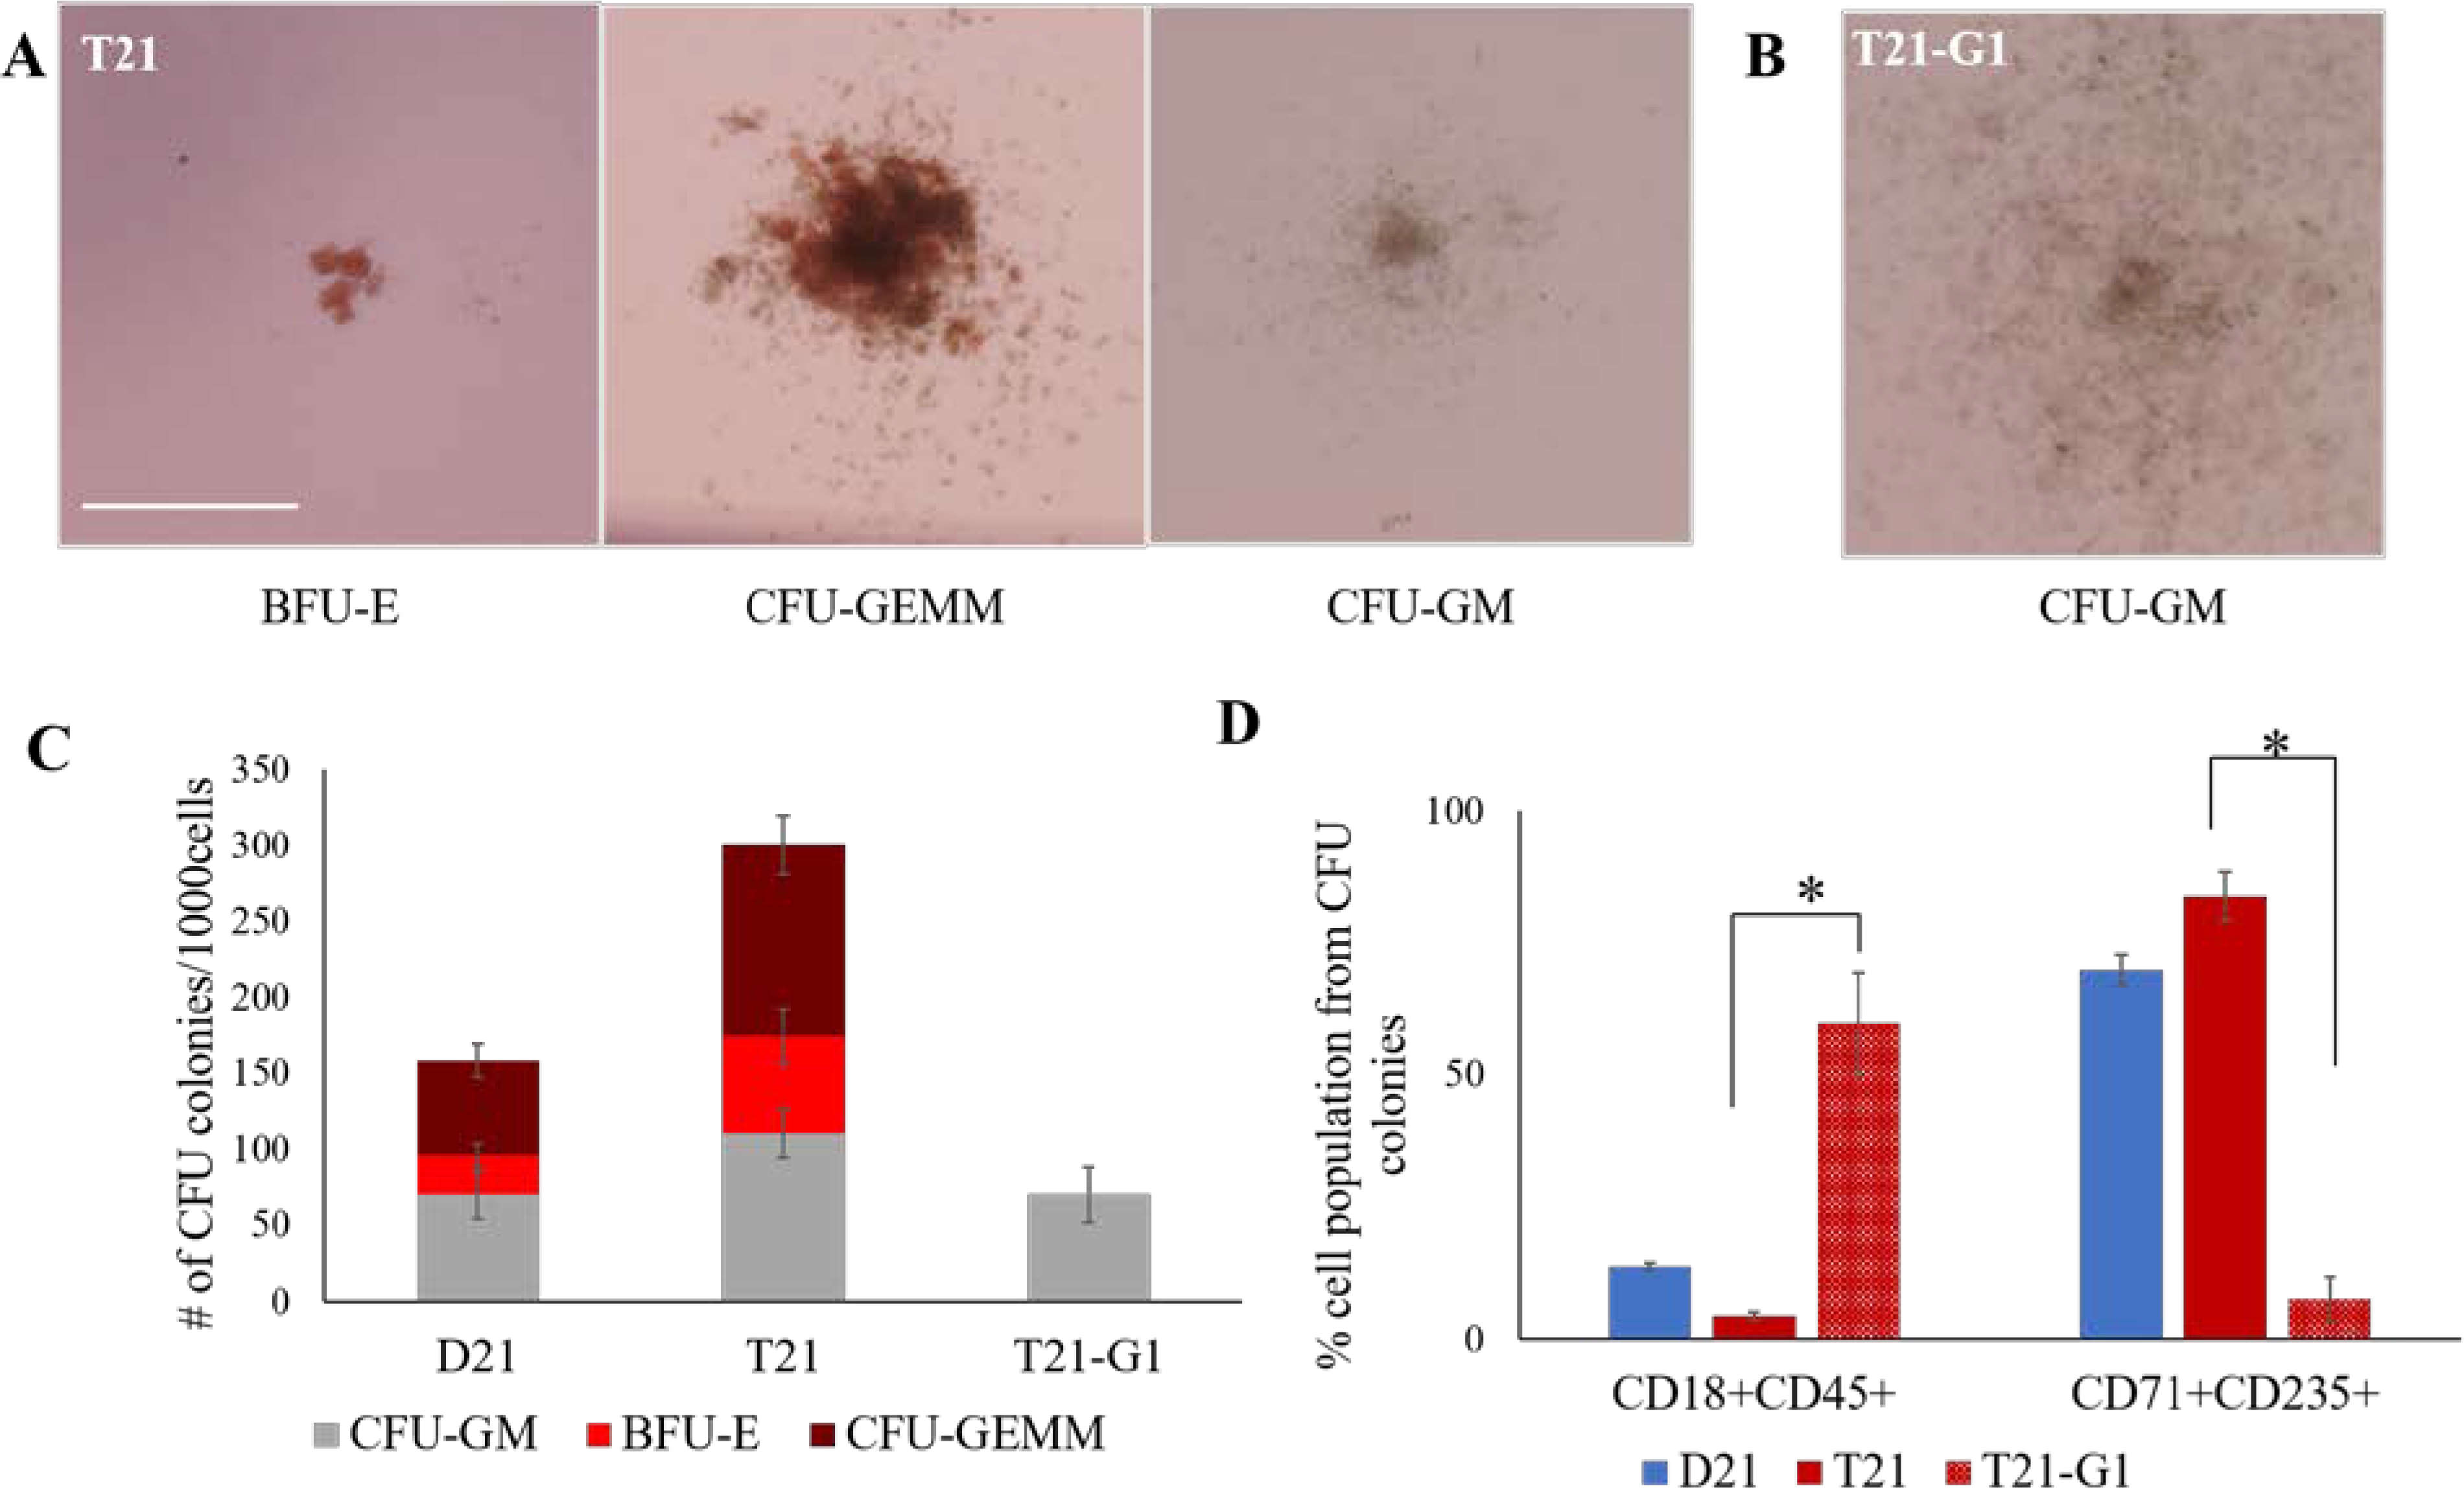
Representative images of colonies developed in methylcellulose CFU assay from wild-type (A) and GATA1 mutant (B) HSPCs. Scale bar = 500 μm. C) Graphs show the distribution of hematopoietic colonies and CFU subtypes in isogenic disomic and trisomic cell lines harboring GATA1 mutation. D) Quantification of percentage of erythroid population (CD71+CD235+) and myeloid population (CD18+CD45+) from cells isolated from Methocult. Average data from 3 independent experiments is plotted. Error bars indicate standard deviation. *p<0.05.
The effect of GATA1 mutation on specific lineages was further elucidated by culturing the day 10 HSPCs in erythroid-, megakaryocytic- and myeloid-specific expansion media. The GATA1 mutation affected heme synthesis as indicated by the absence of red cell pellet in erythroid expansion of HSPCs (Fig. 9A). It is consistent with previous studies showing the role of GATA1 in the regulation of heme biosynthesis.70 Phenotypically, majority of cells were CD71+CD235- in the GATA1 mutant line whereas the wild-type population differentiated further to CD71+CD235+ phenotype, indicating the developmental abnormality in T21-G1 (Fig. 9B and 9C).
Fig. 9. Effect of trisomy 21 and GATA1 mutation on erythroid lineage population.
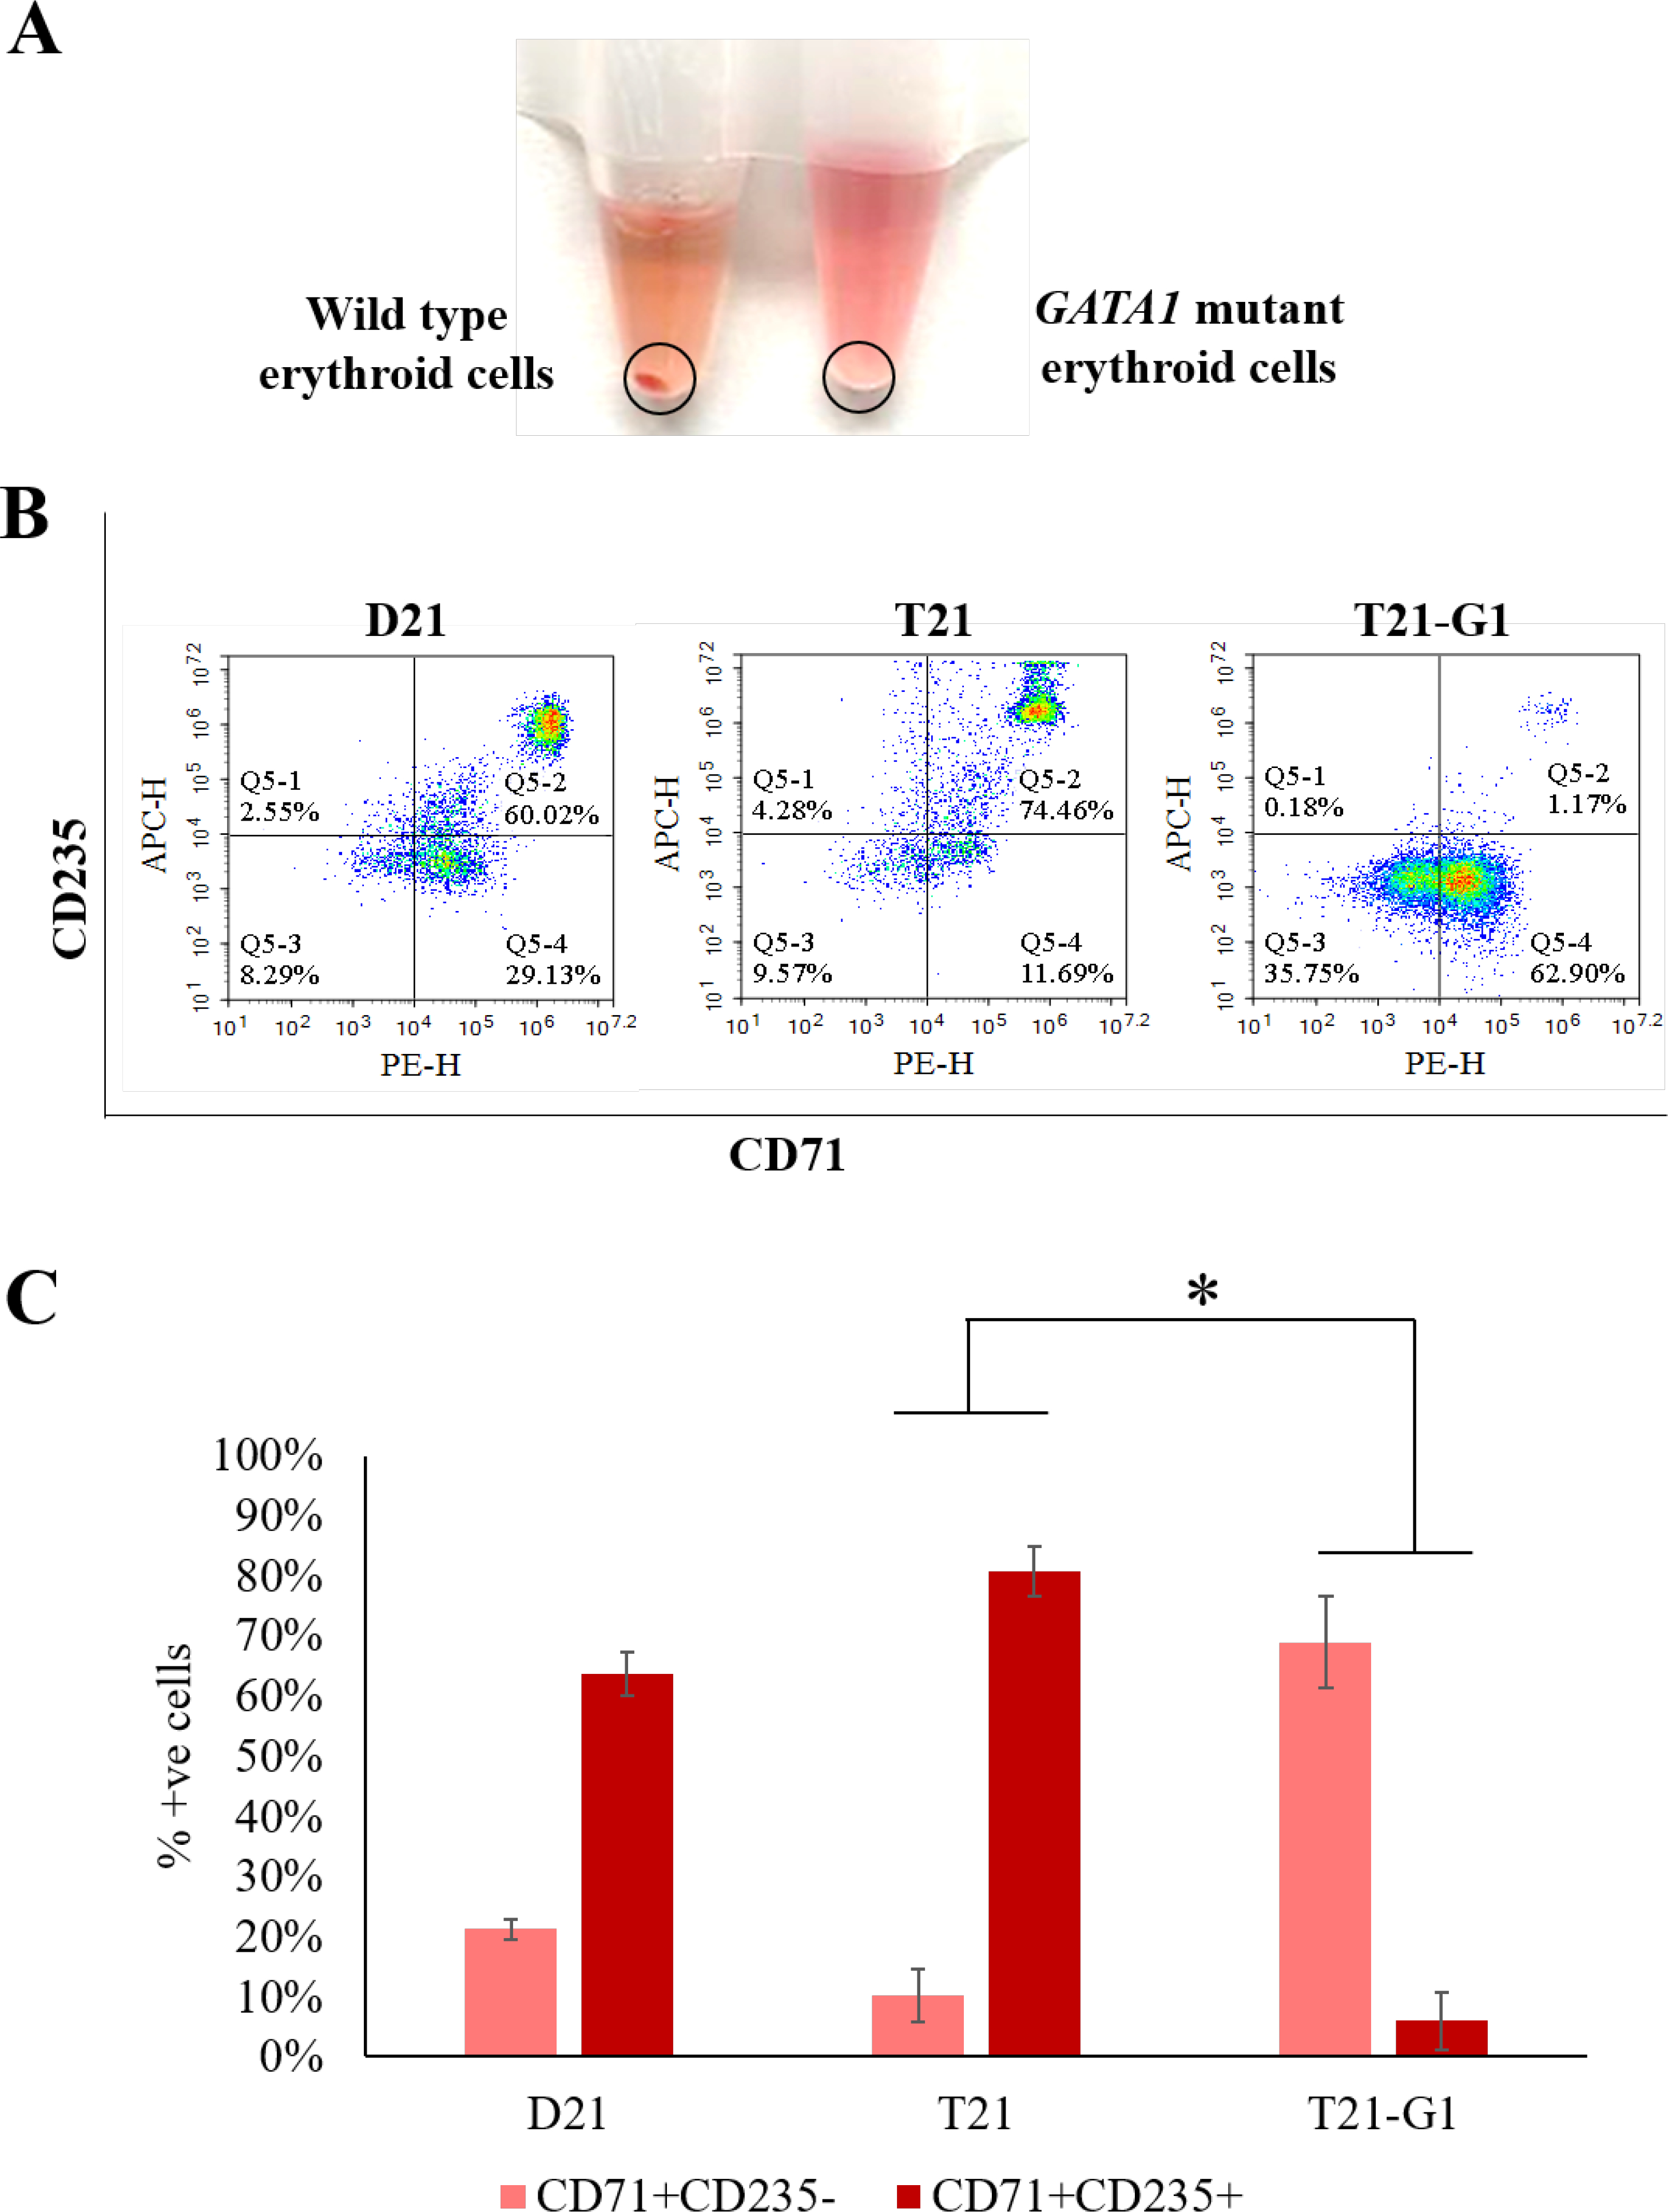
A) Representative image showing the absence of red cell pellet in GATA1 mutant compared to wild-type in erythroid specific expanded cells. B) Representative flow plots showing the erythroid population. C) Flow analysis of erythroid lineage makers (CD71, CD235) following lineage specific expansion for 7 days. Average data from 3–5 independent experiments is plotted (N=3, D21; N=5, T21; N=4, T21-G1).. Error bars indicate standard deviation. *p<0.05.
The expansion of day 10 HSPCs in myeloid specific media resulted in higher proliferation (1.9±0.2 times) in GATA1 mutant line (Fig. S5C). The flow cytometry analysis showed higher percentage of cells expressing the monocytic markers (CD16+, CD18+, CD33+)71 in GATA1 mutant HSPCs compared to wild-type HSPCs (Fig. 10).
Fig. 10. Effect of trisomy 21 and GATA1 mutation on myeloid lineage population.
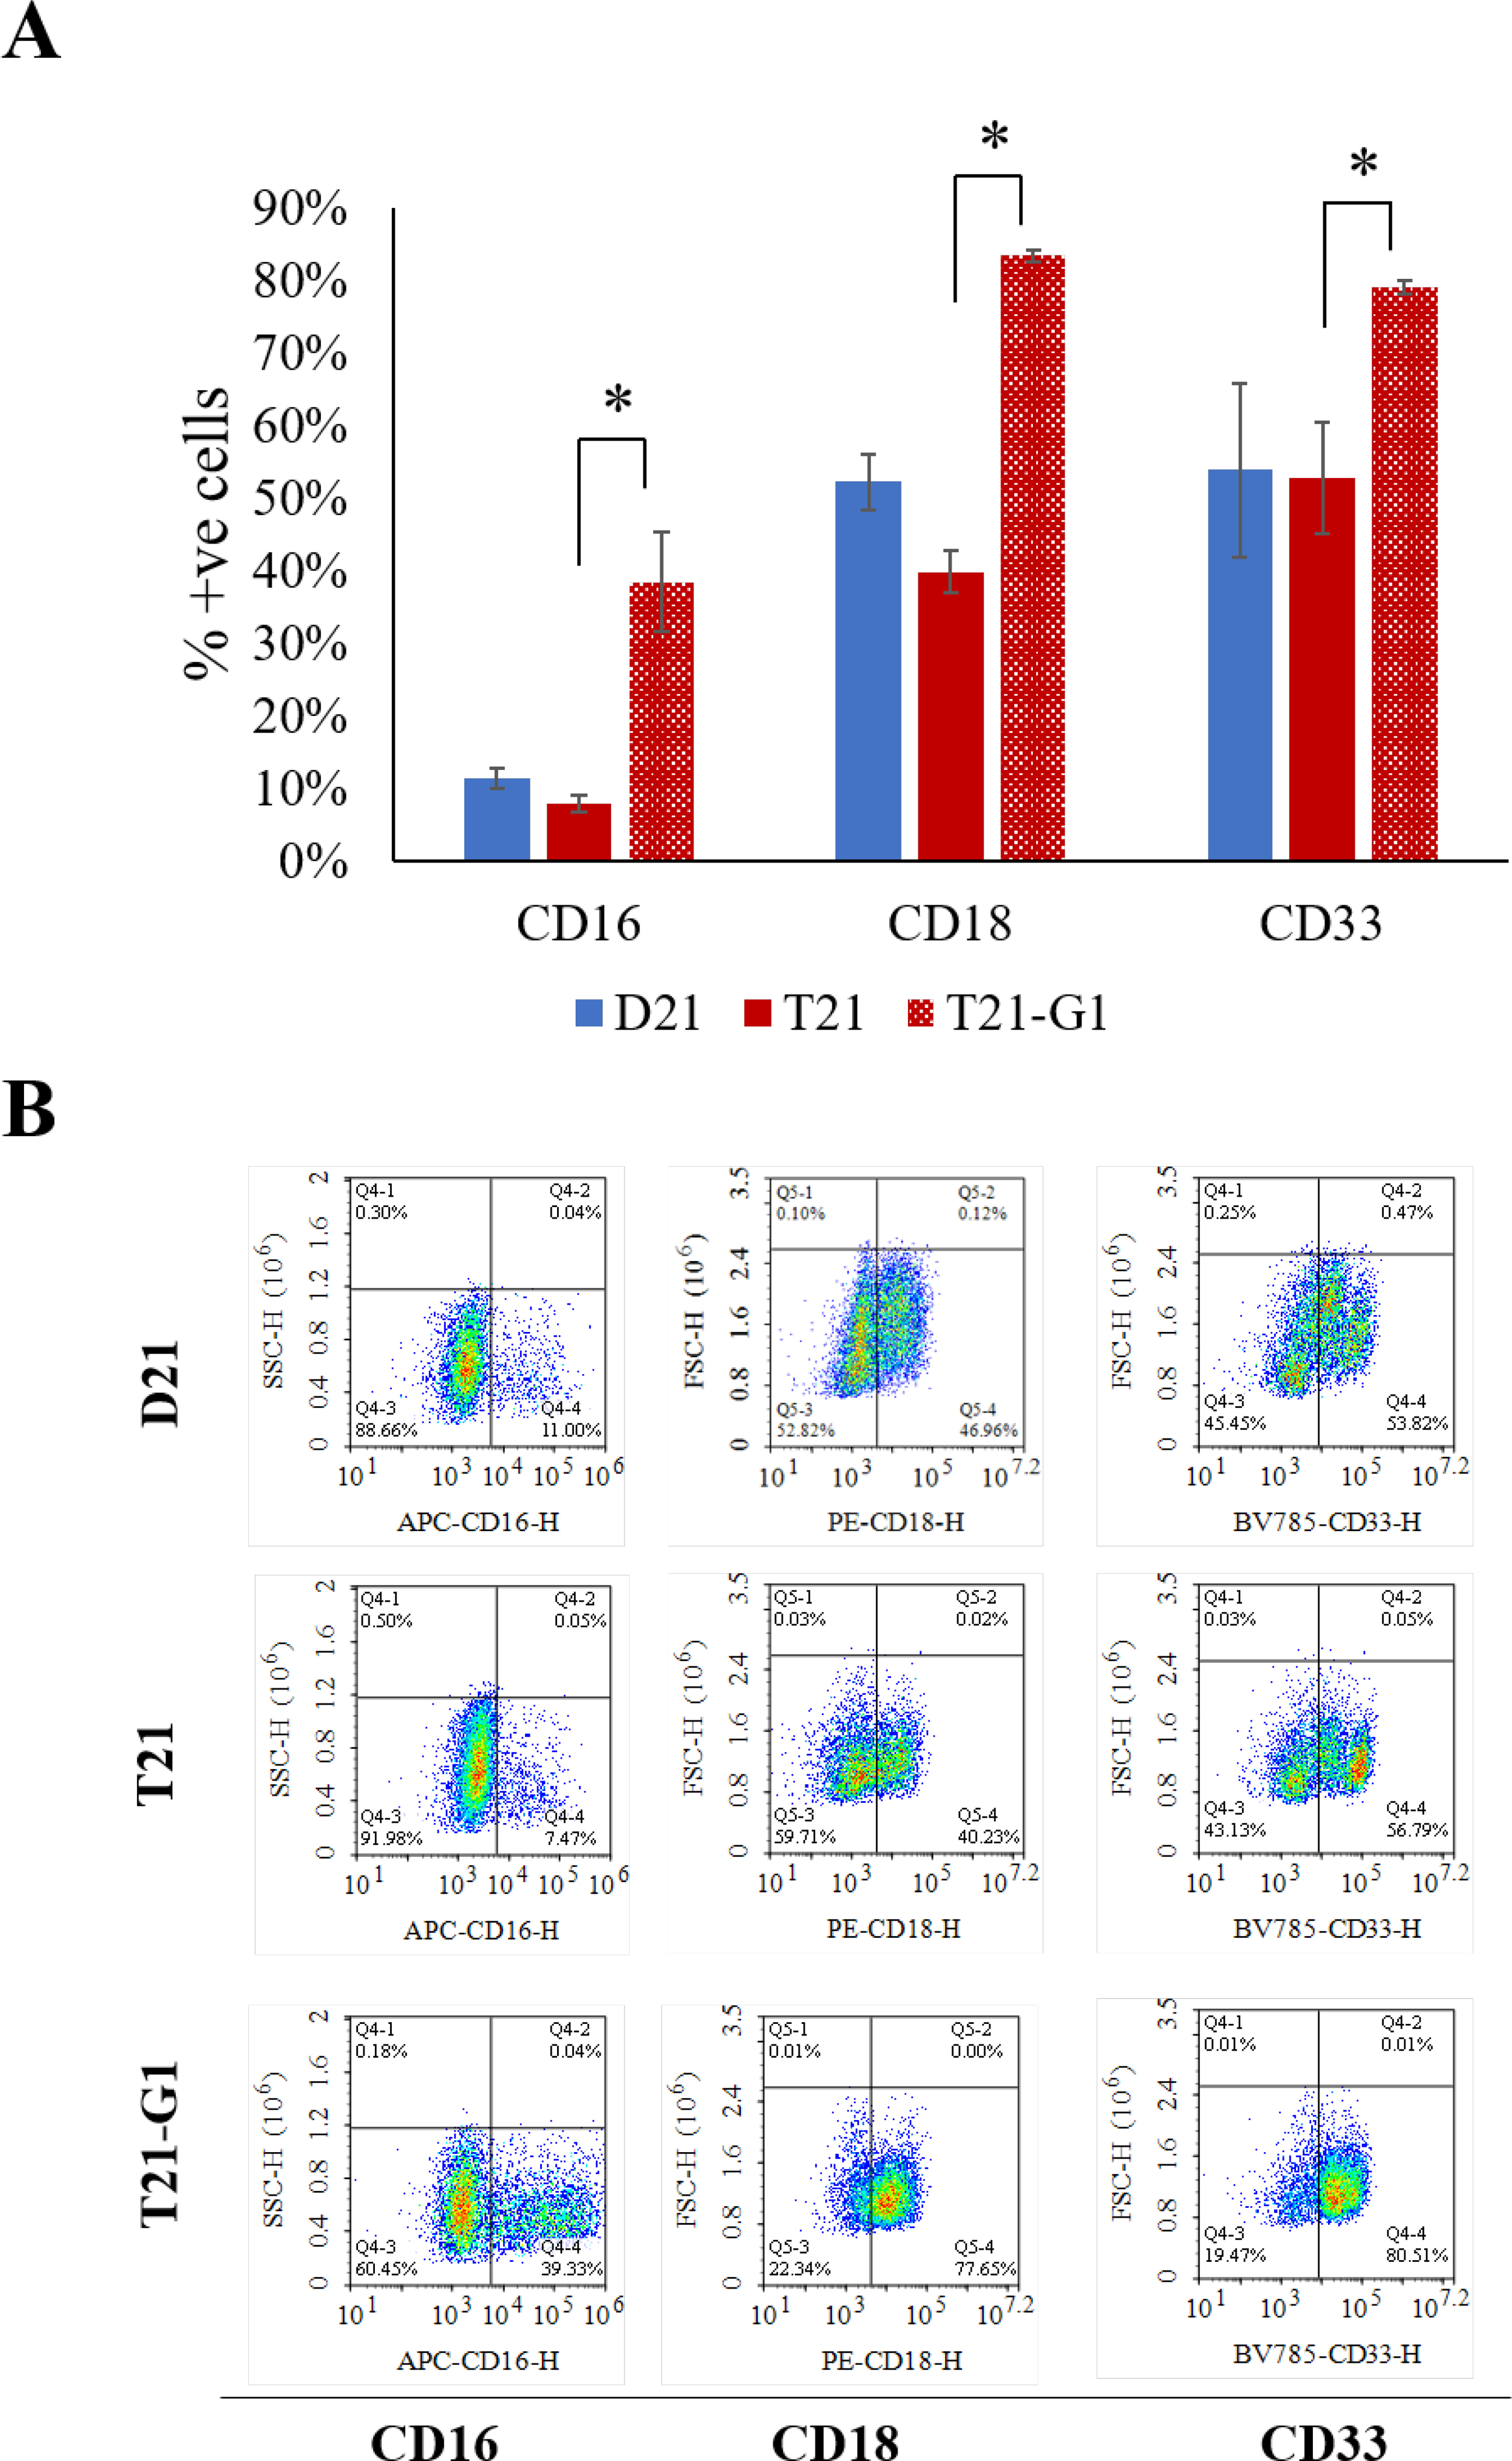
A) Flow analysis of myeloid lineage makers following lineage specific expansion for 7 days. Average data from 3–4 independent experiments is plotted (N=3, D21; N=3, T21; N=4, T21-G1). Error bars indicate standard deviation. *p<0.05. B) Representative flow plots showing the myeloid makers (CD16, CD18 and CD33).
Expansion in megakaryocytic specific media, revealed a low percentage of cells expressing megakaryocytic markers of differentiation (CD41, CD42b and CD61) in T21-G1 compared to wild-type lines (Fig. 11A) indicative of aberrant differentiation of megakaryocytes. The ploidy analysis showed the percentage of cells with 2n ploidy were 3.4-fold higher in mutant line compared to its wild-type counterpart (Fig. 11B–C). Because it has been shown that the circulating blasts from TMD patients are predominantly 2n population72, 73, our data signified that T21-G1 hematopoietic differentiation generated TMD-like cell population.
Fig. 11. Effect of trisomy 21 and GATA1 mutation on megakaryoid lineage population.
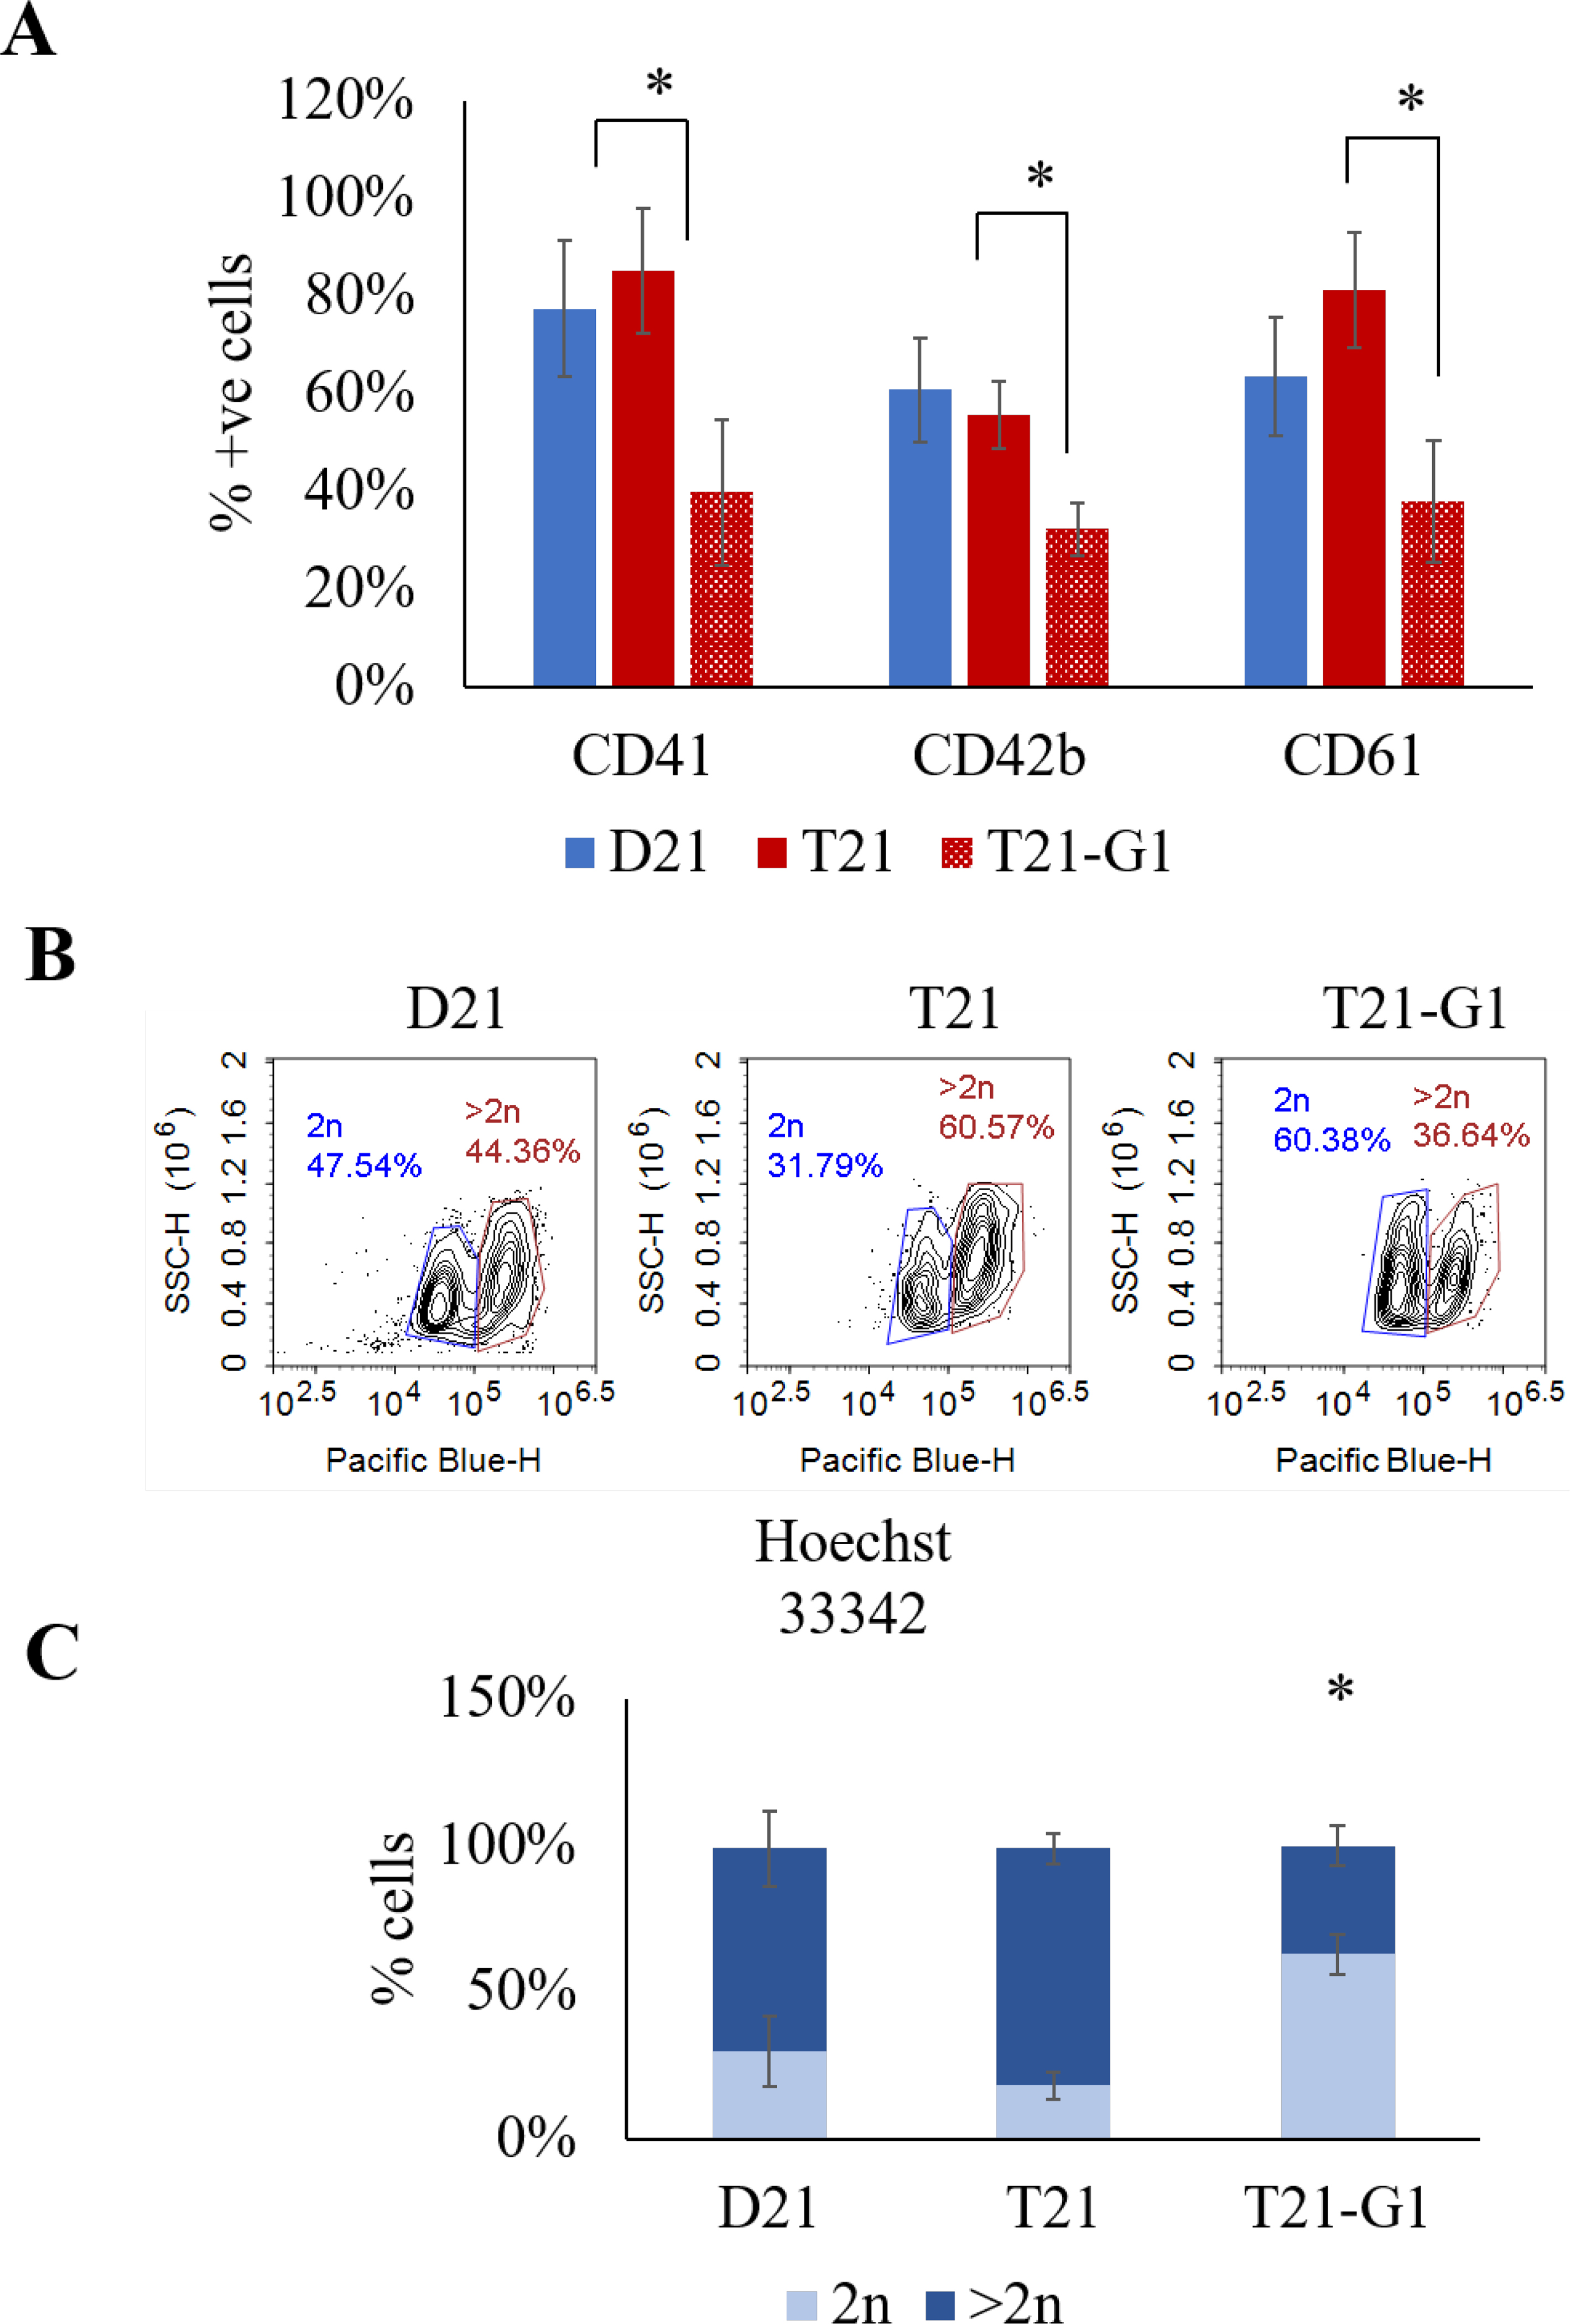
A) Flow analysis of megakaryoid lineage makers (CD41, CD42b, CD61) following lineage specific expansion for 7 days. B) Representative flow plots showing the ploidy of megakaryoid population. C) Quantification of ploidy of the megakaryoid population. Average data from 3–4 independent experiments is plotted (N=4, D21; N=3, T21; N=4, T21-G1). Error bars indicate standard deviation. *p<0.05.
GATA1 and GATA2 are considered important regulators of hematopoiesis.74, 75 GATA1 expression is low during early hematopoiesis where the chromatin sites are mainly occupied by GATA2. However during later differentiation, GATA1 displaces GATA2 and plays a critical role in the development of erythroid, myeloid and megakaryocytic cells.76 In the 3D model, GATA1 protein was not expressed in iPSC lysates and intermediate differentiating stages (Fig. S6). The expression of GATA1 (full length and short form) was detected in day 10 HSPCs. These data confirm that the GATA1 protein is not required during early development and expression is only turned on in later stages of hematopoietic differentiation. The GATA1 levels were also determined in megakaryocytic population. The megakaryocytic population derived from disomic and trisomic iPSCs with wild-type GATA1 showed expression of full-length GATA1 protein and a small amount of GATA1s. GATA1 mutant (T21-G1) lacked the expression of full-length GATA1 and enhanced GATA1s expression (Fig. 12). The expression of GATA1 observed in megakaryocytic lineage cells with absence of full-length GATA1 in T21-G1 reflects the aberration observed in the megakaryocytic differentiation because of the mutant protein. Thus, our model accurately recapitulates the TMD situation.
Fig. 12. GATA1 protein expression in megakaryocytic lysate.
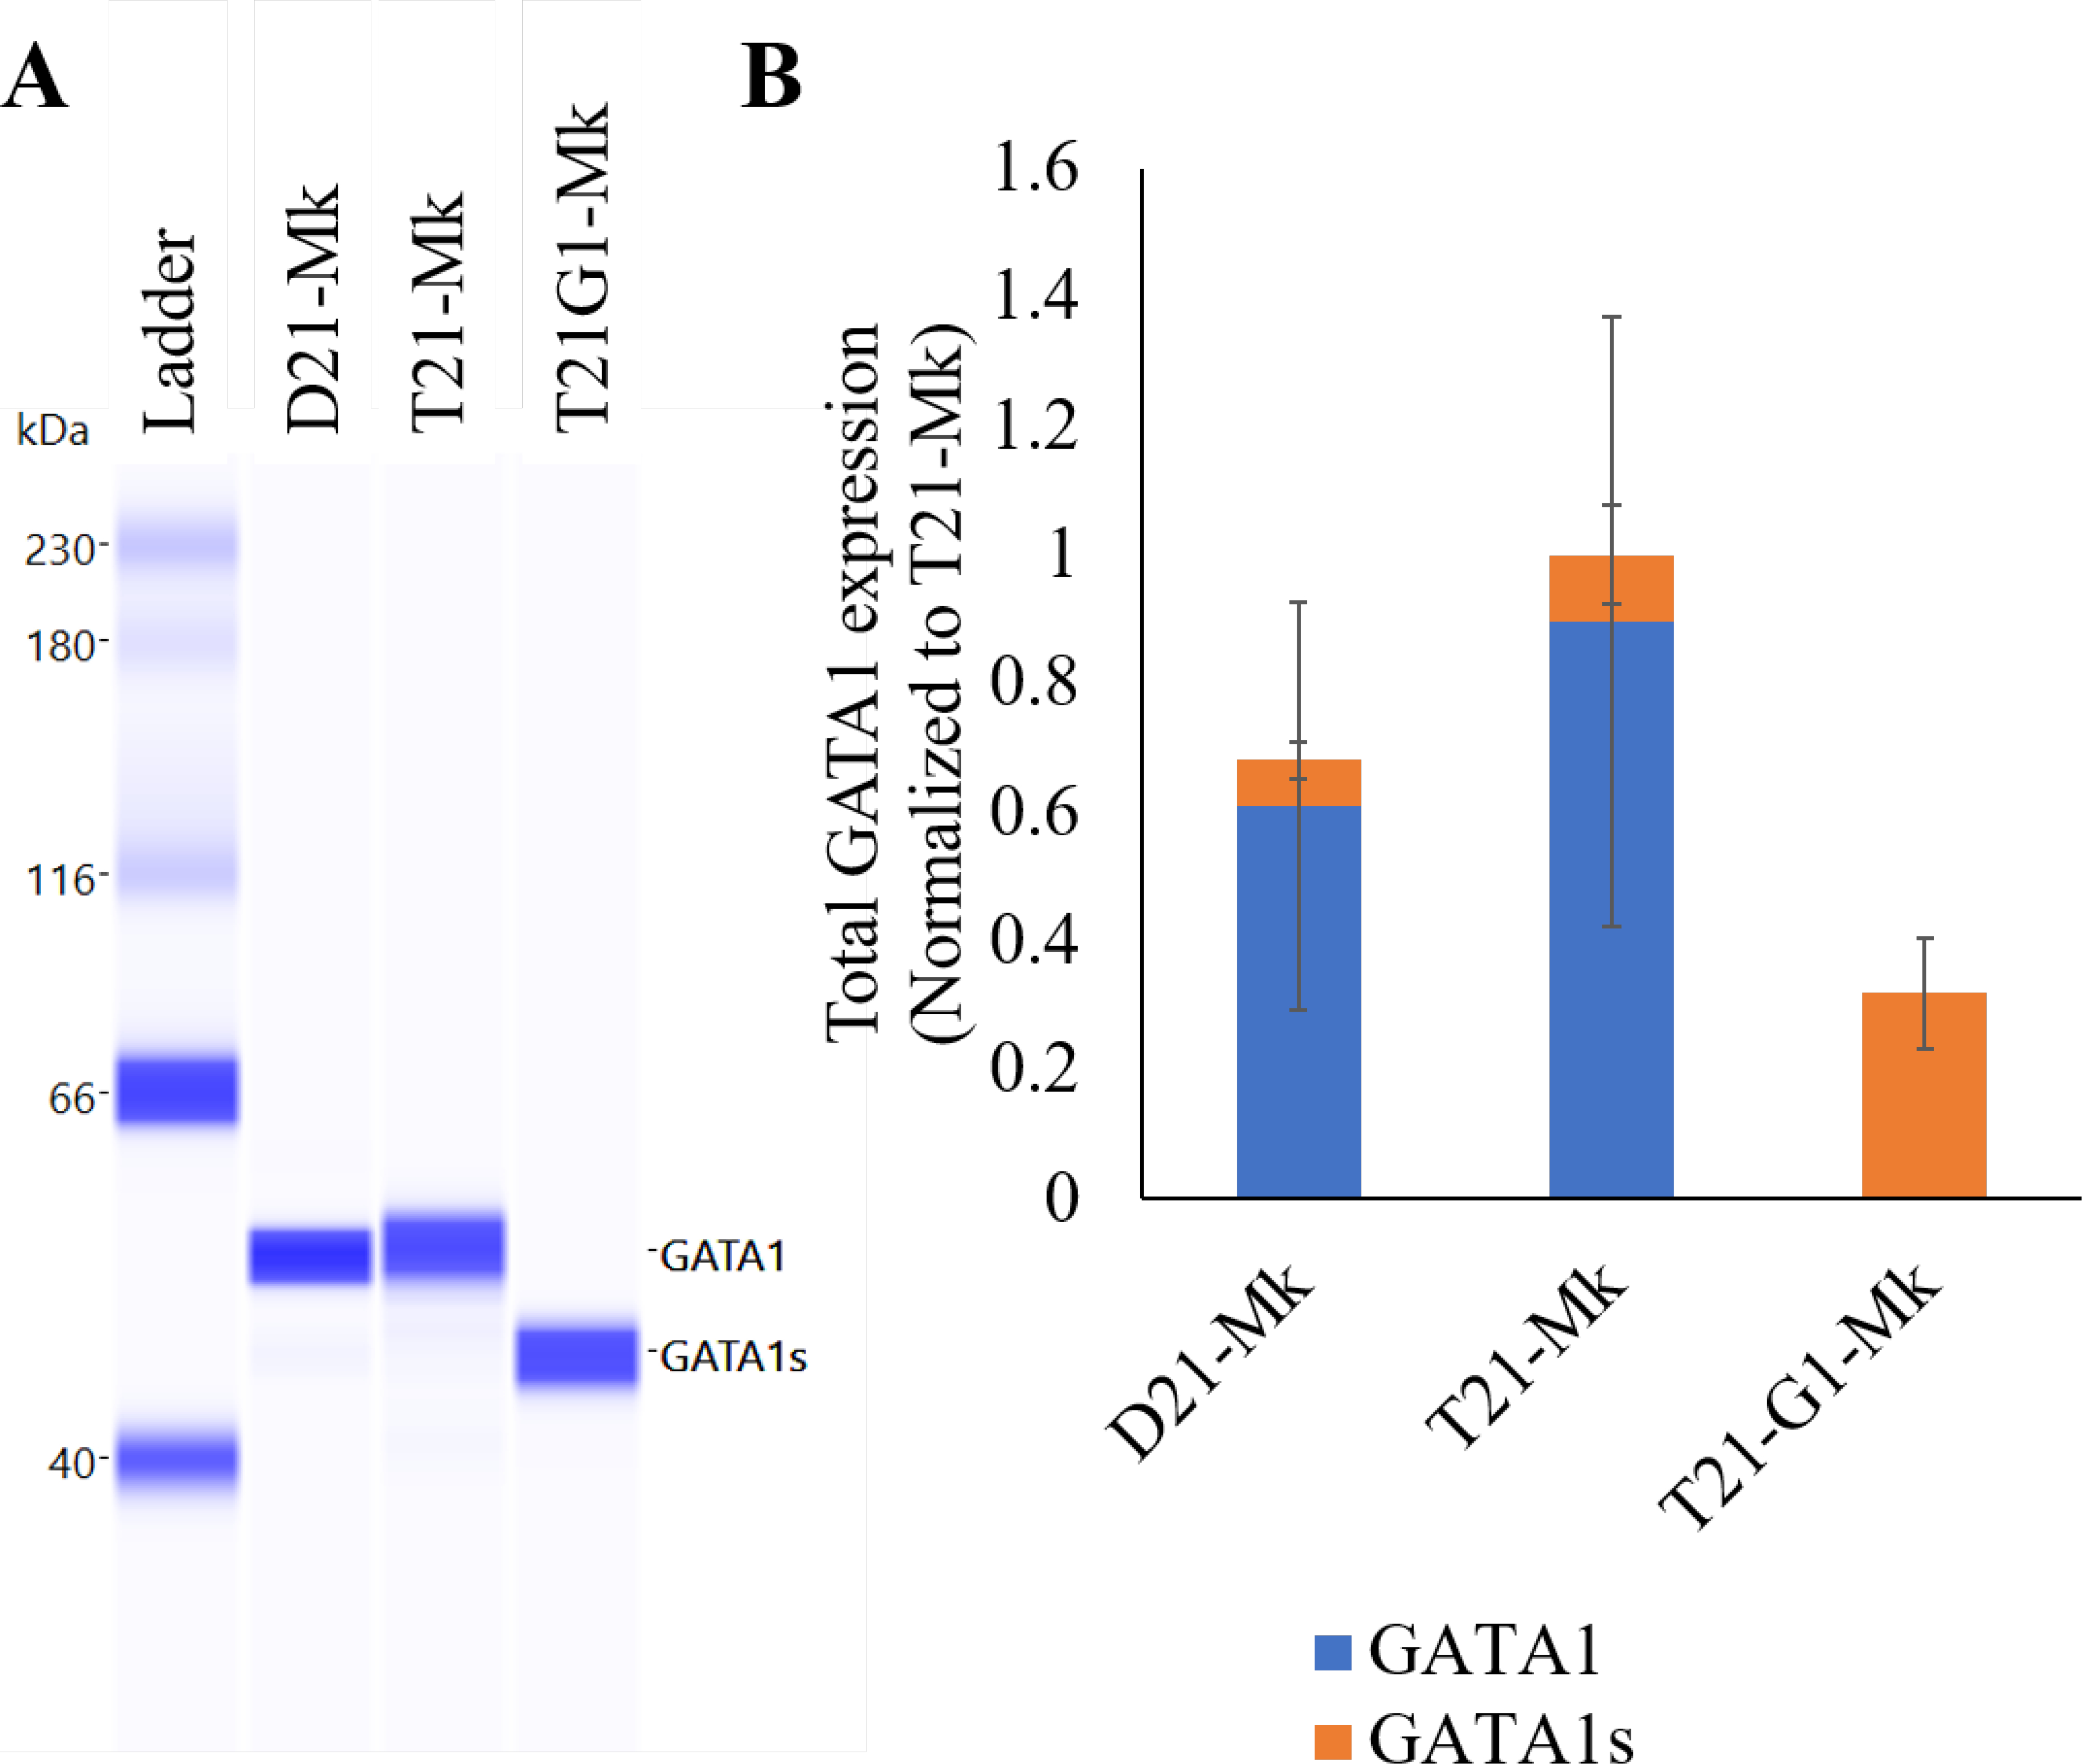
A) Immunoblots using the automated Western blotting system Wes in band view to show the difference in the mobility of GATA1 (upper band) and GATA1s (lower band). B) Quantitation of GATA1 and GATA1s protein in indicated megakaryoid cells using Wes. Average data from 3 independent experiments is plotted.
DS children are prone to develop TMD by acquisition of GATA1 mutation.2, 3 In isolated cases without DS characteristics, extra chromosome 21 was observed in the TMD blasts77, emphasizing that trisomy 21 and GATA1 mutation are essential for the development of TMD. Although TMD is resolved in majority of DS children, 30% of cases develop myeloid neoplasm.6 Currently there is no targeted therapy for this leukemia subtype and chemotherapy is the standard-of-care. Extensive genomic analyses of DS-ML patients revealed a stepwise acquisition of trisomy 21, GATA1 and additional co-operating somatic mutations.78 The long-term goal of this study is to sequentially introduce these somatic mutations in iPSCs and study the co-operative effect on megakaryoid and myeloid lineage differentiation in trisomy21 and GATA1 mutant background. Hence, in vitro modeling of TMD and DS-ML closely mimicking the in vivo scenario will help understand the initiation and progression of this disease.
Materials and methods
Solid-phase peptide synthesis
The integrin-binding peptide, GRGDSPC (RGD) and the matrix metalloproteinase (MMP) cleavable peptide, GGPQGIWGQGKG (PQ) were synthesized using solid-phase synthesis (CEM Liberty Blue, Matthews, NC) with standard Fmoc chemistry.79 RGD was cleaved from the resin in a TFA cleavage cocktail (95% TFA, 2.5% TIPS, and 1.25% EDT and 1.25% H2O), and precipitated in cold diethyl ether. To create the bis-acrylamide, end-functionalized MMP cleavable peptide (PQ-2-Am), acrylamide groups were conjugated onto primary amine groups via acrylic acid in Dimethylformamide (DMF) with 1-[bis(dimethylamino)methylene]-1H-1,2,3-triazolo[4,5-b]pyridinium 3-oxid hexafluorophosphate, N-[(Dimethylamino)-1H-1,2,3-triazolo-[4,5-b]pyridin-1-ylmethylene]-N-methylmethanaminium hexafluorophosphate N-oxide (HATU) and N,N-diisopropylethylamine (DIEA). The PQ-2-Am peptide was cleaved from the resin in a trifluoroacetic acid (TFA)-based cleavage cocktail (95% TFA, 2.5% triisopropyl silane (TIPS), and 2.5% H2O), and precipitated in cold diethyl ether. The peptides were purified by reverse-phase high-performance liquid chromatography (Waters, Milford, MA). Water with 0.1% TFA (solvent A) and acetonitrile with 0.1% TFA (solvent B) were employed as HPLC solvents. The molecular weight of the desired product was confirmed by electrospray ionization mass spectroscopy (ESI-MS) using ACQUITY UPLC H-Class/SQD2 (Milford, MA); the observed molecular mass of ~ 690 for RGD and ~1249 and the average number of acrylamide groups per PQ-2-Am peptide was determined to be ∼1.8, via 1H NMR using an AVIII 600 MHz NMR spectrometer (Bruker, Billerica, MA) (Fig. S7). Peptides were stored as lyophilized powders at −20 °C until use.
Synthesis and rheological characterization of hydrogels
4-arm PEG acrylate (PEG4Ac, 20 kDa) and 4-arm PEG thiol (PEG4SH, 20 kDa) was purchased from JenKem Technology (Plano, TX). Monomer stocks were prepared by dissolving PEG4Ac, PEG4SH, RGD and PQ peptides in DMEM/F12. Stock solutions were sterile filtered with a 0.22 μm centrifugal filter (Millipore Sigma, Burlington, MA), aliquoted and stored at −80 °C until use.
Hydrogel precursor solutions were prepared by first conjugating the RGD peptide at a final concentration of 2 mM to PEG4Ac. The pH was adjusted to 7.7 using 0.1 M NaOH for conjugation. PEG4SH and PQ peptide (2 mM) were added to the PEG4Ac-RGD solution. To avoid stoichiometry defects, the acrylate to thiol ratio was maintained at 1:1 (Table 1). In situ rheological measurements were conducted on an AR-G2 rheometer (TA Instruments, New Castle, DE) with an 8-mm diameter stainless steel parallel plate geometry. 10 μL of hydrogel precursor solution was deposited onto the plate. The geometry gap was set at 200 μm and mineral oil was used to seal the gap and avoid dehydration. The gels were cured at 37 °C for 30 minutes. The gelation of hydrogels was monitored using time sweep measurements within the linear viscoelastic regime at 1% strain and an angular frequency of 1 Hz. In addition to the in-situ measurements, the modulus of pre-hydrated hydrogels was also measured. 20 μL of hydrogel precursor solution was placed in a silicone mold (5 mm diameter and 1 mm height) and incubated at 37 °C for 30 minutes for gelation. The hydrogels were then swollen in DMEM/F12 media for 24 hours and placed on the rheometer stage for rheological measurements on the AR-G2 rheometer as described above. Rheology of various batches of PEG4Ac and PEG4SH were tested for the independent repeats.
Table 1.
Concentration of components in hydrogels
| PEG concentration (concentration of functional group) | |||
|---|---|---|---|
| 7 wt% hydrogel | 13 wt% hydrogel | 19 wt% hydrogel | |
| PEG4Ac (Ac) | 1.5 mM (6 mM) | 3 mM (12 mM) | 4.5 mM (18 mM) |
| RGD (SH) | 2 mM (2 mM) | 2 mM (2 mM) | 2 mM (2 mM) |
| PQ-2-Am (Am) | 2 mM (4 mM) | 2 mM (4 mM) | 2 mM (4 mM) |
| PEG4SH (SH) | 2 mM (8 mM) | 3.5 mM (14 mM) | 5 mM (20 mM) |
| Cross-linkable Ac+Am | 8 mM | 14 mM | 20 mM |
Cell culture
Isogenic disomic (D21) and trisomic (T21) human iPSCs were received from RUCDR Infinite Biologics at the Rutgers University, a part of the NIH Center for Regenerative Medicine. CRISPR/Cas9 mutagenesis was utilized to generate trisomic clone expressing short form of GATA1 (GATA1s) (referred as T21-G1) as described previously.66 iPSCs were cultured in mTeSR™1 media (StemCell Technologies, Inc., Ontario, CA) on Matrigel™ hESC-qualified matrix (Corning™, Corning, NY). Cells were maintained at 37 °C and 5% CO2. Cells were passaged as colonies using enzyme-free gentle cell dissociation reagent (StemCell Technologies, Inc.). All cell culture supplies were purchased from Corning Life Sciences.
Cell encapsulation in 3D hydrogels
iPSCs were encapsulated as small colonies (3–5 colonies) in 10 μL hydrogel. iPSC colonies were dissociated by exposure to cell dissociation reagent (StemCell Technologies, Inc.) for 3 min at room temperature. The colonies were carefully scraped using a cell lifter, spun down at 100g for 5 min, and resuspended in DMEM/F12. The cell suspension was gently mixed with the bulk hydrogel solution (RGD conjugated PEG4Ac, PEG4SH and PQ) prepared as previously described. The cell/gel mix was pipetted on MatTek glass bottom culture plates and incubated for 30 min at 37 °C. The hydrogels were then placed in mTeSR™1 media. Subsequently, media was replaced every 24 hr. Different batches of PEG4Ac and PEG4SH were used for independent repeats.
Morphological characterization of encapsulated iPSC colonies
Viability of iPSCs after encapsulation in hydrogels was assessed using calcein violet 450 AM and ethidium homodimer-1 (ThermoFisher Scientific, Waltham, MA). Briefly, cells were encapsulated in hydrogels, and hydrogels were washed using 1x DPBS followed by a 15-minute incubation at 37 °C, 5% CO2 with PBS containing calcein violet 450 AM (2 μM) and ethidium homodimer-1 (4 μM). After staining, hydrogels were washed with 1x DPBS before imaging with a confocal microscope (Zeiss LSM 880, 25× objective). Orthogonal projections of each z-stack were made and presented as the 2D projection image.
The phase contrast images of iPSC colonies were taken on EVOS M5000 imaging system (ThermoFisher Scientific). The colony diameter and aspect ratio were calculated using Fiji software (https://imagej.net/Fiji). The colony aspect ratio was by dividing the major axis by the minor axis of iPSC colonies. Hematopoietic differentiation
iPSC encapsulated hydrogels were cultured in mTeSR™1 for 24–48 h. The cell/gel construct were then cultured in STEMdiff™ Hematopoietic Kit (StemCell Technologies, Inc.) as per manufacturer’s instructions. Briefly, mTeSR1 media was replaced with media A on day 0 and half media change was performed on day 2. On day 3, media A was replaced with media B and subsequently, half media changes were conducted on day 5, day 7 and day 10. On day 10 or 12 of differentiation, single cells were collected by disrupting the 3D gels by pipetting. Cell clumps were removed by filtering the samples through 40-μm cell strainer. The cells were subjected to immunophenotype analysis using flow cytometry and/or a colony-forming assay. HSPCs (50,000) were suspended in lineage erythroid, megakaryocytic and myeloid lineage expansion media (Stemcell Technologies, Inc) and continued to culture in 96 well plate for 7 days at density of 1 million cells/ml. On day 7, cells were collected for flow cytometry analysis.
Flow Cytometry
Following hematopoietic differentiation, single cells produced from the adherent layer were collected and stained for hematopoietic lineage markers. Cells were washed with PBS supplemented with 1% FBS. Single cell suspensions were incubated with mouse anti-human antibodies (BioLegend, San Diego, CA) for 15 minutes at room temperature. The following antibodies were used in the study: Day 10 HSPCs (Brilliant Violet 785-CD34, Brilliant Violet 605-CD45, Pacific Blue-CD38, FITC-CD90, PE-CD49f, APC-CD45RA), Day 12 HSPCs (Brilliant Violet 785-CD34, Brilliant Violet 605-CD45, Brilliant Violet 421-CD71, FITC-CD235ab, PE-CD18, APC-CD41), Erythroid (PE-CD71, APC-CD235ab), Myeloid (APC-CD16, PE-CD18, Brilliant Violet 785-CD33), Megakaryoid (APC-CD41, FITC-CD61, Brilliant Violet 650-CD42b). The appropriate isotype IgGs (BioLegend) served as controls. For ploidy determination of megakaryocytic lineage expanded cells, cells were stained with 1:1000 Hoechst 33342 along with megakaryocytic markers (CD41, CD42b and CD61). Cells were analyzed using Novocyte 3000 flow cytometer (ACEA Biosciences, San Diego, CA) and NovoExpress software. Fluorescence compensation for the multicolor flow antibody panel was performed by using single antibody-stained cells with each antibody and the built-in auto compensation on NovoExpress software.
Colony Forming Unit (CFU) Assay
HSPCs (1000) collected from 3D hydrogels at day 10 were cultured in MethoCult™ SF H4636 (Stemcell Technologies, Inc) for 14 days as per manufacturer’s protocol. Burst forming unit-erythroid (BFU-E), colony-forming unit-granulocyte, erythroid, macrophage, megakaryocyte (CFU-GEMM) and colony-forming unit for granulocytes and macrophages (CFU-GM) were identified using EVOS M5000 imaging system (ThermoFisher Scientific). Cells collected from Methocult on day 14 were subjected to immunophenotype analysis using flow cytometry.
Western Blot
Wes (ProteinSimple, San Jose, CA) was used for automated Western blot analysis according to the manufacturer’s instructions using a 12–230 kDa separation module (ProteinSimple SM-W004), total protein detection module (ProteinSimple DM-TP01), and anti-Rabbit detection module (ProteinSimple DM-001). Total protein from iPSC, day 10 HSPCs and megakaryocytic lineage expanded cells was isolated using Minute™ Total Protein Extraction Kit (Invent Biotechnologies, Inc., Plymouth, MN SD-001/SN-002) using manufacturer’s instructions. 0.125 μg protein was loaded per capillary. GATA1 antibody was obtained from Cell Signaling Technology (Danvers, MA).
Statistical Analysis
Data are expressed as the mean ± standard error or standard deviation. Statistical analysis for cell area and aspect ratio was performed using the one-way analysis of variance (ANOVA). The Tukey-Kramer HSD test was performed after significant one-way ANOVA to test the differences between all pairs of groups (JMP Pro software). The 2-tailed Student’s t-test with unequal variance was used to determine the difference in the hematopoietic differentiation between 2D culture system and 3D PEG hydrogel, and the threshold for statistical significance was set at p < 0.05.
Conclusion
We established a simple but tunable synthetic matrix to support the growth and hematopoietic differentiation of iPSCs in 3D. The soft hydrogel mimicking the modulus of embryonic tissue provides a cost-effective animal product free alternative for production of HSPCs from iPSCs with higher yield and higher percentage of early HSPCs as compared to 2D culture system. This synthetic matrix can be further tuned to include bioinspired integrin-binding peptides derived from important ECM proteins such as laminin, collagen, and fibronectin to elucidate the effect on functionality of 3D generated HSPCs. Disease modeling in 3D using customizable iPSC is important to study the initiation and progression of hematological disorders. Such 3D models are useful for hematological diseases such as TMD, for which animal models are difficult to develop due to low engraftment and/or paucity of patient-derived specimens. Using isogenic disomic and trisomic iPSC lines along with GATA1 mutated trisomic line, we also demonstrated the potential for these materials as a platform for 3D models for TMD. This model system mimicked the salient feature of the disease and displayed reduced erythroid population accompanied by elevated megakaryoid and myeloid populations in GATA1 mutant trisomic HSPCs. Such a model could also be used for high throughput drug screening to develop novel targeted therapies.
Supplementary Material
Acknowledgments
This project was supported by grants from the Lisa Dean Moseley Foundation, Leukemia Research Foundation of Delaware, Delaware-INBRE (P20GM103446 and P20GM103446-16S1), the Cell Science Core of the Nemours Center for Pediatric Research (P30GM114736), and the Nemours Foundation.
Footnotes
Conflicts of interest
The authors have no conflict of interest to declare.
References
- 1.Sansregret L and Swanton C, Cold Spring Harb Perspect Med, 2017, 7. [DOI] [PMC free article] [PubMed] [Google Scholar]
- 2.Kolb EA and Meshinchi S, Hematology, 2015, 2015, 507–513. [DOI] [PubMed] [Google Scholar]
- 3.Wechsler J, Greene M, McDevitt MA, Anastasi J, Karp JE, Le Beau MM and Crispino JD, Nature genetics, 2002, 32, 148–152. [DOI] [PubMed] [Google Scholar]
- 4.Gruber TA and Downing JR, Blood, 2015, 126, 943–949. [DOI] [PMC free article] [PubMed] [Google Scholar]
- 5.Yamato G, Park MJ, Sotomatsu M, Kaburagi T, Maruyama K, Kobayashi T, Nishi A, Sameshima K, Ohki K and Hayashi Y, Int J Hematol, 2021, 113, 662–667. [DOI] [PubMed] [Google Scholar]
- 6.Klusmann JH, Creutzig U, Zimmermann M, Dworzak M, Jorch N, Langebrake C, Pekrun A, Macakova-Reinhardt K and Reinhardt D, Blood, 2008, 111, 2991–2998. [DOI] [PMC free article] [PubMed] [Google Scholar]
- 7.Wattanapanitch M, Stem Cells Int, 2019, 2019, 5171032. [DOI] [PMC free article] [PubMed] [Google Scholar]
- 8.Lengerke C, Grauer M, Niebuhr NI, Riedt T, Kanz L, Park I-H and Daley GQ, Annals of the New York Academy of Sciences, 2009, 1176, 219. [DOI] [PMC free article] [PubMed] [Google Scholar]
- 9.Ye Z, Zhan H, Mali P, Dowey S, Williams DM, Jang Y-Y, Dang CV, Spivak JL, Moliterno AR and Cheng L, Blood, The Journal of the American Society of Hematology, 2009, 114, 5473–5480. [DOI] [PMC free article] [PubMed] [Google Scholar]
- 10.Choi KD, Yu J, Smuga-Otto K, Salvagiotto G, Rehrauer W, Vodyanik M, Thomson J and Slukvin I, Stem cells, 2009, 27, 559–567. [DOI] [PMC free article] [PubMed] [Google Scholar]
- 11.Salvagiotto G, Burton S, Daigh CA, Rajesh D, Slukvin II and Seay NJ, PloS one, 2011, 6, e17829. [DOI] [PMC free article] [PubMed] [Google Scholar]
- 12.Marí-Buyé N and Semino CE, Methods Mol Biol, 2011, 690, 217–237. [DOI] [PubMed] [Google Scholar]
- 13.Xu Y, Shan W, Li X, Wang B, Liu S, Wang Y, Long Y, Tie R, Wang L, Cai S, Zhang H, Lin Y, Zhang M, Zheng W, Luo Y, Yu X, Yee JK, Ji J and Huang H, J Hematol Oncol, 2016, 9, 102. [DOI] [PMC free article] [PubMed] [Google Scholar]
- 14.Bertucci TB and Dai G, Stem cells international, 2018, 2018. [DOI] [PMC free article] [PubMed] [Google Scholar]
- 15.Tsou Y-H, Khoneisser J, Huang P-C and Xu X, Bioactive Materials, 2016, 1, 39–55. [DOI] [PMC free article] [PubMed] [Google Scholar]
- 16.Dixon JE, Shah DA, Rogers C, Hall S, Weston N, Parmenter CD, McNally D, Denning C and Shakesheff KM, Proceedings of the National Academy of Sciences, 2014, 111, 5580–5585. [DOI] [PMC free article] [PubMed] [Google Scholar]
- 17.Lam J, Lowry WE, Carmichael ST and Segura T, Advanced functional materials, 2014, 24, 7053–7062. [DOI] [PMC free article] [PubMed] [Google Scholar]
- 18.Ribeiro D, Andersson EM, Heath N, Persson-Kry A, Collins R, Hicks R, Dekker N and Forslöw A, PLoS One, 2017, 12, e0187665. [DOI] [PMC free article] [PubMed] [Google Scholar]
- 19.Li X, Sun Q, Li Q, Kawazoe N and Chen G, Frontiers in Chemistry, 2018, 6. [DOI] [PMC free article] [PubMed] [Google Scholar]
- 20.Hughes CS, Postovit LM and Lajoie GA, Proteomics, 2010, 10, 1886–1890. [DOI] [PubMed] [Google Scholar]
- 21.Jitraruch S, Dhawan A, Hughes RD, Filippi C, Soong D, Philippeos C, Lehec SC, Heaton ND, Longhi MS and Mitry RR, PLoS One, 2014, 9, e113609. [DOI] [PMC free article] [PubMed] [Google Scholar]
- 22.Wang N, Adams G, Buttery L, Falcone FH and Stolnik S, J Biotechnol, 2009, 144, 304–312. [DOI] [PubMed] [Google Scholar]
- 23.Hunt NC, Hallam D, Karimi A, Mellough CB, Chen J, Steel DHW and Lako M, Acta Biomater, 2017, 49, 329–343. [DOI] [PubMed] [Google Scholar]
- 24.Moxon SR, Corbett NJ, Fisher K, Potjewyd G, Domingos M and Hooper NM, Mater Sci Eng C Mater Biol Appl, 2019, 104, 109904. [DOI] [PMC free article] [PubMed] [Google Scholar]
- 25.Zhu Y, Liang Y, Zhu H, Lian C, Wang L, Wang Y, Gu H, Zhou G and Yu X, Oncotarget, 2017, 8, 42700–42711. [DOI] [PMC free article] [PubMed] [Google Scholar]
- 26.Croisier F and Jérôme C, European polymer journal, 2013, 49, 780–792. [Google Scholar]
- 27.Lee KY and Mooney DJ, Prog Polym Sci, 2012, 37, 106–126. [DOI] [PMC free article] [PubMed] [Google Scholar]
- 28.Tarunina M, Humbert C, Ali S, Choo Y, Chuang ATT and Saw D, Journal, 2020. [Google Scholar]
- 29.Li J and Mooney DJ, Nat Rev Mater, 2016, 1. [DOI] [PMC free article] [PubMed] [Google Scholar]
- 30.David A, Day J and Shikanov A, Exp Biol Med (Maywood), 2016, 241, 955–961. [DOI] [PMC free article] [PubMed] [Google Scholar]
- 31.Chen YM, Chen LH, Li MP, Li HF, Higuchi A, Kumar SS, Ling QD, Alarfaj AA, Munusamy MA, Chang Y, Benelli G, Murugan K and Umezawa A, Sci Rep, 2017, 7, 45146. [DOI] [PMC free article] [PubMed] [Google Scholar]
- 32.Caiazzo M, Tabata Y and Lutolf MP, Methods Mol Biol, 2017, 1612, 65–78. [DOI] [PubMed] [Google Scholar]
- 33.Lei Y and Schaffer DV, Proceedings of the National Academy of Sciences, 2013, 110, E5039–E5048. [DOI] [PMC free article] [PubMed] [Google Scholar]
- 34.Ovadia EM, Colby DW and Kloxin AM, Biomaterials science, 2018, 6, 1358–1370. [DOI] [PMC free article] [PubMed] [Google Scholar]
- 35.Ruoslahti E and Pierschbacher MD, Science, 1987, 238, 491–497. [DOI] [PubMed] [Google Scholar]
- 36.Fong E, Tzlil S and Tirrell DA, Proceedings of the National Academy of Sciences, 2010, 107, 19302–19307. [DOI] [PMC free article] [PubMed] [Google Scholar]
- 37.Smithmyer ME, Sawicki LA and Kloxin AM, Biomaterials science, 2014, 2, 634–650. [DOI] [PMC free article] [PubMed] [Google Scholar]
- 38.Yang F, Williams CG, Wang D.-a., Lee H, Manson PN and Elisseeff J, Biomaterials, 2005, 26, 5991–5998. [DOI] [PubMed] [Google Scholar]
- 39.Christoffersson J, Aronsson C, Jury M, Selegård R, Aili D and Mandenius CF, Biofabrication, 2018, 11, 015013. [DOI] [PubMed] [Google Scholar]
- 40.Nair DP, Podgorski M, Chatani S, Gong T, Xi W, Fenoli CR and Bowman CN, Chemistry of Materials, 2014, 26, 724–744. [Google Scholar]
- 41.Chevalier NR, Gazguez E, Dufour S and Fleury V, Methods, 2016, 94, 120–128. [DOI] [PubMed] [Google Scholar]
- 42.Chai Q, Jiao Y and Yu X, Gels, 2017, 3, 6. [DOI] [PMC free article] [PubMed] [Google Scholar]
- 43.Zhou J, Kim HY and Davidson LA, Development, 2009, 136, 677–688. [DOI] [PMC free article] [PubMed] [Google Scholar]
- 44.Rivera T, Zhao Y, Ni Y and Wang J, Curr Protoc Stem Cell Biol, 2020, 54, e117. [DOI] [PMC free article] [PubMed] [Google Scholar]
- 45.Chen G, Gulbranson DR, Hou Z, Bolin JM, Ruotti V, Probasco MD, Smuga-Otto K, Howden SE, Diol NR, Propson NE, Wagner R, Lee GO, Antosiewicz-Bourget J, Teng JM and Thomson JA, Nat Methods, 2011, 8, 424–429. [DOI] [PMC free article] [PubMed] [Google Scholar]
- 46.Miyazaki T, Futaki S, Suemori H, Taniguchi Y, Yamada M, Kawasaki M, Hayashi M, Kumagai H, Nakatsuji N, Sekiguchi K and Kawase E, Nat Commun, 2012, 3, 1236. [DOI] [PMC free article] [PubMed] [Google Scholar]
- 47.Tabata Y, Horiguchi I, Lutolf MP and Sakai Y, Biomater Sci, 2014, 2, 176–183. [DOI] [PubMed] [Google Scholar]
- 48.Lou YR, Kanninen L, Kuisma T, Niklander J, Noon LA, Burks D, Urtti A and Yliperttula M, Stem Cells Dev, 2014, 23, 380–392. [DOI] [PMC free article] [PubMed] [Google Scholar]
- 49.Plotnikov A, Kozer N, Krupalnik V, Peles S, Mor N, Rais Y, Hanna JH and Barr HM, Stem Cell Res, 2017, 23, 158–162. [DOI] [PubMed] [Google Scholar]
- 50.Horiguchi I, Chowdhury MM, Sakai Y and Tabata Y, Biotechnol Prog, 2014, 30, 896–904. [DOI] [PubMed] [Google Scholar]
- 51.Allen P, Melero-Martin J and Bischoff J, J Tissue Eng Regen Med, 2011, 5, e74–86. [DOI] [PMC free article] [PubMed] [Google Scholar]
- 52.Goetzke R, Keijdener H, Franzen J, Ostrowska A, Nüchtern S, Mela P and Wagner W, Sci Rep, 2019, 9, 15578. [DOI] [PMC free article] [PubMed] [Google Scholar]
- 53.Keung AJ, Asuri P, Kumar S and Schaffer DV, Integr Biol (Camb), 2012, 4, 1049–1058. [DOI] [PMC free article] [PubMed] [Google Scholar]
- 54.Rybtsov S and Lagarkova M, Biochemistry (Moscow), 2019, 84, 190–204. [DOI] [PubMed] [Google Scholar]
- 55.Ivanovs A, Rybtsov S, Ng ES, Stanley EG, Elefanty AG and Medvinsky A, Development, 2017, 144, 2323–2337. [DOI] [PubMed] [Google Scholar]
- 56.Marrese M, Antonovaité N, Nelemans BK, Ahmadzada A, Iannuzzi D and Smit TH, bioRxiv, 2020. [DOI] [PMC free article] [PubMed] [Google Scholar]
- 57.Garcia-Abrego C, Zaunz S, Toprakhisar B, Subramani R, Deschaume O, Jooken S, Bajaj M, Ramon H, Verfaillie C, Bartic C and Patterson J, Int J Mol Sci, 2020, 21. [DOI] [PMC free article] [PubMed] [Google Scholar]
- 58.Sidhu I, Barwe SP and Gopalakrishnapillai A, Blood Rev, 2020, DOI: 10.1016/j.blre.2020.100787, 100787. [DOI] [PubMed] [Google Scholar]
- 59.Prè D, Nestor MW, Sproul AA, Jacob S, Koppensteiner P, Chinchalongporn V, Zimmer M, Yamamoto A, Noggle SA and Arancio O, PLoS One, 2014, 9, e103418. [DOI] [PMC free article] [PubMed] [Google Scholar]
- 60.Haque A, Adnan N, Motazedian A, Akter F, Hossain S, Kutsuzawa K, Nag K, Kobatake E and Akaike T, PLoS One, 2015, 10, e0135170. [DOI] [PMC free article] [PubMed] [Google Scholar]
- 61.Srivastava RK, Moliner A, Lee ES, Nickles E, Sim E, Liu C, Schwarz H and Ibáñez CF, J Biol Chem, 2020, 295, 2034–2042. [DOI] [PMC free article] [PubMed] [Google Scholar]
- 62.Granéli C, Thorfve A, Ruetschi U, Brisby H, Thomsen P, Lindahl A and Karlsson C, Stem Cell Res, 2014, 12, 153–165. [DOI] [PubMed] [Google Scholar]
- 63.Anjos-Afonso F, Buettner F and Bonnet D, Experimental Hematology, 2017, 53, S42. [Google Scholar]
- 64.Hua P, Kronsteiner B, van der Garde M, Ashley N, Hernandez D, Tarunina M, Hook L, Choo Y, Roberts I, Mead A and Watt SM, Scientific Reports, 2019, 9, 5300. [DOI] [PMC free article] [PubMed] [Google Scholar]
- 65.Wagenblast E, Azkanaz M, Smith SA, Shakib L, McLeod JL, Krivdova G, Araújo J, Shultz LD, Gan OI, Dick JE and Lechman ER, Nature Communications, 2019, 10, 4730. [DOI] [PMC free article] [PubMed] [Google Scholar]
- 66.Barwe SP, Sidhu I, Kolb EA and Gopalakrishnapillai A, Mol Ther Methods Clin Dev, 2020, 19, 201–209. [DOI] [PMC free article] [PubMed] [Google Scholar]
- 67.Byrska-Bishop M, VanDorn D, Campbell AE, Betensky M, Arca PR, Yao Y, Gadue P, Costa FF, Nemiroff RL and Blobel GA, The Journal of clinical investigation, 2015, 125, 993–1005. [DOI] [PMC free article] [PubMed] [Google Scholar]
- 68.Banno K, Omori S, Hirata K, Nawa N, Nakagawa N, Nishimura K, Ohtaka M, Nakanishi M, Sakuma T and Yamamoto T, Cell reports, 2016, 15, 1228–1241. [DOI] [PubMed] [Google Scholar]
- 69.Maclean GA, Menne TF, Guo G, Sanchez DJ, Park IH, Daley GQ and Orkin SH, Proc Natl Acad Sci U S A, 2012, 109, 17567–17572. [DOI] [PMC free article] [PubMed] [Google Scholar]
- 70.Tanimura N, Miller E, Igarashi K, Yang D, Burstyn JN, Dewey CN and Bresnick EH, EMBO reports, 2016, 17, 249–265. [DOI] [PMC free article] [PubMed] [Google Scholar]
- 71.Lambert C and Sack U, Cytometry B Clin Cytom, 2017, 92, 178–179. [DOI] [PubMed] [Google Scholar]
- 72.Kwong YL, Cheng G, Tang TS, Robertson EP, Lee CP and Chan LC, Leukemia, 1993, 7, 1667–1671. [PubMed] [Google Scholar]
- 73.Kwong YL, Br J Haematol, 2003, 122, 686–687. [DOI] [PubMed] [Google Scholar]
- 74.Weiss MJ and Orkin SH, Exp Hematol, 1995, 23, 99–107. [PubMed] [Google Scholar]
- 75.Fujiwara T, Tohoku J Exp Med, 2017, 242, 83–91. [DOI] [PubMed] [Google Scholar]
- 76.Alsayegh K, Cortés-Medina LV, Ramos-Mandujano G, Badraiq H and Li M, Current genomics, 2019, 20, 438–452. [DOI] [PMC free article] [PubMed] [Google Scholar]
- 77.Carruthers V, Nicola M, Venugopal P, Hahn CN, Scott HS and Revesz T, J Paediatr Child Health, 2017, 53, 1018–1020. [DOI] [PubMed] [Google Scholar]
- 78.Yoshida K, Toki T, Okuno Y, Kanezaki R, Shiraishi Y, Sato-Otsubo A, Sanada M, Park MJ, Terui K, Suzuki H, Kon A, Nagata Y, Sato Y, Wang R, Shiba N, Chiba K, Tanaka H, Hama A, Muramatsu H, Hasegawa D, Nakamura K, Kanegane H, Tsukamoto K, Adachi S, Kawakami K, Kato K, Nishimura R, Izraeli S, Hayashi Y, Miyano S, Kojima S, Ito E and Ogawa S, Nat Genet, 2013, 45, 1293–1299. [DOI] [PubMed] [Google Scholar]
- 79.Hansen P and Oddo A, Methods and Protocols, 2015, 1348, 33–50. [DOI] [PubMed] [Google Scholar]
Associated Data
This section collects any data citations, data availability statements, or supplementary materials included in this article.