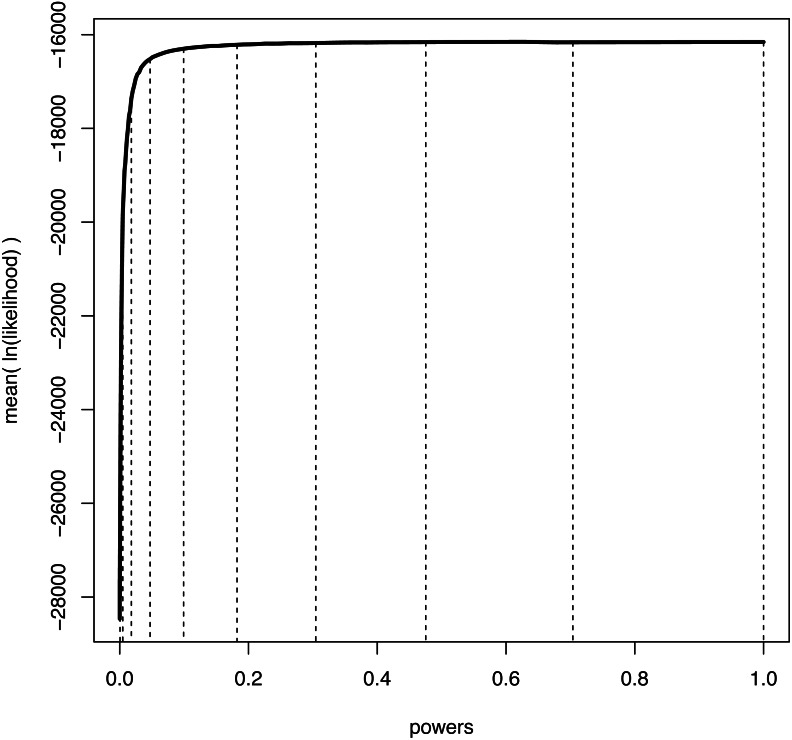
Figure 1. An example curve of mean log-likelihood samples over a range of different powers.
The vertical, dashed lines show which values of powers were used when K = 11 and βi = (i/(K − 1))1.0/0.3 for i ∈ {0, K − 1}. The curve shows explicitly over which range of powers the log-likelihood changes most drastically; when β is small and thus the importance distribution is close to the prior. Hence, a good numerical approximation of the log-likelihood curve is obtained when most powers take small values.

