

Abstract
Aim:
Highly prevalent diseases such as insulin resistance and heart failure are characterized by reduced metabolic flexibility and reserve. We tested whether Na/K-ATPase (NKA)-mediated regulation of Src kinase, which requires two NKA sequences specific to the α1 isoform, is a regulator of metabolic capacity that can be targeted pharmacologically.
Methods:
Metabolic capacity was challenged functionally by Seahorse metabolic flux analyses and glucose deprivation in LLC-PK1-derived cells expressing Src binding rat NKA α1, non-Src-binding rat NKA α2 (the most abundant NKA isoform in the skeletal muscle), and Src binding gain-of-function mutant rat NKA α2. Mice with skeletal muscle-specific ablation of NKA α1 (skα1−/−) were generated using a MyoD:Cre-Lox approach and subjected to treadmill testing and Western diet. C57/Bl6 mice were subjected to Western diet with or without pharmacological inhibition of NKA α1/Src modulation by treatment with pNaKtide, a cell-permeable peptide designed by mapping one of the sites of NKA α1/Src interaction.
Results:
Metabolic studies in mutant cell lines revealed that the Src binding regions of NKA α1 are required to maintain metabolic reserve and flexibility. Skα1−/− mice had decreased exercise endurance and mitochondrial Complex I dysfunction. However, skα1−/− mice were resistant to Western diet-induced insulin resistance and glucose intolerance, a protection phenocopied by pharmacological inhibition of NKA α1-mediated Src regulation with pNaKtide.
Conclusions:
These results suggest that NKA α1/Src regulatory function may be targeted in metabolic diseases. Because Src regulatory capability by NKA α1 is exclusive to endotherms, it may link the aerobic scope hypothesis of endothermy evolution to metabolic dysfunction.
Keywords: ATP1A1, endurance, insulin resistance, metabolic flexibility, Src
Introduction
Metabolic capacity, comprised of reserve (the ability to increase metabolic rate to meet changing energy demands) and flexibility (the ability to switch between different metabolic pathways depending on substrate availability), is vital for maintaining homeostasis when faced with changing energy demands and fuel availability, and the loss of metabolic capacity is associated with many end-stage chronic human diseases such as heart failure, liver failure, and steatohepatitis1–4. Conversely, increased metabolic capacity is linked to improved health outcomes3,5–8. Despite the importance of metabolic reserve and flexibility in mammalian physiology and pathophysiology, the mechanisms by which they are regulated are only minimally understood7.
In addition to its role as an ion transporter, the ubiquitous mammalian Na/K-ATPase (NKA) α1 isoform encoded by the ATP1A1 gene has been identified as an important signaling platform due to its ability to form a functional receptor complex with Src9. Among the processes regulated by α1 NKA/Src signaling are the Warburg effect in cancer10,11 and increased mitochondrial ROS production, which can further activate the α1 NKA/Src pathway and generate a positive feedback loop12. Targeting this signaling through α1 NKA has been shown to attenuate metabolic syndrome13–16, and decreased α1 NKA expression is involved with multiple disease states associated with metabolic disturbances, including heart failure17, cancer10,18, diabetic neuropathy19, and polycystic ovarian syndrome20. In contrast to α1 NKA, the expression of other mammalian isoforms which do not signal through Src (α2, α3, and α4) is restricted to specific tissues21. In view of its links to mitochondrial ROS production and the highly conserved nature of Src binding sites in mammalian ATP1A1, we postulate that the acquisition of Src binding sites in α1 NKA affords a fundamental regulatory mechanism of metabolic capacity, which supports growth and endurance. Conversely, it may also represent a fundamental mechanism of metabolic dysregulation when animals are in a chronic state of nutritional over-supply.
To test these hypotheses, we developed an in vitro system to compare the metabolic profiles of cells expressing the wild-type Src binding α1 isoform, the wild-type non-Src binding α2 isoform, a previously characterized loss-of-function Src binding mutant α1 isoform22, and a previously characterized Src binding, gain-of-function α2 mutant23. We then generated a mouse model with a skeletal muscle-specific ablation of ATP1A1, taking advantage of the prior observation that the α2 isoform is the primary driver of ion-pumping during skeletal muscle contraction24. Moreover, in view of the well-established role of skeletal muscle in the regulation of glucose metabolism and insulin sensitivity5,25–28, we further utilized this model to address the role of Src binding α1 NKA in the development of metabolic syndrome. These genetic studies reveal a novel mechanism regulating metabolic reserve and flexibility that can be targeted pharmacologically to mitigate metabolic dysfunction.
Results
The impact of Src binding sites in ATP1A1 on metabolic capacity in vitro.
Previous studies have identified two ATP1A1-specific Src binding sites which are completely conserved within mammalian species (the NaKtide sequence and Y260, Table S1)10,22,23,29. To assess the physiological significance of ATP1A1 Src binding, we generated 3 stable cell lines from LLC-PK1, a porcine renal epithelial cell line, using a well-established knock down and rescue approach30,31. AAC-19 cells express wild-type rat α1, LX-α2 cells express a rat α2 that lacks the Src binding sites, and LY-a2 express a mutant rat α2 that was engineered to contain both Src binding sites (Table S2). Western blotting confirmed the expected expression of the selected NKA isoforms (Figure S1A). Detailed characterizations of these cell lines were previously reported22,23,32, and revealed that the expression of these transgenes further reduces the expression of endogenous pig α1 to an undetectable level, making it possible to probe the properties of transgenes without interference from the endogenous α1 NKA10,23,30,32,33. In the context of the present study, it is important to note that all these lines exhibit normal ouabain-sensitive ATPase activity23,32,34. However, LX-α2 and A420P fail to effectively regulate Src. As a result, in contrast to AAC-19 or LY-a2, baseline Src phosphorylation at 419 is elevated, and ouabain does not stimulate Src kinase or downstream effectors such as ERK and Akt in those cells (summarized in Table S2).
In routine culture, we noted a rapid acidification of LX-α2 cells’ culture medium compared to AAC-19 (Figure S1B), which led us to compare glucose metabolism between these cell lines. As depicted in Figure 1A, LX-α2 cells consumed nearly 2-fold more glucose than AAC-19 cells. Interestingly, expression of the gain-of-function Src binding mutant α2 in LY-a2 cells restored glucose consumption to the level of AAC-19 controls (Figure 1A). This increased glycolysis was substantiated by increased lactate production in LX-α2 compared to AAC-19 cells (Figure 1B), confirming that the increase in glucose consumption correlated with an increase in aerobic glycolysis. Again, LY-a2 cells exhibited a metabolic profile similar to that of control AAC-19 cells.
Figure 1: Importance of NKA α1/Src regulatory sequences for cell growth and metabolism.
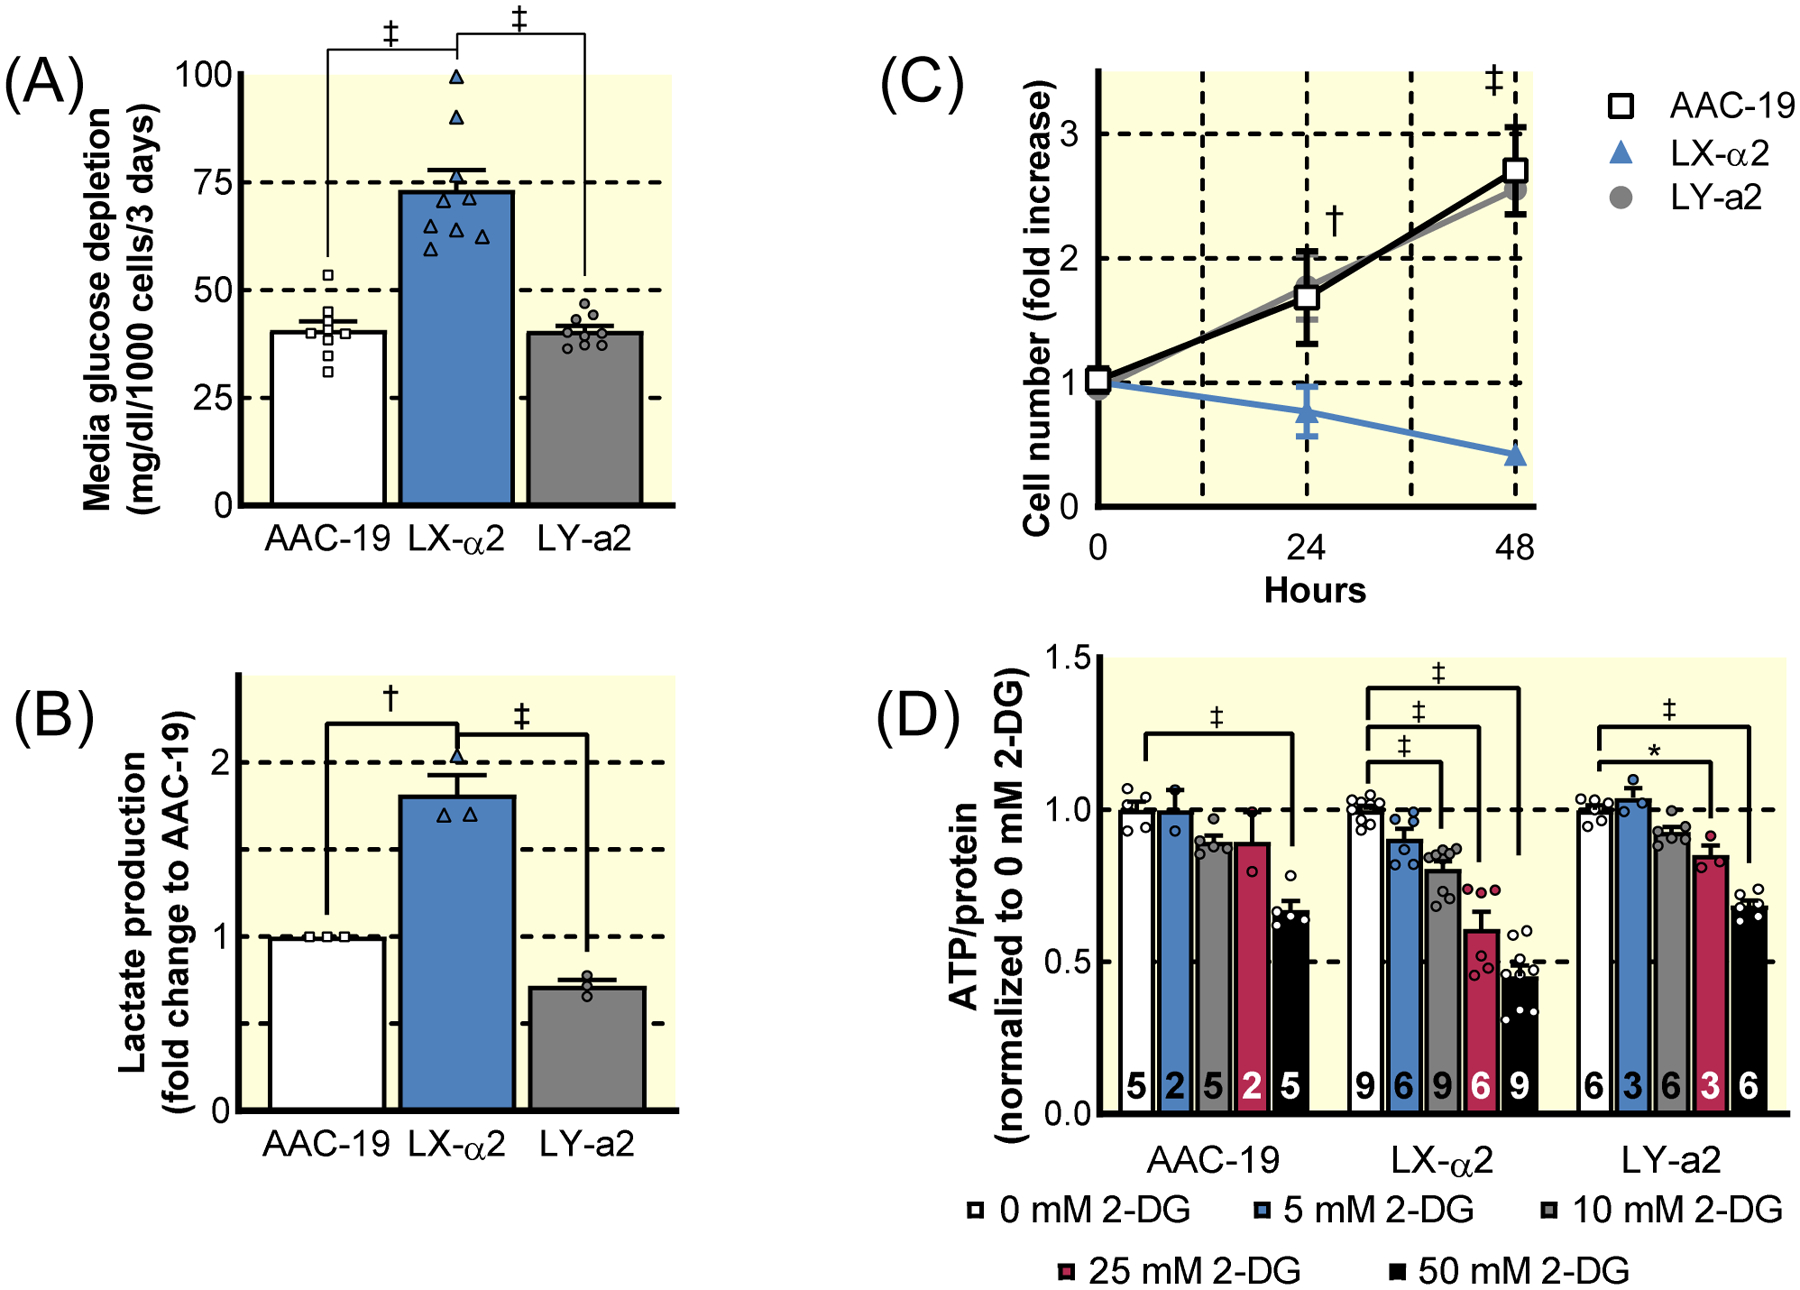
The growth and metabolic capacity of previously characterized stable cell lines expressing wild-type or Src- binding mutant forms of NKA α1 and NKA α2 were assessed. The Src-binding sequences and Src-signaling properties of each line is summarized in Table S2. (A) Glucose consumption of LLC-PK1-derived cells expressing rat WT α1 (AAC-19), rat WT α2 (LX-α2), or rat Src binding gain-of-fucntion mutant α2 (LY-a2) (n=9, ‡ p<0.001). (B) Lactate measured in the media of AAC-19, LX-α2, and LY-a2 cells after 72 hours cell growth (n=3, † p<0.01, ‡ p<0.001). (C) Growth of AAC-19 (squares), LX-α2 (triangles), and LY-a2 (circles) cells in glucose-deprived media (n=6, † p<0.01 vs AAC-19, ‡ p<0.001 vs AAC-19). (D) ATP production in AAC-19, LX-α2, and LY-a2 cells in the presence of increasing concentrations of the glycolysis inhibitor 2DG (n listed at the base of each bar, * p<0.05 vs 0 mM 2-DG, ‡ p<0.001 vs 0 mM 2-DG). Data represented as mean ± SEM and analyzed with a one-way ANOVA with a Holm-Sidak correction for multiple comparisons (A, B, D) or a two-way ANOVA with a Holm-Sidak correction for multiple comparisons (C).
To identify whether α1 NKA-mediated regulation of Src is responsible for enhanced metabolic flexibility and thus, a decreased reliance on glycolysis, cell proliferation was monitored in glucose-deprived media. Both AAC-19 and LY-a2 cells were able to proliferate under glucose-deprived conditions. In contrast, LX-α2 cells failed to survive altogether (Figure 1C). To determine the degree to which LX-α2 cells were reliant upon glycolysis for ATP production, we treated cells with increasing concentrations of the competitive glycolytic inhibitor 2-deoxy-D-glucose (2-DG) and measured the impact of glycolysis inhibition on cellular ATP levels. At low concentrations of 2-DG, only LX-α2 exhibited a significant decrease in cellular ATP (Figure 1D). These data indicate that the loss of the α1 NKA/Src interaction increases reliance on glycolysis and decreases metabolic flexibility, but they do not address the question of metabolic reserve.
For this reason, we subjected these cells to Seahorse metabolic flux analyses (Figure 2). When LX-α2 cells were subjected to the mitochondrial stress test, both basal and maximal oxygen consumption rates (OCR) were decreased (Figure 2A–C). Most significantly, a 65% reduction in the ability to increase mitochondrial respiration to meet changing metabolic needs, known as spare respiratory capacity, (Figure 2D) was noted. On the other hand, LY-a2 cells displayed a metabolic profile identical to that of α1-expressing AAC-19 cells. To test whether the gain of Src binding also affects glycolytic properties, we measured the extracellular acidification rate (ECAR) of LX-α2 cells (Figure 2E). Although LX-α2 and AAC-19 cells exhibited similar basal glycolytic activity, the maximum ECAR of LX-α2 measured in the presence of oligomycin decreased. This was in sharp contrast to AAC-19 cells in which ECAR increased (Figure 2F–G) and indicates a decrease in the ability to increase glycolysis to meet changing metabolic needs, known as spare glycolytic capacity. Together with the decrease in spare respiratory capacity, this indicates a complete loss of metabolic reserve in LX-α2 cells (Figure 2H). In all cases, LY-a2 cells exhibited a metabolic profile identical to AAC-19 controls, indicating that the loss of metabolic reserve and flexibility in the LX-α2 cells was due specifically to the lack of the Src binding and not to other differences between the isoforms. This conclusion is further supported by Seahorse analysis of cells expressing a loss-of-function Src binding mutant α1 NKA, A420P, in which a mutation in the Src binding NaKtide sequence (A420P) disrupts the NKA α1/Src interaction (Table S2)22. These A420P cells exhibited decreases in spare respiratory and glycolytic capacity compared to AAC-19 controls (Figure S2).
Figure 2: Seahorse metabolic analysis of AAC-19, LX-α2, and LY-a2 cells.
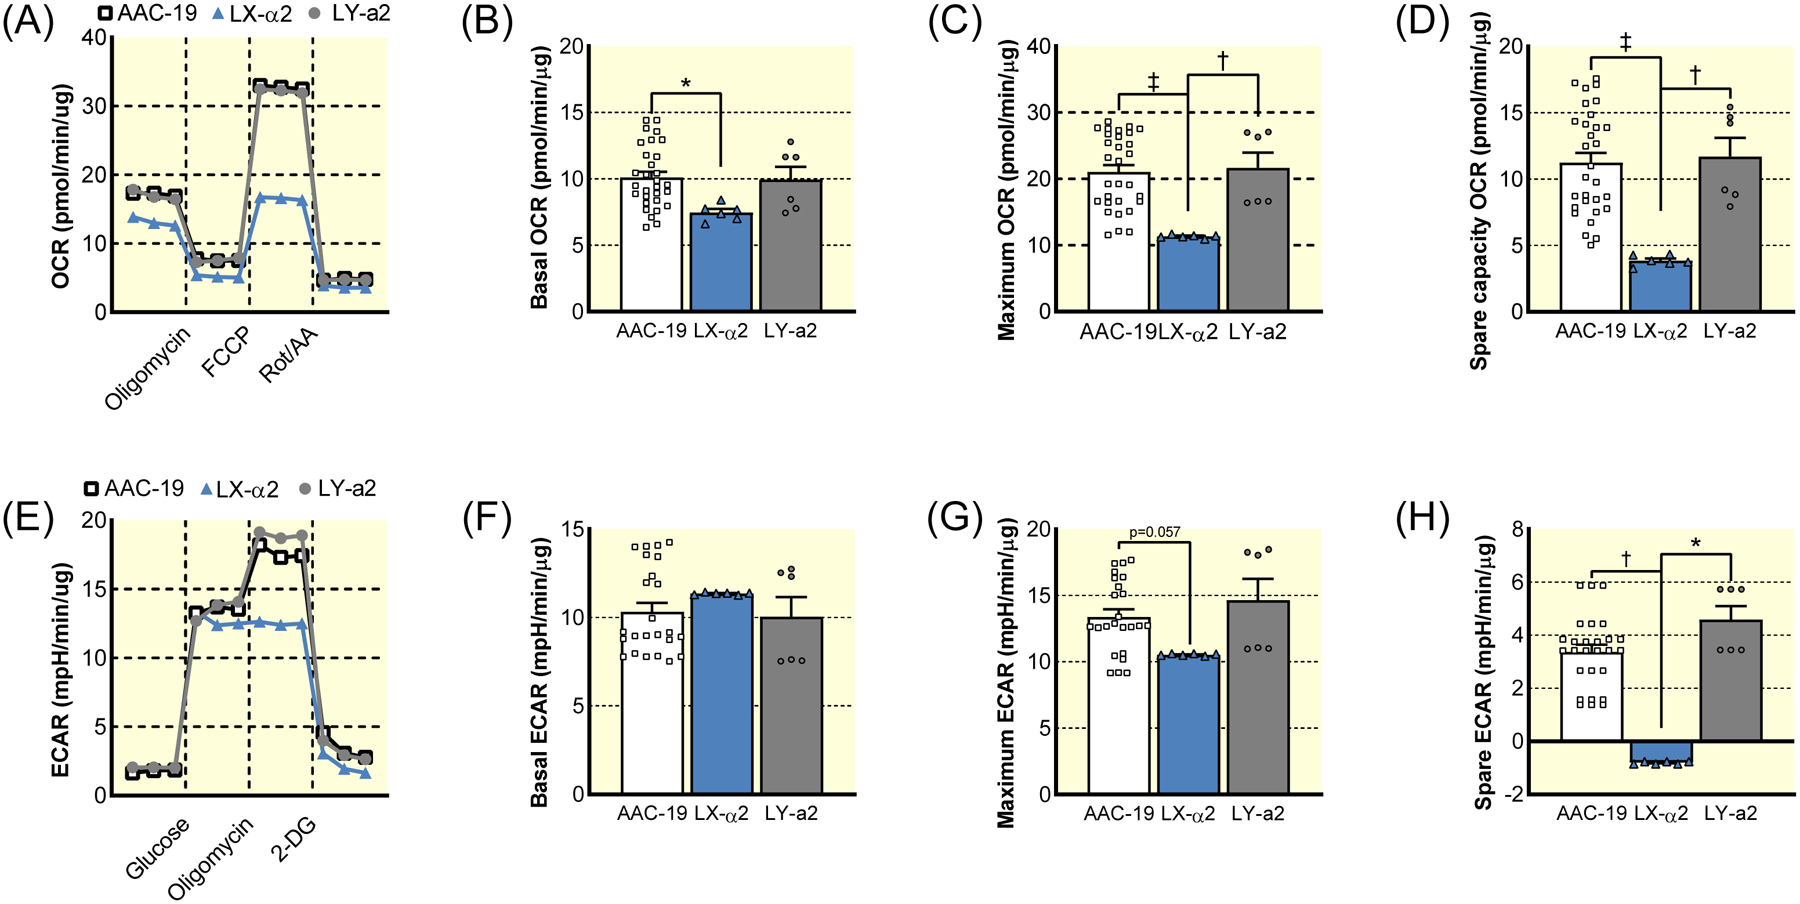
(A) Representative trace of mitochondrial stress test of AAC-19 (squares), LX-α2 (triangles), and LY-a2 (circles). (B) Basal mitochondrial respiration of AAC-19 (n=30), LX-α2 (n=6), and LY-a2 (n=6). (C) Maximum mitochondrial respiration of AAC-19 (n=30), LX-α2 (n=6), and LY-a2 (n=6). (D) Spare respiratory capacity of AAC-19 (n=30), LX-α2 (n=6), and LY-a2 (n=6). (E) Representative trace of glycolytic stress test of AAC-19 (squares), LX-α2 (triangles), and LY-a2 (circles). (F) Basal glycolysis rate of AAC-19 (n=30), LX-α2 (n=6), and LY-a2 (n=6). (G) Maximum glycolysis rate of AAC-19 (n=30), LX-α2 (n=6), and LY-a2 (n=6). (H) Spare glycolytic capacity of AAC-19 (n=30), LX-α2 (n=6), and LY-a2 (n=6). * p<0.05, † p<0.01, ‡ p<0.001. Data represented as mean ± SEM and analyzed with a one-way ANOVA with a Holm-Sidak correction for multiple comparisons.
Generation of an in vivo mouse model.
To address the relevance of these findings in animal physiology, we used a MyoDiCre/Lox system to develop a skeletal muscle-specific α1 NKA knockout mouse (skα1−/−) as a model to assess the physiological significance of the α1 NKA/Src interaction in metabolic regulation (Figure S3A). Skeletal muscle was chosen as a model because it is a metabolically dynamic tissue in which NKA α1, unlike most other tissues, is a minor isoform while the remaining (75–90% depending on estimates)35 of NKA is the non-Src-binding α2 isoform32,36. In addition, prior transgenic studies have documented that while skeletal muscle-specific knockout of α2 did not affect skeletal muscle size or fiber type composition, the resulting deficits in K+-transport abolished their ability to match force generation to contraction stimuli24,37,38. Given these results, the knockout of α1 was expected to have a minimal effect on NKA-dependent ion pumping capacity of the skeletal muscle. However, if α1 NKA signaling is a key regulator of metabolic capacity as demonstrated by Figures 1 and 2, genetic deletion of skeletal muscle α1 NKA would cause a switch to more glycolytic myofibers, causing decreased exercise endurance.
The ablation of α1 NKA in skα1−/− skeletal muscles was confirmed with both Western blot and immunohistochemistry (Figure 3A–B). Expression of the α2 isoform was not changed in skα1−/− mice compared with skα1+/+ controls (Figure 3A) and the total NKA activity of crude membranes as measured by ouabain-sensitive ATPase activity was also unaffected (Figure 3C), indicating that the muscles maintained their Na+/K+ transport capacity.
Figure 3: Development of skeletal muscle-specific NKA α1 KO mouse model.
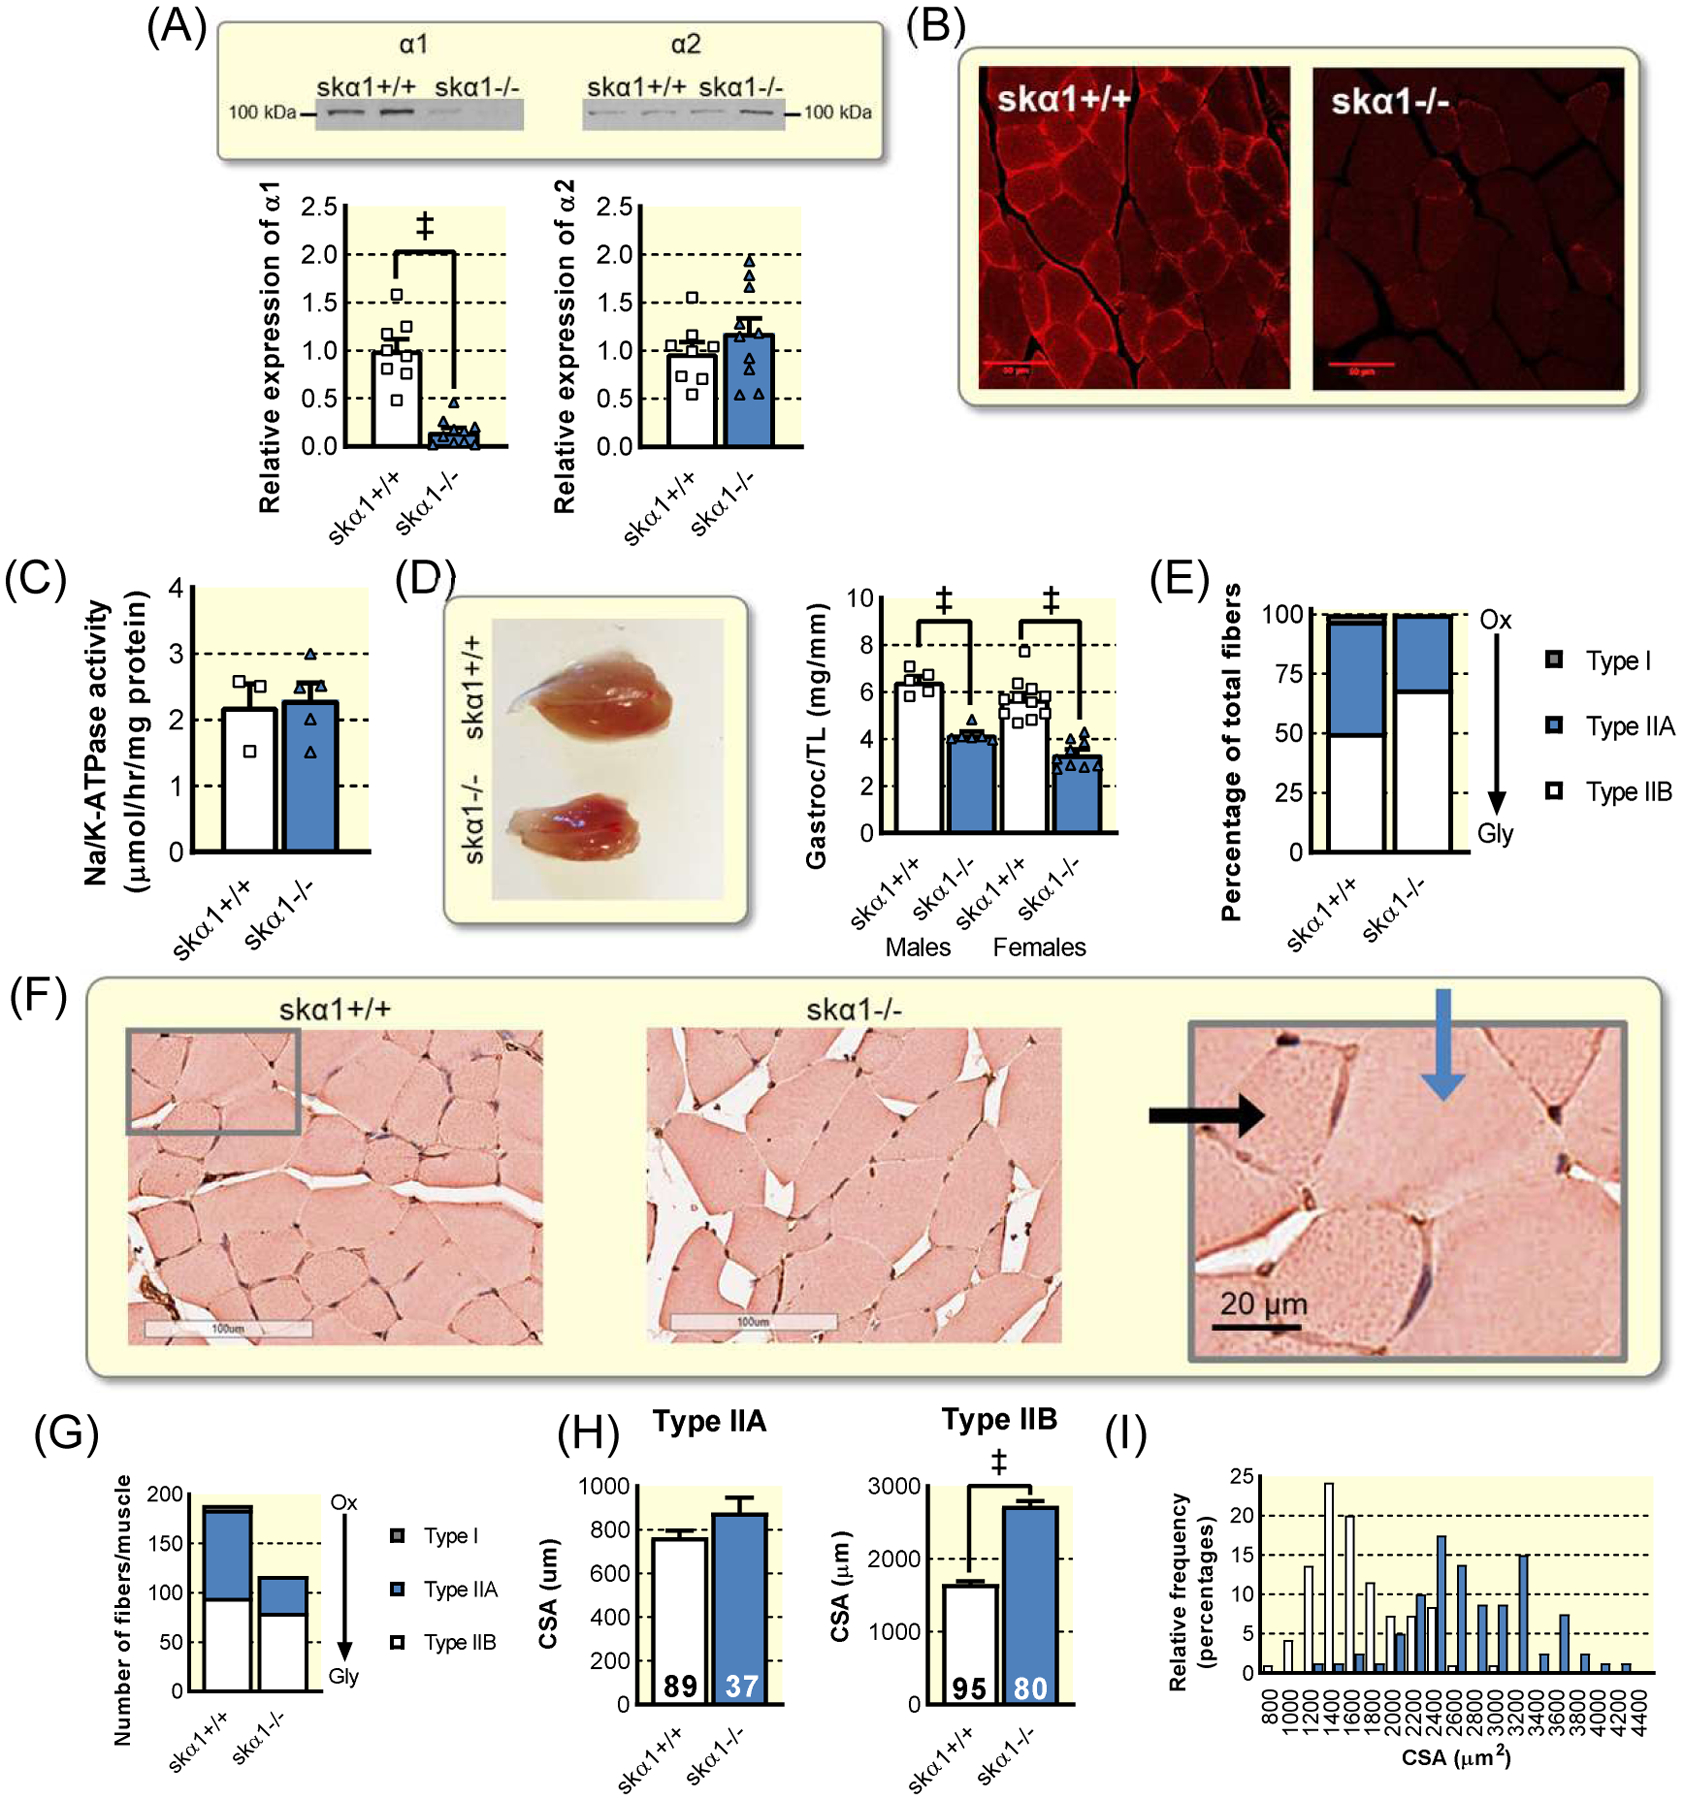
(A) Western blot for NKA α1 and α2 in skα1+/+ (n=8) and skα1−/− (n=10) muscles (‡ p<0.001). (B) Immunohistochemistry of α1 in skeletal muscle. (C) Ouabain-inhibitable ATPase activity in crude membrane fractions from skα1+/+ (n=3) and skα1−/− (n=4) muscles. (D) Gastrocnemius muscle size in skα1+/+ and skα1−/− male (n=5 and n=6, respectively) and female (n=11 and n=9, respectively) mice. (‡ p<0.001). (E) Proportion of fibers which are type IIa, type IIb, and type I. (F) Representative micrographs of skα1−/− and skα1+/+ white gastrocnemius muscles. Blue arrow indicates type IIb and black arrow indicates type IIa fiber. (G) Myofiber number in skα1−/− and skα1+/+ white gastrocnemius muscles. (H) Mean cross sectional areas of type IIa and type IIb fibers. (I) Frequency distribution of fiber CSA in skα1+/+ (white) and skα1−/− (blue) gastrocnemius muscles. Data represented as mean ± SEM and analyzed with a one-way ANOVA with a Holm-Sidak correction for multiple comparisons.
Skα1−/− gastrocnemius muscles were more than 35% smaller than those of skα1+/+ control littermates (Figure 3D), revealing a role for α1 in growth in vivo that mirrors that observed in vitro32. This decrease in muscle mass was further confirmed in the soleus (Figure S3B). Additionally, the number of fibers per muscle decreased in skα1−/− muscles (Figure 3E), with a corresponding hypertrophy of Type IIB glycolytic fibers (Figure 3F–H). There was also a clear change in the ratio of oxidative to glycolytic muscle fibers. Further histochemical analysis revealed proportionately more glycolytic type IIB fibers in the skα1−/− white gastrocnemius muscle, with a corresponding decrease in the number of mixed-oxidative type IIA fibers and a complete lack of oxidative type I fibers (Figure 3I). This fiber type switch suggests a transition to a metabolism reliant on glycolysis consistent with the in vitro cell culture data (Figures 1 and 2). This underscores the similarities between this animal model and the cell model and further supports the notion of a shift from oxidative to glycolytic metabolism in skeletal muscle of skα1−/− mice32.
Impact of NKA α1 ablation on muscle metabolism and performance.
Though the fiber type switch suggested a more glycolytic metabolism in skα1−/− muscles, further experiments were needed to confirm the impact on muscle metabolism and performance. Blood lactate was unchanged in resting mice (1.7 ± 0.2 mM in skα1−/− (n=9) compared to 1.5 ± 0.2 mM in skα1+/+ (n=7), p>0.05), suggesting a minimal change in resting muscle metabolism in skα1−/− mice. However, a key component of muscle health and performance is the ability to increase metabolism to allow for peak exercise performance. To determine whether the ablation of α1 NKA in skeletal muscle impacts the metabolic capacity and flexibility needed to exercise, we subjected skα1−/− mice to a treadmill test designed to challenge both speed and endurance. In a treadmill test at speeds up to 25 m/min, skα1−/− ran as well as skα1+/+ controls (Figure 4A), which contrasts sharply with the phenotype observed in the α2 knockout mouse24,37,38. This contrast highlights the different roles of the two isoforms in skeletal muscle. However, skα1−/− mice showed a 50% reduction in endurance as measured by distance to fatigue (Figure 4B), which suggests a lack of oxidative metabolic capacity and an inability to adapt to changing metabolic demands during exercise6,39. Functionally, mitochondrial Complex I activity was decreased in skα1−/− gastrocnemius muscle homogenates (Figure 4C), confirming an overall decrease in mitochondrial metabolic capacity in skα1−/− gastrocnemius muscles.
Figure 4: Evidence of metabolic dysfunction in skα1−/− muscles.
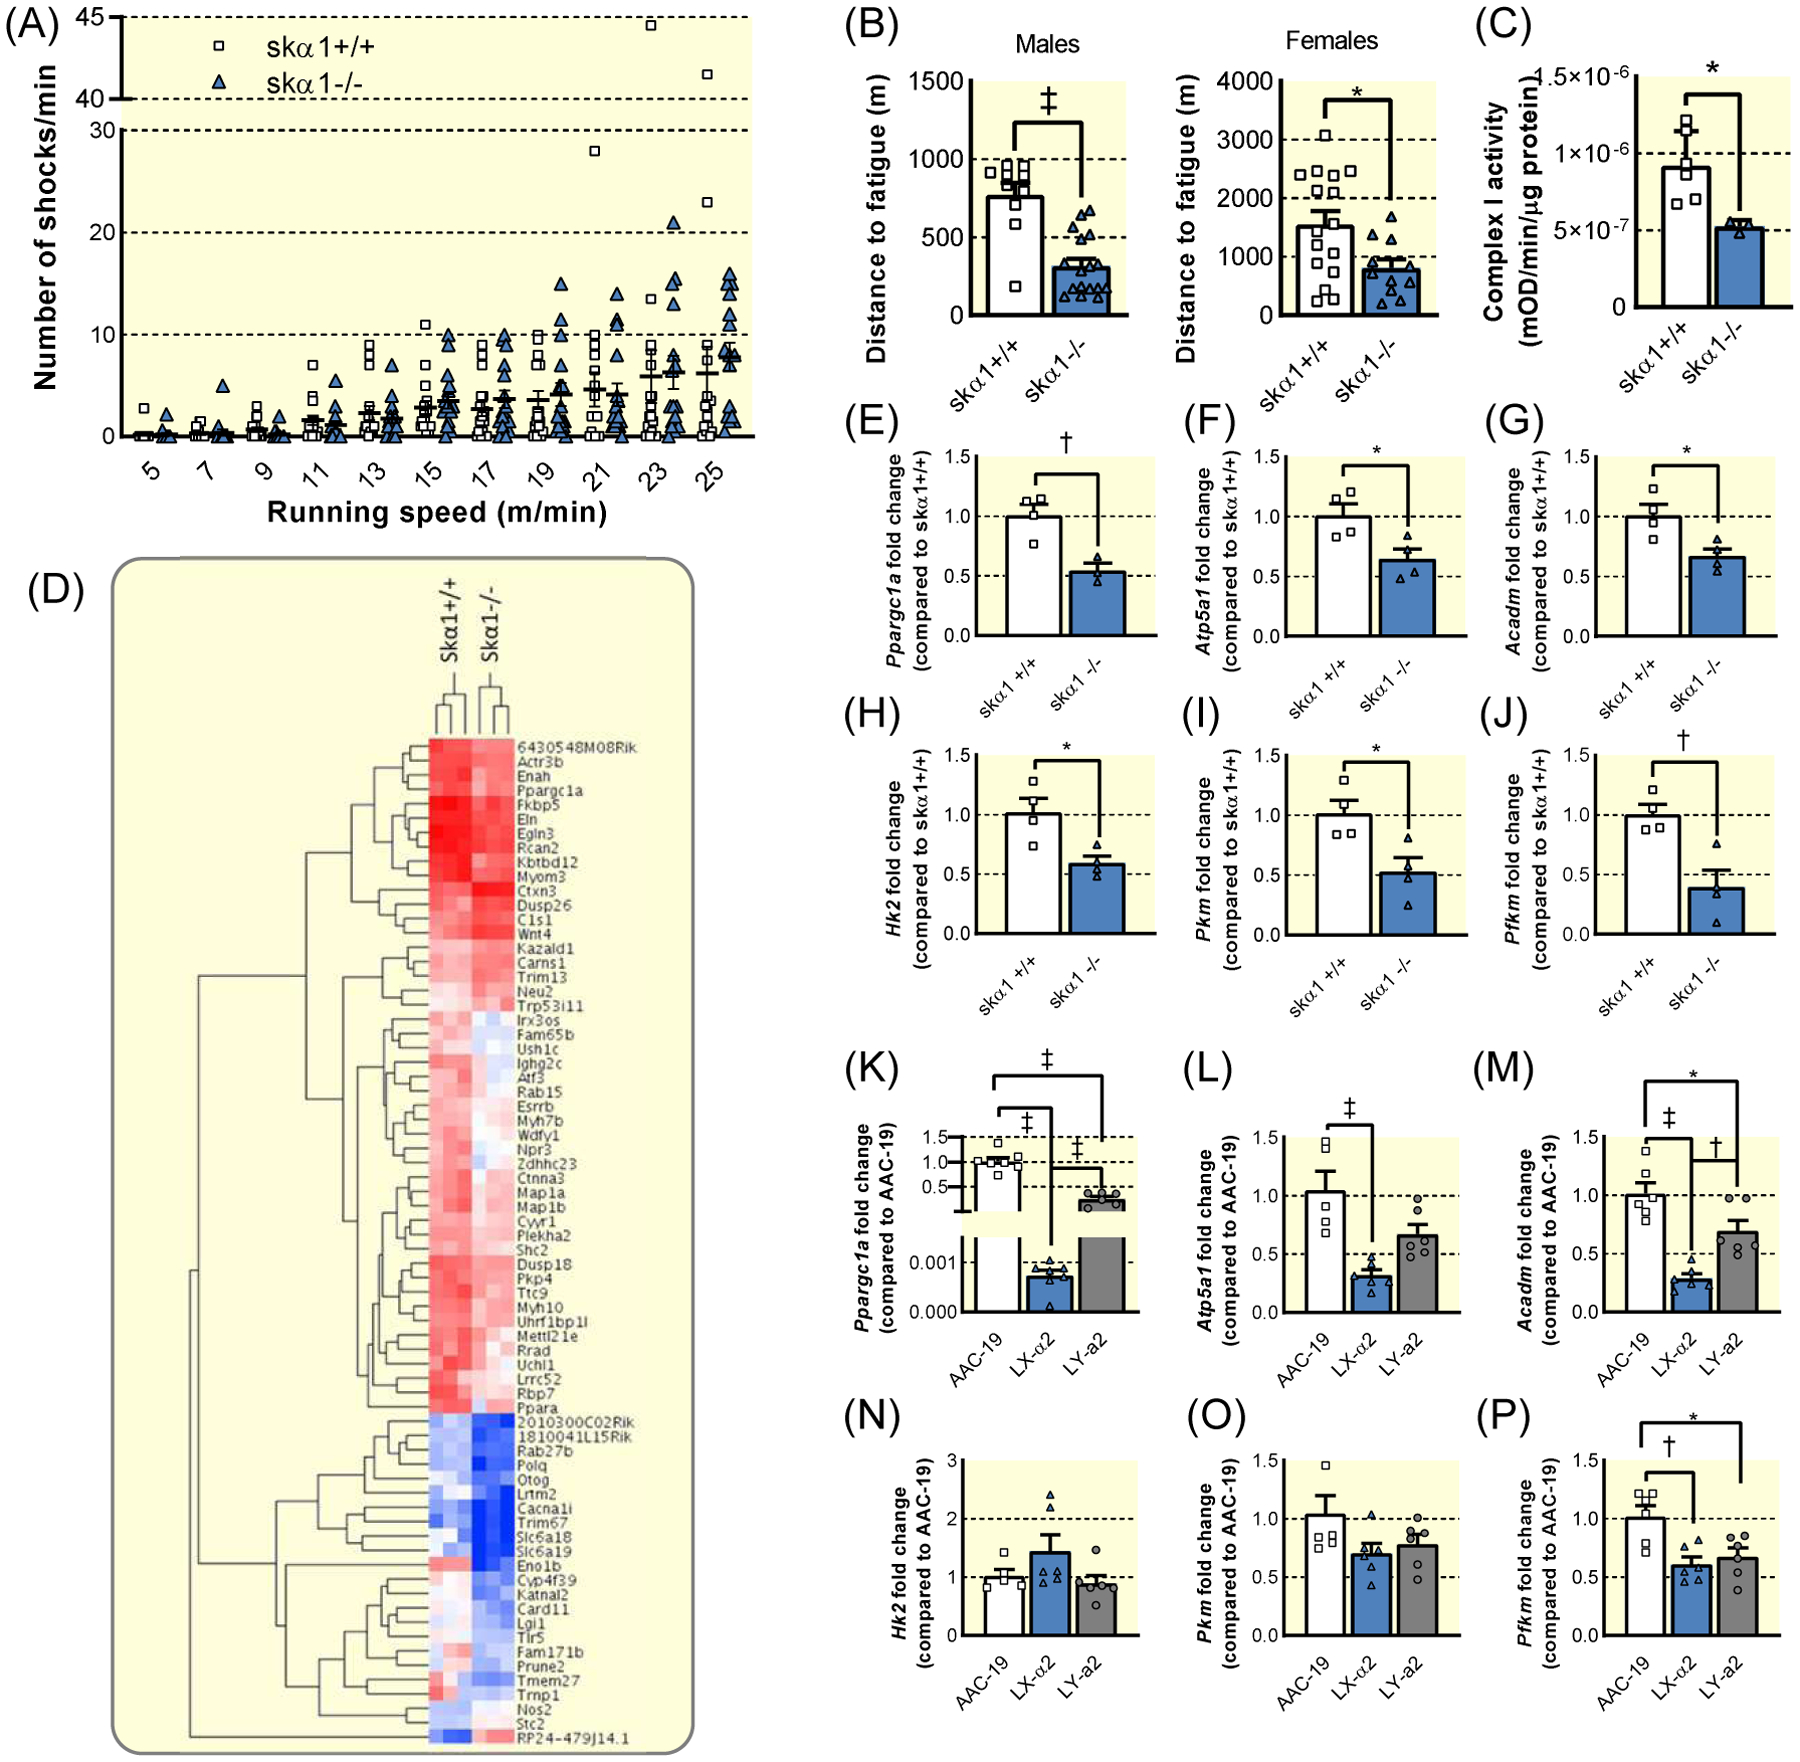
(A) Number of shocks administered per minute per mouse at each treadmill speed to skα1+/+ (white, squares, n=17) and skα1−/− (blue, triangles, n=16) mice. (B) Maximum distance run by skα1+/+ (white, squares) and skα1−/− (blue, triangles) male (n=10 and 17, respectively) and female (n=16 and 11, respectively) mice. (*p<0.05, ‡ p<0.001). (C) Mitochondrial complex I activity in lysates from skα1+/+ and skα1−/− gastrocnemius muscles (n=6 and 3, respectively, *p<0.05) (D) Heatmap of differentially expressed genes identified by RNA sequencing of skα1+/+ and skα1−/− gastrocnemius muscles. (E)–(G). Expression of Ppargc1a (E), Atp5a1 (F), and Acadm (G) in skα1+/+ (white, squares, n=4) and skα1−/− (blue, triangles, n=4) white gastrocnemius muscles. (H)–(J). Expression of Hk2 (H), Pkm (I), and Pfkm (J) in skα1+/+ (white, squares, n=4) and skα1−/− (blue, triangles, n=4) white gastrocnemius muscles. (K)–(M). Expression of Ppargc1a (K), Atp5a1 (L), and Acadm (M) in AAC-19 (white, squares, n=6), LY-α2 (blue, triangles, n=6), and LY-a2 (grey, circles, n=6) cells. (N)–(P). Expression of Hk2 (N), Pkm (O), and Pfkm (P) in AAC-19 (white, squares, n=6), LY-α2 (blue, triangles, n=6), and LY-a2 (grey, circles, n=6) cells. (*p<0.05, † p<0.01, ‡ p<0.001) Data represented as mean ± SEM and analyzed with a two-tailed t-test (B–J) or a one-way ANOVA with a Holm-Sidak correction for multiple comparisons (K–P).
To use an unbiased approach to probe for changes in signaling pathways involved in the regulation of skeletal muscle metabolism, we conducted RNA sequencing analyses of skα1−/− gastrocnemius muscles. As depicted in the heat map in Figure 4D, several groups of genes were altered in gastrocnemius of skα1−/− mice. We further analyzed the Gene Ontology enrichment of differentially expressed genes and visualized the result in a network map by Cytoscape (Figure S4). These analyses revealed changes in signaling pathways related to cell metabolism, ROS production via changes in oxygen and hypoxia sensing, protein assembly, cytoskeleton organization, and cell differentiation and morphogenesis.
We then explored the transcriptional regulation of metabolic genes in skα1−/− and skα1+/+ muscles. Skα1−/− gastrocnemius muscles exhibited decreased expression of the master regulator of mitochondrial biogenesis, Ppargc1a (peroxisome proliferator activated receptor γ coactivator 1α, PGC-1α) (Figure 4E). Similarly, expression of Atp5a1 (ATP synthase F1 subunit α) and Acadm (medium-chain acyl-CoA dehydrogenase) was decreased in skα1−/− gastrocnemius muscles (Figure 4F–G). Additionally, expression of key glycolytic enzymes was decreased in skα1−/− muscles compared to skα1+/+ muscles (Figure 4H–J).
To further determine whether the metabolic defects observed in our in vitro studies and those suggested by the phenotype of skα1−/− mice could have similar transcriptional mechanisms, we analyzed the mRNA expression of the same metabolic genes in AAC-19, LX-α2, and LY-a2 cells. Similar to our observations in skα1−/− muscles, expression of mitochondrial metabolism-related genes were down-regulated in LX-α2 cells compared to AAC-19 cells, and these defects were partially restored in LY-a2 cells (Figure 4K–M). In contrast, although expression of Pfkm (phosphofructokinase) was decreased in LX-α2 cells, we observed no change in other glycolytic gene expression in LX-α2 cells (Figure 4N–P). In contrast to the mitochondrial genes, LY-a2 expression did not rescue expression of Pfkm (Figure 4P). The similarities in expression of key oxidative metabolic genes between the renal epithelial cells and skα1−/− muscles suggest a similar molecular mechanism underlying the regulation of mitochondrial metabolism in both models. In contrast, the differences in the expression pattern of the glycolytic genes in skα1−/− muscle and LX-α2 cells suggest distinct regulation of glycolysis in these systems.
Altered kinase signaling in skα1−/− muscles.
The combination of altered fiber type composition, decreased exercise endurance, decreased complex I activity, and decreased expression of metabolic genes confirmed that skα1−/− muscles exhibit metabolic defects. These data, combined with the unchanged NKA activity in crude membrane fractions and the isoform specificity of this phenotype suggest that the lack of NKA α1 signaling through Src may be responsible for the metabolic dysregulation in skα1−/− muscles. To determine whether dysregulation of the NKA α1/Src signaling pathway is a possible mechanism that ultimately leads to this metabolic dysregulation, we analyzed the activation of several key enzymes in the NKA α1 signaling cascade, including Src, ERK, Akt, and glycogen synthase kinase 3β (GSK-3β) (Figure 5). The sequence of activation of NKA α1/Src signaling upon cardiotonic steroid (CTS) binding to NKA α1, which triggers an activation of NKA α1-associated Src and amplification by reactive oxygen species (ROS) is shown in Figure 5A. In the absence of NKA α1 signal, a redistribution and upregulation of pSrc away from the cell plasma membrane was observed by immunofluorescence in enlarged fibers of skα1−/− muscle sections (Figure 5B). This was consistent with previous observations in the NKA α1 knockdown epithelial cell line PY-1740, and led to a constitutive activation of ERK and Akt in skα1−/− muscles revealed by western blot (Figure 5C–E). Hence, unchecked Src activity associated with upregulation of downstream kinases, a hallmark of NKA α1/Src disruption in cells34,40, occurs in this in vivo model. An upregulation of total Src expression was also detected by western blot in the skα1−/− muscle (5C and 5F), which has not been previously observed in vitro. Furthermore, while the level of inhibitory phosphorylation of GSK3β was unchanged in skα1−/− muscles, total GSK3β was increased, indicating higher overall levels of active GSK3β (Figure 5G). This was consistent with a decreased levels of glycogen storage in skα1−/− muscles (Figure 5H). Lastly, because increased ROS production is a known effect of dysregulated NKA α1/Src signaling, we analyzed the levels of carbonylated proteins in skα−/− gastrocnemius muscles. Consistent with dysregulation and constitutive activation of the NKA α1 signaling pathway, protein carbonylation was increased in skα1−/− muscles (Figure 5I).
Figure 5: Dysregulation of NKA α1 signaling pathway in skα1−/− muscles.
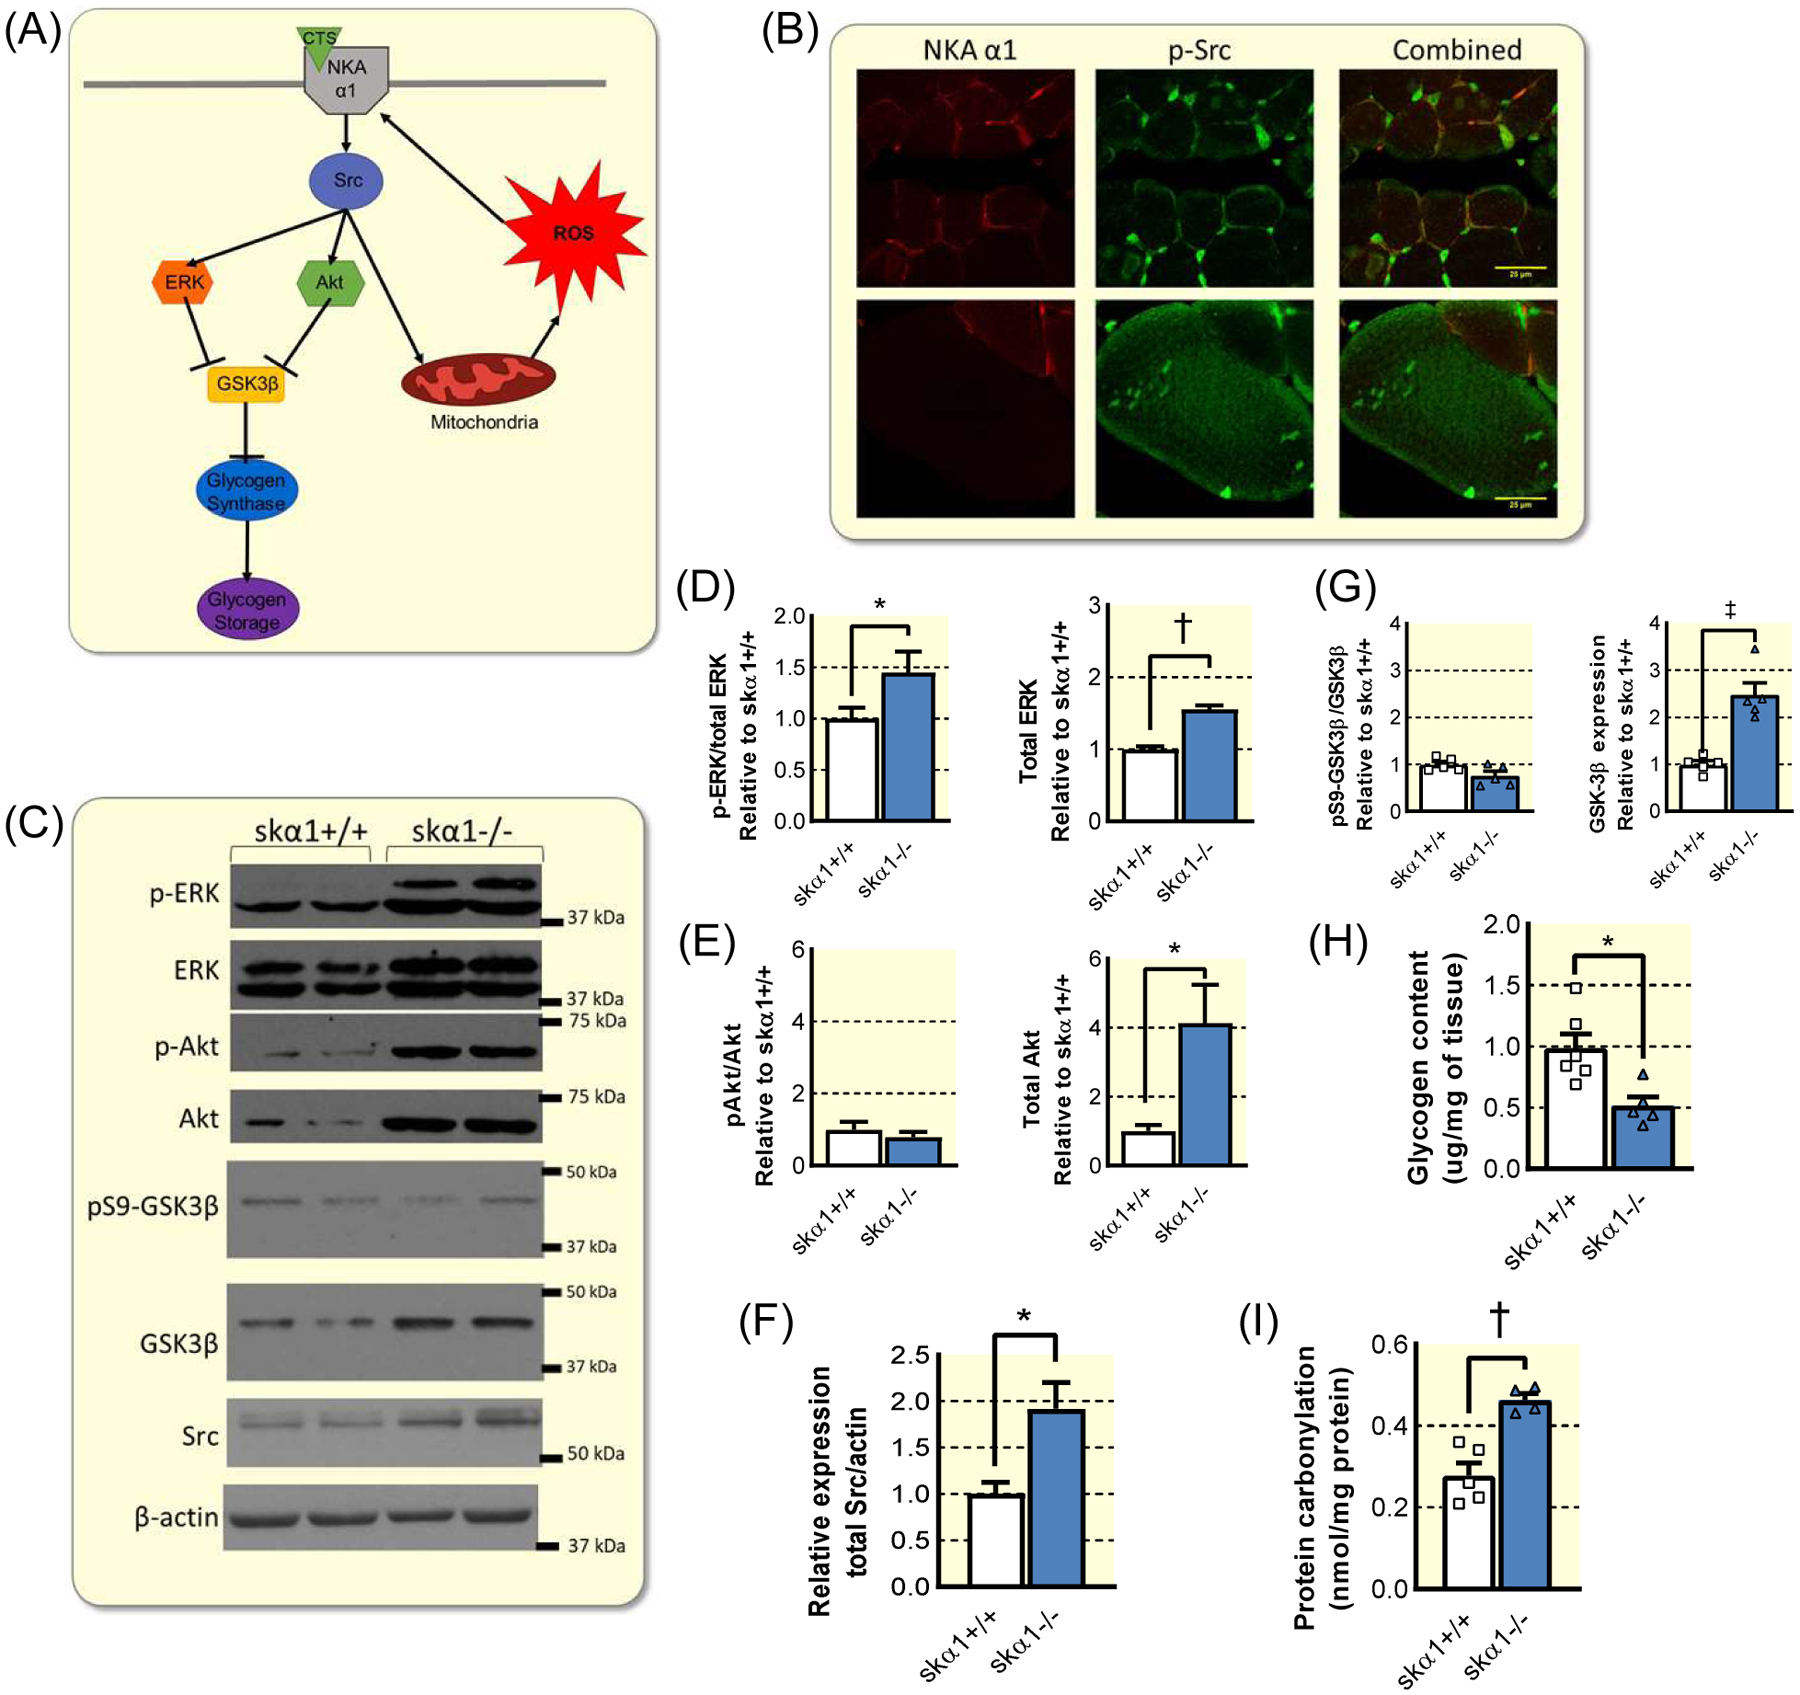
(A) Schematic of NKA α1 signaling pathway, illustrating the known effectors in the signaling cascade initiated by the binding of cardiotonic steroids (CTS) to α1 NKA. (B) Representative immunofluorescent images of gastrocnemius muscles from skα1+/+ and skα1−/− mice stained for NKA α1 (red) and p-Src (green). (C) Representative Western blots for p-ERK, ERK, p-Akt, Akt, pS9-GSK3β, GSK3β, Src, and β-actin. d–e. Phosphorylation and expression of ERK (D) and Akt (E) in skα1+/+ and skα1−/− gastrocnemius muscles (n=5–6, *p<0.05, † p<0.01). (F) Expression of Src in skα1+/+ and skα1−/− muscles (n=6, *p<0.05). (G) Phosphorylation and expression of GSK-3β in skα1+/+ and skα1−/− gastrocnemius muscles (n=5–6, ‡ p<0.001). (H) Glycogen content of gastrocnemius muscles from male skα1+/+ and skα1−/− mice (n=5–6, *p<0.05). (I) Protein carbonylation in skα1+/+ and skα1−/− gastrocnemius muscles (n=4–5, † p<0.01).
Skeletal muscle α1 and susceptibility to diet-induced metabolic dysfunction.
The above findings suggest that the loss of the Src binding α1 isoform leads to decreased metabolic reserve and flexibility in skeletal muscle. The loss of metabolic capacity is associated with increased susceptibility to metabolic syndrome in the face of chronic overnutrition, such as when animals are fed a high-fat, high-fructose Western diet (WD), which increases pathological ROS stress, promotes tissue inflammation, and ultimately causes insulin resistance and glucose intolerance. Since skeletal muscle plays an important role in both glucose homeostasis and metabolic flux26,28, this prompted us to test whether expression of ATP1A1 links the benefits of enhanced muscle metabolic capacity and endurance to decreased susceptibility to diet-induced metabolic dysfunction, specifically the development of glucose intolerance and insulin resistance. Therefore, we subjected skα1−/− mice to WD to observe how they adapted to the metabolic stress of chronic overnutrition13. Baseline body mass was similar between skα1−/− and skα1+/+ mice assigned to normal chow (NC) or Western diet (WD) (Table S4). Due to their FVB-dominant mixed-strain background, even wild-type controls gained less weight than C57Bl6 mice would on the same diet and failed to develop hepatic steatosis as determined by histological analysis and liver mass (Figure 6A), a result of the well-documented FVB resistance to obesity41. However, tissues collected after 12 weeks of WD revealed a significant increase in epidydimal and subcutaneous adipose tissues in control skα1+/+ mice (Figure 6B–C).
Figure 6: Impact of skeletal muscle-specific ablation of NKA α1 on reaction to Western diet.
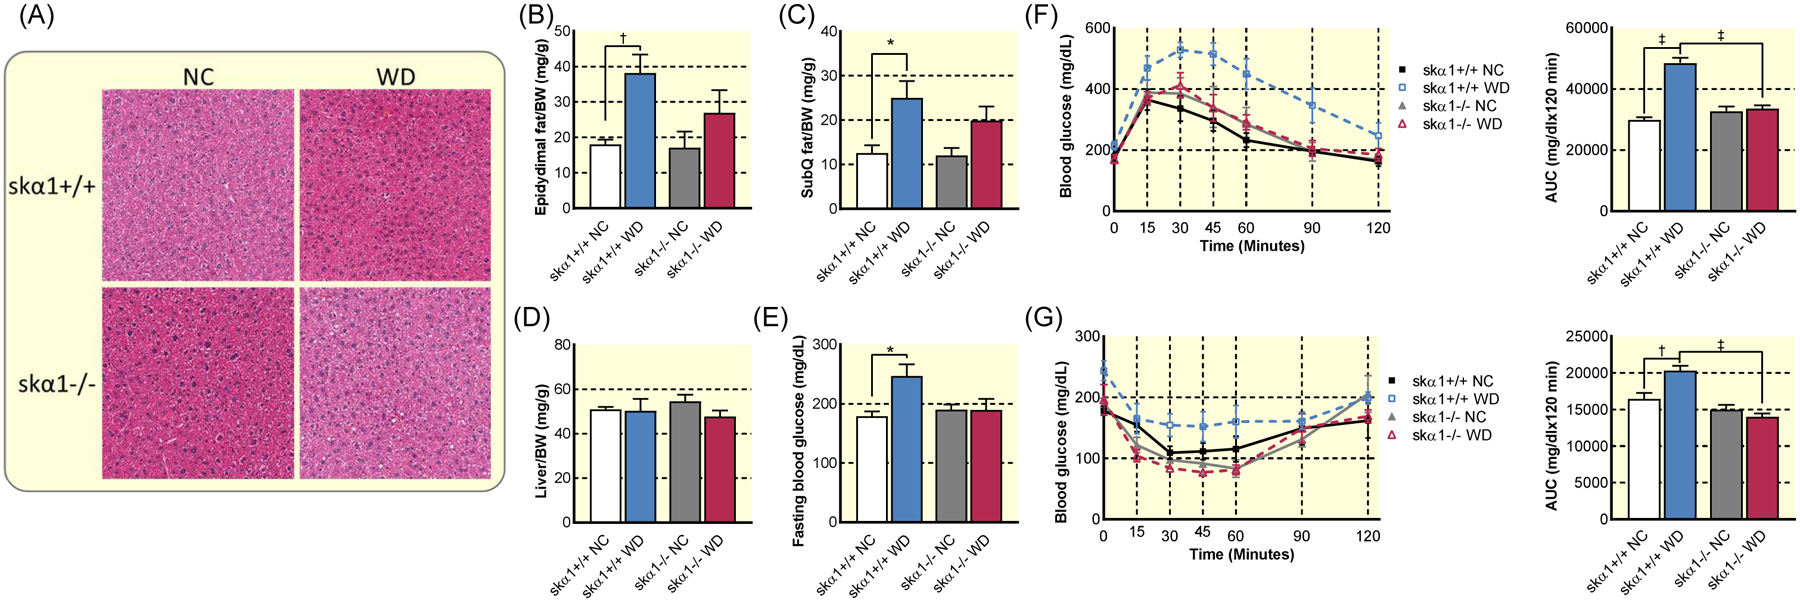
(A) Representative images of haematoxylin and eosin stained livers from skα1+/+ and skα1−/− mice fed NC or WD showing no clear evidence of steatosis. (B) Epidydimal fat pad mass to body weight (BW) ratio in skα1+/+ and skα1−/− mice after 12 weeks on a Western diet (WD) or normal chow (NC) (skα1+/+ NC n=8, skα1+/+ WD n=14, skα1−/− NC n=4, skα1−/− WD n=12). (C) Subcutaneous fat pad (SubQ)/BW ratio in skα1+/+ and skα1−/− mice after 12 weeks on WD or NC (skα1+/+ NC n=8, skα1+/+ WD n=14, skα1−/− NC n=4, skα1−/− WD n=12). (D) Liver mass to BW ratio in skα1+/+ and skα1−/− mice after 12 weeks on a WD or NC (skα1+/+ NC n=8, skα1+/+ WD n=14, skα1−/− NC n=4, skα1−/− WD n=12). (E) Fasting blood glucose in skα1+/+ and skα1−/− mice after 12 weeks on WD or NC (skα1+/+ NC n=4, skα1+/+ WD n=5, skα1−/− NC n=4, skα1−/− WD n=4). (F) Glucose tolerance test and area under the curve of skα1−/− (triangles) and skα1+/+ (squares) mice after 6 weeks on WD or NC (skα1+/+ NC n=7, skα1+/+ WD n=6, skα1−/− NC n=4, skα1−/− WD n=4). (G) Insulin tolerance test of skα1−/− (triangles) and skα1+/+ (squares) mice after 12 weeks on Western diet (skα1+/+ NC n=4, skα1+/+ WD n=5, skα1−/− NC n=4, skα1−/− WD n=4). (* p<0.05, † p<0.01, ‡ p<0.001). Data represented as mean ± SEM and analyzed with a two-way ANOVA with a Holm-Sidak correction for multiple comparisons.
To further probe the impact of skα1−/− on the development of metabolic syndrome, we measured fasting blood glucose and conducted glucose tolerance tests (GTT) and insulin tolerance tests (ITT). As depicted in Figure 6D, after 12 weeks of WD, fasting glucose was significantly elevated only in WD-fed skα1+/+ mice. A GTT administered after 6 weeks of WD showed increased glucose intolerance as measured by the area under the curve (AUC) only in skα1+/+ mice, while WD-fed skα1−/− mice maintained normal glucose clearance (Figure 6E). An ITT administered after 12 weeks revealed impaired insulin sensitivity in skα1+/+ mice but not in skα1−/− mice fed with WD as measured by AUC (Figure 6F). In both cases, glucose clearance was not different between skα1+/+ and skα1−/− mice fed with normal chow but was significantly decreased in skα1+/+ mice compared to skα1−/− mice fed with WD (Figures 6F–G).
Since activation of the α1 NKA/Src is associated with increased ROS production and ROS stress is central to the development of diet-induced metabolic dysfunction, we measured the activation of the nuclear factor erythroid 2-related factor 2 (Nrf2) pathway, which increases the expression of antioxidant enzymes on a WD42. As depicted in Figure 7, WD increased expression of Nrf2 and its targets (Figure 7A–C), indicating that WD-induced ROS stress elicited a robust antioxidant response in skα1+/+ muscles. This conclusion was further strengthened by the induction of glutathione S-transferase mu 1 (Gstm1) (Figure 7D). In contrast, no changes in the expression of these genes were observed in the gastrocnemius of skα1−/− mice, suggesting that the ablation of α1 attenuates ROS stress, consistent with what has been reported12. To further assess ROS signaling, we also measured protein carbonylation, an indicator of an increase in H2O2. As depicted in Figure 7E, a comparable increase in protein carbonylation was noted in both skα1−/− and skα1+/+ mouse gastrocnemius. Furthermore, analysis of the expression of cytokines and antioxidant response genes in liver and epidydimal adipose tissue revealed that the apparent protective effect of the ablation of skeletal muscle NKA α1 extended to the liver but not epidydimal adipose tissue, suggesting limited systemic protection from metabolic disruption (Figure S5)
Figure 7: Oxidative stress and antioxidant response in skα1−/− and skα1+/+ mice on Western diet.
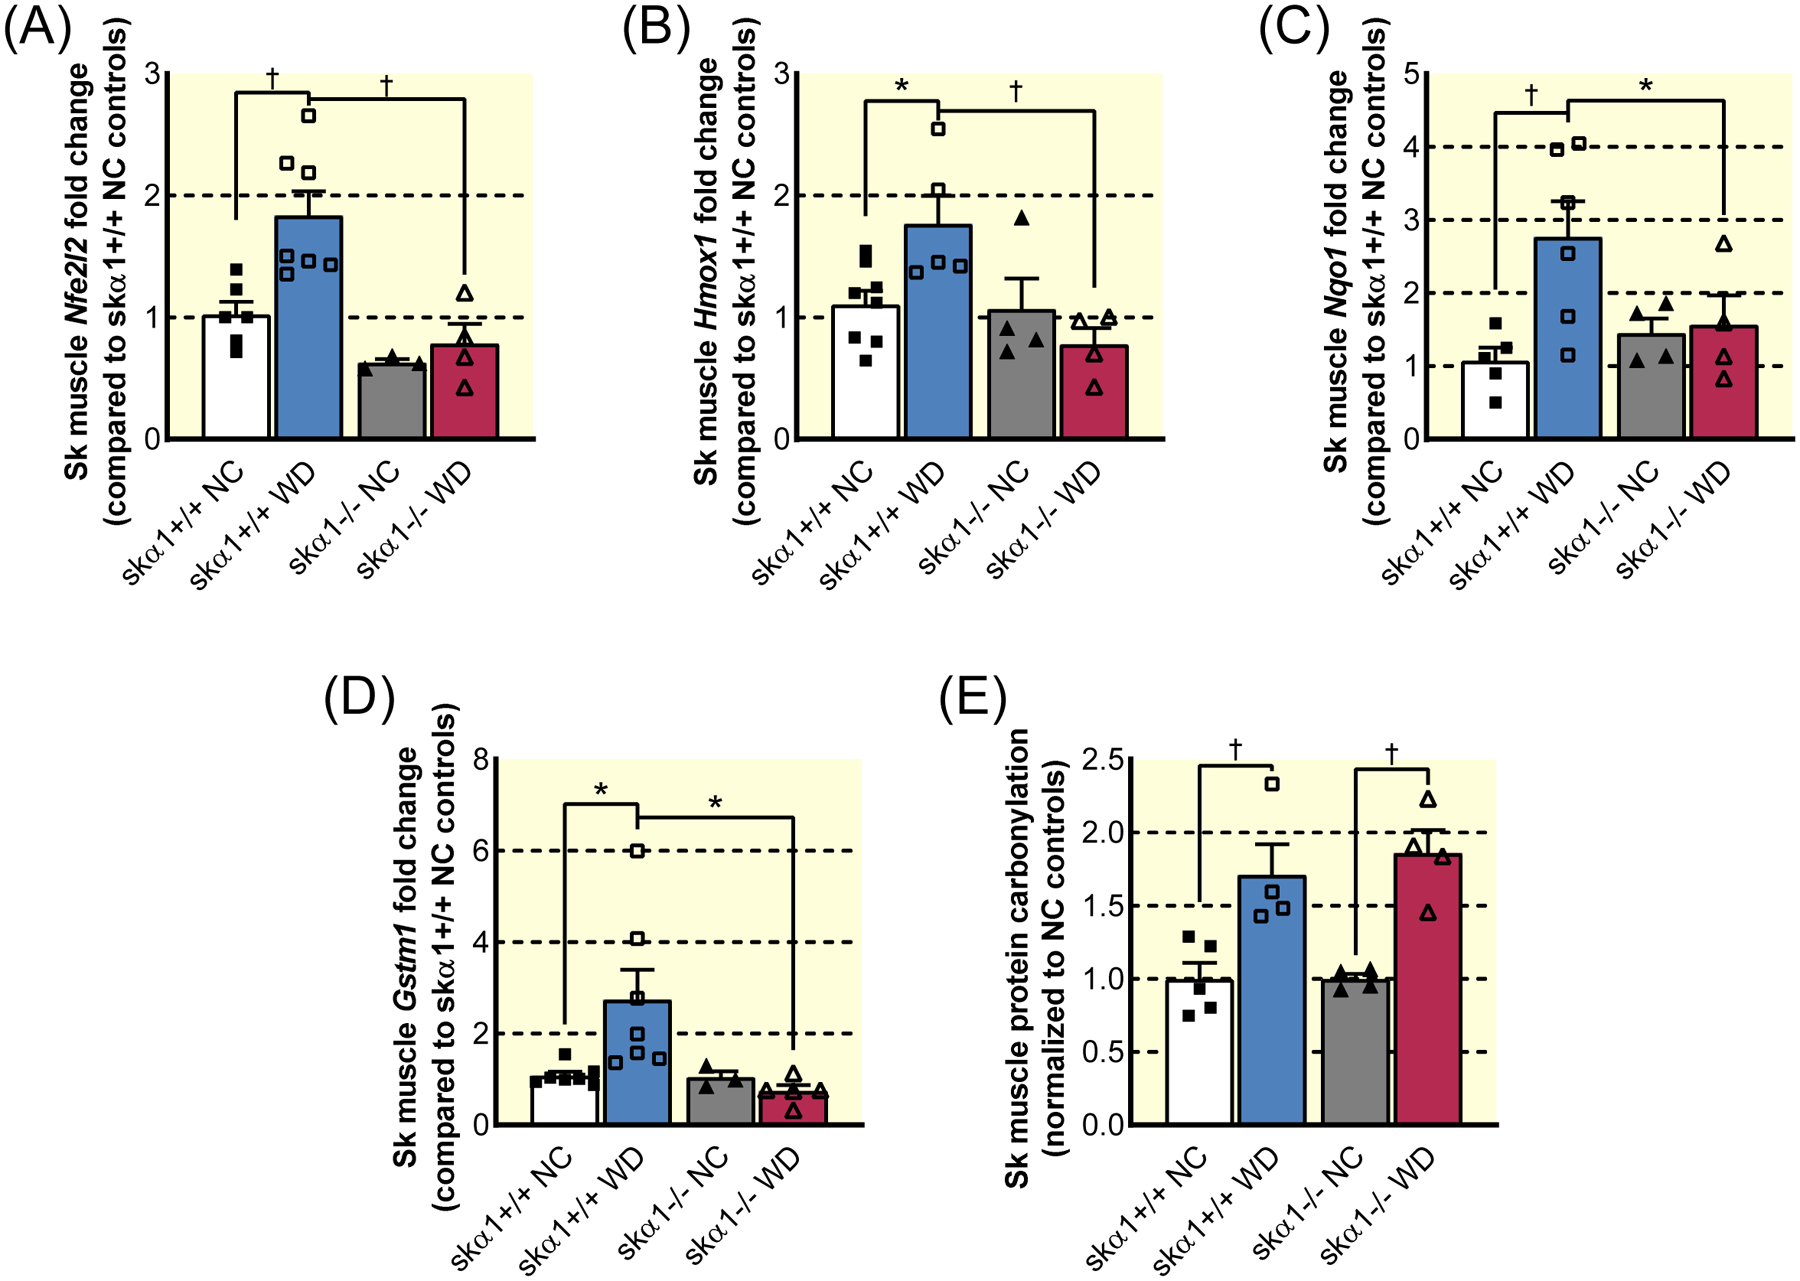
(A)–(D). Expression of Nrf2-related genes in gastrocnemius muscles from skα1+/+ (squares) and skα1−/− (triangles) mice on normal chow (NC, filled symbols) and Western diet (WD, open symbols): Nuclear factor erythroid 2-related factor 2 (Nfe2l2, A), heme oxygenase 1 (Hmox1, B), NAD(P)H quinone dehydrogenase 1 (Nqo1, C), and glutathione S-transferase mu 1 (Gstm1, D) (n=4–6, *p<0.05, † p<0.01). (E) Change in protein carbonylation in gastrocnemius muscles from skα1+/+ (squares) and skα1−/− (triangles) mice on NC (filled symbols) and WD (open symbols) relative to NC controls (n=4–5, *p<0.05, † p<0.01). Data represented as mean ± SEM and analyzed with a two-way ANOVA with a Holm-Sidak correction for multiple comparisons.
Pharmacological interruption of α1 NKA/Src binding attenuates the progression of non-alcoholic steatohepatitis in C57J/Bl6 mice.
The above metabolic protection afforded by the genetic deletion of ATP1A1 in skeletal muscle provides compelling evidence for a role of α1 NKA-mediated Src signaling in developing diet-induced hepatic inflammation and oxidative stress, which ultimately leads to the development of NASH. However, the skα1+/+ and skα1−/− mice were on a mixed FVB background, and FVB mice, unlike C57J/Bl6 mice, are known to be resistant to obesity and NASH41. Therefore, to further test this hypothesis, and to evaluate whether pNaKtide, a peptide derived from α1 NKA that blocks the formation of the α1 NKA/Src complex, could be developed as a drug candidate for NASH, we treated WD-fed C57J/Bl6 mice with 5 mg/kg pNaKtide every other day. This treatment resulted in a significant decrease in weight gain and moderately improved body composition (Figure 8A–B). Like skα1−/−, pNaKtide treatment attenuated liver inflammation, normalizing the expression of Ccl2, Tnfa, and the macrophage marker F4/80 (Figure 8C–E). Furthermore, pNaKtide abolished the induction of the Nrf-2 target gene Hmox1 (Figure 8F). Finally, pNaKtide protected livers from WD-induced hepatic steatosis (Figure 8G). Hence, we conclude from these findings that pNaKtide, by disrupting the formation of α1 NKA/Src complex, blocks WD-induced ROS stress and inflammation, thus preventing the progression of NASH.
Figure 8: Pharmacological targeting of α1 NKA signaling through Src in diet-induced metabolic dysfunction.
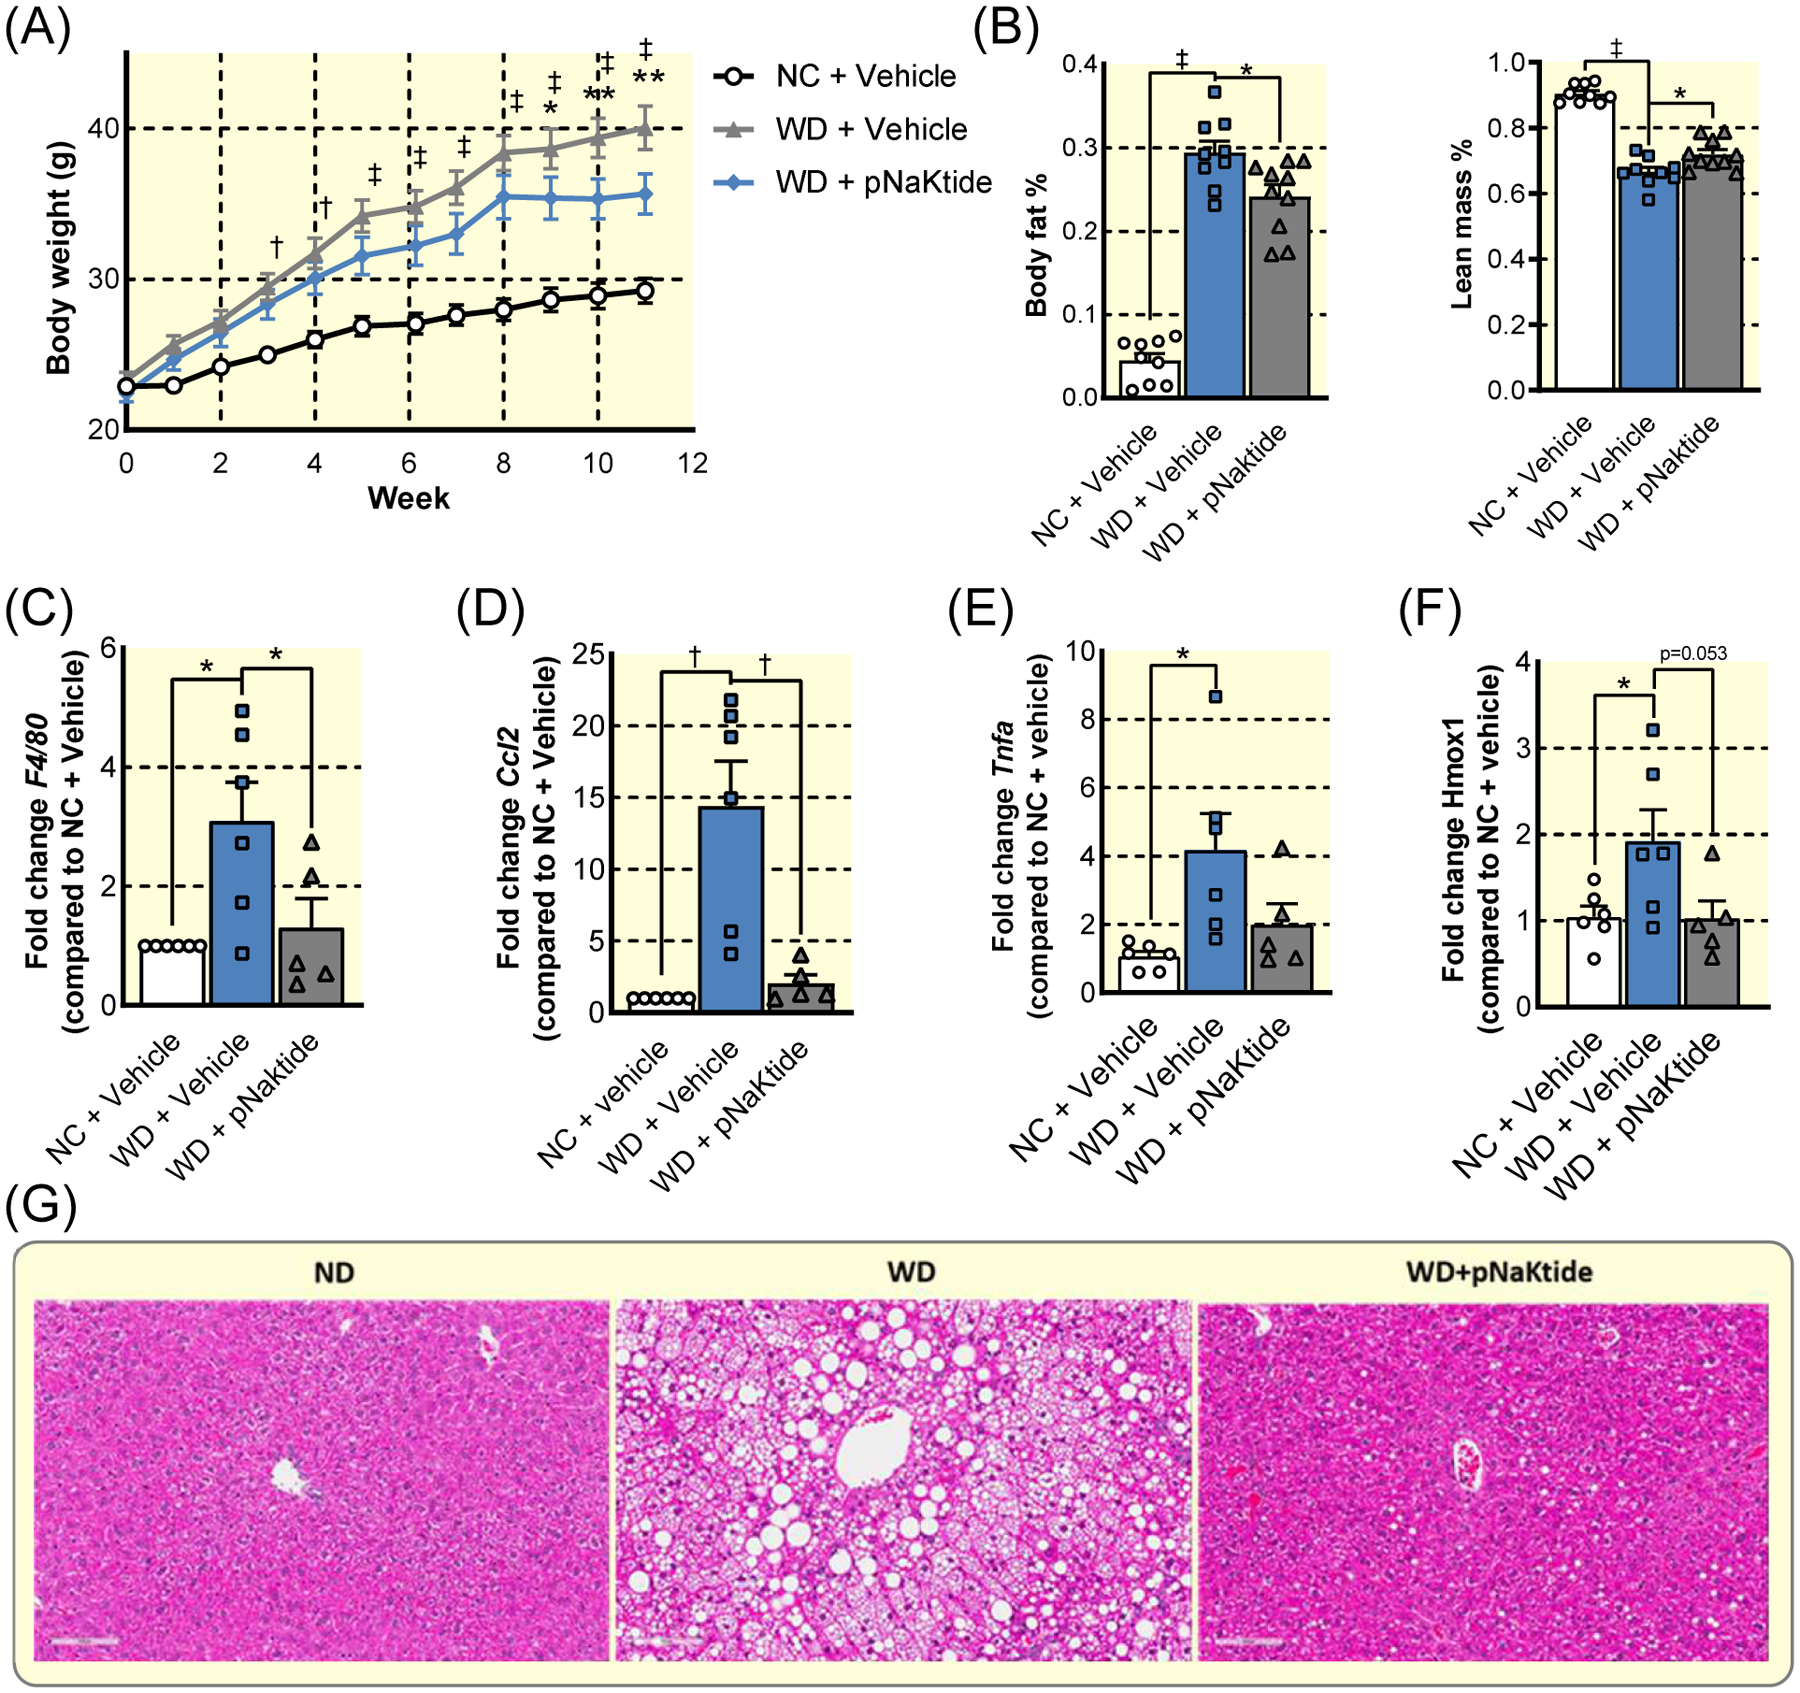
(A) Weight gain in C57J/BL6 over 12 weeks of WD or NC with 5 mg/kg pNaKtide injection or vehicle injection every 2 days. (n=10, † p<0.01, ‡ p<0.001 NC+Vehicle vs WD+Vehicle; * p<0.05, ** p<0.005 WD+Vehicle vs WD+pNaKtide) (B) Effects of pNaKtide on body composition after 12 weeks WD. (C)–(F). Hepatic expression of F4/80 (C), Ccl2 (D), Tnfa (E), and Hmox1 (F) after 12 weeks diet treatment. (G) Representative micrographs of liver sections stained with H&E to show lipid accumulation. (n=6, * p<0.05, † p<0.01, ‡ p<0.001). Data represented as mean ± SEM and analyzed with a one-way ANOVA with a Holm-Sidak correction for multiple comparisons.
Discussion
In this study, we have made three important observations. First, we report for the first time that α1 NKA signaling through Src is a hitherto unidentified regulator of metabolic capacity. This first set of studies also provides molecular insights into NKA isoform heterogeneity (Figures 1–2). Second, we were able to demonstrate the metabolic importance of the α1 isoform in an in vivo model. The ablation of α1 NKA caused a switch from oxidative to glycolytic muscle and a significant hypertrophy of glycolytic Type IIB fibers in gastrocnemius muscles (Figure 3). Consequently, it significantly reduced endurance (Figure 4). Paradoxically, it also afforded protection against diet-induced glucose intolerance and insulin resistance by reducing ROS stress and inflammation in three vital metabolic tissues (Figures 6–7, Figure S5). Finally, these new findings, taken together with previous reports on the in vivo efficacy of pNaKtide in metabolic syndrome, validate the α1 NKA/Src interaction as a novel therapeutic target for metabolic syndrome (Figure 8).
The significance of NKA signaling in animal physiology.
It is important to recognize the unique nature of ATP1A1 signaling through Src for regulating metabolic capacity in mammalian cells. Specifically, our gain-of-Src-binding and loss-of-Src-binding studies indicate that the acquisition of Src binding by α1 NKA is essential for generating metabolic reserve (Figure 2). This contrasts with other recognized pathways such as PPARγ43, PGC-1α44, AMPK45, and pyruvate dehydrogenases46, which play important but nonessential roles in the generation of metabolic reserve. Similarly, NKA/Src interaction increased metabolic flexibility (Figures 1 and 2).
Further, we demonstrated that the skeletal muscle-specific knockout of α1 produced a phenotype distinct from the skeletal muscle-specific knockout of α2 (skα2−/−), which is the primary isoform necessary for the maintenance of skeletal muscle contraction, especially at high stimuli frequencies24,37,38. The use of the MyoD-iCre system to generate the skα1−/− mouse, as previously selected by Radzyukevich et al. to obtain the skα2−/− model24,38, greatly facilitates the comparison of the two phenotypes and reveals clear isoform-specific functions. Structurally, in contrast to the loss of NKA α2, the loss of NKA α1 substantially decreased muscle size, related to a loss of myofibers and with an apparent compensatory increase in fiber size in skα1−/− muscles (Figure 3). Given the early onset of expression of MyoD during mouse embryogenesis47–49, such profound isoform-specific effect is likely related to a role of NKA α1 on muscle differentiation. The present study did not investigate whether this skα1−/− feature was related to a loss of Src-regulatory function or to the loss of other ATP1A1 function such as the regulation of the Wnt/β-catenin signaling recently revealed by Wang et al. during mouse organogenesis50.
Metabolically, differences between skα1−/− and skα2−/− phenotypes do support the hypothesis that the α1 isoform is responsible for the regulation of metabolic capacity, and the altered localization of p-Src with baseline activation of downstream kinases in skα1−/− muscles suggest that this is related to Src dysregulation (Figure 5). Indeed, loss of Src binding in renal epithelial cells leads to comparable changes in expression of metabolic genes (Figure 7). These metabolic changes were represented by the switch to more glycolytic muscle fibers (Figure 3I) and the decreased endurance (Figure 4A) in skα1−/− mice. Additionally, while the basal rate of glycolysis appeared to be increased in the cell model, maximum glycolysis was lower in cells lacking Src binding capacity and there was no glycolytic reserve (Figure 2), indicating a loss of glycolytic capacity that is consistent with the decrease in expression of most metabolic genes (Figure 4). Thus, we speculate that the evolution of Src binding in mammals may have increased metabolic reserve and flexibility, which the aerobic scope hypothesis posits were necessary for the evolution of endothermy51.
Notably, both Src binding sites appear to be important for regulating metabolic capacity. In addition to the cell lines used in this study (LX-α2, LY-a2, AAC-19, and A420P), we also created an LLC-PK1-derived cell line expressing a Y260A mutant rat α1, which also exhibited decreased mitochondrial metabolism, increased reliance on glycolysis, and decreased metabolic reserve10. We also recognize that there are differences in the α1 NKA regulation of metabolism between the cell lines and the skα1−/− mouse model, as indicated by the difference in expression of glycolytic enzymes in the two models (Figure 4). We attribute this to the differences in metabolic demands between the two tissue types and note that these differences between the models in this study are limited to glycolytic enzymes. In spite of these apparent differences in the regulation of glycolytic enzyme expression in the in vivo and in vitro models, the loss of oxidative metabolism was consistent, thus confirming the importance of α1 NKA in regulating mitochondrial metabolism and metabolic flexibility.
NKA/Src interaction as a molecular target for developing therapeutics for metabolic syndrome.
The first evidence linking α1 NKA to ROS production came from our early studies of cardiotonic steroids in cultures of cardiac myocytes52. Subsequently, we documented that stimulation of the α1 NKA/Src receptor complex by cardiotonic steroids increased ROS production in multiple cell types via both mitochondria and NADPH oxidase activation10,12–15,33,52. These ROS then stimulate the α1 NKA/Src complex, forming an amplification loop for the pathological production of ROS12.Targeting the α1 NKA/Src interaction with pNaktide, a peptide inhibitor of the signaling complex that has been used by our group and others11,29,53, terminates this amplification loop, thereby preventing the generation of pathological ROS stress. These in vitro studies were further supported by recent in vivo animal studies13,15,53. Administration of pNaKtide has previously been reported to restore insulin sensitivity and glucose tolerance in animals subjected to WD13,15,16. However, it is important to note that pNaKtide has been used at 25 mg/kg (administered every 7 days) in those previous in vivo studies, while the present study is the first to report efficacy at a lower dose administered more frequently (5 mg/kg administered every 2 days) (Figure 8), which further advances our knowledge about the drug development potential of pNaKtide.
The skα1−/− phenotype provides strong genetic evidence for a role of α1 NKA/Src interaction in the development of diet-induced insulin resistance, glucose intolerance, and liver inflammation (Figures 6–7). These findings, taken together with the pharmacological studies of pNaKtide, validate the α1 NKA/Src interaction as a molecular target for the development of new therapeutics for metabolic syndrome. Moreover, these pharmacological studies of pNaKtide at a much lower dose (5 mg/kg vs 25 mg/kg) have provided compelling evidence of the potency and efficacy of pNaKtide in blocking liver ROS stress, inflammation, and the progression of NASH without the concern of significant side effects (Figure 8). Interestingly, our new findings indicate that the loss of α1-mediated Src signaling in skeletal muscle is sufficient to confer systemic protection from diet-induced glucose intolerance and insulin resistance and reduce oxidative stress and inflammation in target organs. These protective effects appear to be organ-specific, with most of the protection afforded to the liver. In view of the demonstrated role of cross-talk between skeletal muscle, liver, and adipose42,54,55, it is reasonable to suggest that skeletal muscle-specific delivery of pNaKtide might be sufficient to produce therapeutic benefits in metabolic syndrome. This will further reduce the potential of pNaKtide-induced systemic effects.
In addition to ROS stress and inflammation, the potential contribution of elevated GSK-3β expression in skα1−/− mouse skeletal muscles should be considered. High GSK-3β expression is not only consistent with the detected decrease in muscle glycogen content (Figure 5D), but could provide one of many links between the metabolic defects and decreased growth in skα1−/− muscles (Figure 3)56. In addition to protecting skα1−/− mice from WD-induced insulin resistance (Figure 6), the absence of α1 NKA caused a significant decrease in muscle mass (Figure 3D), a switch to glycolytic muscle fibers, and a 50% decrease in running endurance (Figure 4B), all of which could be a result of decreased metabolic capacity6,39. Therefore, we propose that the evolutionary acquisition of Src binding sites in ATP1A1 came with a tradeoff: the increased metabolic reserve and flexibility enhanced mitochondrial metabolism and increased exercise endurance came at the cost of increased susceptibility to diet-induced glucose intolerance and insulin insensitivity. Interestingly, this idea that both improved mitochondrial efficiency and severely reduced mitochondrial capacity can preserve glucose homeostasis in the face of a WD has been proposed before5,57, with Koves et al. postulating that incomplete β-oxidation of lipids rather than the lipids themselves leads to lipotoxicity-induced insulin resistance, a possibility that still needs to be explored in our models. Together, these new findings reveal α1 NKA signaling through Src as a novel regulator for generating metabolic reserve and flexibility in mammals as well as a validated drug target. Furthermore, this offers a novel explanation for exercise-induced increases in α1 NKA expression58,59. This hypothesis is further supported by the reports that individuals with natural running ability have high basal levels of α1 in skeletal and cardiac muscle60,61.
Limitations.
We recognize that there are a number of important unanswered questions. Decreased α1 expression has been shown to decrease muscle size in the global NKA α1 haplodeficient mouse model62, but the growth pathways have yet to be identified. It is also important to note that in addition to skeletal muscle, other cells such as cardiomyocytes, adipocytes, and glial cells also express both α2 and α1 NKA. Increased cardiac expression of genes associated with the β-oxidation of lipids in the global NKA α1 haplodeficient mouse is one of the very few data available for comparison to date63, which emphasizes the need for additional tissue-specific genetic approaches. Thus, it remains to be investigated how much of the impact of tissue-specific NKA α1 ablation on skeletal muscle metabolism reported here applies to other tissues expressing more than one NKA isoform. Additionally, total expression of a protein assessed by Western blotting does not document its cellular distribution and/or function. Finally, because the skα1−/− mice were generated on a dominant FVB mixed-strain background, which caused them to accumulate less fat mass than C57BL6 mice fed a WD (Figure 8), we recognize that the genetic background of our transgenic animal model may influence or limit our conclusions about the impact of skeletal muscle α1 ablation on the development of metabolic syndrome15,41.
Additionally, there are a few contradictions between the skα1−/− phenotype and the current accepted links between increased running endurance to better health outcomes, including improvements in insulin sensitivity and glucose tolerance6,39, and the potential negative impacts of ablating NKA α1 and its signaling should not be overlooked. The association between severely attenuated mitochondrial metabolism and decreased susceptibility to diet-induced metabolic dysfunction is, however, consistent with the hypothesis that incomplete β oxidation of lipids and not the lack of mitochondrial metabolism is responsible for insulin resistance5,57. Moreover, the lack of exercise endurance in skα1−/− mice is consistent with studies that have clearly demonstrated a positive correlation between increased exercise endurance and higher α1 NKA expression in the muscle of inbred rats61.
Conclusion.
In short, the data presented here describe a common mechanism underlying the following dichotomy: the generation of metabolic reserve and flexibility in the muscle, and consequently exercise endurance, comes at the cost of metabolic intolerance to a Western diet. These new molecular insights, together with the findings from previous studies utilizing pNaKtide, suggest that the α1 NKA/Src interaction can be a novel molecular target for the development of new pharmacological approaches to treating metabolic disorders. The unfavorable characteristics of the sk1−/− phenotype also emphasizes the importance of maintaining adequate NKA α1 expression and function for muscle growth and metabolism as pNaKtide and its derivatives are explored further as drug candidates for NASH and other metabolic disorders.
Materials and Methods
Reagents.
The polyclonal anti-NKA α1 antiserum NASE and polyclonal anti-NKA α2 antiserum HERED used for Western blots were raised in rabbits and were generous gifts from Drs. T. Pressley and P. Artigas at Texas Tech University Health Sciences Center (40). Anti-α tubulin antibody (Sigma, catalog number T5168) was used as a loading control. Secondary antibodies were horseradish peroxidase-conjugated anti-rabbit and anti-mouse from Santa Cruz Biotechnology Inc (catalog number sc-2004 and sc-2005, respectively).
Cell Culture.
Site-directed mutagenesis and generation of mutant-rescued stable cell lines.
Mutant cell lines used in this work were derived from LLC-PK1 cells (ATCC). The generation of α1 NKA knock down PY-17 cells from LLC-PK1 has been described in details30. PY-17 cells express about 8% of α1 NKA in comparison to that in LLC-PK1 cells, and do not express other isoforms of NKA. Using the well-established protocol of knockdown and rescue, we have generated a number of stable cell lines12,22,32. The generation and characterization of the α1-rescued AAC-19 cells, α1 mutant-rescued A420P, α2-rescued LX-α2, and α2 mutant-rescued cells used in this study have been reported22,23,30,32. Src binding sequences and Src signaling status published for each line used in this study is summarized in Table S2. After cells reached 95–100% confluence, they were serum-starved overnight and used for experiments unless indicated otherwise. All cell lines were all cultured in DMEM plus 10% FBS with 1% penicillin/streptomycin.
Cell Growth Assay.
Cell growth assay was performed as previously described31. Briefly, 20,000 cells/well were seeded in triplicates in 12-well plates in glucose-free DMEM containing 10% FBS and 1% penicillin/streptomycin. Cells were serum-starved for at least 12 hours to achieve cell cycle synchronization. At indicated time points, cells were trypsinized, and the number of cells was counted with a hemocytometer.
Biochemical measurement of ATP and lactate.
ATP measurements were performed using CellTiter-Glo Luminescent Cell Viability Assay Kit (Promega, Madison, WI, USA, Cat # G7570). According to the protocol provided by the manufacture, 10,000 cells per well were cultured in 96-well culture plate. After treatment with 2-DG (Sigma-Aldrich, Cat# D6134) at indicated concentrations in serum-free DMEM for 45 minutes, assay reagents were reconstituted and added into culture plate. Afterwards, reactants were transferred to opaque-walled 96-well plate, and luminescent counts were determined with microplate reader.
Lactate measurement was done as described by Barker64.
Media glucose depletion.
Media was collected from cells after 3 days incubation. Glucose concentration in the media was measured using a Glucose Colorimetric Assay Kit from Cayman Chemical (Item no. 10009582, Ann Arbor, Michigan, USA). Glucose concentrations were subtracted from the glucose concentration in fresh media to determine media glucose depletion by each cell line, and then normalized to the number of cells as determined by trypsinizing, pelleting, resuspending, and counting with a hemocytometer, so that the final number from each experiment was derived from the following equation:
Cell proliferation in glucose-deprived media.
Cells were plated and grown in media consisting of glucose-free DMEM, 10% FBS, and 1% Penicillin/Streptomycin, and cell number was counted after 0, 24, 36, and 48 hours of proliferation.
Seahorse metabolic flux analysis.
Cells were plated in Seahorse XFp cell culture plates and subjected to both the mitochondrial stress test (Agilent Technologies, Cat # 103010-100) and the glycolytic stress test (Agilent Technologies, Cedar Creek, TX, US, Cat #103017-100) supplied by the manufacturer, with the injection of oligomycin, trifluoromethoxy carbonylcyanide phenylhydrazone (FCCP), rotenone and antimycin A, glucose, and 2-deoxyglucose (2-DG), as described in Table S3. Three measurements of oxygen consumption rate and extracellular acidification rate were taken at baseline and after each injection. The appropriate concentration of FCCP was determined by FCCP titration as recommended by the manufacturer, and all future experiments were performed with this concentration of FCCP (1.0 nM).
Animals.
Mice with floxed endogenous NKA α1 isoform from Dr. Gustavo Blanco at Kansas University Medical Center were crossed with FVB.Cg-Myod1tm2.1(icre)Glh/Jmice purchased from Jackson Labs. Mice homozygous for floxed α1 (α1flox/flox) and heterozygous for MyoDiCre (MyoDiCre/WT) were bred with α1flox/flox MyoDWT/WT mice, resulting in litters of α1flox/flox MyoDiCre/WT (skα1−/−) mice with α1flox/flox MyoDWT/WT controls (skα1+/+). Skα1−/− mice were born with the expected Mendelian frequency and appeared normal. Skα1−/− mice and skα1+/+ control littermates were housed in 12-hour light and dark cycles at constant temperature and humidity. All animal procedures were approved by the Marshall University Institutional Animal Care and Use Committee.
Blood lactate testing.
Blood lactate was determined using a Lactate Plus Meter (Nova Biomedical, Waltham, MA, USA) on blood obtained from conscious, fed mice using a tail clip.
Treadmill testing.
12-week-old male and female skα1−/− mice and litter mate controls were placed in the six lanes of an Exer 3/6 treadmill from Columbus Instruments equipped with a shock detection system. Animals were acclimated to the treadmill for 3 days at 5 m/min for 5 minutes at a 5° angle and were subjected to the testing protocol on the fourth day. Mice began the testing protocol running at 5 m/m for five minutes and increased by 2 m/min each minute up to 25 m/min, then continued running at 25 m/min until they reached fatigue. Each shock administered and each visit to the shock grid was recorded for each animal. Fatigue was defined as 10 consecutive seconds spent on the shock grid, and the shock was discontinued to each mouse upon reaching fatigue.
Tissue collection.
Mice were anesthetized with 50 mg/kg pentobarbital administered via IP injection. Tissues were dissected and weighed. Muscles used for Western blot analysis, qPCR, or enzymatic activity assays were flash frozen in liquid nitrogen then stored at −80° C until later use. Muscles used for histological analysis were fixed in 10% neutrally buffered formalin for 24 hours then stored in 70% ethanol until they were embedded in paraffin blocks.
Western blot.
Gastrocnemius muscles were first powdered in liquid nitrogen before homogenizing in ice-cold radioimmunoprecipitation (RIPA) buffer (0.25% sodium deoxycholate, 1% Nonidet P-40, 1mM EDTA, 1mM PMSF, 1mM sodium orthovanadate, 1mM Sodium fluoride, 150 mM NaCl, 50 mM Tris-HCl, pH 7.4 and 1% protease inhibitor cocktail) with a Potter-Elvehjem tissue homogenizer. Homogenates were centrifuged at 14,000 × g for 15 min, supernatants were collected, and the protein content was measured using DC Protein Assay Kit from BioRad (catalog number 500–0114 and 500–0113). Protein loading was determined by first establishing a linear range for each protein analyzed, and loading protein amounts within the linear range. Each gel included at least 2 control samples to allow for a semi-quantitative analysis of relative protein expression. Equal amounts of protein of each sample were loaded, separated by SDS-PAGE on a 10% bis acrylamide gel with a 4% stacking gel at 65 V for 30 minutes for stacking and 100V for 2 hours to separate, and transferred to nitrocellulose membranes except for Src, which was transferred to 0.2 μm PVDF membranes. Transfers were performed using the BioRad TransBlot Turbo semi-dry transfer apparatus using the 7 minute turbo transfer. Membranes probed for α1, α2, total Akt, total ERK, total GSK-3β, total Src, and actin were blocked in 5% milk in Tris-buffered saline with Tween-20 (TBST), while membranes probed for p-Akt, p-ERK, and p-GSK-3β were blocked in 5% BSA in TBST. Primary antibodies were added overnight in blocking buffer at 4°C. Membranes were washed thrice with TBST, and secondary antibodies were added for 1 hour in blocking buffer at room temperature. Membranes were visualized with Western Lightning® Plus-ECL (Western Lightning) and radiographic film. Densitometric quantification was performed using ImageJ software from the National Institute of Health, and all results were normalized to actin expression as a loading control. Relative expression was normalized to the appropriate controls, as indicated in the Y-axis of each graph.
RT-qPCR.
RNA was extracted from tissues and cells using TRIzol Reagent (Life Technologies Corporation, Carlsbad, CA, USA) according to manufacturer’s instructions. Briefly, tissues were homogenized in 1 ml of TRIzol on ice, then incubated at room temperature for 5 minutes. 200 μl of chloroform was added to each sample and shaken to mix well, then incubated at room temperature for 2–3 minutes. Samples were centrifuged at 12000 xg for 15 minutes at 4°C, and the aqueous layer was transferred to a clean RNAse-free tube. The RNA was precipitated by adding 500 μl of isopropanol and incubating at 4°C for 10 minutes, then centrifuging at 12000 xg for 10 minutes. The pellet was then washed with 1 ml 75% ethanol, vortexed, and then centrifuged at 7500 xg for 5 minutes at 4°C. The ethanol was removed and the pellet was allowed to dry at room temperature for 10–15 minutes before suspending the pellet in RNase-free water. The amount and quality of extracted RNA was measured using the Nanodrop 2000 (Thermo Scientific, Waltham, MA, USA), and the average RNA concentration and A260/280 ratio for each type of sample is reported in Table S5. SuperScript III First-Strand Synthesis SuperMix for qRT-PCR (Life Technologies Corporation, Carlsbad, CA, USA) was used to synthesize first-strand cDNA. Gene expression was analyzed by real-time quantitative RT-PCR using the LightCylcer 480 SYBR Green I Master mix (Roche, Indianapolis, IN, USA) using a LightCycler 480 Instrument II (Roche, Indianapolis, IN, USA). Relative expression was calculated using the comparative Ct method with data normalized to Actab (liver and skeletal muscle), Rn18s (adipose), or Gapdh (AAC-19, LX-α2, and LY-a2 cell lines) as previously described65. RNA quality is reported in Table S5, and primer sequences are listed in Table S6.
RNA sequencing and data analysis.
RNA was extracted from whole gastrocnemius muscles using a combination of TRIzol Reagent (Life Technologies Corporation, Carlsbad, CA, USA) and an RNeasy kit (Qiagen, Hillden, Germany) the method described by Bhatnagar, Panguluri, Kumar66. RNA sequencing was performed by Novogene (Sacramento, CA, USA). A heatmap of the top 70 differential expressed genes were visualized by log2 normalized fragments per kilobase million (Fpkm), using cytoscape 3.7.167 and clusterMaker268. Gene Ontology (GO) enrichment were analyzed using BiNGO69, and then visualized using EnrichmentMap70.
Membrane fractionation.
Crude membrane fractions were prepared from frozen α1+/− and α1+/+ gastrocnemius muscles following a procedure modified from Walas and Juel71. Frozen muscles were ground into a fine powder with a mortar and pestle. The resulting powder was homogenized in ice-cold fractionation buffer (250 mM mannitol, 30 mM L-histidine, 5 mM EGTA and 0.1% deoxycholate, adjusted to pH 6.8 with Tris-base) for 30 seconds with a Fisher Tissue Meiser handheld homogenizer. The crude homogenate was centrifuged at 3000xg for 30 minutes and the supernatant was then centrifuged at 190,000xg for 90 minutes. The pellet was resuspended in 30 mM histidine, 250 mM sucrose, and 1 mM EDTA, pH 7.4, and protein concentration was determined using the DC Protein Assay Kit from BioRad (catalog number 500-0114 and 500-0113).
ATPase activity assay.
Ouabain-sensitive ATPase activity in crudes membrane fractions was determined by measuring ATP hydrolysis as previously described72,73. Released inorganic phosphate (Pi) was detected using a malachite-based Biomol Green reagent. Samples containing 10 μg of protein were added to a reaction mix containing 20 mM Tris-HCL, 1 mM MgCl2, 100 mM NaCl, 20 mM KCl, and 1 mM EGTA-Tris, pH 7.2. Ouabain was added to the samples to a final concentration of 1 mM to completely inhibit both α1 and α2 isoforms of the NKA. After 10 minutes of preincubation at room temperature, the reaction was started by adding Mg-ATP at a final concentration of 2.25 mM and incubation at 37°C with shaking for 30 minutes. The reaction was stopped with the addition of ice-cold 8% TCA, and the concentration of Pi was measured spectrophotometrically at OD 620 nm using Biomol Green as an indicator (Enzo Life Sciences catalog # BML-AK111-250). Maximal NKA activity was calculated as the difference between ATPase activity obtained in the absence or presence of 1 mM ouabain.
Immunohistochemistry.
Muscles were collected and then washed twice with ice-cold PBS, fixed with 10% neutrally buffered formalin for 24 hours, and embedded in paraffin. Transverse sections of the midbelly were immunostained for myosin heavy chain (Myhc) fast and Myhc slow by Wax-It Histology Services Inc. (Vancouver, CA), as described by Behan et al74 to differentiate between type 1 and type 2 fibers. Additional sections were stained for NKA α1 and for p-Src by Wax-It, Inc. (Vancouver, Canada). The samples were examined on a Leica confocal SP5 microscopes (Leica Microsystems, Wetzlar, Germany). The images were processed with the Leica Application Suite Advanced Fluorescence (LAS/AF) suite (Leica Microsystems, Wetzlar, Germany), FIJI platform, and the GNU Image Manipulation Program (GIMP) to obtain maximum projections, extract lateral slices, and construct figures.
Morphometric tissue analysis (CSA and fiber types).
Images of muscles stained for fast and slow myosin heavy chain were obtained by Wax-It, Inc. with digital whole-slide scanning. Aperio ImageScope software was used to determine the cross sectional area (CSA) of each fiber. Fibers that had been damaged were excluded from CSA analysis. Every fiber of each type in each muscle was counted to determine the average number of fibers per muscle.
Western diet study.
6–8-week-old male mice were placed on a 42% fat diet with 4.2g/L fructose water with controls on a normal chow diet for 12 weeks. Glucose tolerance tests were performed at 6 weeks and insulin tolerance tests were performed at 12 weeks. Tissues were collected and weighed after 12 weeks of diet treatment, and flash frozen in liquid nitrogen or fixed in 10% neutrally buffered formalin for 24 hours then transferred to 70% ethanol for shipment to Wax-It Histology Services Inc., for paraffin embedding and hematoxylin and eosin staining.
pNaKtide diet study.
12-week-old male C57BL/6 mice were ordered from Jackson Labs and randomized to receive normal chow + vehicle, Western diet (42% fat chow with 4.2g/L fructose water) + vehicle, or Western diet + 5 mg/kg pNaKtide for 12 weeks. pNaKtide was dissolved in phosphate-buffered saline and administered via intraperitoneal injection every 2 days, while vehicle-treated mice received phosphate-buffered saline via intraperitoneal injection every 2 days. Body composition was measured using an Echo-MRI (EchoMRI, Houston, TX, USA). Tissues were collected after 12 weeks of treatment and either fixed in 10% neutrally buffered formalin or flash frozen in liquid nitrogen for future studies.
Glucose Tolerance Test.
Fasting blood glucose was measured from the tail vein using a OneTouch Ultra glucometer after a 6 hour fast. A 20% glucose solution was administered via intraperitoneal injection at a dose of 2 g/kg BW. Blood glucose was measured from the tail vein at 15, 30, 45, 60, 90, and 120 minutes post injection. The area under the curve was calculated to determine insulin resistance.
Insulin Tolerance Test.
Fasting blood glucose was measured from the tail vein using a OneTouch Ultra glucometer after a 6 hour fast. Insulin (0.15 units/mL) was administered via intraperitoneal injection at a dose of 0.75 units/kg BW. Blood glucose was measured from the tail vein at 15, 30, 45, 60, 90, and 120 minutes post injection. The area under the curve was calculated to determine insulin resistance.
Data Analysis.
Data presented are mean ± S.E.M, and statistical analysis was performed using the Student’s t test. When more than two groups were compared, one-way ANOVA was performed prior to post-hoc comparison of individual groups using Dunnett’s multiple comparison test. Significance was accepted at P < 0.05.
Supplementary Material
Acknowledgements
We thank Lanqing Wu and the Division of Animal Resources of the Marshall University Joan C. Edwards School of Medicine for animal care and husbandry, Dr. Jung Han Kim for the use of equipment, and Carla Cook for invaluable technical support. We also thank David Neff and The Marshall University Molecular and Biological Imaging Center for microscopy equipment and support. This work was supported by a grant from the National Heart, Lung, and Blood Institute (HL145666) to S.V.P. Fellowship funding was provided by the West Virginia Space Grant Consortium to K.C.T., and by the Marshall University Undergraduate Creative Discovery and Research Scholar Award Program to A.J.M.
Footnotes
Conflict of Interest
There is no conflict of interest to declare.
References
- 1.Su Z, Klein JD, Du J, et al. Chronic kidney disease induces autophagy leading to dysfunction of mitochondria in skeletal muscle. American journal of physiology Renal physiology. 2017;312(6):F1128–f1140. [DOI] [PMC free article] [PubMed] [Google Scholar]
- 2.Galgani JE, Moro C, Ravussin E. Metabolic flexibility and insulin resistance. American journal of physiology Endocrinology and metabolism. 2008;295(5):E1009–1017. [DOI] [PMC free article] [PubMed] [Google Scholar]
- 3.Peterzan MA, Lygate CA, Neubauer S, Rider OJ. Metabolic remodeling in hypertrophied and failing myocardium: a review. American journal of physiology Heart and circulatory physiology. 2017;313(3):H597–h616. [DOI] [PubMed] [Google Scholar]
- 4.Poussin C, Ibberson M, Hall D, et al. Oxidative phosphorylation flexibility in the liver of mice resistant to high-fat diet-induced hepatic steatosis. Diabetes. 2011;60(9):2216–2224. [DOI] [PMC free article] [PubMed] [Google Scholar]
- 5.Koves TR, Ussher JR, Noland RC, et al. Mitochondrial overload and incomplete fatty acid oxidation contribute to skeletal muscle insulin resistance. Cell metabolism. 2008;7(1):45–56. [DOI] [PubMed] [Google Scholar]
- 6.Overmyer KA, Evans CR, Qi NR, et al. Maximal oxidative capacity during exercise is associated with skeletal muscle fuel selection and dynamic changes in mitochondrial protein acetylation. Cell metabolism. 2015;21(3):468–478. [DOI] [PMC free article] [PubMed] [Google Scholar]
- 7.Goodpaster BH, Sparks LM. Metabolic Flexibility in Health and Disease. Cell metabolism. 2017;25(5):1027–1036. [DOI] [PMC free article] [PubMed] [Google Scholar]
- 8.Carson JA, Hardee JP, VanderVeen BN. The emerging role of skeletal muscle oxidative metabolism as a biological target and cellular regulator of cancer-induced muscle wasting. Seminars in cell & developmental biology. 2016;54:53–67. [DOI] [PMC free article] [PubMed] [Google Scholar]
- 9.Cui X, Xie Z. Protein Interaction and Na/K-ATPase-Mediated Signal Transduction. Molecules (Basel, Switzerland). 2017;22(6). [DOI] [PMC free article] [PubMed] [Google Scholar]
- 10.Banerjee M, Cui X, Li Z, et al. Na/K-ATPase Y260 Phosphorylation-mediated Src Regulation in Control of Aerobic Glycolysis and Tumor Growth. Scientific reports. 2018;8(1):12322. [DOI] [PMC free article] [PubMed] [Google Scholar]
- 11.Schneditz G, Elias JE, Pagano E, et al. GPR35 promotes glycolysis, proliferation, and oncogenic signaling by engaging with the sodium potassium pump. Science signaling. 2019;12(562). [DOI] [PMC free article] [PubMed] [Google Scholar]
- 12.Yan Y, Shapiro AP, Haller S, et al. Involvement of reactive oxygen species in a feed-forward mechanism of Na/K-ATPase-mediated signaling transduction. The Journal of biological chemistry. 2013;288(47):34249–34258. [DOI] [PMC free article] [PubMed] [Google Scholar]
- 13.Sodhi K, Maxwell K, Yan Y, et al. pNaKtide inhibits Na/K-ATPase reactive oxygen species amplification and attenuates adipogenesis. Science advances. 2015;1(9):e1500781. [DOI] [PMC free article] [PubMed] [Google Scholar] [Retracted]
- 14.Sodhi K, Nichols A, Mallick A, et al. The Na/K-ATPase Oxidant Amplification Loop Regulates Aging. Scientific reports. 2018;8(1):9721. [DOI] [PMC free article] [PubMed] [Google Scholar] [Retracted]
- 15.Sodhi K, Srikanthan K, Goguet-Rubio P, et al. pNaKtide Attenuates Steatohepatitis and Atherosclerosis by Blocking Na/K-ATPase/ROS Amplification in C57Bl6 and ApoE Knockout Mice Fed a Western Diet. Scientific reports. 2017;7(1):193. [DOI] [PMC free article] [PubMed] [Google Scholar] [Retracted]
- 16.Srikanthan K, Shapiro JI, Sodhi K. The Role of Na/K-ATPase Signaling in Oxidative Stress Related to Obesity and Cardiovascular Disease. Molecules (Basel, Switzerland). 2016;21(9). [DOI] [PMC free article] [PubMed] [Google Scholar]
- 17.Liu L, Wu J, Kennedy DJ. Regulation of Cardiac Remodeling by Cardiac Na(+)/K(+)-ATPase Isoforms. Frontiers in physiology. 2016;7:382. [DOI] [PMC free article] [PubMed] [Google Scholar]
- 18.Zhuang L, Xu L, Wang P, et al. Na+/K+-ATPase alpha1 subunit, a novel therapeutic target for hepatocellular carcinoma. Oncotarget. 2015;6(29):28183–28193. [DOI] [PMC free article] [PubMed] [Google Scholar]
- 19.Gerbi A, Maixent JM, Barbey O, et al. Alterations of Na,K-ATPase isoenzymes in the rat diabetic neuropathy: protective effect of dietary supplementation with n-3 fatty acids. Journal of neurochemistry. 1998;71(2):732–740. [DOI] [PubMed] [Google Scholar]
- 20.Tepavcevic S, Milutinovic DV, Macut D, et al. Cardiac Nitric Oxide Synthases and Na(+)/K(+)-ATPase in the Rat Model of Polycystic Ovary Syndrome Induced by Dihydrotestosterone. Experimental and clinical endocrinology & diabetes : official journal, German Society of Endocrinology [and] German Diabetes Association. 2015;123(5):303–307. [DOI] [PubMed] [Google Scholar]
- 21.Na Blanco G.,K-ATPase subunit heterogeneity as a mechanism for tissue-specific ion regulation. Seminars in nephrology. 2005;25(5):292–303. [DOI] [PubMed] [Google Scholar]
- 22.Lai F, Madan N, Ye Q, et al. Identification of a mutant alpha1 Na/K-ATPase that pumps but is defective in signal transduction. The Journal of biological chemistry. 2013;288(19):13295–13304. [DOI] [PMC free article] [PubMed] [Google Scholar]
- 23.Yu H, Cui X, Zhang J, et al. Heterogeneity of signal transduction by Na-K-ATPase alpha-isoforms: role of Src interaction. American journal of physiology Cell physiology. 2018;314(2):C202–c210. [DOI] [PMC free article] [PubMed] [Google Scholar]
- 24.DiFranco M, Hakimjavadi H, Lingrel JB, Heiny JA. Na,K-ATPase alpha2 activity in mammalian skeletal muscle T-tubules is acutely stimulated by extracellular K+. The Journal of general physiology. 2015;146(4):281–294. [DOI] [PMC free article] [PubMed] [Google Scholar]
- 25.Holmstrom MH, Iglesias-Gutierrez E, Zierath JR, Garcia-Roves PM. Tissue-specific control of mitochondrial respiration in obesity-related insulin resistance and diabetes. American journal of physiology Endocrinology and metabolism. 2012;302(6):E731–739. [DOI] [PubMed] [Google Scholar]
- 26.Honka MJ, Latva-Rasku A, Bucci M, et al. Insulin-stimulated glucose uptake in skeletal muscle, adipose tissue and liver: a positron emission tomography study. European journal of endocrinology. 2018;178(5):523–531. [DOI] [PMC free article] [PubMed] [Google Scholar]
- 27.Neufer PD, Carey JO, Dohm GL. Transcriptional regulation of the gene for glucose transporter GLUT4 in skeletal muscle. Effects of diabetes and fasting. The Journal of biological chemistry. 1993;268(19):13824–13829. [PubMed] [Google Scholar]
- 28.Zurlo F, Larson K, Bogardus C, Ravussin E. Skeletal muscle metabolism is a major determinant of resting energy expenditure. The Journal of clinical investigation. 1990;86(5):1423–1427. [DOI] [PMC free article] [PubMed] [Google Scholar]
- 29.Li Z, Cai T, Tian J, et al. NaKtide, a Na/K-ATPase-derived peptide Src inhibitor, antagonizes ouabain-activated signal transduction in cultured cells. The Journal of biological chemistry. 2009;284(31):21066–21076. [DOI] [PMC free article] [PubMed] [Google Scholar]
- 30.Liang M, Cai T, Tian J, Qu W, Xie ZJ. Functional characterization of Src-interacting Na/K-ATPase using RNA interference assay. The Journal of biological chemistry. 2006;281(28):19709–19719. [DOI] [PubMed] [Google Scholar]
- 31.Liang M, Tian J, Liu L, et al. Identification of a pool of non-pumping Na/K-ATPase. The Journal of biological chemistry. 2007;282(14):10585–10593. [DOI] [PubMed] [Google Scholar]
- 32.Xie J, Ye Q, Cui X, et al. Expression of rat Na-K-ATPase alpha2 enables ion pumping but not ouabain-induced signaling in alpha1-deficient porcine renal epithelial cells. American journal of physiology Cell physiology. 2015;309(6):C373–382. [DOI] [PMC free article] [PubMed] [Google Scholar]
- 33.Liu L, Li J, Liu J, et al. Involvement of Na+/K+-ATPase in hydrogen peroxide-induced hypertrophy in cardiac myocytes. Free radical biology & medicine. 2006;41(10):1548–1556. [DOI] [PubMed] [Google Scholar]
- 34.Ye Q, Lai F, Banerjee M, et al. Expression of mutant alpha1 Na/K-ATPase defective in conformational transition attenuates Src-mediated signal transduction. The Journal of biological chemistry. 2013;288(8):5803–5814. [DOI] [PMC free article] [PubMed] [Google Scholar]
- 35.Pirkmajer S, Chibalin AV. Na,K-ATPase regulation in skeletal muscle. American journal of physiology Endocrinology and metabolism. 2016;311(1):E1–e31. [DOI] [PubMed] [Google Scholar]
- 36.He S, Shelly DA, Moseley AE, et al. The alpha(1)- and alpha(2)-isoforms of Na-K-ATPase play different roles in skeletal muscle contractility. American journal of physiology Regulatory, integrative and comparative physiology. 2001;281(3):R917–925. [DOI] [PubMed] [Google Scholar]
- 37.Manoharan P, Radzyukevich TL, Hakim Javadi H, et al. Phospholemman is not required for the acute stimulation of Na(+)-K(+)-ATPase alpha(2)-activity during skeletal muscle fatigue. American journal of physiology Cell physiology. 2015;309(12):C813–822. [DOI] [PMC free article] [PubMed] [Google Scholar]
- 38.Radzyukevich TL, Neumann JC, Rindler TN, et al. Tissue-specific role of the Na,K-ATPase alpha2 isozyme in skeletal muscle. The Journal of biological chemistry. 2013;288(2):1226–1237. [DOI] [PMC free article] [PubMed] [Google Scholar]
- 39.Baker JS, McCormick MC, Robergs RA. Interaction among Skeletal Muscle Metabolic Energy Systems during Intense Exercise. Journal of nutrition and metabolism. 2010;2010:905612. [DOI] [PMC free article] [PubMed] [Google Scholar]
- 40.Tian J, Li X, Liang M, et al. Changes in sodium pump expression dictate the effects of ouabain on cell growth. The Journal of biological chemistry. 2009;284(22):14921–14929. [DOI] [PMC free article] [PubMed] [Google Scholar]
- 41.Nascimento-Sales M, Fredo-da-Costa I, Borges Mendes ACB, et al. Is the FVB/N mouse strain truly resistant to diet-induced obesity? Physiological reports. 2017;5(9). [DOI] [PMC free article] [PubMed] [Google Scholar]
- 42.Devarshi PP, McNabney SM, Henagan TM. Skeletal Muscle Nucleo-Mitochondrial Crosstalk in Obesity and Type 2 Diabetes. International journal of molecular sciences. 2017;18(4). [DOI] [PMC free article] [PubMed] [Google Scholar]
- 43.Rodriguez-Cuenca S, Carobbio S, Velagapudi VR, et al. Peroxisome proliferator-activated receptor gamma-dependent regulation of lipolytic nodes and metabolic flexibility. Molecular and cellular biology. 2012;32(8):1555–1565. [DOI] [PMC free article] [PubMed] [Google Scholar]
- 44.Andrzejewski S, Klimcakova E, Johnson RM, et al. PGC-1alpha Promotes Breast Cancer Metastasis and Confers Bioenergetic Flexibility against Metabolic Drugs. Cell metabolism. 2017;26(5):778–787. e775. [DOI] [PubMed] [Google Scholar]
- 45.Schonke M, Massart J, Zierath JR. Effects of high-fat diet and AMP-activated protein kinase modulation on the regulation of whole-body lipid metabolism. Journal of lipid research. 2018;59(7):1276–1282. [DOI] [PMC free article] [PubMed] [Google Scholar]
- 46.Zhang S, Hulver MW, McMillan RP, Cline MA, Gilbert ER. The pivotal role of pyruvate dehydrogenase kinases in metabolic flexibility. Nutrition & metabolism. 2014;11(1):10. [DOI] [PMC free article] [PubMed] [Google Scholar]
- 47.Goldhamer DJ, Brunk BP, Faerman A, King A, Shani M, Emerson CP Jr. Embryonic activation of the myoD gene is regulated by a highly conserved distal control element. Development (Cambridge, England). 1995;121(3):637–649. [DOI] [PubMed] [Google Scholar]
- 48.Ott MO, Bober E, Lyons G, Arnold H, Buckingham M. Early expression of the myogenic regulatory gene, myf-5, in precursor cells of skeletal muscle in the mouse embryo. Development (Cambridge, England). 1991;111(4):1097–1107. [DOI] [PubMed] [Google Scholar]
- 49.Bi P, Yue F, Sato Y, et al. Stage-specific effects of Notch activation during skeletal myogenesis. eLife. 2016;5. [DOI] [PMC free article] [PubMed] [Google Scholar]
- 50.Wang X, Cai L, Xie JX, et al. A caveolin binding motif in Na/K-ATPase is required for stem cell differentiation and organogenesis in mammals and C. elegans [Manuscript submitted for publication]. Marshall Institute for Interdisciplinary Research, Marshall University. 2019. [Google Scholar]
- 51.Nespolo RF, Solano-Iguaran JJ, Bozinovic F. Phylogenetic Analysis Supports the Aerobic-Capacity Model for the Evolution of Endothermy. The American naturalist. 2017;189(1):13–27. [DOI] [PubMed] [Google Scholar]
- 52.Xie Z, Kometiani P, Liu J, Li J, Shapiro JI, Askari A. Intracellular reactive oxygen species mediate the linkage of Na+/K+-ATPase to hypertrophy and its marker genes in cardiac myocytes. The Journal of biological chemistry. 1999;274(27):19323–19328. [DOI] [PubMed] [Google Scholar]
- 53.Li H, Yin A, Cheng Z, et al. Attenuation of Na/K-ATPase/Src/ROS amplification signal pathway with pNaktide ameliorates myocardial ischemia-reperfusion injury. International journal of biological macromolecules. 2018;118(Pt A):1142–1148. [DOI] [PubMed] [Google Scholar]
- 54.Bleau C, Karelis AD, St-Pierre DH, Lamontagne L. Crosstalk between intestinal microbiota, adipose tissue and skeletal muscle as an early event in systemic low-grade inflammation and the development of obesity and diabetes. Diabetes/metabolism research and reviews. 2015;31(6):545–561. [DOI] [PubMed] [Google Scholar]
- 55.Li F, Li Y, Duan Y, Hu CA, Tang Y, Yin Y. Myokines and adipokines: Involvement in the crosstalk between skeletal muscle and adipose tissue. Cytokine & growth factor reviews. 2017;33:73–82. [DOI] [PubMed] [Google Scholar]
- 56.van der Velden JL, Langen RC, Kelders MC, et al. Myogenic differentiation during regrowth of atrophied skeletal muscle is associated with inactivation of GSK-3beta. American journal of physiology Cell physiology. 2007;292(5):C1636–1644. [DOI] [PubMed] [Google Scholar]
- 57.Finck BN, Bernal-Mizrachi C, Han DH, et al. A potential link between muscle peroxisome proliferator- activated receptor-alpha signaling and obesity-related diabetes. Cell metabolism. 2005;1(2):133–144. [DOI] [PubMed] [Google Scholar]
- 58.Xu H, Ren X, Lamb GD, Murphy RM. Physiological and biochemical characteristics of skeletal muscles in sedentary and active rats. Journal of muscle research and cell motility. 2018;39(1–2):1–16. [DOI] [PubMed] [Google Scholar]
- 59.Murphy KT, Petersen AC, Goodman C, et al. Prolonged submaximal exercise induces isoform-specific Na+-K+-ATPase mRNA and protein responses in human skeletal muscle. American journal of physiology Regulatory, integrative and comparative physiology. 2006;290(2):R414–424. [DOI] [PubMed] [Google Scholar]
- 60.Mohr M, Thomassen M, Girard O, Racinais S, Nybo L. Muscle variables of importance for physiological performance in competitive football. European journal of applied physiology. 2016;116(2):251–262. [DOI] [PubMed] [Google Scholar]
- 61.Chen J, Feller GM, Barbato JC, et al. Cardiac performance in inbred rat genetic models of low and high running capacity. The Journal of physiology. 2001;535(Pt 2):611–617. [DOI] [PMC free article] [PubMed] [Google Scholar]
- 62.Kutz LC, Mukherji ST, Wang X, et al. Isoform-specific role of Na/K-ATPase alpha1 in skeletal muscle. American journal of physiology Endocrinology and metabolism. 2018. [DOI] [PMC free article] [PubMed] [Google Scholar]
- 63.Moseley AE, Huddleson JP, Bohanan CS, et al. Genetic profiling reveals global changes in multiple biological pathways in the hearts of Na, K-ATPase alpha 1 isoform haploinsufficient mice. Cellular physiology and biochemistry : international journal of experimental cellular physiology, biochemistry, and pharmacology. 2005;15(1–4):145–158. [DOI] [PubMed] [Google Scholar]
- 64.Barker SB, Summerson WH. The Colorimetric Determincation of Lactic Acid in Biological Material. Journal of Biological Chemistry. 1941;138(2):535–554. [Google Scholar]
- 65.Livak KJ, Schmittgen TD. Analysis of relative gene expression data using real-time quantitative PCR and the 2(-Delta Delta C(T)) Method. Methods (San Diego, Calif). 2001;25(4):402–408. [DOI] [PubMed] [Google Scholar]
- 66.Bhatnagar S, Panguluri SK, Kumar A. Gene profiling studies in skeletal muscle by quantitative real-time polymerase chain reaction assay. Methods in molecular biology (Clifton, NJ). 2012;798:311–324. [DOI] [PMC free article] [PubMed] [Google Scholar]
- 67.Shannon P, Markiel A, Ozier O, et al. Cytoscape: a software environment for integrated models of biomolecular interaction networks. Genome research. 2003;13(11):2498–2504. [DOI] [PMC free article] [PubMed] [Google Scholar]
- 68.Morris JH, Apeltsin L, Newman AM, et al. clusterMaker: a multi-algorithm clustering plugin for Cytoscape. BMC bioinformatics. 2011;12:436. [DOI] [PMC free article] [PubMed] [Google Scholar]
- 69.Maere S, Heymans K, Kuiper M. BiNGO: a Cytoscape plugin to assess overrepresentation of gene ontology categories in biological networks. Bioinformatics (Oxford, England). 2005;21(16):3448–3449. [DOI] [PubMed] [Google Scholar]
- 70.Merico D, Isserlin R, Stueker O, Emili A, Bader GD. Enrichment map: a network-based method for gene-set enrichment visualization and interpretation. PloS one. 2010;5(11):e13984. [DOI] [PMC free article] [PubMed] [Google Scholar]
- 71.Walas H, Juel C. Purinergic activation of rat skeletal muscle membranes increases V max and Na+ affinity of the Na,K-ATPase and phosphorylates phospholemman and α1 subunits. Pflügers Archiv - European Journal of Physiology. 2012;463(2):319–326. [DOI] [PubMed] [Google Scholar]
- 72.Belliard A, Gulati GK, Duan Q, et al. Ischemia/reperfusion-induced alterations of enzymatic and signaling functions of the rat cardiac Na+/K+-ATPase: protection by ouabain preconditioning. Physiological reports. 2016;4(19). [DOI] [PMC free article] [PubMed] [Google Scholar]
- 73.Belliard A, Sottejeau Y, Duan Q, Karabin JL, Pierre SV. Modulation of cardiac Na+,K+-ATPase cell surface abundance by simulated ischemia-reperfusion and ouabain preconditioning. American journal of physiology Heart and circulatory physiology. 2013;304(1):H94–103. [DOI] [PMC free article] [PubMed] [Google Scholar]
- 74.Behan WM, Cossar DW, Madden HA, McKay IC. Validation of a simple, rapid, and economical technique for distinguishing type 1 and 2 fibres in fixed and frozen skeletal muscle. Journal of clinical pathology. 2002;55(5):375–380. [DOI] [PMC free article] [PubMed] [Google Scholar]
Associated Data
This section collects any data citations, data availability statements, or supplementary materials included in this article.