Abstract
Chimeric antigen receptor (CAR) T cells showed great activity in hematologic malignancies. However, heterogeneous antigen expression in tumor cells and suboptimal CAR-T cell persistence remain critical aspects to achieve clinical responses in patients with solid tumors. Here we show that CAR-T cells targeting simultaneously two tumor-associated antigens and providing transacting CD28 and 4-1BB costimulation, while sharing the sane CD3ζ-chain cause rapid antitumor effects in in vivo stress conditions, protection from tumor re-challenge and prevention of tumor escape due to low antigen density. Molecular and signaling studies indicate that T cells engineered with the proposed CAR design demonstrate sustained phosphorylation of T cell receptor-associated (TCR) signaling molecules and a molecular signature supporting CAR-T cell proliferation and long-term survival. Furthermore, metabolic profiling of CAR-T cells displayed induction of glycolysis that sustains rapid effector T cell function, but also preservation of oxidative functions, which are critical for T cell long-term persistence.
Introduction
The development of successful CAR-T cells in solid tumors poses critical issues that include selection of the appropriate targets to prevent on-target, but off-tumor toxicity, simultaneous recognition of multiple targets to prevent tumor escape and protection from the immune suppressive tumor microenvironment1,2.
Several CARs targeting antigens in solid tumors are currently under clinical investigation with the primary endpoint to establish safety of the selected target1. However, the optimal construction of the next generation CARs recognizing simultaneously at least two antigens, and the definition of the most appropriate way to accommodate the intracytoplasmic signaling domains of the CARs remains challenging. Single CAR cassettes with dual targeting have been generated by fusing antigen binding moieties to one single CAR stem that provides costimulation and CD3ζ signaling3–7. The main disadvantage of this design is the difficulty to maintain the structural integrity of the assembled antigen binding moieties that have an intrinsic property to unfold8. Furthermore, while T cell costimulation provided by either CD28 or 4-1BB endodomains are equally effective in promoting clinical remission in patients with B-cell malignancies9,10, there is the a common perception in the field that dual CD28 and 4-1BB costimulation may promote rapid tumor regression via CD28 co-stimulation, but 4-1BB may be required to maintain long-term persistence of CAR-T cells9,11,12.
Optimal T cell costimulation is the first critical event to counter immunosuppression within the tumor microenvironment of solid tumors. Multiple costimulation in CAR-T cells has been achieved by either inclusion in tandem of two or three costimulatory endodomains (3rd generation CARs) or by suppling 4-1BB ligand to CAR-T cells that encode CD2813–16. However, reported clinical data did not demonstrate a significant advantage in term of objective clinical responses of 3rd generation CAR-T cells, yet suggesting that in cis costimulatory endodomains may not provide the spatial distribution of CD28 and 4-1BB costimulation required to promote optimal T cell activation and survival15,17,18.
Here, we propose an approach based on dual targeting, split costimulatory signaling and shared CD3ζ chain tailored to target two clinically relevant antigens - GD2 and B7-H3 - in the disease model of neuroblastoma (NB)19–21, and further validated the approach with an additional pair of targets, mesothelin (MSLN) and chondroitin sulphate proteoglycan 4 (CSPG4)22–24. We demonstrated that the designed strategy allows achieving rapid and sustained antitumor effects, which are sustained by optimized signaling, effector molecular signature and metabolic fitness of the CAR-T cells. Furthermore, dual antigen targeting prevents tumor escape when antigen expression in tumor cells is heterogeneous.
Results
Single or dual targeting do not eradicate tumor in stress conditions.
We used NB as a tumor model, and specifically two tumor cell lines (CHLA-255 and LAN-1) that co-express two targetable antigens, GD2 and B7-H3, as assessed by flow cytometry (Extended Data Fig. 1a). T cells engineered to express the GD2.28ζ, GD2.BBζ, B7-H3.28ζ, and B7-H3.BBζ CARs effectively eliminated tumor cells in vitro without any significant differences (Extended Data Fig. 1c–e). The cytolytic activity of CAR-T cells was corroborated by IFN-γ and IL-2 release in the culture supernatant (Extended Data Fig. 1f, g), and by T cell proliferation in response to NB cell lines (Extended Data Fig. 1h). GD2.28ζ, GD2.BBζ, B7-H3.28ζ and B7-H3.BBζ CAR-T cells controlled tumor growth in NSG mice engrafted with CHLA-255 when high dose of CAR-T cells (6 × 10⁶ CAR-T cells) was used (Extended Data Fig. 2a–d). In sharp contrast, when CAR-T cells were used in stress conditions such as those in which CHLA-255-bearing mice are treated with 2 × 10⁶ CAR-T cells (Fig. 1a), GD2.28ζ CAR-T cells exhibited superior tumor control as compared to GD2.BBζ, B7-H3.28ζ, and B7-H3.BBζ CAR-T cells (Fig. 1b–d). Similar results were observed in a second NB model in which mice were engrafted with LAN-1 cells (Extended Data Fig. 2e–h). Since GD2.28ζ CAR-T cells showed the most prominent antitumor activity, but do not fully eradicate the tumor at low doses, we tested if the addition of 4-1BB costimulation may lead to tumor eradication as previously described11. We provided 4-1BB costimulation in the form of a 3rd generation CAR (GD2.28.BBζ). We also constructed a vector encoding simultaneously the GD2.28ζ and B7-H3.BBζ CARs (GD2.28ζ/B7-H3.BBζ) to provide both dual specificity and dual costimulation using two independent CAR molecules. Both in vitro (Extended Data Fig. 3) and in vivo (Fig. 1e–h) experiments showed that GD2.28.BBζ and GD2.28ζ/B7-H3.BBζ CAR-T cells did not show superior antitumor activity compared to GD2.28ζ CAR-T cells in stress conditions. Overall, these data demonstrate that GD2.28ζ CAR-T cells are the most effective in controlling the tumor growth at low doses, but do not eradicate the tumor. Furthermore, 4-1BB costimulation provided either in the form of 3rd generation CAR or dual CARs does not enhance the therapeutic effect.
Figure 1. Single or dual antigen targeting and single or dual CD28 or 4-1BB costimulation do not eradicate the tumor in stress conditions.

(a) Schema of the CHLA-255 metastatic xenograft NB model in NSG mice inoculated via tail injection with FFLuc-labelled CHLA-255 cells and treated 14 days later with low doses of CAR-T cells targeting either GD2 (GD2.28ζ and GD2.BBζ) or B7-H3 (B7-H3.28ζ and B7-H3.BBζ) or control CD19.28ζ. (b,c) Representative tumor bioluminescence (BLI) images (b) and BLI kinetics (c) of FFLuc-CHLA-255 tumor growth in the metastatic xenograft NB model shown in (a) (n = 5 mice/group). (d) Kaplan-Meier survival curve of mice in (b, c) (n = 5 mice/group); Comparison of survival curves were determined by Log-rank test, **p = 0.0027 for CD19.28ζ vs. all other groups, **p = 0.0027 for GD2.28ζ vs. B7-H3.BBζ, GD2.BBζ vs. B7-H3.BBζ, and B7-H3.28ζ vs. B7-H3.BBζ, **p = 0.0018 for GD2.28ζ vs. GD2.BBζ, and GD2.28ζ vs. B7-H3.28ζ, **p = 0.0018 for GD2.BBζ vs. B7-H3.28ζ. (e) Schema of the CHLA-255 metastatic xenograft NB model in NSG mice inoculated via tail vein injection with FFLuc-labelled CHLA-255 cells and treated 14 days later with low doses of GD2.28ζ, GD2.28.BBζ, GD2.28ζ/B7-H3.BBζ, and control CD19.28ζ CAR-T cells. (f,g) Representative tumor BLI (f) and BLI kinetics (g) of FFLuc-CHLA-255 tumor growth in the metastatic xenograft NB models shown in (e) (n = 4 or 5 mice/group). (h) Kaplan-Meier survival curve of mice in (f,g) (n = 4 or 5 mice/group); Comparison of survival curves were determined by Log-rank test, **p = 0.0072 for CD19.28ζ vs. GD2.28ζ, **p = 0.0027 for CD19.28ζ vs. GD2.28.BBζ and CD19.28ζ vs. GD2.28ζ/B7-H3.BBζ, *p = 0.0350 for GD2.28ζ vs. GD2.28ζ/B7-H3.BBζ, *p = 0.0157 for GD2.28.BBζ vs. GD2.28ζ/B7-H3.BBζ.
One shared CD3ζ triggers dual CAR-T cells.
We hypothesized that GD2.28ζ/B7-H3.BBζ CAR-T cells may receive excessive CD3ζ signaling that compromises the beneficial effects of the dual targeting and dual costimulation. We thus generated a series of dual CARs encoded in a single retroviral vector to assess if a shared CD3ζ chain is sufficient to provide optimal activation signaling for dual antigen targeting, and the role of each single antigen recognition and costimulation in the dual target format (Fig. 2a). We found that GD2.28ζ, GD2.28ζ/B7-H3.BB and GD2.28ζ/dNGFR.BB CAR-Ts recognized the tumor cells as expected because they express a fully functional GD2.CAR. Similarly, B7-H3.BBζ CAR-T cells recognized tumor cells because they express a fully functional B7-H3.CAR, while B7-H3.BB CAR-T cells did not recognize the tumor because the CAR lacks CD3ζ (Fig. 2b–e). Remarkably, we found that B7-H3.BB CAR-T cells acquired cytolytic activity and released cytokines towards B7-H3+ tumor cells when they coexpressed either dNGFR.28ζ or 28ζ (Fig. 2b–e). This indicates that the incomplete B7-H3.BB CAR engaging the antigen can use the CD3ζ expressed in cis provided by another moiety that is not directly recognizing the antigen. Furthermore, when the B7-H3.BB CAR is coexpressed with the GD2.28ζ CAR, and when the two CARs are simultaneously engaging their antigens, CAR-T cells released significantly higher level of cytokines compared to GD2.28ζ CAR-T cells indicating that additional co-stimulatory effect is provided by 4-1BB (Fig. 2d,e). In T cells co-expressing the GD2.28ζ CAR and dNGFR.BB, which prevents the engagement of B7-H3, the additional effect of 4-1BB in promoting higher cytokine release was abolished, indicating that the costimulatory effect from 4-1BB is only mediated when both CARs engage their target antigen (Fig. 2d,e).
Figure 2. One single shared CD3ζ chain is sufficient for transducing the activation signal in dual specific CAR-T cells.
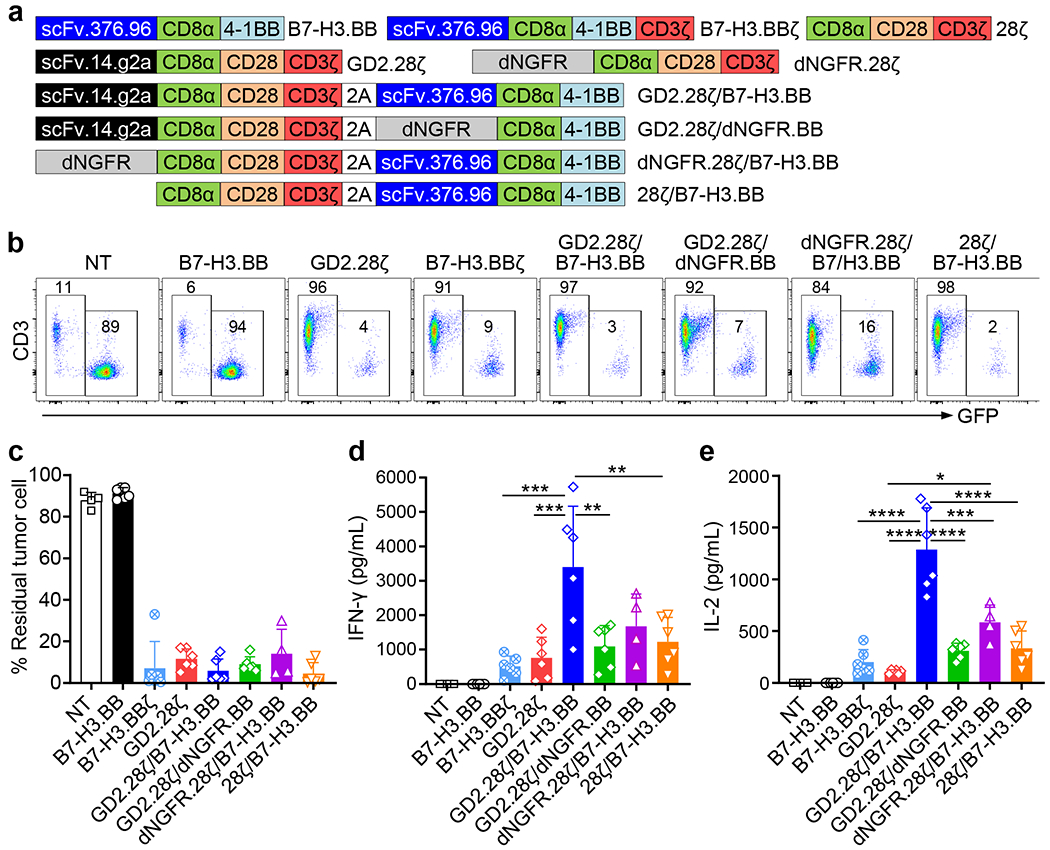
(a) Schematic representation of the retroviral vectors encoding B7-H3.BB, B7-H3.BBζ, GD2.28ζ, 28ζ, dNGFR.28ζ, GD2.28ζ/B7-H3.BB, GD2.28ζ/dNGFR.BB, dNGFR.28ζ/B7-H3.BB and 28ζ/B7-H3.BB. scFv.14.g2a, single-chain variable fragment of the anti-GD2 monoclonal antibody 14.g2a; scFv.276.96, single-chain variable fragment of the anti-B7-H3 monoclonal antibody 376.96; CD8α, the stalk and transmembrane region of human CD8α; CD28, intracellular domain of human CD28; 4-1BB, intracellular domain of human 4-1BB; CD3ζ, intracellular domain of human CD3ζ chain; dNGFR, extracellular domain of human nerve growth factor receptor. (b) Representative flow cytometry plots showing residual GFP-labelled CHLA-255 cells in co-culture experiments in which CAR-T cells and tumor cells were plated at the T cell to tumor cell ratio of 1 to 5, and tumor cells (GFP+) and T cells (CD3+) were numerated by flow cytometry at 5 days after co-culture. Representative of 4 independent experiments. (c-e) Summary of residual tumor cells (e), IFN-γ (d) and IL-2 (e) released by CAR-T cells in the co-culture experiments described in (B). NT, Non-transduced T cell; Data are shown as individual values and the mean + SD, n = 4 independent co-culture with CAR-T cells generated from 4 different donors for NT and dNGFR.28ζ/B7-H3.BB groups, n = 6 independent co-culture with CAR-T cells generated from 6 different donors for other groups; *p = 0.0119 in (e), **p = 0.0027 for GD2.28ζ/B7-H3.BB vs. GD2.28ζ/dNGFR.BB and **p = 0.0051 for GD2.28ζ/B7-H3.BB vs. 28ζ/B7-H3.BB in (d), ***p = 0.0002 for B7-H3.BBζ vs. GD2.28ζ/B7-H3.BB and ***p = 0.0005 for GD2.28ζ vs. GD2.28ζ/B7-H3.BB in (d), ***p = 0.0001 in (e), ****p <0.0001 in (c-e) by one-way ANOVA with Tukey’s multiple comparison test adjusted p value.
To investigate if two CAR molecules sharing one single CD3ζ form heterodimers after engaging their cognate antigens, we performed reducing and non-reducing gel separation and western blots. We found that in B7-H3.BB CAR-T cells co-expressing either dNGFR.28ζ or 28ζ molecules and stimulated with the B7-H3-Fc protein followed by cross linking with a secondary anti-Fc antibody, the B7-H3.BB CAR formed heterodimers or oligomers with dNGFR.28ζ or 28ζ molecules, while dimers or oligomers were not observed without antigen stimulation (Fig. 3a,b). Since the two cysteine residues located at the positions 164 and 181 in the CD8α stalk region are involved in the dimerization of CAR molecules25, we generated C164S and C181S mutations in the CD8 stalk (CD8m) and investigated if these two cysteine residues are critical in mediating the dimerization of the B7-H3.BB CAR with the dNGFR.28ζ or 28ζ molecules. CAR-T cells engineered with the constructs carrying the mutated cysteine residues did not show cytotoxic activity and cytokine release when co-cultured with the CHLA-255 cell line (Fig. 3c–f). To further investigate the role of antigen engagement in mediating the dimerization of the CAR molecules, we performed co-culture experiments using Raji cells genetically modified to express B7-H3, but lacking GD2 expression (Extended Data Fig. 4a). T cells co-expressing B7-H3.BB CAR and GD2.28ζ CAR, dNGFR.28ζ or 28ζ efficiently targeted B7-H3-expressing Raji cells, and released IFN-γ and IL-2, while T cells co-expressing the GD2.28ζ CAR and dNGFR.BB did not show antitumor activity (Extended Data Fig. 4b–d). Control co-cultures with wild type Raji cells, also did not show antitumor activity (Extended Data Fig. 4e–g) indicating that the cytolytic activity of dual CAR-T cells remains antigen depended.
Figure 3. CD3ζ sharing in the dual CAR relies on CD8α mediated dimerization.
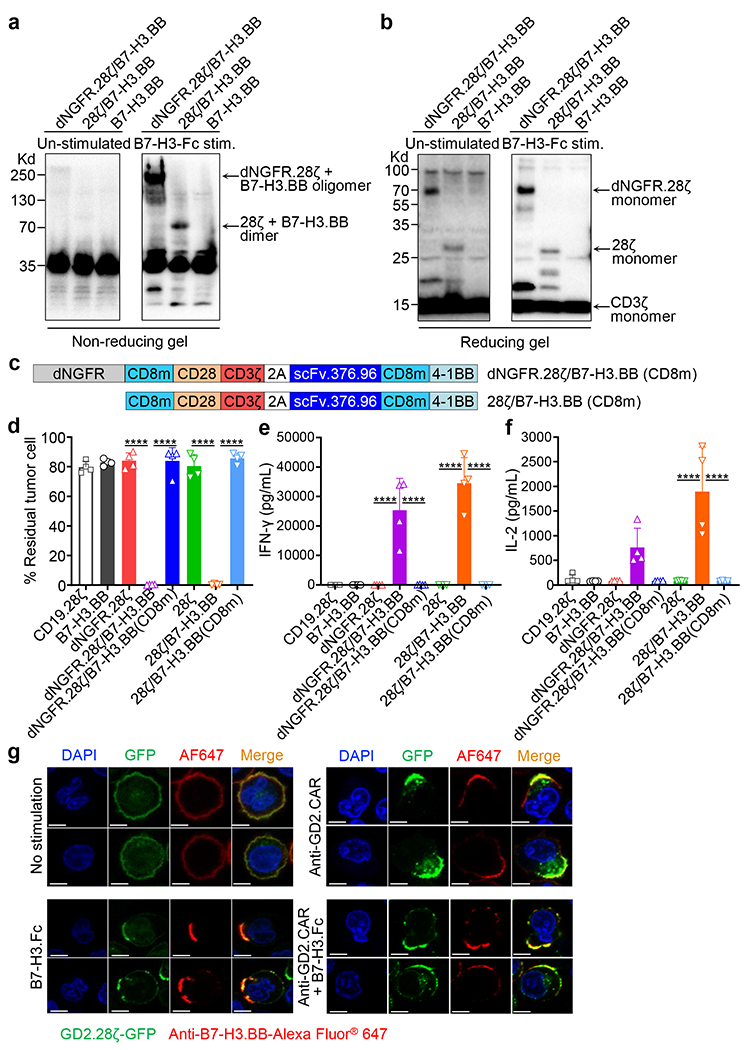
(a, b) T cells co-expressing B7-H3.BB and dNGFR.28ζ or 28ζ were stimulated with the B7-H3-Fc protein followed by incubation with an anti-Fc secondary Ab for 20 minutes at 37°C. Cells were then lysed in Laemmli buffer in non-reducing (without β-mercaptoethanol) (a) or reducing (with β-mercaptoethanol) (b) conditions for 10 minutes at 100°C, and separated on non-reducing gel or reducing gels. Membranes were stained with the anti-CD3ζ antibody. Data are representative of two independent experiments in (a, b). (c) Schematic representation of the retroviral vectors encoding dNGFR.28ζ/B7-H3.BB(CD8m) and 28ζ/B7-H3.BB(CD8m). CD8m, the stalk and transmembrane region of human CD8α that carrying the C164S and C181S mutations. (d-f) Summary of residual tumor cells (d), IFN-γ (e) and IL-2 (f) in the co-culture experiments of CAR-T cells with CHLA-255 at T cell to tumor cell ratio of 1 to 5. Data are shown as individual values and the mean + SD, n = 4 independent co-culture with CAR-T cells generated from 4 different donors; ****p <0.0001 by one-way ANOVA with Tukey’s multiple comparison test adjusted p value. (g) Representative confocal microscopy imaging showing CARs clustering in T cells expressing GFP-tagged GD2.28ζ (green) and B7-H3.BB (red) with and without CAR engagement using either the anti-14g2a idiotype antibody (1A7) or the B7-H3-Fc protein. Blue staining indicates the DAPI. Shown are representative cells. Data are representative of three independent validations. Shown in white are the scale bars that correspond to 5 μm.
To investigate if the two CARs in GD2.28ζ/B7-H3.BB CAR-T cells can cluster in the same immune synapse upon engaging with either one of the antigens and then trigger activation signal through the shared CD3ζ chain, we fused GFP with GD2.28ζ and co-transduced T cell with B7-H3.BB, and then stimulated them with either the anti-GD2.CAR idiotype antibody 1A7 or the B7-H3-Fc fusion protein, or both. Using confocal microscopy imaging, we found that GD2.28ζ and B7-H3.BB CARs formed membrane clusters and co-localized with each other upon CAR crosslinking via single or dual CAR engagement (Fig. 3g and Extended Data Fig. 5).
Dual CAR-T cells show improved functions.
To evaluate if 4-1BB costimulation provided by the B7-H3.BB CAR enhances the antitumor activity of GD2.28ζ CAR-T cells, we compared the functionality of GD2.28ζ/B7-H3.BB CAR-T cells and GD2.28ζ CAR T cells both in vitro and in vivo. We found all CARs were expressed in T cells (Fig. 4a,b), and no modifications in cell subset compositions were observed (Extended Data Fig. 6a,b). In repetitive multi-round co-culture experiments with NB tumor cells (Fig. 4c), only GD2.28ζ/B7-H3.BB CAR-T cells continued to eliminate NB cells at the 4th round of co-culture (Fig. 4d,h). In addition, T cells expressing GD2.28ζ/B7-H3.BB showed the highest T cell counts (Fig. 4e,i) and the highest IFN-γ and IL-2 release (Fig. 4f,g,j,k) at the 3rd and 4th round of co-cultures. In CHLA-255-bearing NSG mice, GD2.28ζ/B7-H3.BB CAR-T cells not only showed superior antitumor activity to eliminate the primary tumor in stress conditions, but also controlled tumor growth upon tumor re-challenge leading to improved survival (Fig. 4l–o). At day 14, mice treated with GD2.28ζ/B7-H3.BB CAR-T cells showed the highest frequency of circulating T cells (Fig. 4p), and at day 28 they continued to have a trend of higher circulating T cells (Fig. 4q). GD2.28ζ/B7-H3.BB CAR-T cells showed enrichment in CD27+CD28+ cells in both CD4+ and CD8+ T cells, and showed low expression of PD-1 and TIM3 (Extended Data Fig. 6c–f). We also constructed the dual CAR in which the B7-H3.CAR carries the CD28 costimulation and CD3ζ, while the GD2.CAR contains the 4-1BB costimulatory endo-domain without CD3ζ (B7-H3.28ζ/GD2.BB) (Extended Data Fig. 7a). We found that B7-H3.28ζ/GD2.BB CAR-T cells showed superior antitumor activity both in in vitro multi-round co-culture experiments with CHLA-255 and LAN-1 tumor cells (Extended Data Fig. 7b–o), and in vivo in the CHLA-255 NB metastatic tumor model (Extended Data Fig. 8) when compared to single B7-H3.28ζ CAR-T cells.
Figure 4. Dual targeting with split costimulation and shared single CD3ζ promotes sustained antitumor activity.
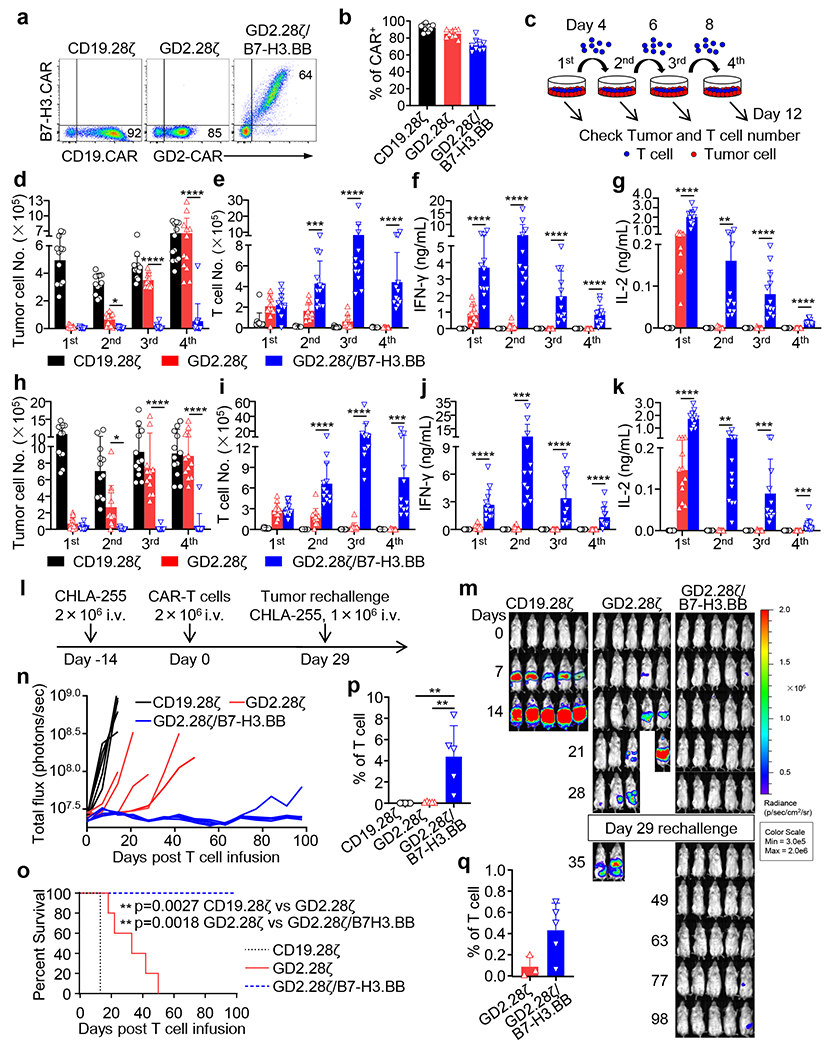
(a) Representative flow cytometry plots showing the expression of CARs in CAR-T cells. (b) Summary of CARs transduction efficiency (n = 9 independent experiments); data are shown as individual values and the mean + SD. (c) Schema of the multi-rounds co-culture experiment. Tumor cells were seeded in 24-well plates one day prior to the addition of T cells. At day 0, CAR-T cells were added at T cell to tumor cell ratio of 1 to 5. At days 4, 6, and 8, all T cells were collected and transferred into a new well in which 5 × 10⁵ NB cells were seeded one day before. T cells and NB cells were quantified by flow cytometry after each cycle. Supernatants were also collected for cytokine measurements 24 hours after adding T cells for each cycle. (d-k) Multi-rounds co-culture experiments with CHLA-255 (d-g) and LAN-1 (h-k) cells. Quantification of residual tumor cells (d,h) and enumeration of T cells (e,i), and summary of IFN-γ (f,j) and IL-2 (g,k) released by CAR-T cells in the multi-rounds co-culture experiments. Data are shown as individual values and the mean + SD, n = 12 independent co-culture with CAR-T cells generated from 12 different donors; *p <0.05, **p <0.01, ***p <0.001, ****p <0.0001, by one-way ANOVA with Tukey’s multiple comparison test adjusted p value, the full list of p values can be found in the source data. (l) Schema of the CHLA-255 metastatic xenograft NB model. (m,n) Representative tumor BLI images (m) and BLI kinetics (n) of FFLuc-CHLA-255 tumor growth in the tumor models shown in (l) (n = 5 mice/group). (o) Kaplan-Meier survival curve of mice in (m,n) (n = 5 mice/group); **p<0.01 by Log-rank test. (p,q) Summary of circulating CAR-T cells (CD45+CD3+) in mice 14 days (p) and 28 days (q) after CAR-T cell treatment (n = 3 mice in GD2.28ζ group in (q), n = 5 mice/group in other groups), Data are shown as individual values and the mean + SD, **p = 0.0038 for CD19.28ζ vs. GD2.28ζ/B7-H3.BB and **p = 0.0044 for GD2.28ζ vs. GD2.28ζ/B7-H3.BB in (p), adjusted p value by one-way ANOVA with Tukey test for multiple comparison.
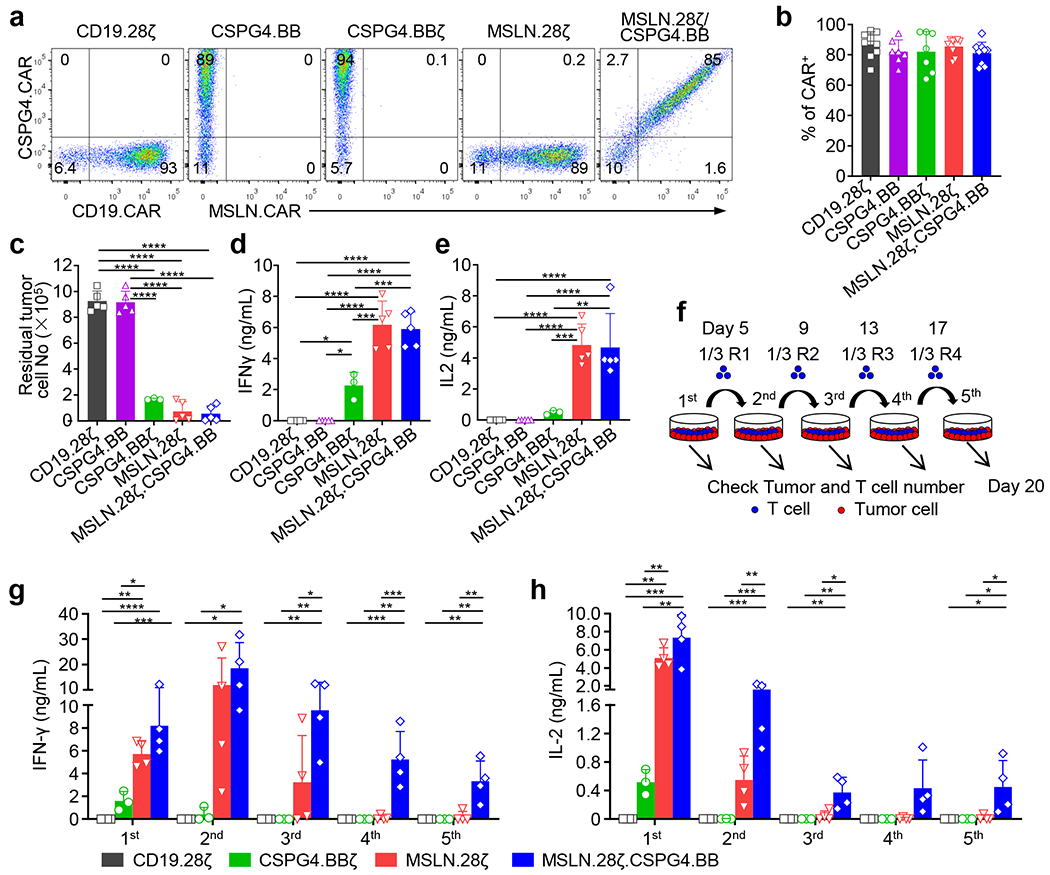
To further investigate if dual targeting, split costimulation and shared CD3ζ can be generally applicable, we utilized two additional CARs targeting mesothelin (MSLN) and chondroitin sulphate proteoglycan 4 (CSPG4)22–24, respectively. We generated a construct encoding the MSLN.CAR with CD28 and CD3ζ domains and co-expressing the CSPG4.CAR with 4-1BB costimulatory domain, but without CD3ζ (MSLN.28ζ/CSPG4.BB) (Fig. 5a). When T cells expressing MSLN.28ζ, CSPG4.BBζ, CSPG4.BB, and MSLN.28ζ/CSPG4.BB CARs were co-cultured with the MSLN and CSPG4 double positive mesothelioma cell line H2052 (Fig. 5b), all CAR-T cells with the exception of CSPG4.BB CAR-T cells eliminated the tumor cells and released INF-γ and IL-2 (Extended Data Fig. 9a–e). However, MSLN.28ζ/CSPG4.BB CAR-T cells showed better antitumor activity compared to single target CAR-T cells in multi-round co-culture experiments in vitro (Fig. 5c,d, and Extended Data Fig. 9f–h), and in an intraperitoneal metastatic mesothelioma model (Fig. 5e–i). Overall, these data indicate that dual CAR targeting with split co-stimulatory signal and one single shared CD3ζ domain promotes sustained survival and antitumor effects of CAR-T cells.
Figure 5. MSLN and CSPG4 dual targeting CAR-T cells with split co-stimulation and shared CD3ζ show sustained T cell activation and proliferation in vitro and in vivo.
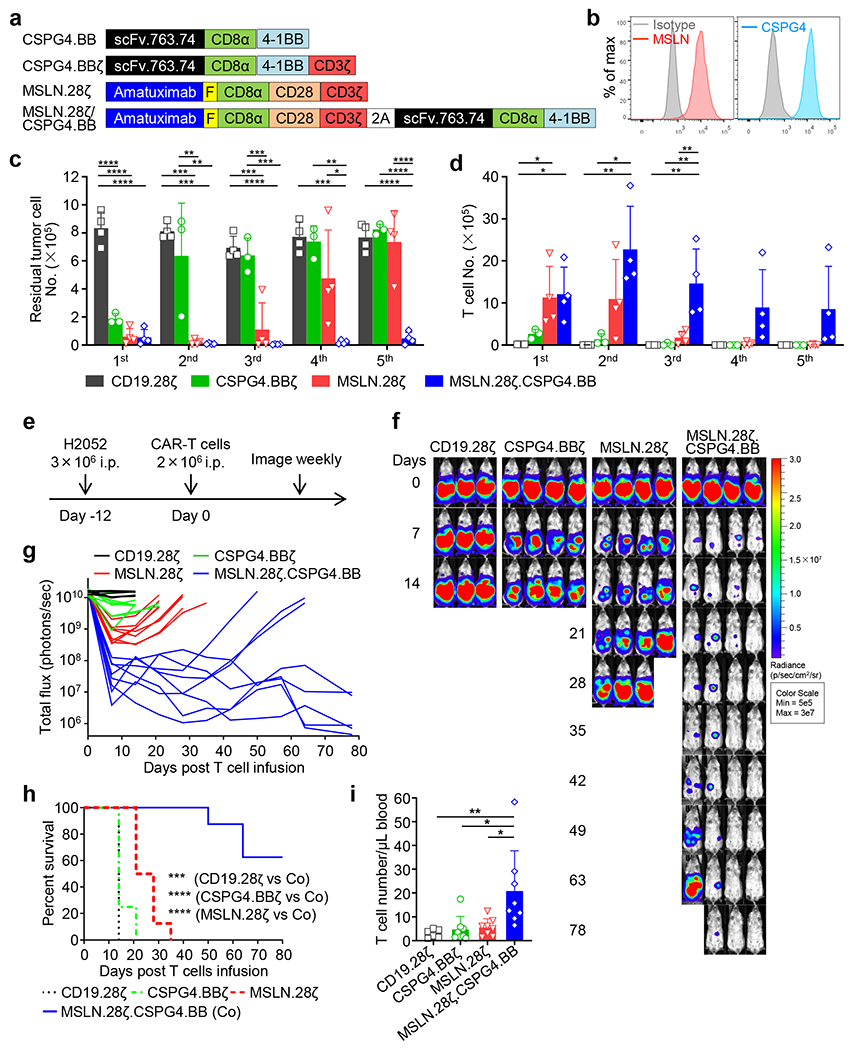
(a) Schematic representation of retroviral vectors encoding CSPG4.BB, CSPG4.BBζ, MSLN.28ζ and MSLN.28ζ/CSPG4.BB CARs. scFv.763.74, single-chain variable fragment of the anti-CSPG4 monoclonal antibody 763.74; Amatuximab, single-chain variable fragment of the anti-MSLN monoclonal antibody amatuximab; CD8α, stalk and transmembrane region of human CD8α; CD28, intracellular domain of human CD28; 4-1BB, intracellular domain of human 4-1BB; CD3ζ, intracellular domain of human CD3ζ chain; F, Flag-tag. (b) Flow cytometry histograms showing the expression of MSLN and CSPG4 in the human mesothelioma cell line H2052. Representative of three independent experiments. (c, d) Summary of the number of residual H2052 cells (c) and T cells (d) in the multi-round co-culture experiments with H2052 tumor cells. Data are shown as individual values and the mean + SD, n = 3 independent experiments with CAR-T cells generated from 3 different donors for the CSPG4.BBζ group, n = 4 independent experiments with CAR-T cells generated from 4 different donors for the other groups; *p <0.05, **p <0.01, ***p <0.001, ****p <0.0001 by one-way ANOVA with Tukey’s multiple comparison test adjusted p value, the full list of p values can be found in the source data. (e) Schema of the H2052 intraperitoneal xenograft model in NSG mice. Eight to 10 week old female NSG mice were inoculated with 3ⅹ106 FFLuc-labelled H2052 cells by intraperitoneal injection, and treated 12 days later with 2 x 10⁶ CD19.28ζ, CSPG4.BBζ, MSLN.28ζ or MSLN.28ζ/CSPG4.BB CAR-T cells by intraperitoneal injection. (f, g) Representative tumor BLI images (f) and BLI kinetics (g) of FFLuc-H2052 tumor growth in the mesothelioma xenograft model shown in (a). (h) Kaplan-Meier survival curve of mice in (f, g)), n = 6 mice for the CD19.28ζ group, n = 8 mice for the other groups; ***p = 0.0003, ****p < 0.0001 by Log-rank test. (i) Detection of circulating CAR-T cells (CD45+CD3+) in mice 19 days after CAR-T cell treatment by flow cytometry; data are shown as individual values and the mean + SD, n = 6 mice for CD19.28ζ group, n = 8 mice for the other groups, *p <0.05 (0.0103 for CSPG4.BBζ vs. Co, 0.0159 for MSLN.28ζ vs. Co), **p = 0.0084 by one-way ANOVA with Tukey’s multiple comparison test adjusted p value.
T cell activation and metabolic fitness of dual CAR-T cells.
We performed RNASeq analysis to investigate how the addition of B7-H3.BB CAR to the GD2.28ζ CAR enhances antitumor activity and persistence of CAR-T cells. In the absence of CAR engagement, we found that GD2.28ζ/B7-H3.BB CAR-T cells showed different gene expression pattern compared to GD2.28ζ CAR-T cells (Fig. 6a,b). Gene set enrichment analysis (GSEA) showed that glycolytic pathways and IFN-γ signaling are elevated in GD2.28ζ/B7-H3.BB CAR-T cells (Fig. 6c,d). Since both glycolytic and IFN-γ pathways are activated by TCR signaling, we tested our data set using T cell activation gene sets. Transcriptome of CAR-T cells expressing GD2.28ζ/B7-H3.BB was highly enriched with genes upregulated upon T cell activation as compared to those expressing the GD2.28ζ CAR, while genes downregulated upon T cell activation are enriched in GD2.28ζ CAR-T cells (Fig. 6e–g). These data indicate that GD2.28ζ/B7-H3.BB CAR-T cells have higher basal level of TCR activation signaling, which is paralleled by enhanced phosphorylation of the CAR-CD3ζ chain and downstream signaling kinases such as ERK and Akt (Fig. 6h). We previously reported that basal CAR-CD3ζ phosphorylation in CAR-T cells encoding the CD28 endodomain primes them to stronger and sustained activation upon CAR cross-linking28. Here we observed that this effect is further amplified in GD2.28ζ/B7-H3.BB CAR-T cells compared to T cells expressing the GD2.28ζ CAR alone (Fig. 6i). Despite differences in transcriptome at basal resting condition, initial CAR-mediated stimulation equally activated T cells expressing either the GD2.28ζ/B7-H3.BB CAR or GD2.28ζ CAR as transcriptome profile of T cells with either CARs converged at day 1 (Fig. 7a). However, gene expression diverged between T cells expressing the GD2.28ζ/B7-H3.BB CAR or GD2.28ζ CAR at day 5 after removal from antigen stimulation (Fig. 7b). CAR-T cells expressing GD2.28ζ/B7-H3.BB showed an enrichment in pathways related to cell cycle and TCR signaling at day 5, suggesting sustained proliferation upon antigen removal (Fig. 7c,d). We performed principle component analysis to determine the relative relationship between the transcriptome of CAR-T cells at day 0, 1 and 5 (Fig. 7e). The variance of transcriptome of our dataset is dominated by CAR activation, which is captured on PC1 (x-axis). On day 0 and day 5, GD2.28ζ/B7-H3.BB CAR-T cells showed higher PC1 score when compared to GD2.28ζ CAR-T cells, consistent with our finding of active TCR signaling. Notably, CAR-T cells expressing GD2.28ζ/B7-H3.BB acquired additional transcriptome distinction from T cells expressing the GD2.28ζ CAR, which is captured in PC2 (y-axis). When we performed KEGG pathway analysis of the top 100 highest loading genes in PC2, we found the “Cell Cycle pathway” to be the most enriched (Supplementary table 1). Consistent with the enrichment of cell cycle related pathway, we found sustained T cell proliferation at day 6 post CAR crosslinking of GD2.28ζ/B7-H3.BB CAR-T cells (Fig. 7f), and better expansion as indicated by almost two fold more T cell counts at day 6 as compared to GD2.28ζ CAR-T cells (Fig. 7g). On metabolic analyses, CAR-T cells expressing GD2.28ζ/B7-H3.BB showed elevated glycolytic activity as compared to those expressing GD2.28ζ at day 0 and day 5 post-stimulation, while only modest difference were observed at day 1 when activation signaling is at its maximum for T cells expressing either GD2.28ζ/B7-H3.BB CAR or GD2.28ζ CAR (Fig. 7h). Remarkably, enhanced glycolysis observed in CAR-T cells expressing GD2.28ζ/B7-H3.BB did not disrupt the previously described pro-OXPHOS metabolic profile sustained by 4-1BB endodomain29, because these cells showed significantly increased oxygen consumption rate before or after CAR stimulation as compared to CAR-T cells expressing GD2.28ζ (Fig. 7i). Overall, transcriptional analysis, T cell signaling and metabolism suggest that dual targeting, split signal and one single CD3ζ domain maintain tonic TCR signaling and metabolic fitness in T cells and translate into potent and sustained antitumor activity.
Figure 6. Dual targeting with split co-stimulation and shared D3ζ promote TCR tonic signaling.
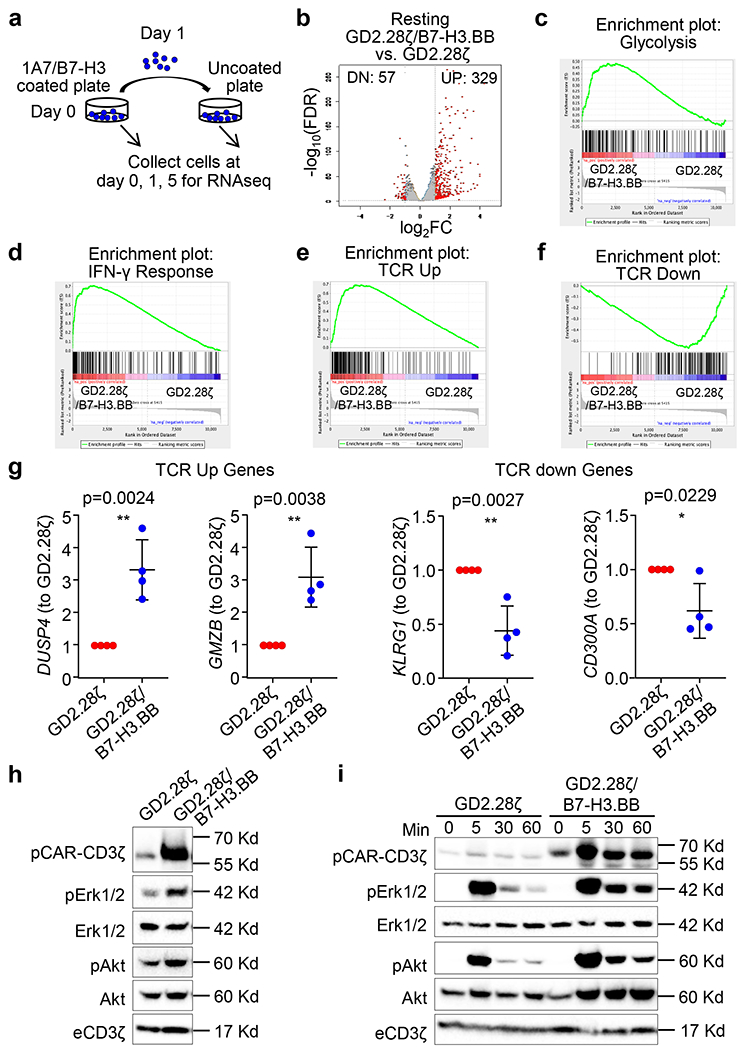
(a) Schema of CAR-T cell stimulation and sample preparation for RNAseq. Both GD2.28ζ and GD2.28ζ/B7-H3.BB CAR-T cells were stimulated with 1 μg/mL 1A7 Ab and 1 μg/mL B7-H3-Fc protein coated plate for 24 hours, and then transferred to a new plate without any pre-coating and cultured for 4 more days. CAR-T cells were collected for RNAseq at days 0, 1 and 5. (b) RNAseq analysis of non-stimulated GD2.28ζ and GD2.28ζ/B7-H3.BB CAR-T cells. (c-f)) Gene set enrichment analysis (GSEA) of glycolytic (c), IFN-γ signaling pathways (d), TCR upregulated (e) and downregulated genes (f) in non-stimulated CAR-T cells expressing GD2.28ζ or GD2.28ζ/B7-H3.BB. (g) qPCR validation of TCR-related genes upregulated and down regulated in GD2.28ζ vs. GD2.28ζ/B7-H3.BB CAR-T cells in the absence of antigen stimulation; n = 4 independent donors, and data are shown as individual values and the mean + SD in C, *p <0.05, **p<0.01, two-tailed p value determined by unpaired t test. (h) Basal phosphorylation of CAR-CD3ζ, Erk1/2, and Akt in GD2.28ζ and GD2.28ζ/B7-H3.BB CAR-T cells in the absence of antigen stimulation. Data are from one experiment, representative of three independent experiments. (i) Time course of CAR-CD3ζ, Erk1/2, and Akt phosphorylation in GD2.28ζ and GD2.28ζ/B7-H3.BB CAR-T cells after CAR cross-linking (1A7 Ab for GD2.CAR and B7-H3-Fc protein for B7-H3.CAR). Data are from one experiment, representative of three independent experiments.
Figure 7. Dual targeting with split co-stimulation and shared CD3ζ promote CAR-T cell proliferation, and glycolytic and oxidative metabolism.
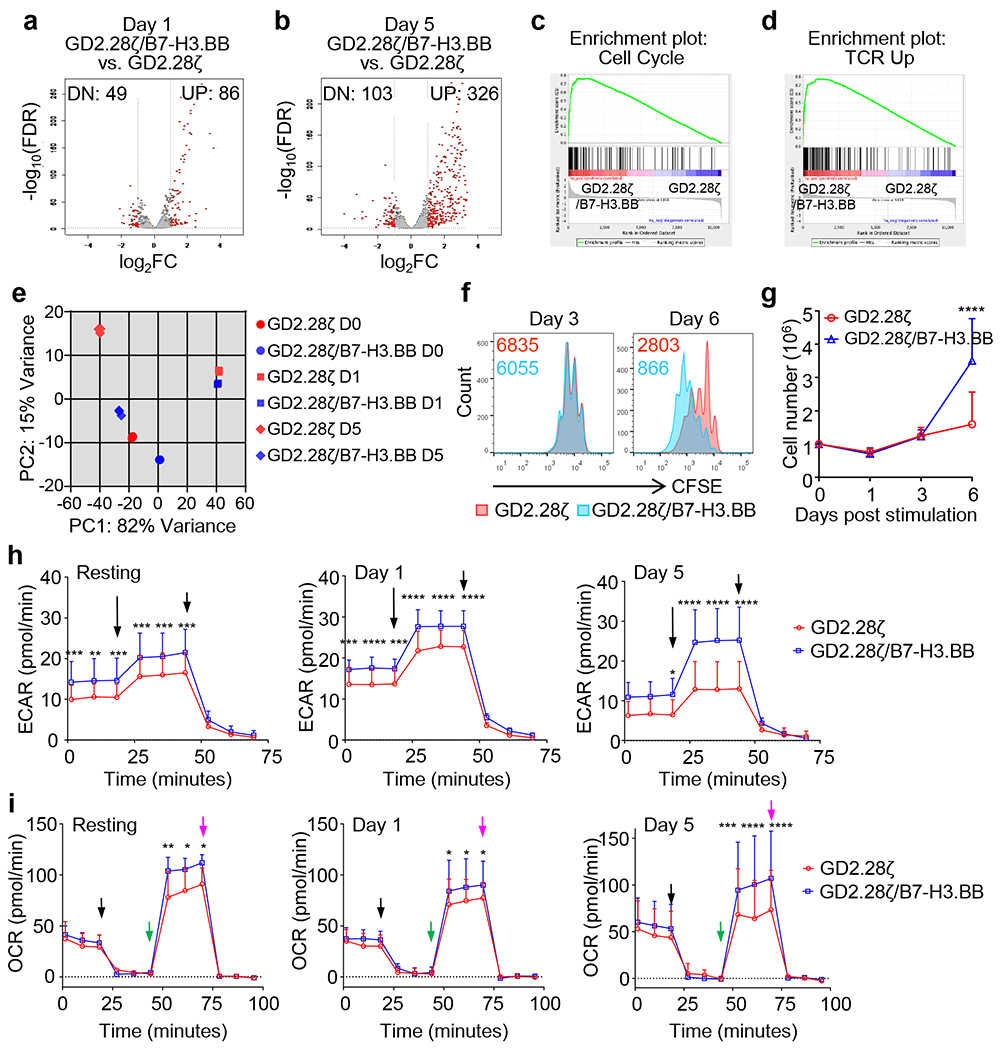
(a-d) RNAseq analysis of GD2.28ζ and GD2.28ζ/B7-H3.BB CAR-T cells at day 1 (a) and day 5 (b) after CAR stimulation. (c,d) GSEA of the cell cycle (c) and TCR (d) signaling five days after CAR stimulation. (e) Principal component analysis of transcriptome data from GD2.28ζ and GD2.28ζ/B7-H3.BB CAR-T cells at days 0, 1 and 5. (f,g) Proliferation of GD2.28ζ and GD2.28ζ/B7-H3.BB CAR-T cells after CAR stimulation. (f) CAR-T cells were stained with CFSE and then stimulated via 1A7 Ab and B7-H3-Fc protein on day 0, the CFSE dilutions were examined by flow cytometry on days 3 and 6 after stimulation. Representative of 4 independent experiments. (g) T cell numbers were counted by flow cytometry with counting beads in a separate experiment without CFSE staining (n = 5 independent experiments with CAR-T cells generated from 5 different donors), Error bars denote SD, *p < 0.0001 determined by multiple unpaired t test with Holm-Sidak correction for multiple comparison. (h, i) Metabolic profile showing glucose (h) and O2 consumption (i) of GD2.28ζ and GD2.28ζ/B7-H3BB CAR-T cells before CAR activation (resting), and days 1 and 5 after CAR activation. Extracellular acidification rate (ECAR) and O2 consumption rate (OCR) were assayed at different time points in a Seahorse XF24 analyzer, n = 3 independent experiments, Error bars denote SD, *p <0.05, **p <0.01, ***p <0.001,****p <0.0001, two-way ANOVA with Sidak correction for multiple comparison, the full list of p values can be found in the source data. The long and short arrows indicate the time point of adding Rot/AA and 2-DG respectively (h); the black, green and purple arrows indicate the time point of adding oligomycin, FCCP, Rot/AA respectively (i).
Dual CAR-T cells prevent antigen escape.
To evaluate if GD2.28ζ/B7-H3.BB CAR-T cells prevent tumor escape due to variable antigen expression in tumor cells, we leveraged on the heterogeneous levels of GD2 expression in NB. We co-cultured CAR-T cells expressing either GD2.28ζ or GD2.28ζ/B7-H3.BB with the NB cell line SH-SY5Y that shows heterogeneous expression of GD2 (Fig. 8a,b). GD2.28ζ/B7-H3.BB CAR-T cells exhibited the highest antitumor effects (Fig. 8c) and Th1 cytokine release (Fig. 8d,e). Next, we evaluated if GD2.28ζ/B7-H3.BB CAR-T cells can prevent tumor escape in vivo. In a low tumor burden model in SH-SY5Y-bearing NSG mice (Fig. 8f), CAR-T cells expressing GD2.28ζ/B7-H3.BB fully controlled tumor growth (Fig. 8g–i). In mice treated with GD2.28ζ CAR-T cells, growing tumors showed dim GD2 expression as compared to control mice treated with CD19-specific CAR-T cells. In contrast, B7-H3 expression remained unmodified in tumor cells since this antigen was not targeted in mice infused with GD2.28ζ CAR-T cells (Fig. 8j). Furthermore, CAR-T cells expressing GD2.28ζ/B7-H3.BB effectively controlled the tumor growth in mice treated with higher tumor burden (Extended Data Fig. 10). Overall, these data indicate that T cells expressing dual targeting CARs with split costimulatory signal and one single CD3ζ domain have superior antitumor activity when tumor contains cells with dim expression of the targeted antigen, which may cause tumor escape from single targeting CAR-T cell treatment.
Figure 8. Dual targeting, split signaling and one single CD3ζ endodomain prevent tumor escape due to antigen loss.
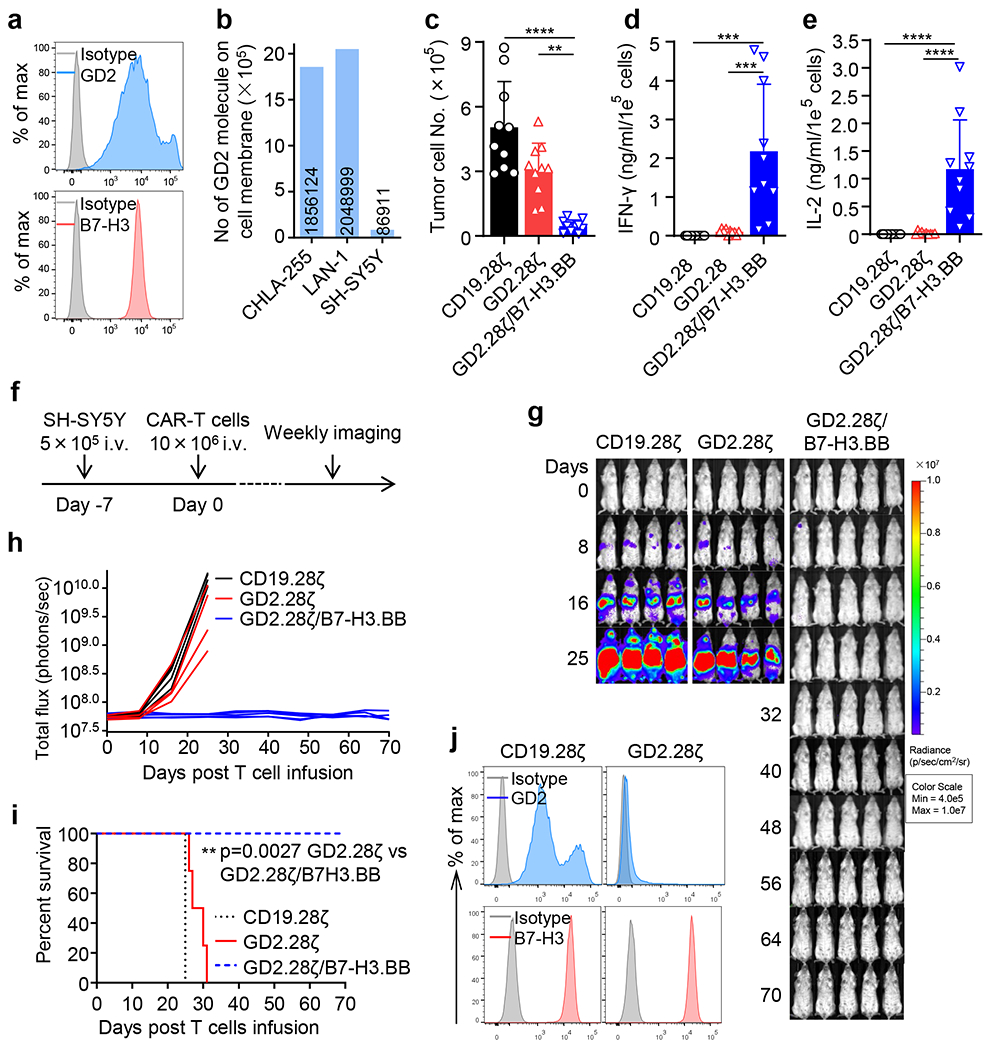
(a) Flow cytometry histogram showing the expression of GD2 and B7-H3 in the NB cell line SH-SY5Y. Representative of 3 independent experiments. (b) Quantification of the GD2 density on the cell membrane of CHLA-255, LAN-1 and SH-SY5Y cells as measured by flow cytometry. The numbers within bars indicate the calculated number of GD2 molecules on the cell membrane of each cell line. Representative of 2 independent experiments. (c) Quantification of residual NB cells labelled with GFP and co-cultured with CD19.28ζ, GD2.28ζ and GD2.28ζ/B7-H3.BB CAR-T cells at the T cell to tumor cell ratio of 1 to 5. On day 5, NB cells (GFP+) and CAR-T cells (CD3+) were enumerated by flow cytometry. Data are shown as individual values and the mean + SD, n = 10 independent co-culture with CAR-T cells generated from 10 different donors; **p = 0.0011, ****p <0.0001 by one-way ANOVA with Tukey’s multiple comparison test adjusted p value. (d,e) Summary of IFN-γ (d) and IL-2 (e) released by CAR-T cells in the culture supernatant after 24 hours of co-culture with NB cells as measured by ELISA. Data are shown as individual values and the mean + SD, n = 10 independent co-culture with CAR-T cells generated from 10 different donors; ***p = 0.0001 for CD19.28ζ vs. GD2.28ζ/B7-H3.BB and ***p = 0.0002 for GD2.28ζ vs. GD2.28ζ/B7-H3.BB in (d), ****p <0.0001 in (e) by one-way ANOVA with Tukey’s multiple comparison test adjusted p value. (f) Schema of the SH-SY5Y metastatic xenograft NB model in NSG mice inoculated intravenously via tail vein with 5 x 10⁵ of FFLuc-SH-SY5Y cells and treated 7 days later with 1 x 10⁷ CD19.28ζ, GD2.28ζ and GD2.28ζ/B7-H3.BB CAR-T cells intravenously. (g,h) Representative tumor BLI images (g) and BLI kinetics (h) of FFLuc-SH-SY5Y tumor growth in the metastatic xenograft NB models shown in (f) (n = 4 or 5 mice/group). (i) Kaplan-Meier survival curve of mice in (g,h) (n = 4 or 5 mice/group); **p = 0.0027 by Log-rank test. (j) GD2 and B7-H3 expression levels in tumor cells collected from mice treated with CD19.28ζ or GD2.28ζ CAR-T cells were analyzed by flow cytometry at the time of the euthanasia. Representative of 3 independent experiments.
Discussion
Preventing tumor escape due to heterogeneity in antigen expression and providing optimal T cell costimulation remain critical aspects to achieve clinical responses with CAR-T cells in solid tumors. Here, we generated CAR-T cells that simultaneously target two antigens and provide optimal costimulation and T cell metabolic fitness by activating independently CD28 and 4-1BB pathways and tuning CD3ζ-chain-mediated signaling. In a model of NB, T cells expressing the dual CAR provided robust and sustained antitumor activity in in vivo stress conditions and prevented tumor escape due to heterogeneous antigen expression by tumor cells. The beneficial effects of the proposed combination of dual targeting, split costimulation and tuned CD3ζ signaling was reproduced using another pair of CAR molecules.
Targeting GD2 with CAR-T cells hold great clinical potential in NB17,19,26–28. The approach has been proved safe, but the ideal costimulation of GD2-specific CAR-T cells in the clinical setting remains undefined. In particular, the most recent clinical study at Baylor College of Medicine in which we used a 3rd generation CAR encoding both CD28 and OX40 endodomains demonstrated only modest clinical effects despite the combination with a checkpoint blockade17. Furthermore, while GD2 is widely recognized as an ideal target for immunotherapy of NB, its heterogeneous expression in tumor cells is not fully appreciated, and will lead to tumor recurrence due to the selection of tumor clones with low GD2 expression29–32. We thus added here a second clinically relevant NB target represented by B7-H321. Of note, GD2 and B7-H3 are physiologically expressed by NB, and we tested the possibility to target these antigens simultaneously on tumor cells that naturally express the targets reflecting the physiologic density of antigen expression in tumor cells. Similarly, MSLN is currently under evaluation to treat mesothelioma, lung cancer, breast cancer, pancreatic cancer and prostate cancer via scFv-based CAR-T cells33, and we explored its optimal combination with another clinically relevant target such as CSPG434,35.
Our data demonstrate that it is possible to accommodate two almost complete CAR sequences targeting two different antigens into a single retroviral vector and obtain functional expression levels of both CARs in T cells. The first observation we made is that T cells expressing two CARs, providing transacting CD28 and 4-1BB endodomains, and each one with its own CD3ζ chain did not show any beneficial effects in in vivo stress conditions. In sharp contrast, T cells expressing the same two CARs in which the CD3ζ chain is provided by one single CAR not only showed cytotoxic effects of each CAR, but also caused antitumour effects in vivo as compared to single targeting in stress conditions. The observation that a CAR lacking its own CD3ζ chain can still provide cytolytic effects to T cells if a second complete CAR is also expressed likely reflects unique characteristics of the synapse formed by the CAR molecules. While a CAR that lacks the CD3ζ cannot efficiently use the endogenous CD3ζ chains despite engaging the antigen, it can efficiently use the CD3ξ chain of a bystander CAR expressed by the same cell. The sharing of the CD3ζ chain to trigger T cell activation is strictly mediated by the presence of two cysteine residues in the CD8α stalk as integral part of the CAR molecules. Furthermore, sharing of the CD3ζ chain only occurs upon antigen engagement, which prevents dimerization of the two CARs if both antigens are not engaged.
The second observation we made is that CD28 and 4-1BB pathways transacting and independently activated via two distinct CARs is more effective than the classical in cis expression of 3rd generation CARs. This is reminiscent of the proposed approach to supply 4-1BB ligand to CAR-T cells that encode CD2816. However, while 4-1BB ligand presentation to T cells co-expressing 4-1BBL and CAR requires cross talk between CAR-T cells, our approach has the significant advantage of providing both 4-1BB and CD28 signaling costimulation independently to each single CAR-T cell once they encountering the tumor. Furthermore, splitting costimulation into two CARs also allows targeting two tumor-associated antigens and to some degree prevent tumor escape.
The optimal stretch of costimulation provided by dual specific CARs with split costimulation and single CD3ζ chain is supported by signaling, molecular and metabolic properties. We and others have demonstrated that sustained phosphorylation of the proximal signaling molecules of the CAR caused by the CD28 endodomain imprints CAR-T cells to promote rapid antitumor effects11,12,36. In contrast, 4-1BB signaling in CAR-T cells provides the metabolic fitness characterized by the oxidative metabolism that is critical to sustain CAR-T cell persistence37. CAR-T cells expressing our proposed CAR design are characterized by strong and sustained CAR proximal signaling and molecular signature consistent with TCR tonic signal which are critical in promoting rapid antitumor effects. Similarly, metabolic profiling indicates that dual CAR-T cells display rapid effector function via glycolysis, which is supported by CD28 signaling, but they also preserve oxidative function upon antigen removal, which is a characteristic of 4-1BB costimulation, supporting memory formation and long-term persistence.
In summary, we designed a strategy that address simultaneously the most challenging tasks in solid tumors such as generating CAR-T cells that rapidly eliminate the tumor and persist to control tumor growth upon tumor re-challenge. Furthermore, they prevent tumor relapse due to the emergence of tumor cells characterized by low antigen expression.
Materials and methods
Cell lines and cell culture.
Human mesothelioma cell line H2052 and human B-cell lymphoma cell line Raji were purchased from American Type Culture Collection (ATCC), Raji-B7-H3 was generated by transducing the Raji cell with retrovirus encoding B7-H321. Human NB cell lines CHLA-255 and Firefly-luciferase (FFLuc)-CHLA-255 are gifts from Dr. Metelitsa at Baylor College of Medicine (Houston, TX) (originally derived from a metastatic lesion in the brain in a patient with recurrent disease at Children’s Hospital Los Angeles)38,39, and LAN-1 is a gift from Dr. Brenner at Baylor College of Medicine (Houston, TX)40,41, originally purchased from ATCC. SH-SY5Y is gift from Dr. Chiarle at Boston Children’s Hospital (Boston, MA)42, originally purchased from ATCC. CHLA-255, LAN-1, H2052 and Raji were cultured in RPMI-1640 (Gibco, Invitrogen) supplemented with 10% fetal bovine serum (Sigma), 2 mM GlutaMAX (Gibco), 100 unit/mL of penicillin (Gibco) and 100 μg/mL of streptomycin (Gibco). SH-SY5Y was cultured in DMEM (Gibco) supplemented with 10% fetal bovine serum (Sigma), 2 mM GlutaMAX (Gibco), 100 unit/mL of penicillin (Gibco) and 100 μg/mL of streptomycin (Gibco). Cells were maintained in a humidified atmosphere containing 5% CO2 at 37 °C. Tumor cell lines were transduced with a gamma retroviral vector encoding the enhanced green fluorescent protein (eGFP) and/or the FFLuc genes as described previously43. All cell lines were mycoplasma free, and validated by flow cytometry for surface markers and functional readouts as needed.
Plasmid construction.
All retroviral vectors were generated using the SFG backbone. The GD2-specific CARs were generated using the modified GD2 specific single-chain variable fragment (14G2a scFv), the CD8α stalk and transmembrane domain, the CD28 or 4-1BB intracellular domain, and CD3ζ intracellular domain (GD2.28ζ and GD2.BBζ) as described to correct the previously reported tonic signaling of the scFv26. B7-H3-specific CARs were generated using the 376.96 scFv, the CD8α stalk and transmembrane domain, the CD28 or 4-1BB intracellular domains, and CD3ζ intracellular domain (B7-H3.28ζ and B7-H3.BBζ)19. The CD19-specific CARs was generated using the FMC63 scFv, the CD8α stalk and transmembrane domain, the CD28 intracellular domain, and CD3ζ intracellular domain (CD19.28ζ)44. The cassette encoding the GD2.28ζ in combination with the B7-H3.BB CAR with or without CD3ζ intracellular domain linked with a 2A-sequence peptide (GD2.28ζ/B7-H3.BB, and GD2.28ζ/B7-H3.BBζ) was generated by gene synthesis (GeneArt, Thermo Scientific). The GD2-specific CAR encoding both CD28 and 4-1BB and CD3ζ (GD2.28.BBζ) was generated by gene synthesis (GeneArt, Thermo Scientific). The B7-H3.BB.CAR was generated by PCR using B7-H3.BBζ as template to remove CD3ζ. The cassette encoding the GD2.28ζ and the destabilized human nerve growth factor receptor (dNGFR) with the CD8α stalk and transmembrane domain and 4-1BB intracellular domain was linked with a 2A-sequence peptide (GD2.28ζ/dNGFR.BB). The cassette encoding dNGFR, the CD8α stalk and transmembrane domain, the CD28 intracellular domain, and CD3ζ in combination with the B7-H3.BB CAR domain was linked with a 2A-sequence peptide (dNGFR.28ζ/B7-H3.BB). The 28ζ/B7-H3.BB cassette was constructed by removing the 14g2a scFv sequence from GD2.28ζ/B7-H3.BB by PCR. The GD2.BB cassette was constructed by removing the CD3ζ from GD2.BBζ by PCR. The B7-H3.28ζ/GD2.BB cassette was constructed by adding GD2.BB to B7-H3.28ζ by gene synthesis (GeneArt, Thermo Scientific) and linked with a 2A sequence. The CSPG4.BBζ CAR was constructed by cloning the scFv of 763.74, CD8α stalk and transmembrane domain, the 4-1BB intracellular domain, and CD3ζ23. CSPG4.BB was constructed by removing the CD3ζ from CSPG4.BBζ by PCR. The MSLN.28ζ CAR was constructed by cloning the scFv of amatuximab, CD8α stalk and transmembrane domain, the CD28 intracellular domain, and CD3ζ45. The MSLN.28ζ/CSPG4.BB cassette was constructed by inserting CSPG4.BB into the MSLN.28ζ backbone and linked with the 2A sequence.
Retrovirus preparation, transduction and expansion of human T cells.
Retroviral supernatants used for the transduction of human T cells were prepared as previously described43. Buffy coats from healthy donors were purchased from the Gulf Coast Regional Blood Center, Houston, TX. CAR-T cells were generated using peripheral blood mononuclear cells (PBMCs) isolated with Lymphoprep density separation (Fresenius Kabi Norge). PBMCs were activated on plates coated with 1 μg/mL CD3 (Miltenyi Biotec) and 1 μg/mL CD28 (BD Biosciences) agonistic monoclonal antibodies (mAbs). T lymphocytes were transduced on retronectin-coated plates (Takara Bio) and then expanded in complete medium (45 % RPMI-1640 and 45 % Click’s medium (Irvine Scientific), 10 % Hyclone FBS (HyClone), 2 mM GlutaMAX (Gibco), 100 unit/mL of Penicillin (Gibco) and 100 μg/mL of streptomycin (Gibco) with IL-7 (10 ng/mL; PeproTech) and IL-15 (5 ng/mL; PeproTech), changing medium every 2 - 3 days for 12 - 14 days. T cells were cultured in IL-7/IL-15 depleted medium for two days prior to being used in in vitro functional assays46.
Western Blot analysis.
Protein lysates were normalized according to the percentage of CAR expression and the number of T cell, and were resuspended in 2 × Laemelli Buffer (Bio-Rad) in reducing condition (with β-mercaptoethanol). To assess signaling through the CAR, T cells were put on ice and incubated with 2 μg of the 1A7 anti-idiotype mAb specific for the 14G2a scFv and 1 μg of the 4Ig-B7-H3 fused with mouse IgG2a Fc (Chimerigen Laboratories) for 20 minutes and then cross-linked with 2 μL of goat anti-mouse secondary Ab (BD Bioscience) for an additional 20 minutes. Cells were then transferred to a 37 °C water bath for the indicated time points and lysed with 2 × Laemelli Buffer. To assess dimers and oligomers of two CARs, T cells were put on ice and incubated with 1 μg of the 4Ig-B7-H3 fused with mouse IgG2a Fc (Chimerigen Laboratories) for 20 minutes and then incubated with 2 μL of a goat anti-mouse secondary Ab (BD Bioscience) for an additional 20 minutes. Cells were then transferred to 37 °C water bath for 20 minutes and lysed with 2 × Laemelli Buffer in reducing (with β-mercaptoethanol) or non-reducing (without β-mercaptoethanol) conditions for 10 minutes at 100 °C. All lysates were separated in 4-15 % sodium dodecyl sulfate polyacrylamide gels (SDS-PAGE, Bio-Rad) and transferred to polyvinylidene diflouride membranes (Bio-Rad). After protein transfer onto polyvinylidene diflouride membranes, membranes were blocked in 5 % non-fat milk in Tris-buffered saline, 0.1 % Tween 20 (TBST) and incubated with primary at a dilution of 1 to 1,000 in TBST with 5 % non-fat milk. The following abs were used: anti-phospho-CD3ζ (Y142) (Abcam), anti-CD3ζ (Santa Cruz Biotechnology), anti-ERK (pan) (BD Biosciences), anti-phospho-Akt (Ser473) (Cell Signaling), and anti-Akt (pan) (Cell Signaling). Membranes were then incubated with HRP-conjugated goat anti-mouse or goat anti-rabbit IgG (both Santa Cruz) at a dilution of 1 to 3,000 and developed with SuperSignal West Femto Maximum Sensitivity Substrate or SuperSignal West Pico Chemiluminescent Substrate (both Thermo Scientific) on the Gel station (Boi-Rad).
Enzyme-linked immunosorbent assay (ELISA).
Culture supernatants were collected after 24 hours of co-culture to measure the release of IFN-γ and IL-2 by using specific ELISA kit (R&D systems) following manufacturer’s instructions. Each supernatant was measured in duplicate. Samples were measured using Synergy 2 Multi-Detection Microplate Reader and Gen5 software (both BioTek).
Flow cytometry.
We performed flow cytometry using Abs specific to human CD3, CD4, CD8, CD27, CD28, CD45, CD45RA, CCR7, PD-1, LAG-3, TIM-3, B7-H3 (clone 7-517), and GD2 (clone 14G2a) (all from BD Biosciences) conjugated with phycoerythrin (PE), PE-Cy7, fluorescein isothiocyanate (FITC), allophycocyanin (APC), APC-H7, Alexa Fluor 647 (AF 647), Brilliant Violet (BV) 421, BV510, BV605, and/or BV711. Expression of human B7-H3 in tumor cell lines was assessed with the 376.96 mAb and confirmed with another B7-H3 Ab clone 7-517 (BD Biosciences)47. To detect CD19.CAR, GD2.CAR and CSPG4.CAR, the anti-idiotype mAbs 233-4A, 1A7 and MK2-23 were used as primary Ab to stain the CARs respectively, and then followed by either APC or PE conjugated rat anti-mouse IgG secondary mAb (BD Biosciences). MSLN.CAR has a fused flag tag, therefore, it’s expression was detected by using the APC-conjugated Anti-Flag mAb (Clone L5, Biolegend). The expression of B7-H3.CAR was detected using the recombinant human B7-H3 Fc chimera protein (R&D systems) followed by the Alexa Fluor 647-conjugated AffiniPure F(ab’)2 Fragment Goat Anti-Human IgG (H+L) secondary mAb (Jackson ImmunoResearch). For absolute number calculations, samples were analyzed using CountBright absolute counting beads (Thermo Scientific). Samples were analyzed with BD FACScanto II or BD FACSfortessa (BD Biosciences) with the BD Diva software (BD Biosciences), for each sample we acquired a minimum of 10,000 events, and data was analyzed using Flowjo 10 (Tree Star). For the carboxyfluorescein diacetate succinimidyl ester (CSFE)-based proliferation assay, T cells were labeled with 1.5 mM CSFE (Invitrogen) and plated with tumor cells at the T cell to tumor cell ratio of 1 to 1. CFSE dilution was measured on gated T cells on day 5 using flow cytometry48.
Measurement of the GD2 antigen density.
The determination of GD2 antigen density on the cell surface of CHLA-255, LAN-1 and SH-SY5Y was performed using both DAKO QIFIKIT (BIOCYTEX, Glostrup, Denmark) and primary antibodies specific to GD2 (clone 14G2a) and B7-H3 (clone 376.96). All procedure was performed according to the manufacture’s recommended protocol. The intensity of fluorescence was correlated with the number of the bounded primary antibody molecules on the surface of the cell lines. Antigen density was calculated based on the MFI of the stained cells with the standard curve that made by using the MFI of five populations of beads bearing different numbers of mouse monoclonal antibody molecules.
Long-term in vitro cytotoxicity and multi-round co-culture assay.
Tumor cells were seeded in 24-well plates at a concentration of 5 × 10⁵ cells/well one day prior to the addition of T cells. T cells normalized for transduction efficiency were added at the T cell to tumor cell ratio of 1 to 5 without the addition of exogenous cytokines. On day 5 of co-culture, cells were collected and T cells and tumor cells were measured by flow cytometry based on CD3 and GFP expression, respectively. Supernatant were also collected for cytokine measurements 24 hours after each cycle start. CD19.28ζ.CAR-Ts were used as negative control. Dead cells were gated out by Zombie Aqua Dye (Biolegend) staining. For multiple rounds of co-culture with NB cell lines of CHLA-255 and LAN-1, tumor cells were seeded at 5 × 10⁵ per well in 24-well plates one day prior to the addition of T cells. T cells normalized for transduction efficiency were added at the T cell to tumor cell ratio of 1 to 5. Four, three and two duplicates were performed for the 1st, 2nd, and 3rd round of co-culture for each condition, respectively. At the end of each round of co-culture, one duplicate was harvested for quantifying residual tumor cells (GFP+) and T cells (CD3+) by flow cytometry using CountBright absolute counting beads (Thermo Scientific), and T cells in other duplicates were collected and used for next round of co-culture. In the co-culture of GD2.28ζ/B7-H3.BB vs. GD2.28ζ CAR-T cells, at day 4, 6, and 8, T cells were harvested and transferred into a new well in which 5 × 10⁵ NB cells were seeded one day before of adding T cells for the next round of co-culture. In the co-culture of B7-H3.28ζ/GD2.BB vs. B7-H3.28ζ CAR-T cells, at days 4, 7, and 10, T cells were harvested and transferred into a new well in which 5 × 10⁵ NB cells were seeded one day before of adding T cells for the next round of co-culture. Supernatants were also collected for cytokine measurements 24 hours after adding T cells for each round of co-culture. For multiple rounds of co-culture with the mesothelioma cell line H2052, tumor cells were seeded at 2.5 × 10⁵ per well in 24-well plates one day prior to adding T cells. T cells normalized for transduction efficiency were added at the T cell to tumor cell ratio of 1 to 5. Two duplicates were performed for each round of co-culture. At the end of each round of co-culture, day 5, 9, 13 and 17, one duplicate was harvested for examining residual tumor cells (GFP+) and T cells (CD3+) by flow cytometry using CountBright absolute counting beads (Thermo Scientific). In another duplicate T cells were collected and 1/3 were transferred into a new well in which 2.5 × 10⁵ H2052 cells were seeded one day before of adding T cells for the next round of co-culture. Supernatant was also collected for cytokine measurements 24 hours after adding T cells for each round of co-culture. For each co-culture experiment, CD19.28ζ.CAR-T cells were used as negative control. Dead cells were gated out by Zombie Aqua Dye (Biolegend) staining while T cells were identified by the expression of CD3 and tumor cells by the expression of GFP.
Reverse transcription quantitative polymerase chain reaction.
Cells were lysed and RNA was extracted using the RNeasy Minikit (Qiagen) and reverse transcribed into cDNA (Superscript VILO, Invitrogen). Human DUSP4, KLRG1, CD300A, and GZMB mRNA expression was quantified using TaqMan probes (Thermo Scientific) on a QuantStudio 6 PCR machine (Applied Biosystems) using 18S ribosomal RNA as housekeeping gene control (Invitrogen).
RNA-sequence analysis.
Briefly, total RNA was extracted from CAR-T cells, and mRNA libraries were prepared (TruSeq Stranded mRNA Library Prep, Illumina) and sequenced on the Illumina HiSeq4000 platform (UNC High-Throughput Sequencing Facility) using paired-end 100-bp reads, with 84 million reads on average (range, 49–139 million). RNA-seq data were aligned with STAR alignment (v2.4.2) and quantified with Salmon (v0.6.0). Differential gene-expression analysis was performed using the R DESEq2 package49. Among all significantly expressed genes between GD2.28ζ-CAR-T cells and GD2.28ζ plus B7-H3.BB.CAR-T cells (FDR p ≤ 0.05), expression was further filtered to genes contained within the IFN-γ and the pathway signatures.
Activation of CAR-T cells for RNA-seq, qPCR, and cell metabolic assay.
One mg/mL of the 1A7 anti-idiotype mAb specific for the 14G2a scFv and 1 μg/ml of the 4Ig-B7-H3 fused with mouse Fc (Chimerigen Laboratories) were coated on non-tissue culture treated 24-well plates for 16 hours in the cold room. Plates were washed with DPBS (Corning) three times before plating T cells (1 x 10⁶ cells/well). CAR-T cells were incubated on 1A7 mAb and 4Ig-B7-H3-coated plates at 37 °C for 24 hours. Then, CAR-T cells were transferred to 24-well tissue culture plate. T cell metabolism was measured in a Seahorse XFe24 analyzer (Seahorse Bioscience). 5 × 10⁵ T cells were seeded to 24well Seahorse XF-24 assay plates in Seahorse BASE media with additives. Cells were incubated at 37°C in a non-CO2 incubator for 45 min. All media was adjusted to pH 7.4 on the day of assay. Mitochondrial and glycolysis stress tests were performed according to the manufacturer’s protocol. Oxygen consumption and extracellular acidification rates were automatically calculated and recorded by the Seahorse XF-24 software.
Confocal microscopy.
T cells expressing the GFP-tagged GD2.28ζ CAR and B7-H3.BB CAR were stimulated with either the anti-14g2a idiotypic antibody (1A7) or 2Ig-B7-H3 fused with human IgG1-Fc (R&D), and then crosslinked with a rat anti-mouse IgG1 secondary antibody (BD Biosciences) or Alexa Fluor 647 conjugated Goat-anti-human IgG secondary antibody (Jackson ImmunoResearch Laboratories Inc.) respectively. For the double CAR cross-link, CAR-T cells were stained with 1A7 and 2Ig-B7-H3-Fc simultaneously, followed by cross-linking with both above corresponding secondary antibodies. All the primary staining were performed at room temperature for 10 minutes, and the secondary cross-link was performed at 37 °C for 15 minutes. Then the CAR-T cells were fixed with cytofix buffer (BD Biosciences), stained with DAPI (Invitrogen) according to the manufacture’s protocol, washed with PBS and and mounted on Glass Bottom Microwell Dishes (MatTek corporation). Data acquisition was performed on LSM700 Zeiss laser scanning confocal microscope (objective lens 63X/1.4 Plan Apo Oil, pixel size 0.07 μm, pinhole size 1 AU) using ZEN software (ZEISS Microscopy). All groups of images were acquired with the same settings. Data analysis was performed with Fiji software.
Xenograft mouse models.
Mouse experiments were performed in accordance with the University of North Carolina (UNC) animal husbandry guidelines according to protocols approved by the UNC institutional animal care and use committee. Mice were maintained under specific-pathogen-free conditions with daily cycles of 12h light - 12h darkness, and continuous health monitoring was carried out on a regular basis. Animals were euthanized upon showing symptoms of clinically overt disease (not feeding, lack of activity, abnormal grooming behavior, hunched back posture) or excessive weight loss (15% body-weight loss over a week). For these studies, 8-10 weeks old female NSG mice (NOD.Cg-Prkdcscid IL2rgtm1Wj1/SzJ, UNC Animal Studies Core Facility) received 2 × 10⁶ of FFLuc-CHLA-255, 4 × 10⁶ of FFLuc-LAN-1, 0.5 × 10⁶ or 1 × 10⁶ of FFLuc-SH-SY5Y intravenously via tail vein. Seven or fourteen days after tumor cell injection, 2 or 6 × 10⁶ CAR-positive T cells were injected intravenously via tail vein. For the mesothelioma intraperitoneal metastatic xenograft model, 3 x 10⁶ FFLuc-labelled H2052 cells were suspended in 50 μL PBS and mixed with 50 μL of Matrigel (Corning) and implanted by intraperitoneal injection. Mice were then treated with CAR-T cells at day 12 after tumor implant via intraperitoneal injection. Tumor growth was monitored by bioluminescence imaging using the IVIS lumina II in vivo imaging system (PerkinElmer) or AMI Optical in vivo imaging system (Spectral instruments imaging). Mice were bled at specific intervals (10-15 days, as per UNC-IACUC guidelines) to measure T cell frequency and/or phenotype. Mice were euthanized when signs of discomfort were detected by the investigators or as recommended by the veterinarian who monitored the mice three times a week, or when the tumor bioluminescence signal is over 10^10 photons/sec. The maximal tumor burden was not exceeded for all mice. At the time of euthanasia, blood and spleen were isolated and analyzed to detect CAR-T cells. In tumor re-challenge experiments, tumor-bearing mice were further injected intravenously via tail vein with 1 × 10⁶ of FFLuc-CHLA-255 cells.
Statistical analyses.
Data were summarized as mean + SD as noted in the figure legends. For multiple group comparisons, one-way analysis of variance (ANOVA) was used to determine statistically significant differences between groups, Tukey’s multiple comparison test adjusted p value < 0.05 indicates a significant difference. Differences between two groups were determined by two-sided unpaired t test, p < 0.05 indicates a significant difference. Differences between the survival curves were analyzed by the Log-rank test using GraphPad Prism v8. Experimental sample numbers (n) are indicated in the figure legends. The statistical analysis method is also described in the individual figure legends. Graph generation and statistical analyses were performed using the GraphPad Prism software (GraphPad Software).
Extended Data
Extended Data Fig. 1. GD2-specific CAR-T cells and B7-H3-specific CAR-T cells target neuroblastoma in vitro.

(a) Flow cytometry histogram showing the expression of GD2 and B7-H3 in two human NB cell lines, CHLA-255 and LAN-1. Representative of three independent experiments. (b) Representative flow cytometry histograms showing the expression of CARs in human T cells transduced with retroviral vectors encoding CD19.28ζ, GD2.28ζ, GD2.BBζ, B7-H3.28ζ, and B7-H3.BBζ CARs. (c-e) Representative flow cytometry plots (c) and quantification of residual CHLA-255 (d) and LAN-1 (e) cells labelled with GFP and co-cultured with CAR-T cells at the T cell to tumor cell ratio of 1 to 5. On day 5, NB cells (GFP+) and CAR-T cells (CD3+) were enumerated by flow cytometry. Data are shown as individual values and the mean ± SD, n = 6 independent co-cultures using CAR-T cells generated from 6 different donors. (f,g) Summary of IFN-γ (f) and IL-2 (g) released by CAR-T cells in the culture supernatant after 24 hours of co-culture with NB cells as measured by ELISA. Data are shown as individual values and the mean ± SD, n = 6 independent co-cultures using CAR-T cells generated from 6 different donors. (h) Representative CFSE dilution of CSFE-labeled CAR-T cells co-cultured with NB cells for 5 days at the T cell to tumor cell ratio of 1 to 1 (red histogram). CFSE-labeled CAR-T cell alone (grey histogram) was used as negative control. Representative of three independent experiments.
Extended Data Fig. 2. The antitumor activity of GD2-specific CAR-T cells and B7-H3-specific CAR-T cells with either CD28 or 4-1BB costimulation in vivo.

(a) Schema of the CHLA-255 metastatic xenograft NB model using NSG mice inoculated via tail vein injection with 2 × 10⁶ of FFluc-CHLA-255 cells and 14 days later received high doses of CAR-T cells (6 × 10⁶ cells/mouse) intravenously. (b,c) Representative tumor bioluminescence (BLI) images (b) and tumor BLI kinetics (c) of FFluc-CHLA-255 tumor growth (n = 3 mice for the CD19.28z group, n = 5 mice for the other four groups) in the metastatic xenograft NB models shown in (a). (d) Kaplan-Meier survival curve of mice in (b,c), n = 3 mice for CD19.28z group, n = 5 mice for other 4 groups, comparisons of survival curves were determined by Log-rank test, **p = 0.0042 for CD19.28z vs. other 4 groups. (e) Schema of the LAN-1 metastatic xenograft NB model using NSG mice inoculated via tail vein injection with FFLuc-LAN-1 cells and treated 21 days later with low doses CD19.28ζ, GD2.28ζ, GD2.BBζ, B7-H3.28ζ or B7-H3.BBζ CAR-T cells intravenously. (f,g) Representative tumor BLI images (f) and tumor BLI kinetics (g) of FFLuc-LAN-1 tumor growth (n = 3 mice/group). (h) Kaplan-Meier survival curve of mice in (f,g), n = 3 mice/group, comparisons of survival curves were determined by Log-rank test, *p = 0.0253 for CD19.28z vs. GD2.28ζ, GD2.BBζ and B7-H3.BBζ groups, *p = 0.0295 for GD2.28ζ vs. GD2.BBζ, *p = 0.0246 for GD2.28ζ vs. B7-H3.BBζ.
Extended Data Fig. 3. Addition of 4-1BB in tandem to the GD2.28ζ CAR and co-expression of both GD2.28ζ and B7-H3.BBζ CARs do not improve antitumor activity in vitro.
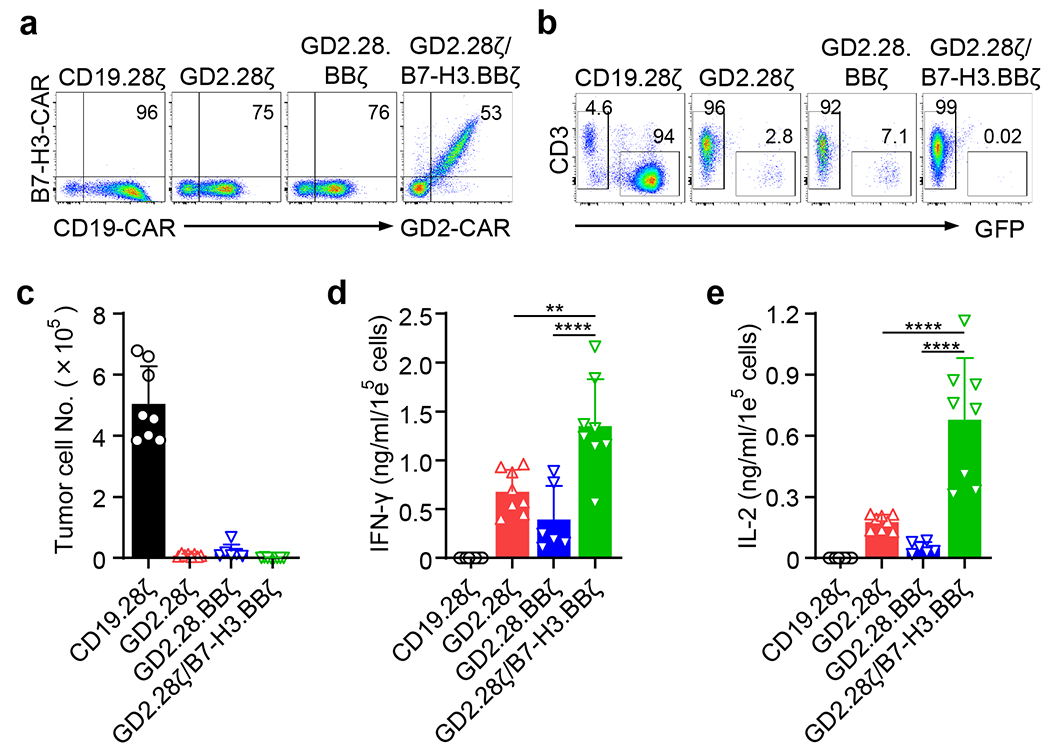
(a) Representative flow cytometry plots showing the CAR expression in human T cells transduced with retroviral vectors encoding CD19.28ζ, GD2.28ζ, GD2.28.BBζ, or GD2.28ζ/B7-H3.28ζ CARs. Representative of six independent experiments. (b,c) Representative flow cytometry plots (b) and quantification of residual CHLA-255 cells (c) labelled with GFP co-cultured with CAR-T cells at the T cell to tumor cell ratio of 1 to 5. Data are shown as individual values and the mean ± SD, n = 6 or 8 independent co-cultures using CAR-T cells generated from 6 or 8 different donors. (d,e) Summary of IFN-γ (d) and IL-2 (e) released by CAR-T cells in the culture supernatant after 24 hours of co-culture with NB cells as measured by ELISA. Data are shown as individual values and the mean ± SD, n = 6 or 8 independent co-cultures using CAR-T cells generated from 6 or 8 different donors; **p = 0.0011, ****p <0.0001 by one-way ANOVA with Tukey’s multiple comparison test adjusted p value.
Extended Data Fig. 4. Cytotoxic activity of the double CAR-T cells with shared CD3ζ is antigen dependent.
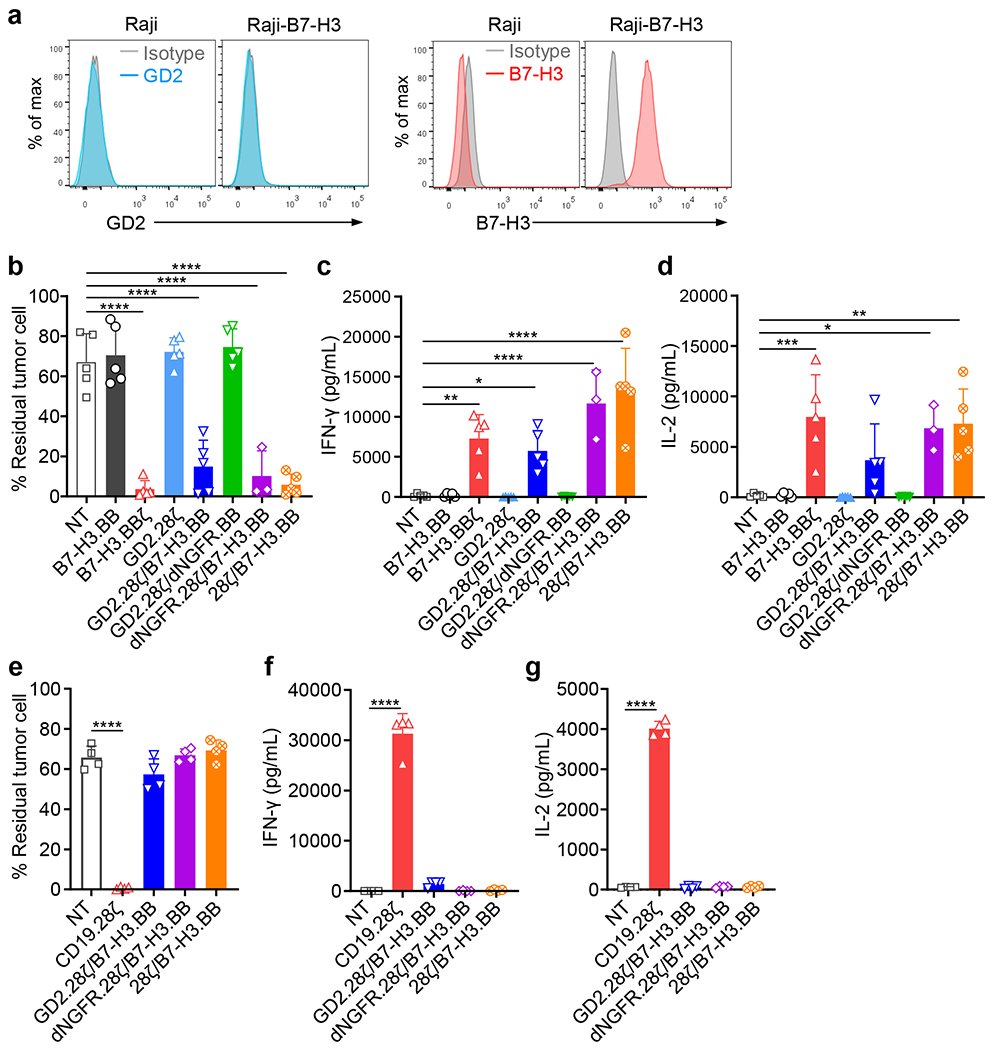
(a) Flow cytometry plots showing the expression of B7-H3 and GD2 in Raji cells wild type and B7-H3 expression in Raji cells transduced with a retroviral vector encoding B7-H3 (Raji-B7-H3). Representative of three independent experiments. (b-d) CAR-T cells (B7-H3.BB, B7-H3.BBζ, GD2.28ζ, GD2.28ζ/B7-H3.BB, dNGFR.28ζ/B7-H3.BB and 28ζ/B7-H3.BB) were co-cultured with Raji-B7-H3 cell at 1 to 1 ratio, and 5 days later tumor cells (CD19+) and T cells (CD3+) were collected and enumerated by flow cytometry (b). Supernatants of the co-cultures were collected 24 hours later, and IFN-γ (c) and IL-2 (d) released by CAR-T cells were measured by ELISA. Data are shown as individual values and the mean ± SD, n = 3 independent co-cultures using CAR-T cells generated from 3 different donors for dNGFR.28ζ/B7-H3.BB group, and n = 5 independent co-cultures using CAR-T cells generated from 5 different donors for all the other groups; *p <0.05 (0.0228 in c, 0.0141 in d ), **p <0.01 (0.0025 in c, 0.0015 in d), ***p = 0.0005, ****p <0.0001 by one-way ANOVA with Tukey’s multiple comparison test adjusted p value. (e-g) CAR-T cells (CD19.28ζ, GD2.28ζ/B7-H3.BB, dNGFR.28ζ/B7-H3.BB and 28ζ/B7-H3.BB) were co-cultured with Raji cell wild type at 1 to 1 ratio, and 5 days later tumor cells (CD19+) and T cells (CD3+) were collected and enumerated by flow cytometry (e). Supernatants of the co-cultures were collected 24 hours later, and IFN-γ (f) and IL-2 (g) released by CAR-T cells were measured by ELISA. Data are shown as individual values and the mean ± SD, n = 4 independent co-cultures using CAR-T cells generated from 4 different donors for each group; ****p <0.0001 by one-way ANOVA with Tukey’s multiple comparison test adjusted p value.
Extended Data Fig. 5. CAR clustering and aggregation in CAR-T cells after CAR engagement.
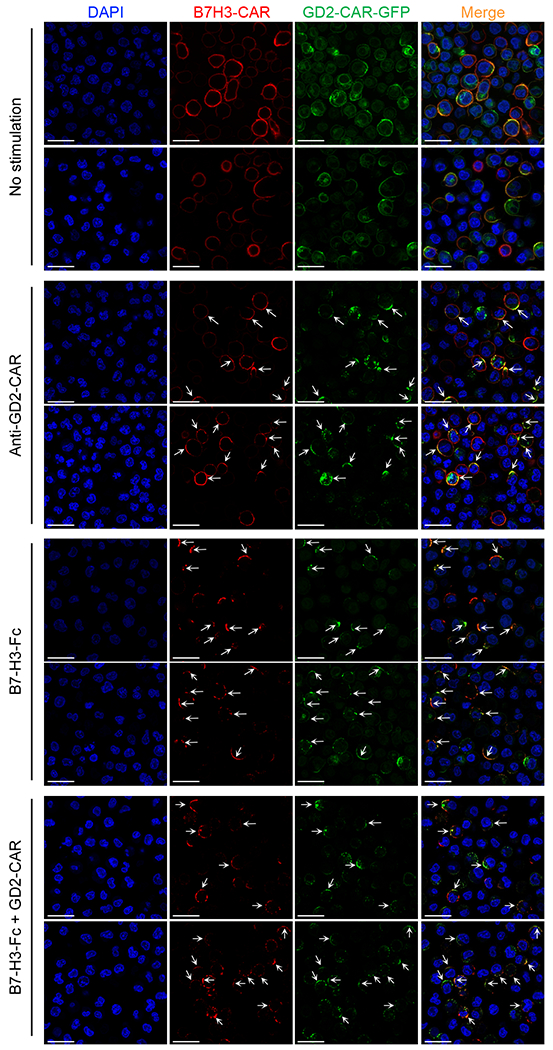
Representative confocal microscopy imaging showing CAR molecule clustering in T cells expressing GFP-tagged GD2.28ζ (green) and B7-H3.BB (red) with and without engagement of the CARs using either the anti-14g2a idiotype antibody (1A7) or the B7-H3.Fc protein. Blue staining indicates the DAPI. Shown are representative cells of a single field (Magnification 63X). Data are representative of three independent validations. Shown in white are the scale bars that correspond to 20 μm.
Extended Data Fig. 6. Phenotypic analysis of CAR-T cells in vitro and in vivo.
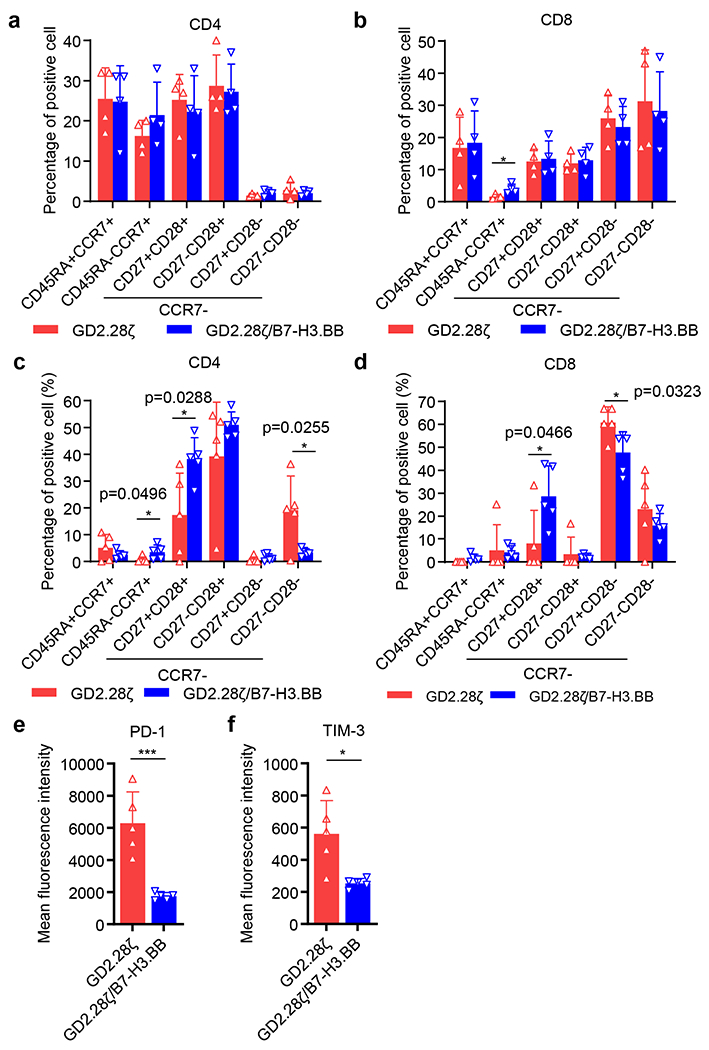
(a,b) Frequency of CD45RA+CCR7+, CD45RA−CCR7+, CCR7−CD28+CD27+, CCR7−CD28+CD27−, CCR7−CD28−CD27+, and CCR7−CD28−CD27− in CD4+ (a) and CD8+ (b) T cells on day 13 after retroviral vector transduction and expansion in vitro. Data are shown as individual values and the mean ± SD, n = 4 independent experiments using CAR-T cells generated from 4 different donors; *p = 0.0299, two-tailed p value determined by unpaired t test. (c-f) Tumor-baring mice infused with CAR-T cells were bled at day 14 and CAR-T cells in the peripheral blood were analyzed by flow cytometry. (c,d) Frequency of CD45RA+CCR7+, CD45RA−CCR7+, CCR7−CD28+CD27+, CCR7−CD28+CD27−, CCR7−CD28−CD27+, and CCR7−CD28−CD27− in CD4+ (c) and CD8+ (d) T cells. Data are shown as individual values and the mean ± SD, n = 5 samples from 5 mice, *p < 0.05, two-tailed p value determined by unpaired t test. (e,f) Mean Fluorescence Intensity (MFI) of PD-1 (e) and TIM-3 (f) in T cells. Data are shown as individual values and the mean ± SD, n = 5 samples from 5 mice; *p = 0.0109, ***p = 0.0008, two-tailed p value determined by unpaired t test.
Extended Data Fig. 7. Inverting the orientation of the B7-H3-specifc CAR and GD2-specific CAR does not alter the beneficial effects of dual targeting CAR-T cells with split costimulation and shared CD3ζ in vitro.

(a) Schematic representation of retroviral vectors encoding B7-H3.28ζ, GD2.BB and B7-H3.28ζ/GD2.BB CARs. (b) Representative flow cytometry plots of 5 independent experiments showing the expression of CARs. (c) Summary of the transduction efficiency of the CARs. Data are shown as individual values and the mean ±; SD, n = 5 or 7 independent experiments using CAR-T cells generated from 5 or 7 different donors; ***p = 0.002, ****p <0.0001 by one-way ANOVA with Tukey’s multiple comparison test adjusted p value. (d-f) CAR-T cells were co-cultured with CHLA-255-GFP at T cell to tumor cell ratio of 1 to 5. IFN-γ (e) and IL-2 (f) released by CAR-T cells were measured by ELISA. On day 5, tumor cells (GFP+) and CAR-T cells (CD3+) number were measured by flow cytometry (d). Data are shown as individual values and the mean ± SD, n = 3 independent co-cultures using CAR-T cells generated from 3 different donors ; *p <0.05, **p <0.01, ***p <0.001, ****p <0.0001 by one-way ANOVA with Tukey’s multiple comparison test adjusted p value, the full list of p values can be found in the source data. (g) Schema of the repetitive multi-round co-culture experiments. Tumor cells were seeded in 24-well plates one day prior to the addition of T cells. At day 0, CAR-T cells were added at T cell to tumor cell ratio of 1 to 5. At day 4, 7, and 10, all T cells were collected and transferred into a new well in which 5 × 10⁵ NB cells were seeded one day before. T cells and tumor cells, and cytokine were quantified at each cycle. (h-o) Multi-round co-culture with NB cell lines CHLA-255 (h-k) and LAN-1 (l-o) cells as described in (g). Summary of percentage of residual CHLA-255 (h) and LAN-1 (l) cells and number of T cells (i, m) at the end of each round of co-culture. Summary of IFN-γ (j, n) and IL-2 (k, o) released by CAR-T cells in the culture supernatant after 24 hours of co-culture with CHLA-255 (j, k) and LAN-1 (n, o) cells. Data are shown as individual values and the mean ± SD, n = 6 independent co-cultures using CAR-T cells generated from 6 different donors; *p <0.05, **p <0.01, ***p <0.001, ****p <0.0001 by one-way ANOVA with Tukey’s multiple comparison test adjusted p value, the full list of p values can be found in the source data.
Extended Data Fig. 8. Dual targeting with split co-stimulation and shared CD3ζ provide superior antitumor activity and better T cell persistence in NB model when mice are treated with inverted B7-H3-specifc CAR and GD2-specific CAR.
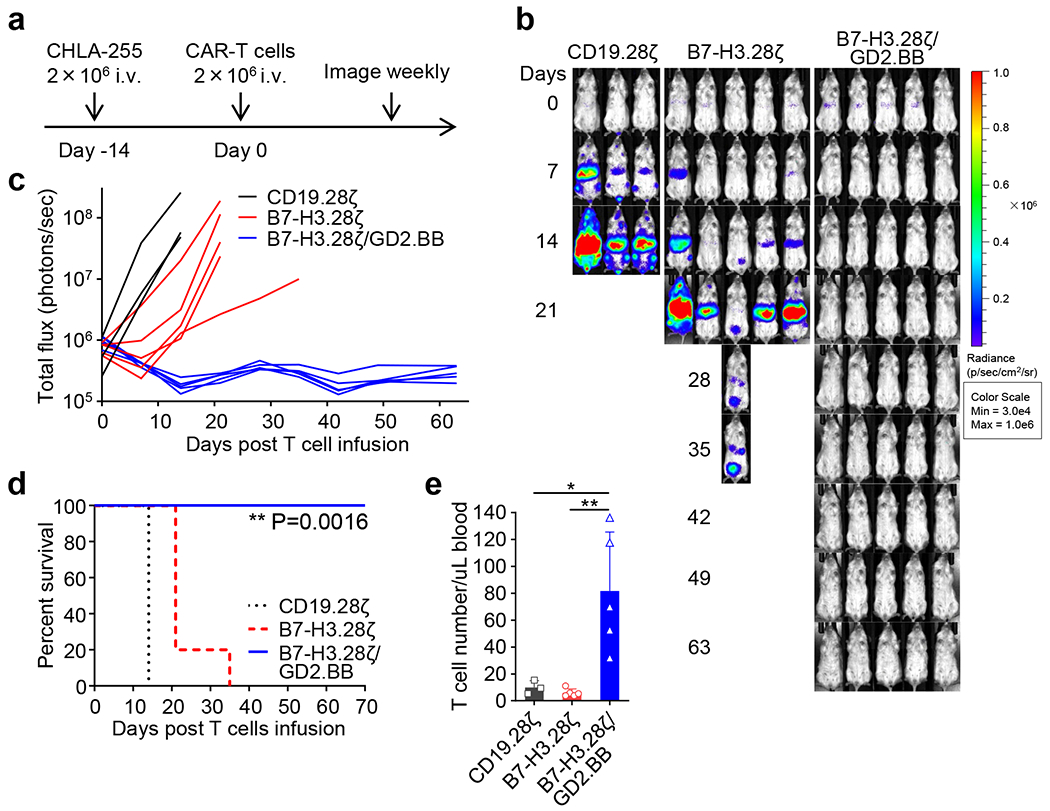
(a) Schema of the CHLA-255 metastatic xenograft NB model in NSG mice. Eight week old female NSG mice were inoculated with 2 x 10⁶ FFLuc-labelled CHLA-255 cells via tail vein injection, and 14 days later mice were treated with 2 x 10⁶ CD19.28ζ, B7-H3.28ζ or B7-H3.28ζ/GD2.BB CAR-T cells via tail vein injection. (b, c) Representative tumor bioluminescence (BLI) images (b) and tumor BLI kinetics (c) of FFLuc-CHLA-255 tumor growth in the metastatic xenograft NB model shown in (a) (n = 3 mice for the CD19.28ζ group, n = 5 mice for the other two groups). (d) Kaplan-Meier survival curve of mice in (b, c) (n = 3 for the CD19.28ζ group, n = 5 for the other two groups); **p = 0.0016 (B7-H3.28ζ vs. B7-H3.28ζ/GD2.BB) by Log-rank test. (e) Detection of circulating CAR-T cells (CD45+CD3+) in mice 14 days after CAR-T cell treatment by flow cytometry. Data are shown as individual values and the mean ± SD, (n = 3 samples from 3 mice for the CD19.28ζ group, n = 5 samples from 5 mice for the other two groups); *p = 0.0144, **p = 0.0042 by one-way ANOVA with Tukey’s multiple comparison test adjusted p value.
Extended Data Fig. 9. MSLN and CSPG4 dual targeting CAR-T cells with split co-stimulation and shared CD3ζ show sustained T cell activation and proliferation in vitro.
(a) Representative flow cytometry plots showing the expression of CARs. (b) Summary of the transduction efficiency of the CARs (n = 7 or 9 independent experiments using CAR-T cells generated from 7 or 9 different donors). Data are shown as individual values and the mean + SD. (c-e) CAR-T cells co-cultured with GFP labeled H2052 cell at T cell to tumor cell ratio of 1 to 5. IFN-γ (d) and IL-2 (e) released by CAR-T cells. On day 5, tumor cells (GFP+) and CAR-T cells (CD3+) were measured by flow cytometry (c). Data are shown as individual values and the mean ± SD, n = 3 independent co-cultures using CAR-T cells generated from 3 different donors for the CSPG4.BBζ group, n = 5 independent co-cultures using CAR-T cells generated from 5 different donors for the other groups; *p <0.05, **p <0.01, ***p <0.001, ****p <0.0001 by one-way ANOVA with Tukey’s multiple comparison test adjusted p value, the full list of p values can be found in the source data. (f) Schema of the multi-round co-culture experiments of CAR-T cells and H2052. Tumor cells were seeded one day prior to the addition of T cells. At day 0, CAR-T cells were added at T cell to tumor cell ratio of 1 to 5. At the end of each round of co-culture, which are at days 5, 9, 13 and 17, one third of T cells were collected and transferred into a new well with 2.5 × 10⁵ H2052 cells that were seeded one day before. T cells and tumor cells and cytokine released by CAR-T cells were quantified at each round of co-culture. (g-h) Summary of IFN-γ (g) and IL-2 (h) released by CAR-T cells in the multi-round co-culture with H2052 as described in (f). Data are shown as individual values and the mean ± SD, n = 3 independent co-cultures using CAR-T cells generated from 3 different donors for the CSPG4.BBζ group, n = 4 independent co-cultures using CAR-T cells generated from 4 different donors for the other groups; *p <0.05, **p <0.01, ***p <0.001, ****p <0.0001 by one-way ANOVA with Tukey’s multiple comparison test adjusted p value, the full list of p values can be found in the source data.
Extended data 10. Dual specific GD2 and B7-H3 CAR-T cells with split costimulation and shared CD3z have superior antitumor activity and prevent antigen escape in high tumor burden xenograft model with neuroblastoma cells showing heterogeneous GD2 expression.
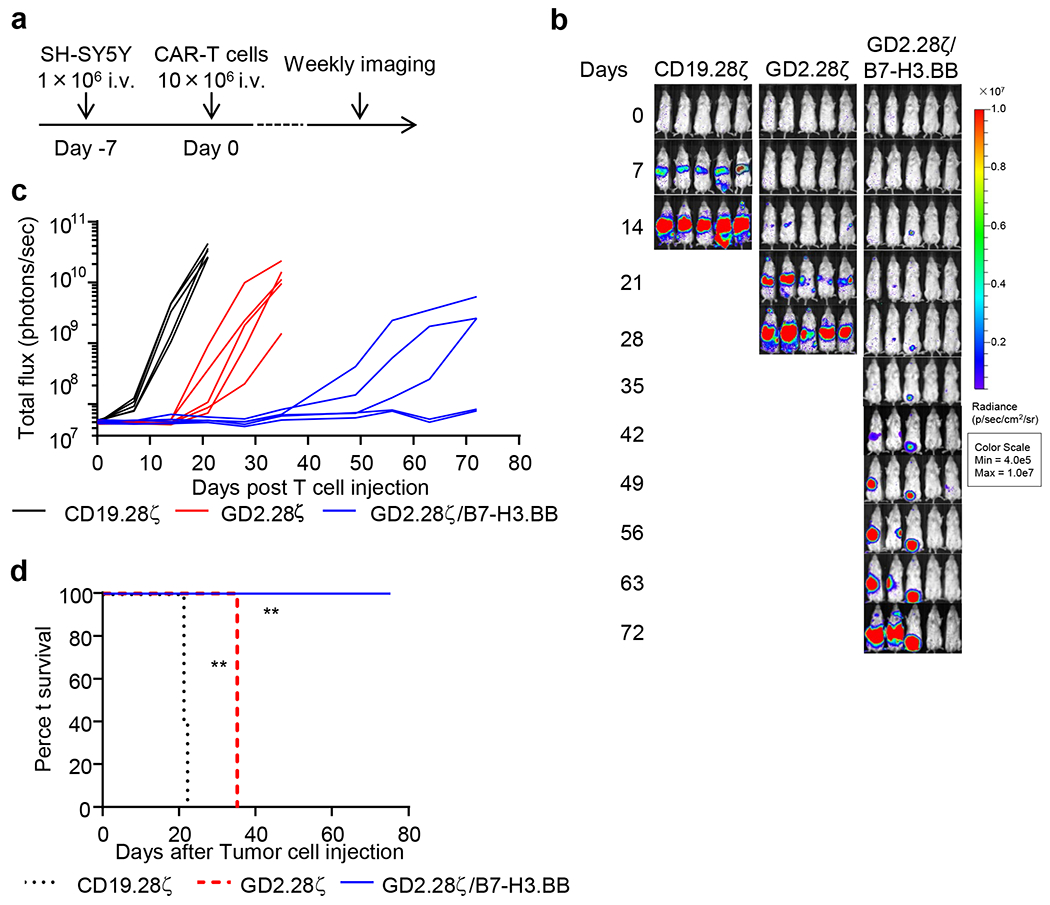
(a) Schema of the high tumor burden SH-SY5Y metastatic xenograft NB model using NSG mice inoculated via tail vein injection with FFLuc-SH-SY5Y cells (1 × 10⁶ cell/mouse) and treated 7 days later with CD19.28ζ, GD2.28ζ or GD2.28ζ/B7-H3BB CAR-T cells (1 × 10⁷ cells/mouse) intravenously. (b,c) Representative tumor bioluminescence (BLI) images (b), and tumor BLI kinetics (c) of FFLuc-SH-SY5Y tumor growth (n = 5 mice/group) in the metastatic xenograft NB models shown in (a). (d) Kaplan-Meier survival curve of mice in (B,C), n = 5 mice/group, comparisons of survival curves were determined by Log-rank test, **p = 0.0023 for CD19.28ζ vs. GD2.28ζ, **p = 0.0027 for GD2.28ζ vs. GD2.28ζ/B7-H3.BB.
Supplementary Material
Acknowledgments
This work was supported in part by R01-CA193140-03 (G.D.) and R01-CA243543-01 (G.D.) from National Cancer Institute. H.D. was supported by W81XWH-18-1-0441 from the Department of Defense (USA) and the Vicky Amidon Innovation Grant in Lung Cancer Research from the Lung Cancer Initiative of North Carolina (USA). The UNC Small Animal Imaging Facility at the Biomedical Imaging Research Center, the Microscopy Services Laboratory at Department of Pathology and Laboratory Medicine, and the Flow Cytometry Core Facilities are supported in part by an NCI Cancer Center Core Support Grant to the UNC Lineberger Comprehensive Cancer Center (P30-CA016086-40) United States.
Conflict of Interest Statement:
G. Dotti is a paid consultant for Bellicum Pharmaceuticals, Tessa Therapeutics and Catamaran, and reports receiving commercial research grants from Cell Medica and Bluebird Bio; B. Savoldo is a paid consultant for Tessa Therapeutics; G. Dotti and H. Du filed a patent for the CAR targeting B7-H3. No potential conflicts of interest were disclosed by the other authors.
Footnotes
Reporting Summary. Further information on research design is available in the Nature Research Reporting Summary linked to this article.
Data availability.
Source data for this study have been provided as Source Data files. The RNA-seq datasets generated and analyzed during the current study are not publicly available (the genetic information from primary human T cells in this study was not consented to be published in the public domain) and will be available from the corresponding authors upon request. All other data supporting the findings of this study are available from the corresponding author on reasonable request.
Reference List
- 1.Fucà G, Reppel L, Landoni E, Savoldo B & Dotti G Enhancing Chimeric Antigen Receptor T-Cell Efficacy in Solid Tumors. Clin Cancer Res 26, 2444–2451, doi: 10.1158/1078-0432.Ccr-19-1835 (2020). [DOI] [PMC free article] [PubMed] [Google Scholar]
- 2.June CH & Sadelain M Chimeric Antigen Receptor Therapy. N Engl J Med 379, 64–73, doi: 10.1056/NEJMra1706169 (2018). [DOI] [PMC free article] [PubMed] [Google Scholar]
- 3.Grada Z et al. TanCAR: A Novel Bispecific Chimeric Antigen Receptor for Cancer Immunotherapy. Mol Ther Nucleic Acids 2, e105, doi: 10.1038/mtna.2013.32 (2013). [DOI] [PMC free article] [PubMed] [Google Scholar]
- 4.Ahn S et al. Cancer Immunotherapy with T Cells Carrying Bispecific Receptors That Mimic Antibodies. Cancer Immunol Res 7, 773–783, doi: 10.1158/2326-6066.Cir-18-0636 (2019). [DOI] [PMC free article] [PubMed] [Google Scholar]
- 5.Zah E, Lin MY, Silva-Benedict A, Jensen MC & Chen YY T Cells Expressing CD19/CD20 Bispecific Chimeric Antigen Receptors Prevent Antigen Escape by Malignant B Cells. Cancer Immunol Res 4, 498–508, doi: 10.1158/2326-6066.Cir-15-0231 (2016). [DOI] [PMC free article] [PubMed] [Google Scholar]
- 6.Qin H et al. Preclinical Development of Bivalent Chimeric Antigen Receptors Targeting Both CD19 and CD22. Mol Ther Oncolytics 11, 127–137, doi: 10.1016/j.omto.2018.10.006 (2018). [DOI] [PMC free article] [PubMed] [Google Scholar]
- 7.Wang G et al. Fully human antibody VH domains to generate mono and bispecific CAR to target solid tumors. J Immunother Cancer 9, doi: 10.1136/jitc-2020-002173 (2021). [DOI] [PMC free article] [PubMed] [Google Scholar]
- 8.Miller BR et al. Stability engineering of scFvs for the development of bispecific and multivalent antibodies. Protein Eng Des Sel 23, 549–557, doi: 10.1093/protein/gzq028 (2010). [DOI] [PubMed] [Google Scholar]
- 9.Maude SL, Teachey DT, Porter DL & Grupp SA CD19-targeted chimeric antigen receptor T-cell therapy for acute lymphoblastic leukemia. Blood 125, 4017–4023, doi: 10.1182/blood-2014-12-580068 (2015). [DOI] [PMC free article] [PubMed] [Google Scholar]
- 10.Brentjens RJ et al. CD19-targeted T cells rapidly induce molecular remissions in adults with chemotherapy-refractory acute lymphoblastic leukemia. Sci Transl Med 5, 177ra138, doi: 10.1126/scitranslmed.3005930 (2013). [DOI] [PMC free article] [PubMed] [Google Scholar]
- 11.Zhao Z et al. Structural Design of Engineered Costimulation Determines Tumor Rejection Kinetics and Persistence of CAR T Cells. Cancer Cell 28, 415–428, doi: 10.1016/j.ccell.2015.09.004 (2015). [DOI] [PMC free article] [PubMed] [Google Scholar]
- 12.Sun C et al. THEMIS-SHP1 Recruitment by 4-1BB Tunes LCK-Mediated Priming of Chimeric Antigen Receptor-Redirected T Cells. Cancer Cell 37, 216–225.e216, doi: 10.1016/j.ccell.2019.12.014 (2020). [DOI] [PMC free article] [PubMed] [Google Scholar]
- 13.Carpenito C et al. Control of large, established tumor xenografts with genetically retargeted human T cells containing CD28 and CD137 domains. Proc Natl Acad Sci U S A 106, 3360–3365, doi: 10.1073/pnas.0813101106 (2009). [DOI] [PMC free article] [PubMed] [Google Scholar]
- 14.Pule MA et al. A chimeric T cell antigen receptor that augments cytokine release and supports clonal expansion of primary human T cells. Molecular therapy : the journal of the American Society of Gene Therapy 12, 933–941, doi: 10.1016/j.ymthe.2005.04.016 (2005). [DOI] [PubMed] [Google Scholar]
- 15.Ramos CA et al. In Vivo Fate and Activity of Second- versus Third-Generation CD19-Specific CAR-T Cells in B Cell Non-Hodgkin’s Lymphomas. Molecular therapy : the journal of the American Society of Gene Therapy 26, 2727–2737, doi: 10.1016/j.ymthe.2018.09.009 (2018). [DOI] [PMC free article] [PubMed] [Google Scholar]
- 16.Stephan MT et al. T cell-encoded CD80 and 4-1BBL induce auto- and transcostimulation, resulting in potent tumor rejection. Nat Med 13, 1440–1449, doi: 10.1038/nm1676 (2007). [DOI] [PubMed] [Google Scholar]
- 17.Heczey A et al. CAR T Cells Administered in Combination with Lymphodepletion and PD-1 Inhibition to Patients with Neuroblastoma. Molecular therapy : the journal of the American Society of Gene Therapy 25, 2214–2224, doi: 10.1016/j.ymthe.2017.05.012 (2017). [DOI] [PMC free article] [PubMed] [Google Scholar]
- 18.Enblad G et al. A Phase I/IIa Trial Using CD19-Targeted Third-Generation CAR T Cells for Lymphoma and Leukemia. Clin Cancer Res 24, 6185–6194, doi: 10.1158/1078-0432.Ccr-18-0426 (2018). [DOI] [PubMed] [Google Scholar]
- 19.Pule MA et al. Virus-specific T cells engineered to coexpress tumor-specific receptors: persistence and antitumor activity in individuals with neuroblastoma. Nat Med 14, 1264–1270, doi: 10.1038/nm.1882 (2008). [DOI] [PMC free article] [PubMed] [Google Scholar]
- 20.Yu AL et al. Anti-GD2 antibody with GM-CSF, interleukin-2, and isotretinoin for neuroblastoma. N Engl J Med 363, 1324–1334, doi: 10.1056/NEJMoa0911123 (2010). [DOI] [PMC free article] [PubMed] [Google Scholar]
- 21.Du H et al. Antitumor Responses in the Absence of Toxicity in Solid Tumors by Targeting B7-H3 via Chimeric Antigen Receptor T Cells. Cancer Cell 35, 221–237.e228, doi: 10.1016/j.ccell.2019.01.002 (2019). [DOI] [PMC free article] [PubMed] [Google Scholar]
- 22.Castelletti L, Yeo D, van Zandwijk N & Rasko JEJ Anti-Mesothelin CAR T cell therapy for malignant mesothelioma. Biomark Res 9, 11, doi: 10.1186/s40364-021-00264-1 (2021). [DOI] [PMC free article] [PubMed] [Google Scholar]
- 23.Landoni E et al. Modifications to the Framework Regions Eliminate Chimeric Antigen Receptor Tonic Signaling. Cancer Immunol Res, doi: 10.1158/2326-6066.Cir-20-0451 (2021). [DOI] [PMC free article] [PubMed] [Google Scholar]
- 24.Beatty GL et al. Mesothelin-specific chimeric antigen receptor mRNA-engineered T cells induce anti-tumor activity in solid malignancies. Cancer Immunol Res 2, 112–120, doi: 10.1158/2326-6066.CIR-13-0170 (2014). [DOI] [PMC free article] [PubMed] [Google Scholar]
- 25.Fujiwara K et al. Hinge and Transmembrane Domains of Chimeric Antigen Receptor Regulate Receptor Expression and Signaling Threshold. Cells 9, doi: 10.3390/cells9051182 (2020). [DOI] [PMC free article] [PubMed] [Google Scholar]
- 26.Chen Y et al. Eradication of Neuroblastoma by T Cells Redirected with an Optimized GD2-Specific Chimeric Antigen Receptor and Interleukin-15. Clin Cancer Res 25, 2915–2924, doi: 10.1158/1078-0432.Ccr-18-1811 (2019). [DOI] [PubMed] [Google Scholar]
- 27.Louis CU et al. Antitumor activity and long-term fate of chimeric antigen receptor-positive T cells in patients with neuroblastoma. Blood 118, 6050–6056, doi: 10.1182/blood-2011-05-354449 (2011). [DOI] [PMC free article] [PubMed] [Google Scholar]
- 28.Heczey A et al. Anti-GD2 CAR-NKT cells in patients with relapsed or refractory neuroblastoma: an interim analysis. Nat Med 26, 1686–1690, doi: 10.1038/s41591-020-1074-2 (2020). [DOI] [PubMed] [Google Scholar]
- 29.Kramer K et al. Disialoganglioside G(D2) loss following monoclonal antibody therapy is rare in neuroblastoma. Clin Cancer Res 4, 2135–2139 (1998). [PubMed] [Google Scholar]
- 30.Schumacher-Kuckelkorn R et al. Lack of immunocytological GD2 expression on neuroblastoma cells in bone marrow at diagnosis, during treatment, and at recurrence. Pediatr Blood Cancer 64, 46–56, doi: 10.1002/pbc.26184 (2017). [DOI] [PubMed] [Google Scholar]
- 31.Valitutti S, Müller S, Cella M, Padovan E & Lanzavecchia A Serial triggering of many T-cell receptors by a few peptide-MHC complexes. Nature 375, 148–151, doi: 10.1038/375148a0 (1995). [DOI] [PubMed] [Google Scholar]
- 32.Kofler DM et al. CD28 costimulation Impairs the efficacy of a redirected t-cell antitumor attack in the presence of regulatory t cells which can be overcome by preventing Lck activation. Molecular therapy : the journal of the American Society of Gene Therapy 19, 760–767, doi: 10.1038/mt.2011.9 (2011). [DOI] [PMC free article] [PubMed] [Google Scholar]
- 33.Morello A, Sadelain M & Adusumilli PS Mesothelin-Targeted CARs: Driving T Cells to Solid Tumors. Cancer Discov 6, 133–146, doi: 10.1158/2159-8290.Cd-15-0583 (2016). [DOI] [PMC free article] [PubMed] [Google Scholar]
- 34.Pellegatta S et al. Constitutive and TNFα-inducible expression of chondroitin sulfate proteoglycan 4 in glioblastoma and neurospheres: Implications for CAR-T cell therapy. Sci Transl Med 10, doi: 10.1126/scitranslmed.aao2731 (2018). [DOI] [PMC free article] [PubMed] [Google Scholar]
- 35.Geldres C et al. T lymphocytes redirected against the chondroitin sulfate proteoglycan-4 control the growth of multiple solid tumors both in vitro and in vivo. Clin Cancer Res 20, 962–971, doi: 10.1158/1078-0432.Ccr-13-2218 (2014). [DOI] [PMC free article] [PubMed] [Google Scholar]
- 36.Salter AI et al. Phosphoproteomic analysis of chimeric antigen receptor signaling reveals kinetic and quantitative differences that affect cell function. Sci Signal 11, doi: 10.1126/scisignal.aat6753 (2018). [DOI] [PMC free article] [PubMed] [Google Scholar]
- 37.Kawalekar OU et al. Distinct Signaling of Coreceptors Regulates Specific Metabolism Pathways and Impacts Memory Development in CAR T Cells. Immunity 44, 380–390, doi: 10.1016/j.immuni.2016.01.021 (2016). [DOI] [PubMed] [Google Scholar]
- 38.Sohara Y et al. Lytic bone lesions in human neuroblastoma xenograft involve osteoclast recruitment and are inhibited by bisphosphonate. Cancer Res 63, 3026–3031 (2003). [PubMed] [Google Scholar]
- 39.Song L et al. Valpha24-invariant NKT cells mediate antitumor activity via killing of tumor-associated macrophages. J Clin Invest 119, 1524–1536, doi: 10.1172/JCI37869 (2009). [DOI] [PMC free article] [PubMed] [Google Scholar]
- 40.Song L et al. Oncogene MYCN regulates localization of NKT cells to the site of disease in neuroblastoma. J Clin Invest 117, 2702–2712, doi: 10.1172/jci30751 (2007). [DOI] [PMC free article] [PubMed] [Google Scholar]
- 41.Hirschmann-Jax C et al. A distinct “side population” of cells with high drug efflux capacity in human tumor cells. Proc Natl Acad Sci U S A 101, 14228–14233, doi: 10.1073/pnas.0400067101 (2004). [DOI] [PMC free article] [PubMed] [Google Scholar]
- 42.Di Paolo D et al. Neuroblastoma-targeted nanoparticles entrapping siRNA specifically knockdown ALK. Molecular therapy : the journal of the American Society of Gene Therapy 19, 1131–1140, doi: 10.1038/mt.2011.54 (2011). [DOI] [PMC free article] [PubMed] [Google Scholar]
- 43.Vera J et al. T lymphocytes redirected against the kappa light chain of human immunoglobulin efficiently kill mature B lymphocyte-derived malignant cells. Blood 108, 3890–3897, doi: 10.1182/blood-2006-04-017061 (2006). [DOI] [PMC free article] [PubMed] [Google Scholar]
- 44.Diaconu I et al. Inducible Caspase-9 Selectively Modulates the Toxicities of CD19-Specific Chimeric Antigen Receptor-Modified T Cells. Molecular therapy : the journal of the American Society of Gene Therapy 25, 580–592, doi: 10.1016/j.ymthe.2017.01.011 (2017). [DOI] [PMC free article] [PubMed] [Google Scholar]
- 45.Wang G et al. Fully human antibody V(H) domains to generate mono and bispecific CAR to target solid tumors. J Immunother Cancer 9, doi: 10.1136/jitc-2020-002173 (2021). [DOI] [PMC free article] [PubMed] [Google Scholar]
- 46.Xu Y et al. Closely related T-memory stem cells correlate with in vivo expansion of CAR.CD19-T cells and are preserved by IL-7 and IL-15. Blood 123, 3750–3759, doi: 10.1182/blood-2014-01-552174 (2014). [DOI] [PMC free article] [PubMed] [Google Scholar]
- 47.Imai K, Wilson BS, Bigotti A, Natali PG & Ferrone SA 94,000-dalton glycoprotein expressed by human melanoma and carcinoma cells. J Natl Cancer Inst 68, 761–769 (1982). [PubMed] [Google Scholar]
- 48.Hoyos V et al. Engineering CD19-specific T lymphocytes with interleukin-15 and a suicide gene to enhance their anti-lymphoma/leukemia effects and safety. Leukemia 24, 1160–1170, doi: 10.1038/leu.2010.75 (2010). [DOI] [PMC free article] [PubMed] [Google Scholar]
- 49.Love MI, Huber W & Anders S Moderated estimation of fold change and dispersion for RNA-seq data with DESeq2. Genome Biol 15, 550, doi: 10.1186/s13059-014-0550-8 (2014). [DOI] [PMC free article] [PubMed] [Google Scholar]
Associated Data
This section collects any data citations, data availability statements, or supplementary materials included in this article.
Supplementary Materials
Data Availability Statement
Source data for this study have been provided as Source Data files. The RNA-seq datasets generated and analyzed during the current study are not publicly available (the genetic information from primary human T cells in this study was not consented to be published in the public domain) and will be available from the corresponding authors upon request. All other data supporting the findings of this study are available from the corresponding author on reasonable request.


