Abstract
Clinical ultrasound is widely used for quantitative diagnosis. To clarify the relationship between anatomical and acoustic properties, high resolution imaging using high-frequency ultrasound (HFU) is required. However, when tissue properties are evaluated using HFU, the depth of field (DOF) is limited. To overcome this problem, an annular array transducer, which has a simple structure and produces high-quality images, is applied to HFU measurement. In previous phantom experiments, we demonstrated that the HFU annular array extends the DOF compared to that of a single-element transducer for quantitative ultrasound (QUS) analysis. Here, we extend that work by applying QUS methods to an ex vivo rat liver. The present study demonstrates that an annular array extends the region and improves the resolution for tissue characterization for an excised healthy rat liver. Amplitude envelope statistics and spectral-based analysis are used as QUS methods. © 2020 The Japan Society of Applied Physics
1. Introduction
Quantitative ultrasound (QUS) is a useful technique for non-invasive evaluation of soft tissue. QUS methods add quantitative information to existing image information and Doppler information in clinical practice to improve the objectivity and quantitativeness of diagnosis. QUS methods can be roughly divided into elastography,1–4) amplitude envelope statistics,5–9) and spectral-based analysis.10–12) These methods have been applied to tissues such as breast cancer,13–15) liver,16,17) and skin.7,8) In amplitude envelope statistics, the amplitude envelope of the echo signal is converted into a probability density function (PDF) and then compared with a mathematical model to quantitatively evaluate the characteristics of the scattering source.16,18) In spectral-based analysis, the physical parameters of the scattering source can be obtained by comparing the theoretical model of the backscatter coefficient (BSC), which contains information about the frequency characteristics of backscattering, with the measured values.19–21) Spectral-based analysis is a dependency-free measurement system. In shear wave elastography, shear waves are generated in the object of interest by the acoustic radiation force, and the mechanical properties are evaluated after the propagation process is observed.12,22) However, there are concerns about the risk of a temperature rise associated with generating the acoustic radiation force.23,24) In amplitude envelope statistics and spectral-based analysis, the evaluation mainly uses the radio-frequency (RF) signal, which contains information about the backscattered wave, without changing the measurement sequence.
The relation between QUS parameters and pathological information for soft tissue has been investigated.25,26) For this fundamental QUS research, high-frequency ultrasound (HFU) should be used because a high resolution is necessary to organize the correspondence of the morphological information of soft tissue. However, because there is a trade-off between resolution and depth of field (DOF), the estimation accuracy of QUS parameters decreases with increasing DOF and the estimation range depends on the measurement conditions. An array transducer can be used to effectively increase the DOF of HFU with a low f-number. The ideal array is a two-dimensional linear array. However, the fabrication of a two-dimensional linear array for HFU is difficult and expensive. Therefore, we employ an annular array transducer that can be simply created for HFU measurement.27) Annular arrays have been applied to ophthalmological imaging,28,29) imaging of small animals,30,31) and photoacoustic imaging.32,33) However, few studies have applied annular arrays to QUS.
In our previous studies using homogeneously scattering phantoms,34,35) a 20 MHz HFU annular array was used for amplitude envelope statistics and spectral-based analysis (reflector method). An improved DOF for QUS parameter estimation was found compared to that for the fixed focusing (FF) case.36) The present study estimates QUS parameters with high resolution and high sensitivity using a HFU annular array for ex vivo QUS. Two types of backscattering analysis, namely amplitude envelope statistics and spectral-based analysis, were performed on the acquired RF signals from an excised rat liver to verify the annular array performance.
For amplitude envelope statistics, the amplitude envelope characteristics of RF signals were translated into a PDF and then evaluated using the highly versatile Nakagami (NA) distribution model.37) Among the quantitative parameters of the NA distribution, a shape parameter was used. For spectral-based analysis, we adopted a method that has high accuracy with array transducers (reference phantom method).38) The estimated scatterer diameter (ESD) was calculated by solving an inverse problem using a spherical Gaussian model (SGM).19) The SGM is a theoretical model that is widely applied to soft tissues.21,39) The backscatter characteristics of the entire liver parenchyma were evaluated with the two types of QUS parameters. Finally, we considered the blood vessel wall and verified the effectiveness of the annular array for estimating QUS parameters in the lateral direction.
2. Materials and methods
2.1. Annular array and focusing strategy
The annular array used in this study had five elements with a center frequency of 20 MHz. The fabrication method for the HFU annular array was described by Ketterling et al.27) A 25 μm thick poly(vinylidene fluoride-tetrafluoroethylene) film membrane was used for the acoustic layer of the array sensor. This membrane was metalized on one side and bonded to a copper-clad polyimide film (flex circuit) with five equal-area annuli and degassed epoxy. The 20 MHz annular array had a 10 mm total aperture, a 31 mm geometric focus, and a 100 μm spacing between adjacent annuli.
As a delay and sum process, synthetic focusing (SF) was employed to improve the DOF and resolution.40) In SF, the acquired echo data set is post-processed and 25 pairs (Tx. channels × Rx. channels) of RF signals are shifted in the axial direction. At an arbitrary focal point f, the one-way delay tn of the nth annuli is computed as41)
| (1) |
where an is the average radius of the nth element, R is the geometric focal length (i.e. 31 mm), and c is the speed of sound. Note that the round-trip delay time is , where is the delay of the lth transmit channel and is the delay of the mth receive channel. The total delays were calculated for the 25 pairs of RF signals and applied to the acquired a-lines. Synthetically focused data were generated by applying the delay and sum process to each pixel at an arbitrary focal depth. The SF equation is defined as40)
| (2) |
where el,m is the RF signal for the lth transmit and the mth receive channels. N = 5 because the annular array had five elements. If the RF signals are summed without a delay shift (ttot = 0), the final data will simulate a single-element focused transducer with the same total aperture and geometric focus as those for the annular array (FF case). The acoustic specifications of the annular array can be found elsewhere.35)
2.2. Amplitude envelope statistics
2.2.1. Probability density function.
The PDF for the backscattered amplitude envelope is commonly modeled using probability distribution models. The Rayleigh (RA) distribution is a representative distribution that describes the amplitude envelope when the scattering source has a high scatterer number density and the scatterers are uniformly distributed.42) The RA distribution is expressed as
| (3) |
where σ is the mode value of the echo amplitude envelope X.
In addition, the PDFs for the RF signals can be categorized into Rayleigh, pre-Rayleigh (scatterers are inhomogeneously distributed or the scatterer number density is low), and post-Rayleigh distributions (the scattering medium contains a coherent signal component in addition to a speckle pattern component).8,18)
2.2.2. QUS parameter estimation with Nakagami distribution.
The RA distribution follows the PDF for the echo signal amplitude only for a homogeneous scattering medium (i.e. >10 scatterers/resolution cell). Hence, we employed the NA distribution, which is a generalized two-parameter statistical model that exhibits computational simplicity and encompasses the Rayleigh, pre-Rayleigh and post-Rayleigh conditions.18) When X is derived via a Hilbert transform of the RF signal Smeas, PNA(X), which is the PDF for the echo amplitude envelope in the region of interest (ROI) under the NA model, is given by37)
| (4) |
Where Γ() is the gamma function, ω is a scaling parameter, and μ is the NA parameter. In this statistical analysis, μ and ω were determined by maximizing the likelihood estimation using an ascent algorithm. For this estimation, two parameters can be obtained from ω = E(R2) and as the initial values using the moment method.18,43) E is the expected value of the sample points within each small ROI. When maximizing the likelihood estimation, the likelihood estimators (and ) were obtained under the assumption that every envelope value within the ROI is independently and identically distributed based on the general maximum likelihood estimation method. The NA parameter μ is a shape parameter determined based on the statistics of the backscattered signal. As μ varies from 0.5 to 1, the envelope statistics change from a pre-Rayleigh to a Rayleigh distribution, which means that the scatterer density decreases. The statistics of the backscattered signal conform to a post-Rayleigh distribution when μ is larger than 1. When μ is in the range of 0.5–1, its value reflects the scatterer density, namely the number of scatterers per resolution cell. When μ is larger than 1, its value reflects a scattering medium that contains a coherent signal component in addition to a speckle pattern component (post-Rayleigh distribution).
2.3. Spectrum analysis
2.3.1. BSC analysis.
The frequency characteristics of the backscattered signals measured by a transducer include the characteristics of the measurement system (i.e. acoustic field and electrical circuit) and those of the scatterers in the scattering medium. To cancel the characteristics of the measurement system and measure the BSC, the reference phantom method was employed.38) This method has been used for HFU and is well documented in a report by Franceschini et al.25) The measured BSC value σmeas can be estimated from the ROI as
| (5) |
where is the average of the power spectrum for several adjacent lines (18 × 18 lines) in the ROI, is the power spectrum for a reference phantom, and k is the acoustic wavenumber (k = 2π/λ). σfaran(k) is the theoretical BSC estimated based on a solid sphere model (Faran’s theory).44) Faran’s theory includes the effects of shear waves, which are used separately to model backscatter from spherical particles and thereby describe the structures of the medium. The attenuation functions Ameas(k) and Aref(k) in Eq. (5) compensate for acoustic attenuation from the tissue surface to the center of the ROI, and are defined as10,45)
| (6) |
where α is the attenuation coefficient for the intervening tissues, x is the propagation distance for the upper part of the ROI, and L is the length of the ROI that is defined using a Hamming window. In Eq. (6), the first, second, and third terms on the right side are used to compensate for attenuation caused by transmission through tissue and attenuation in the analysis window and Hamming window, respectively.
2.3.2. QUS parameter estimation with SGM.
The BSC can be constructed as the product of the BSC in the Rayleigh limit and the form factor.19) The Rayleigh limit indicates whether the scatterer is large or small based on the incident wavelength. In general, the Rayleigh limit is reached when the scatterer diameter is smaller than 1/10 of the wavelength (i.e. ka → 0). The form factor expresses the frequency dependence of backscattering for different diameters, shapes, and acoustic properties of the scatters. The form factor in the BSC is often assumed to be an isotropic solid or a fluid sphere with a spherical shell. In biological tissues, where it is difficult to identify the scattering source, the scatterer diameter is often estimated by defining the effective diameter of an aggregate of several scattering sources as one scattering source with a Gaussian-distributed acoustic impedance. The SGM has been employed in many spectral-based analysis studies for tissue characterization (e.g. mammal tumors21) and liver39,46)). In the SGM, the tissue structure is assumed to be a distribution where the acoustic impedance variation is continuously changing around the mean value, and the effective radius is related to the impedance distribution of the scatterer. The theoretical BSC uses the following SGM equation:19)
| (7) |
where k is the wavenumber, Vs is the sphere volume, nz is the acoustic concentration, and aG is the mean effective radius of the scatterer. ESD is defined as ESD = 2aG.
For the animal study, the scatterer size was estimated by fitting the measured BSC σmeas to the theoretical BSC σSGM by minimizing the cost function
| (8) |
The cost function was minimized to the −20 dB frequency bandwidth (15–23 MHz) of the measured spectrum. The fitting procedure was conducted using the minimization routine fminresearch (i.e. Nelder–Mead simplex method) in MATLAB (MathWorks).
2.4. Data acquisition and analysis
The RF echo data sets of the 25 transmit-receive ring pairs were acquired by scanning the annular array using our self-made ultrasound scanner (see Fig. 5 in a previous report35)). To accomplish this task, one element was excited with a negative impulse, and the echo was received by one of the five elements filtered with a 1–35 MHz band-pass filter using a pulser/receiver (Model 5800, Olympus). A cross-point switch (CXL/8X8, Cytec), which permits any input to be connected to any output, was configured with the five array elements on the input lines and the pulser/receiver on two output lines. Each echo signal was digitized to 12 bits/sample by a digital storage oscilloscope (HDO6104, Teledyne LeCroy) at a sampling frequency of 250 MHz. All data acquisition was controlled using LabVIEW (National Instruments).
Fig. 5.
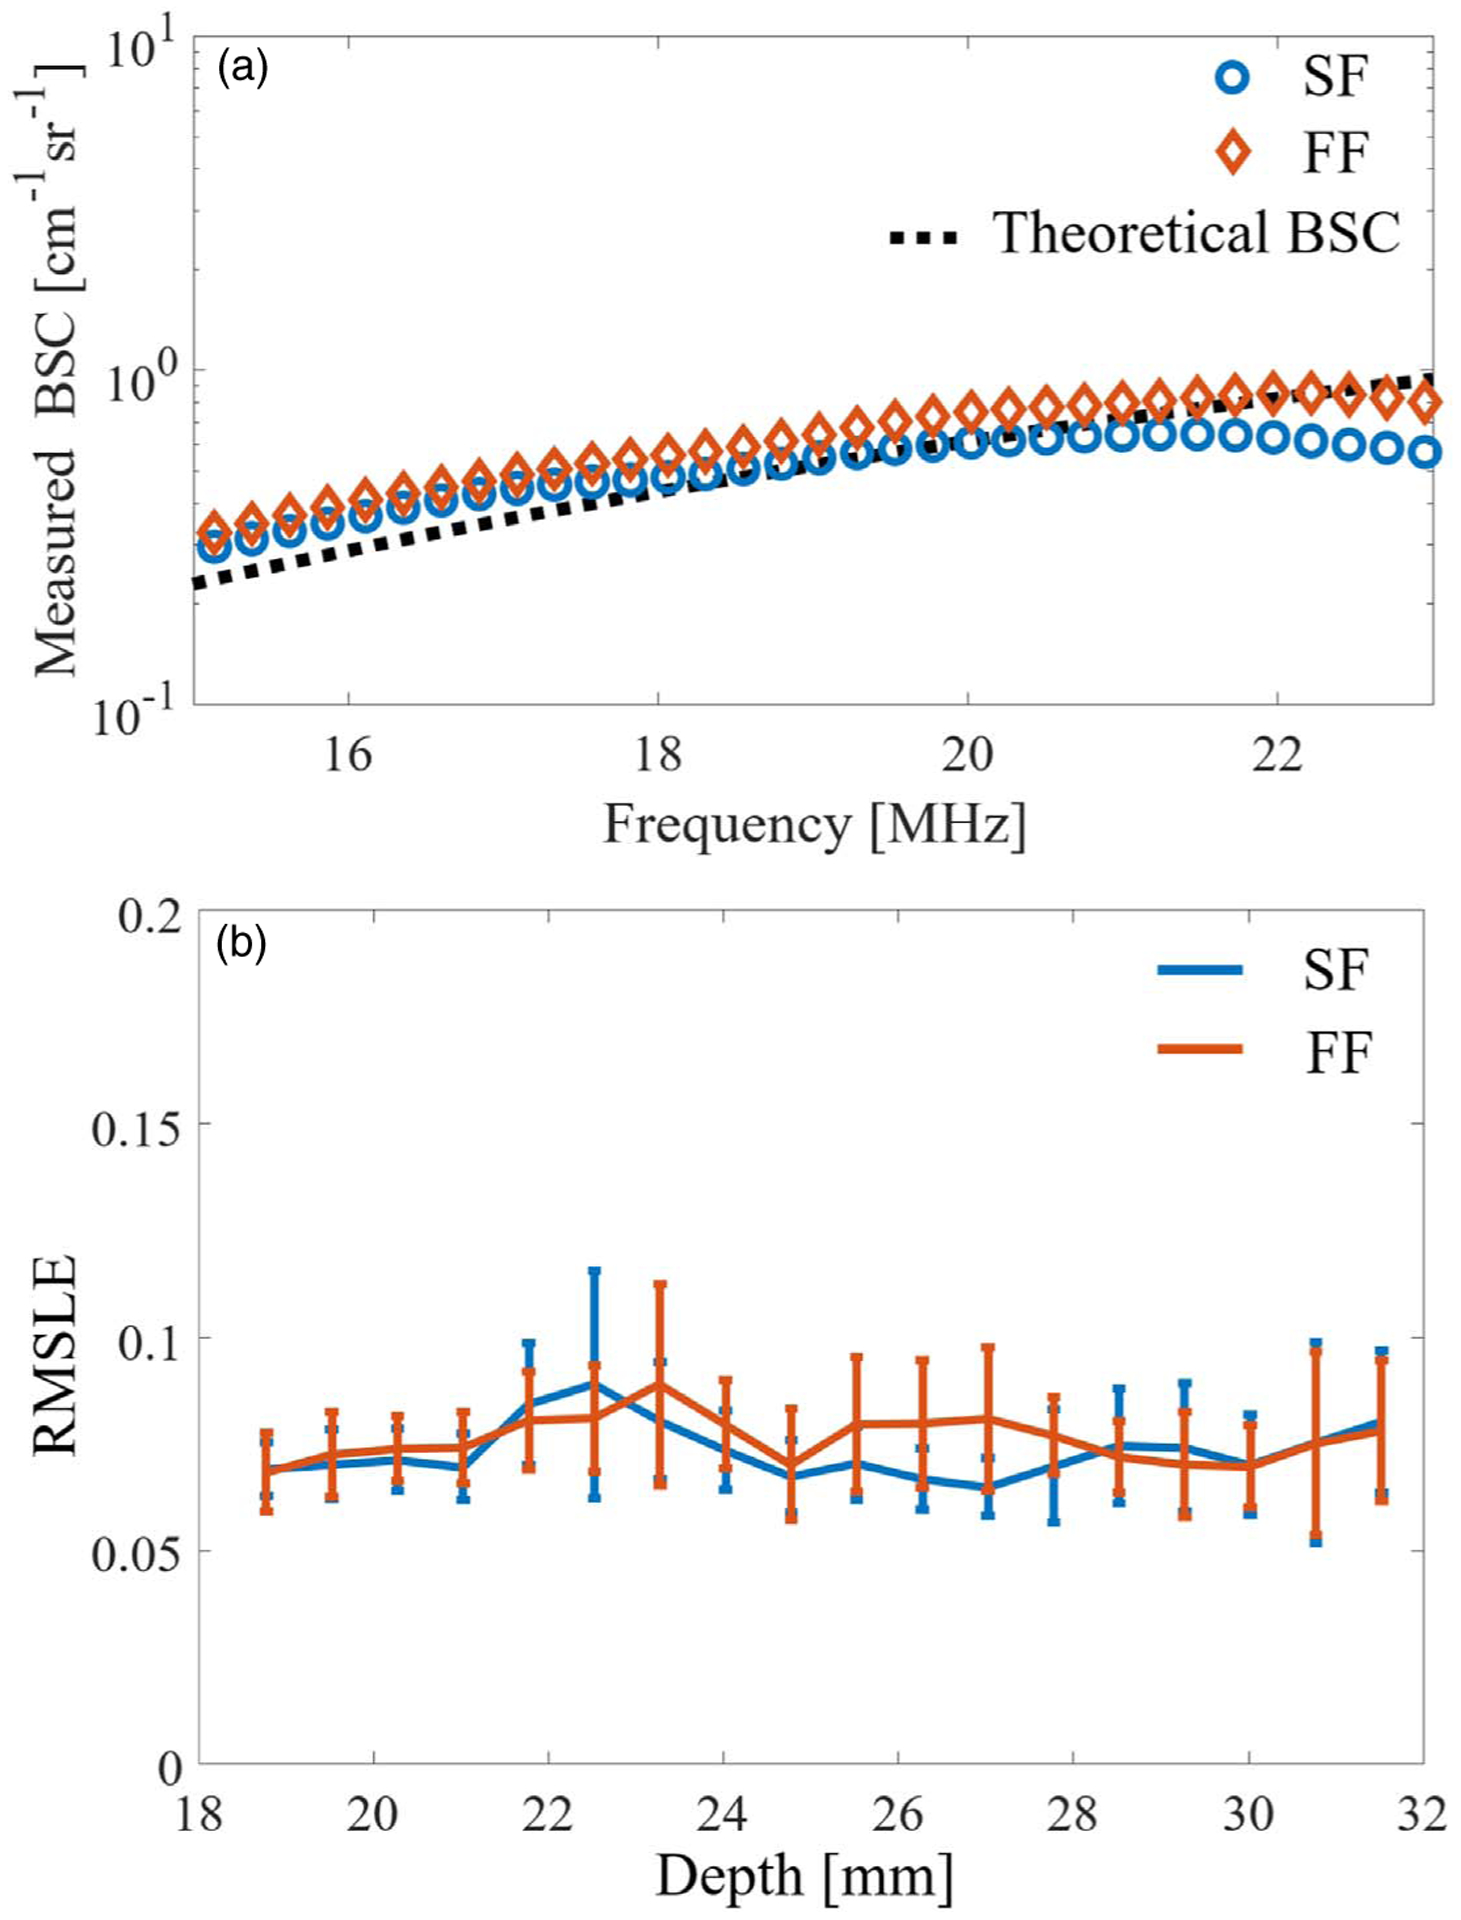
(a) Representative value of the measured BSC (depth: 23.5 mm), and (b) fluctuation of the RMSLE versus depth for the two focusing methods.
The annular array was mechanically scanned in the lateral and slice directions along the three-axis linear motor stage (MTN100CC, Newport). The step size was 30 μm in each scan. All objects were immersed in degassed water at 20 °C–22 °C.
After the application of two beamforming algorithms to the obtained data sets for the 25 transmit and receive pairs, two QUS parameters were estimated with a ROI that was 740 μm in the axial direction and 540 μm in the lateral direction. The axial size was defined as 10 times the acoustic wavelength calculated at 20 MHz, and the lateral size was defined as 3 times the point spread function (PSF) in the lateral direction. The lateral and axial PSF values were 180 and 100 μm, respectively, at the geometric focal depth. The PFS value was defined as the −6 dB range of the maximum echo amplitude.
2.4.1. Homogeneous scattering phantom.
The homogeneous scattering phantom was a mixture of distilled water, 2 wt% agar powder (A1296, Sigma-Aldrich), and 0.5% acrylic particles with a mean diameter of 20 μm (MX-2000, Soken). After the agar had been melted in the solution at 90 °C, the solutions were molded in a rectangular case (width × length × height = 8 cm × 2 cm × 4 cm).47) The speed of sound and the attenuation coefficient were calculated from the echo signal measured by a planar transducer (v313, Panametrics-NDT) using the standard substitution method.48) The attenuation coefficient was estimated at 9–17 MHz. The reference phantom used in these experiments had a homogeneous distribution of 20 μm particles at a concentration of 0.5 wt%.
2.4.2. Ex vivo rat liver.
The liver was excised from a male rat (Slc:SD) grown at the animal facility in our laboratory from the age of 6 weeks. The healthy liver model rat was fed a normal diet. As shown in Fig. 1, hematoxylin-eosin staining indicated that hepatocytes (approximately 20 μm) were homogeneously distributed. The animal protocols were approved by the Animal Experiment Committee of Chiba University.
Fig. 1.
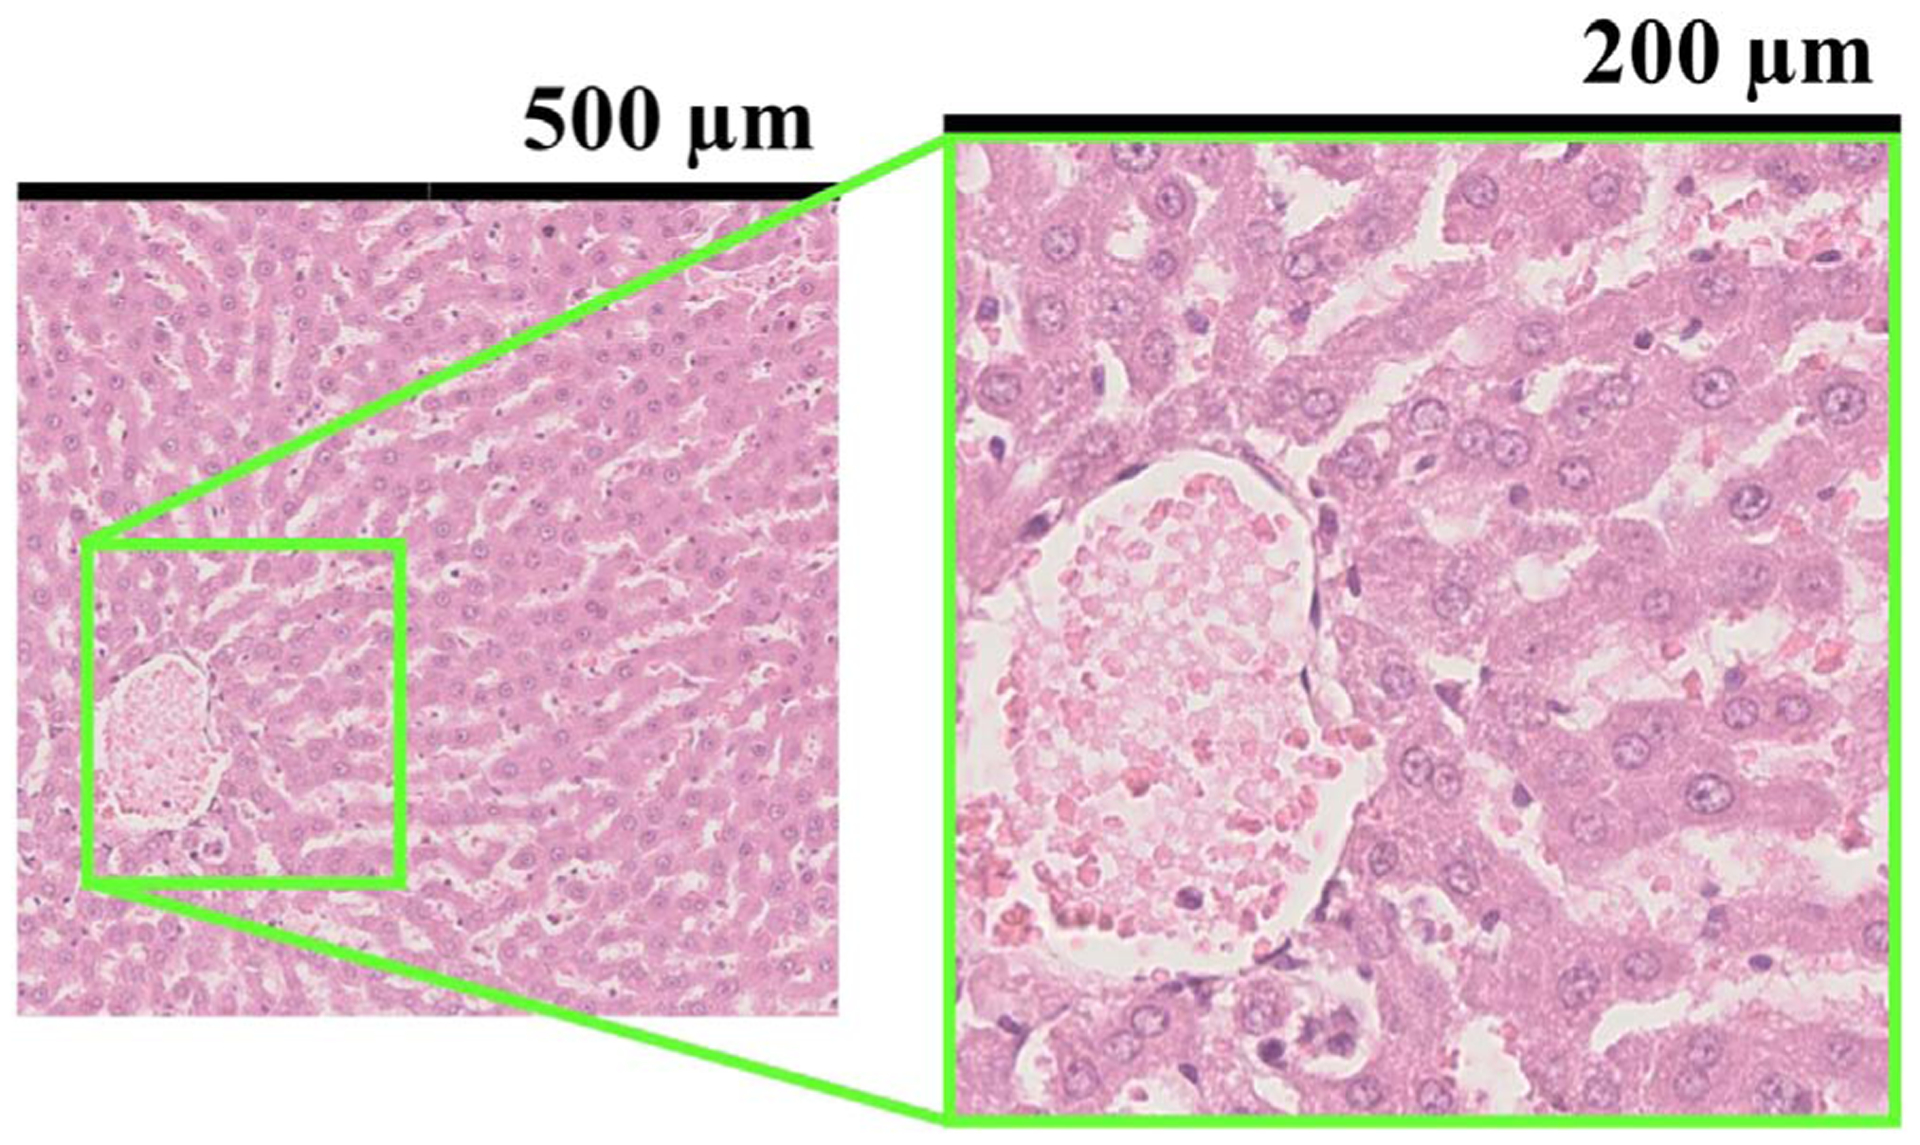
Part of a pathological image whose cross section was the same as that of the ultrasound image. The size of the small ROI size was 500 μm and the lateral resolution of the annular array was 200 μm.
To prevent tissue degeneration (e.g. osmotic pressure) and displacement in the measurement sequence, the excised rat liver was embedded in an agarose gel. The agarose gel was a mixed solution of saline and 3 wt% low-melting agarose (Agarose Super LM, Nacalai Tesque). The temperature at which embedding was started was set to 38 °C. Note that the attenuation caused by the agarose gel was not considered, as done in the study by Mamou et al.11) Figure 2 shows a diagram of the measurement process. To fairly compare the SF and FF results, we set the bottom of the rat liver at a depth of about 26 mm, which produced the maximum amplitude for the SF algorithm.
Fig. 2.
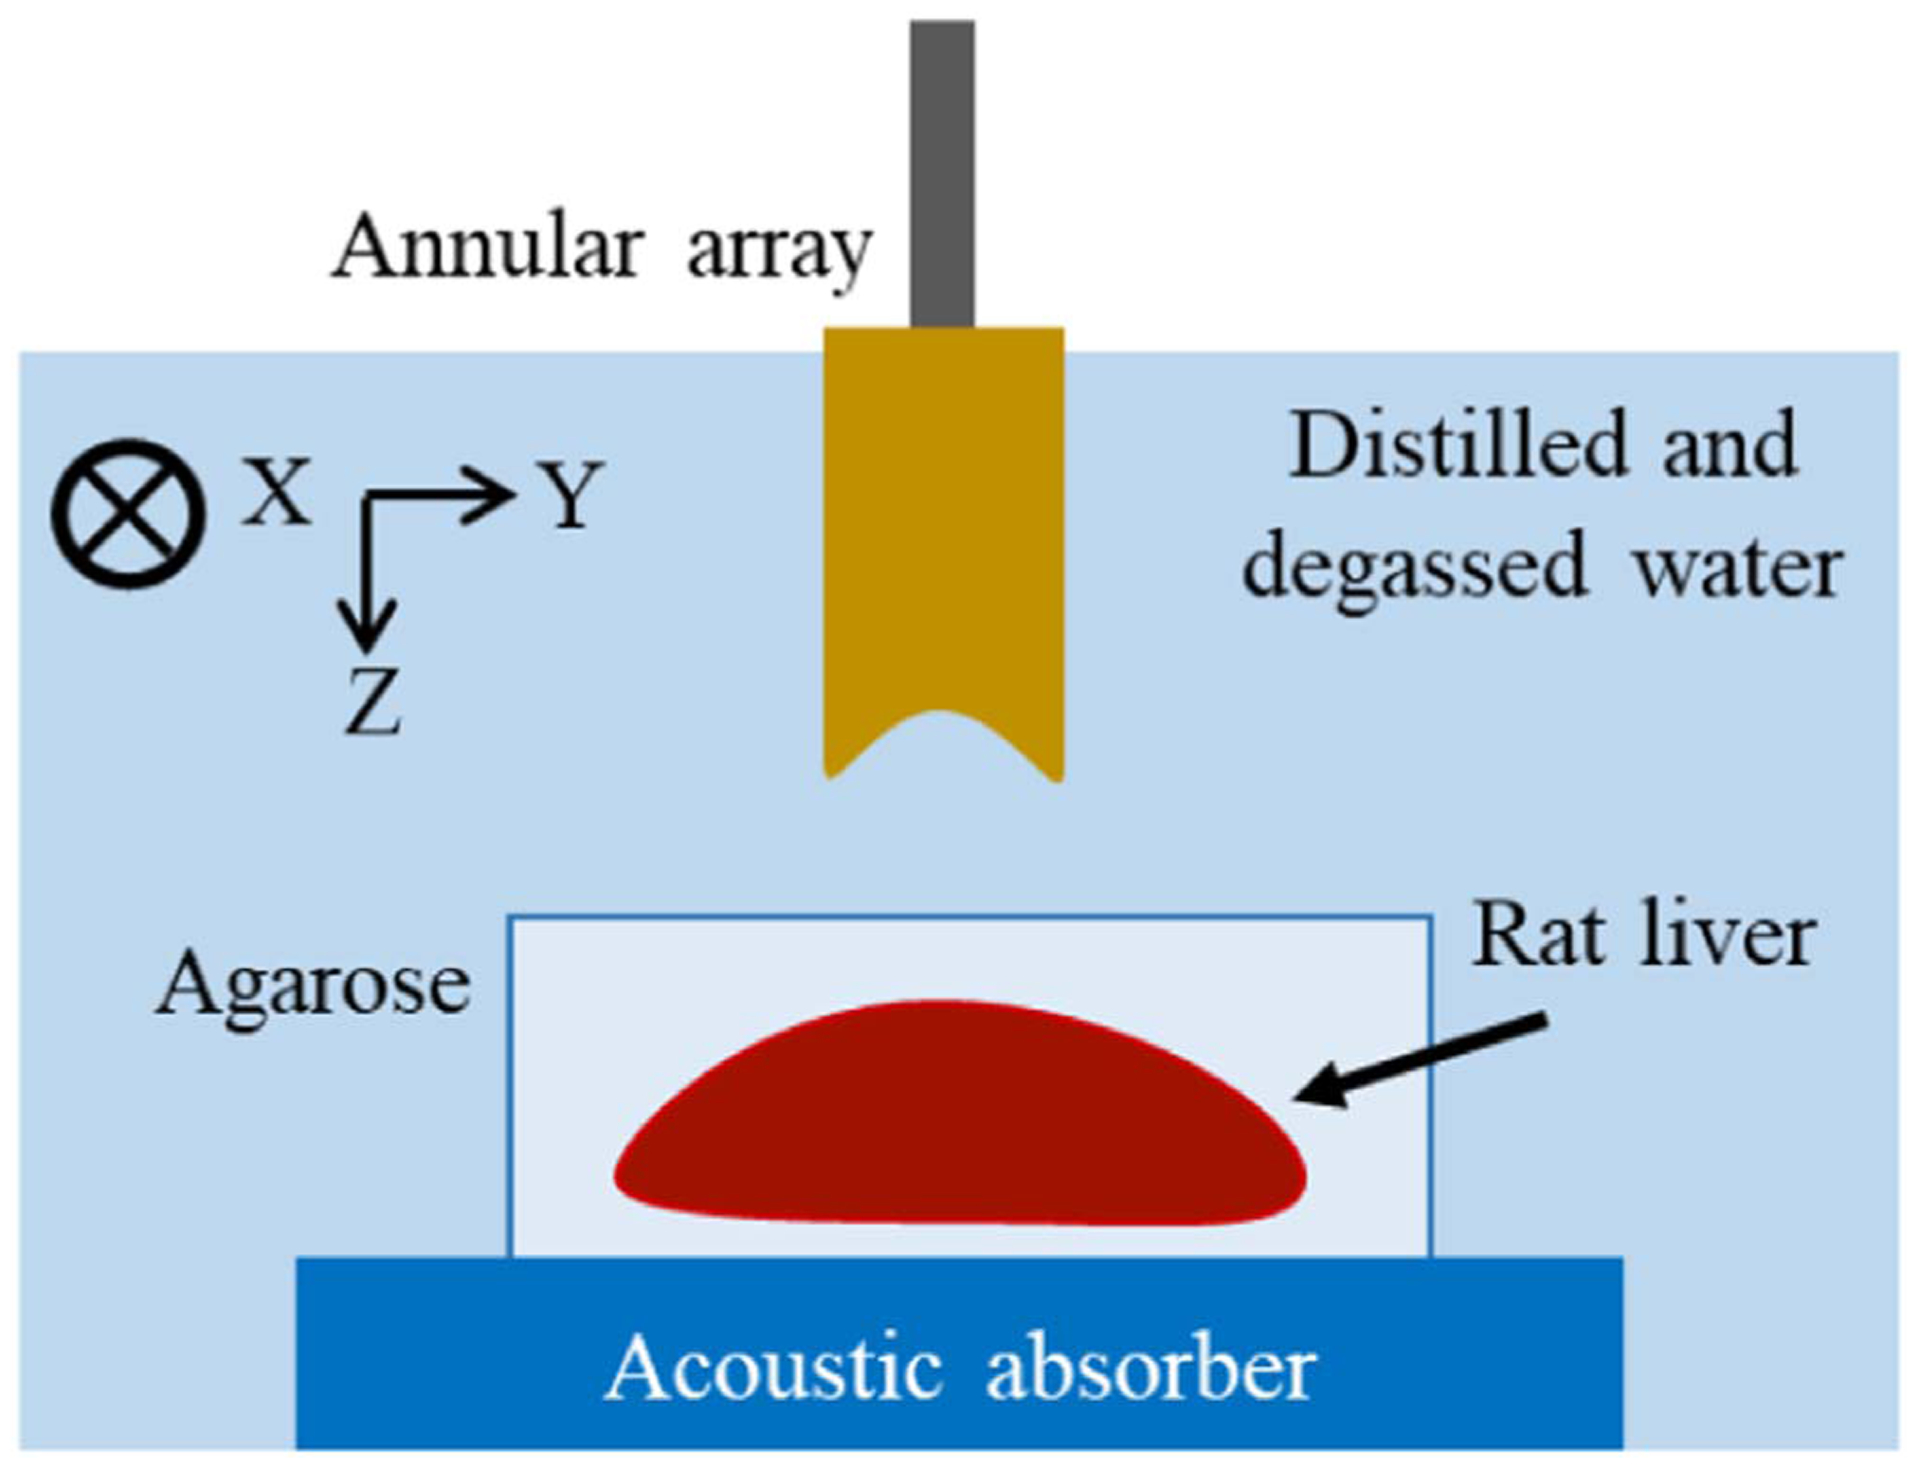
Diagram of measurement process. A liver embedded in agarose gel was placed on an absorbing plate.
3. Results and discussion
3.1. Homogeneous scattering phantom
Figures 3(a) and 3(b) respectively show B-mode ultrasound images of the 10 μm homogeneously distributed phantom for the SF and FF cases. The phantom was made using the procedure described in Sect. 2.4. Figure 3(a) shows that the annular array can maintain good sound pressure in a wide range. Figure 3(b) shows the restricted DOF caused by the fixed focus.
Fig. 3.
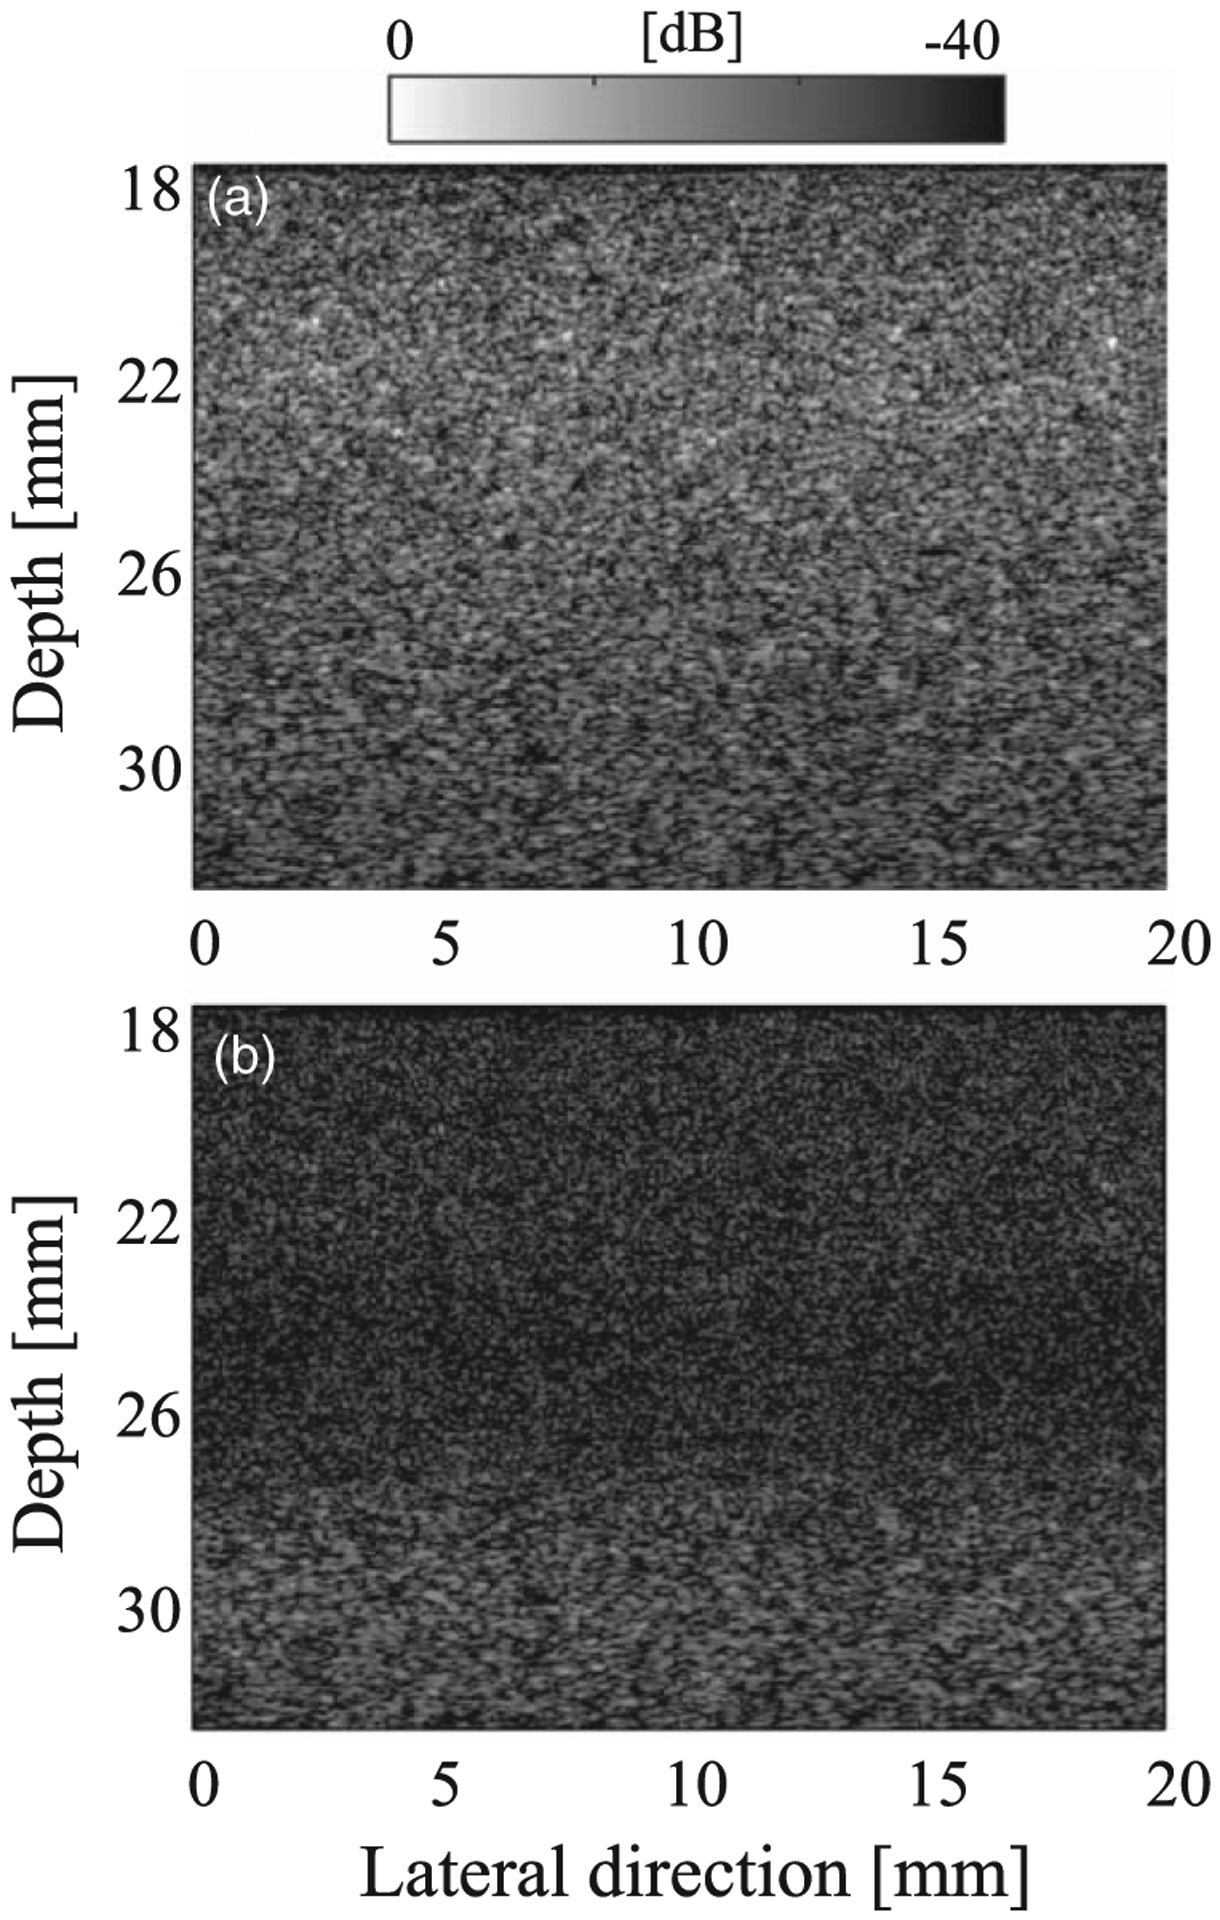
B-mode images of the homogeneous phantom for (a) SF case and (b) FF case.
Figures 4 and 5 show the results of analyzes on homogeneous scattering phantoms. The mean and standard deviation values of the NA parameter μ were estimated for the axial direction. The results are shown in Fig. 4, where μ is converted to a logarithm to improve visibility. The blue and orange lines represent the SF and FF cases, respectively. The black dashed lines correspond to μ = 0.8 and 1, where μ reflects the number of scatterers per resolution cell. For a 0.5% scatterer density (about 9.6 scatterers/resolution cell), the NA parameter was expected to be around 0.8–0.9 (−log10 μ ≈ 0.046 − 0. 097) for the SF case. In the focal region (around 31 mm), the trend of the parameter is quite similar for the two beamforming methods. This is due to a lack of shift in the geometric focal region in the SF algorithm because Eq. (1) shows a delay of 0 near the focal region (1/R − 1/f = 0). For the SF case, the beam width (lateral resolution) is almost constant over the depth range; therefore, the logarithmic NA parameter remains close to the expected value.
Fig. 4.
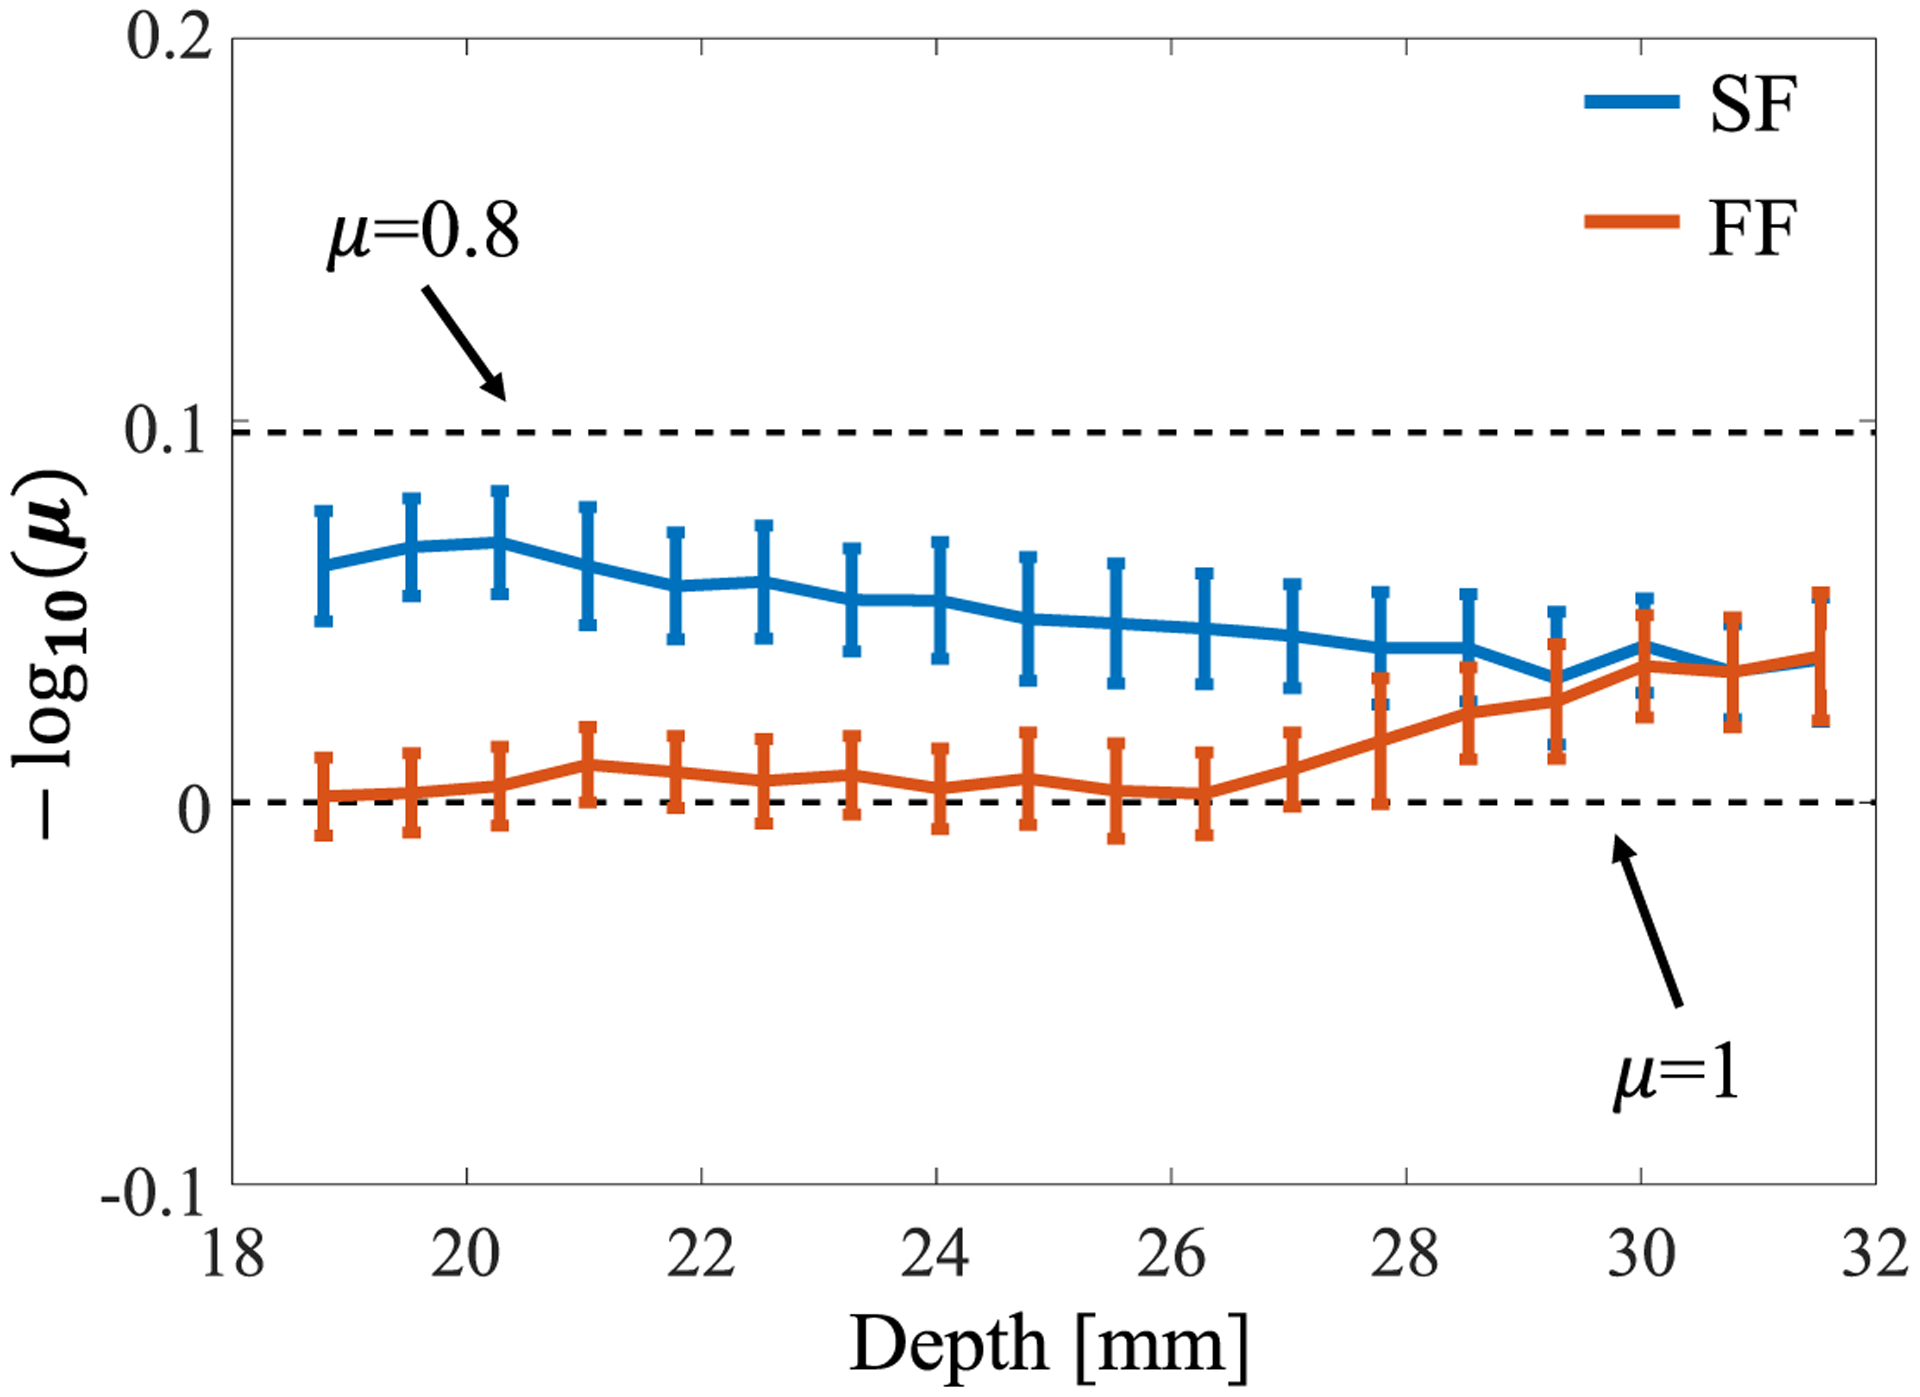
Fluctuation of the NA parameter value versus depth for the two focusing methods.
Outside the focal region, the logarithmic NA parameter for the FF case is 0 (more than 10 scatterers/resolution cell) because the envelope characteristics were unable to maintain the resolution and reached the RA distribution, whereas SF was able to accurately estimate the NA parameter over a wide depth. This result is consistent with our previous phantom study35) and demonstrates the validity of using an annular array in a homogeneous medium.
Figure 5 shows the results of BSC measurements using the 20 μm phantom as a reference medium. Figure 5(a) shows the BSC curves for the two beamforming methods. The blue and orange lines represent the SF and FF cases, respectively. For the representative measured BSC, the BSCs at a 23.5 mm depth were used. The black dashed line indicates the theoretical line for the target phantom. The theoretical BSC was calculated using Faran’s model. The particle properties were set as follows: speed of sound through the particles = 2730 m s−1, particle density = 1.19 g cm−3, Poisson’s ratio = 0.38, particle diameter = 10 μm, speed of sound in the surrounding medium = 1495 m s−1, medium density = 1.0 g cm−3, and volume fraction = 0.5%.44) The plots for measured BSCs and the theoretical BSC are well matched in Fig. 5(a). Figure 5(b) shows the root-mean-squared logarithmic error (RMSLE) to verify the fluctuation of the agreement between the measured and theoretical values for the two focusing cases. The two focusing methods exhibit little depth dependence. In spectral-based analysis, the effect of the ultrasound beam and the electrical characteristics is compensated for by calibration using a reference signal from a medium with known backscatter characteristics.38) After correction by the reference signal, the BSC is evaluated as a single line that averages the backscattering information in the beam. Thus, the BSC result for the SF case is expected to be the same as that for the FF case because the information for the scattering source inside the beam is the same for the two cases when the backscattering source is homogeneously distributed. Figure 5(b) shows the same trend for the two focusing methods, indicating appropriate calibration of the annular array. When we used an acrylic planer as a Ref. 35 the estimation accuracy for the BSC sometimes decreased in the case of defocus. This was caused by the directivity of the annular array elements; if the phases of the acquired signals are not aligned (e.g. geometric design error), the synthesized signals from the flat plate may appear to be separated. The reference phantom method is more accurate and less depth-dependent for estimating the BSC for the annular array.
3.2. Ex vivo rat liver
Figures 6(a) and 6(b) respectively show the B-mode images of the excised rat liver for the SF and FF cases. Outside the focal region (shallower than the focal length), the image quality is lower without the SF algorithm. A blood vessel can be seen in Fig. 6(a).
Fig. 6.
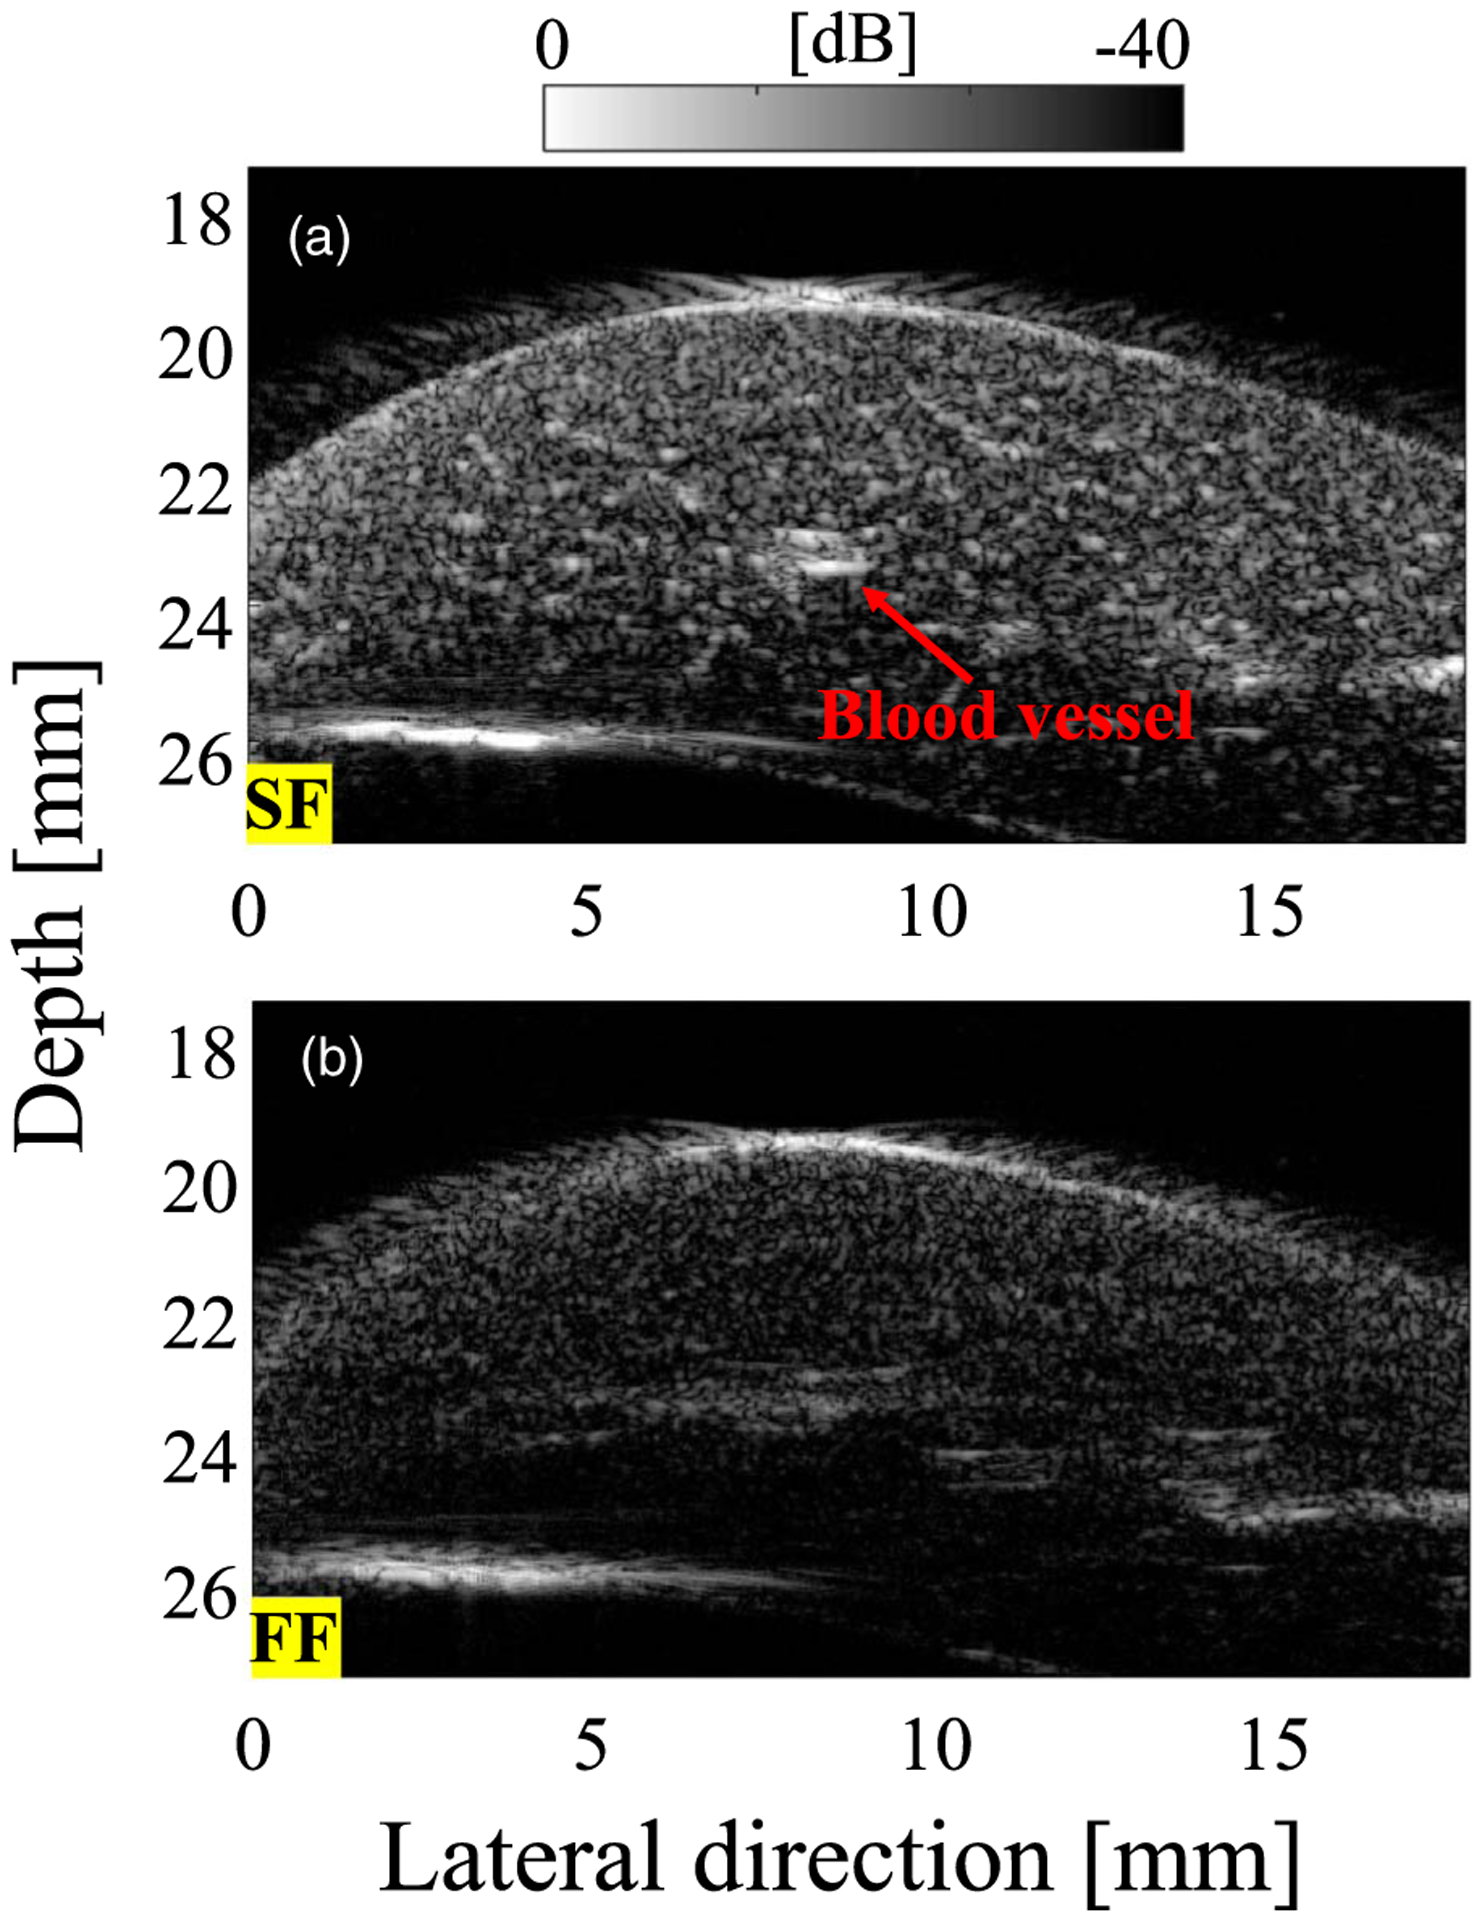
B-mode images of rat liver for (a) SF case and (b) FF case.
To verify the influence of the reference medium, the BSCs of the rat liver were obtained using different reference media (Fig. 7).49) The blue, orange, and green lines show the results for 10, 20, and 30 μm reference media, respectively. The black solid and dashed lines indicate the results for the mammal studies of Ghoshal et al.39) and Kemmerer and Oelze,50) respectively. Only the 30 μm case shows a frequency dependence. The scatterer size for the reference phantom is required to be ka < 1 to avoid resonance peaks that occur with a larger scatterer diameter. For a center frequency of 20 MHz, ka is 0.42, 0.84, and 1.26 when the scatterer diameter is 10, 20, and 30 μm, respectively. Therefore, a diameter of 10 or 20 μm should be used in the present study. We used the 20 μm phantom in the following experiments because it is correlated with a previous mammal study39) and is close to the size of rat hepatocytes (Fig. 1).
Fig. 7.
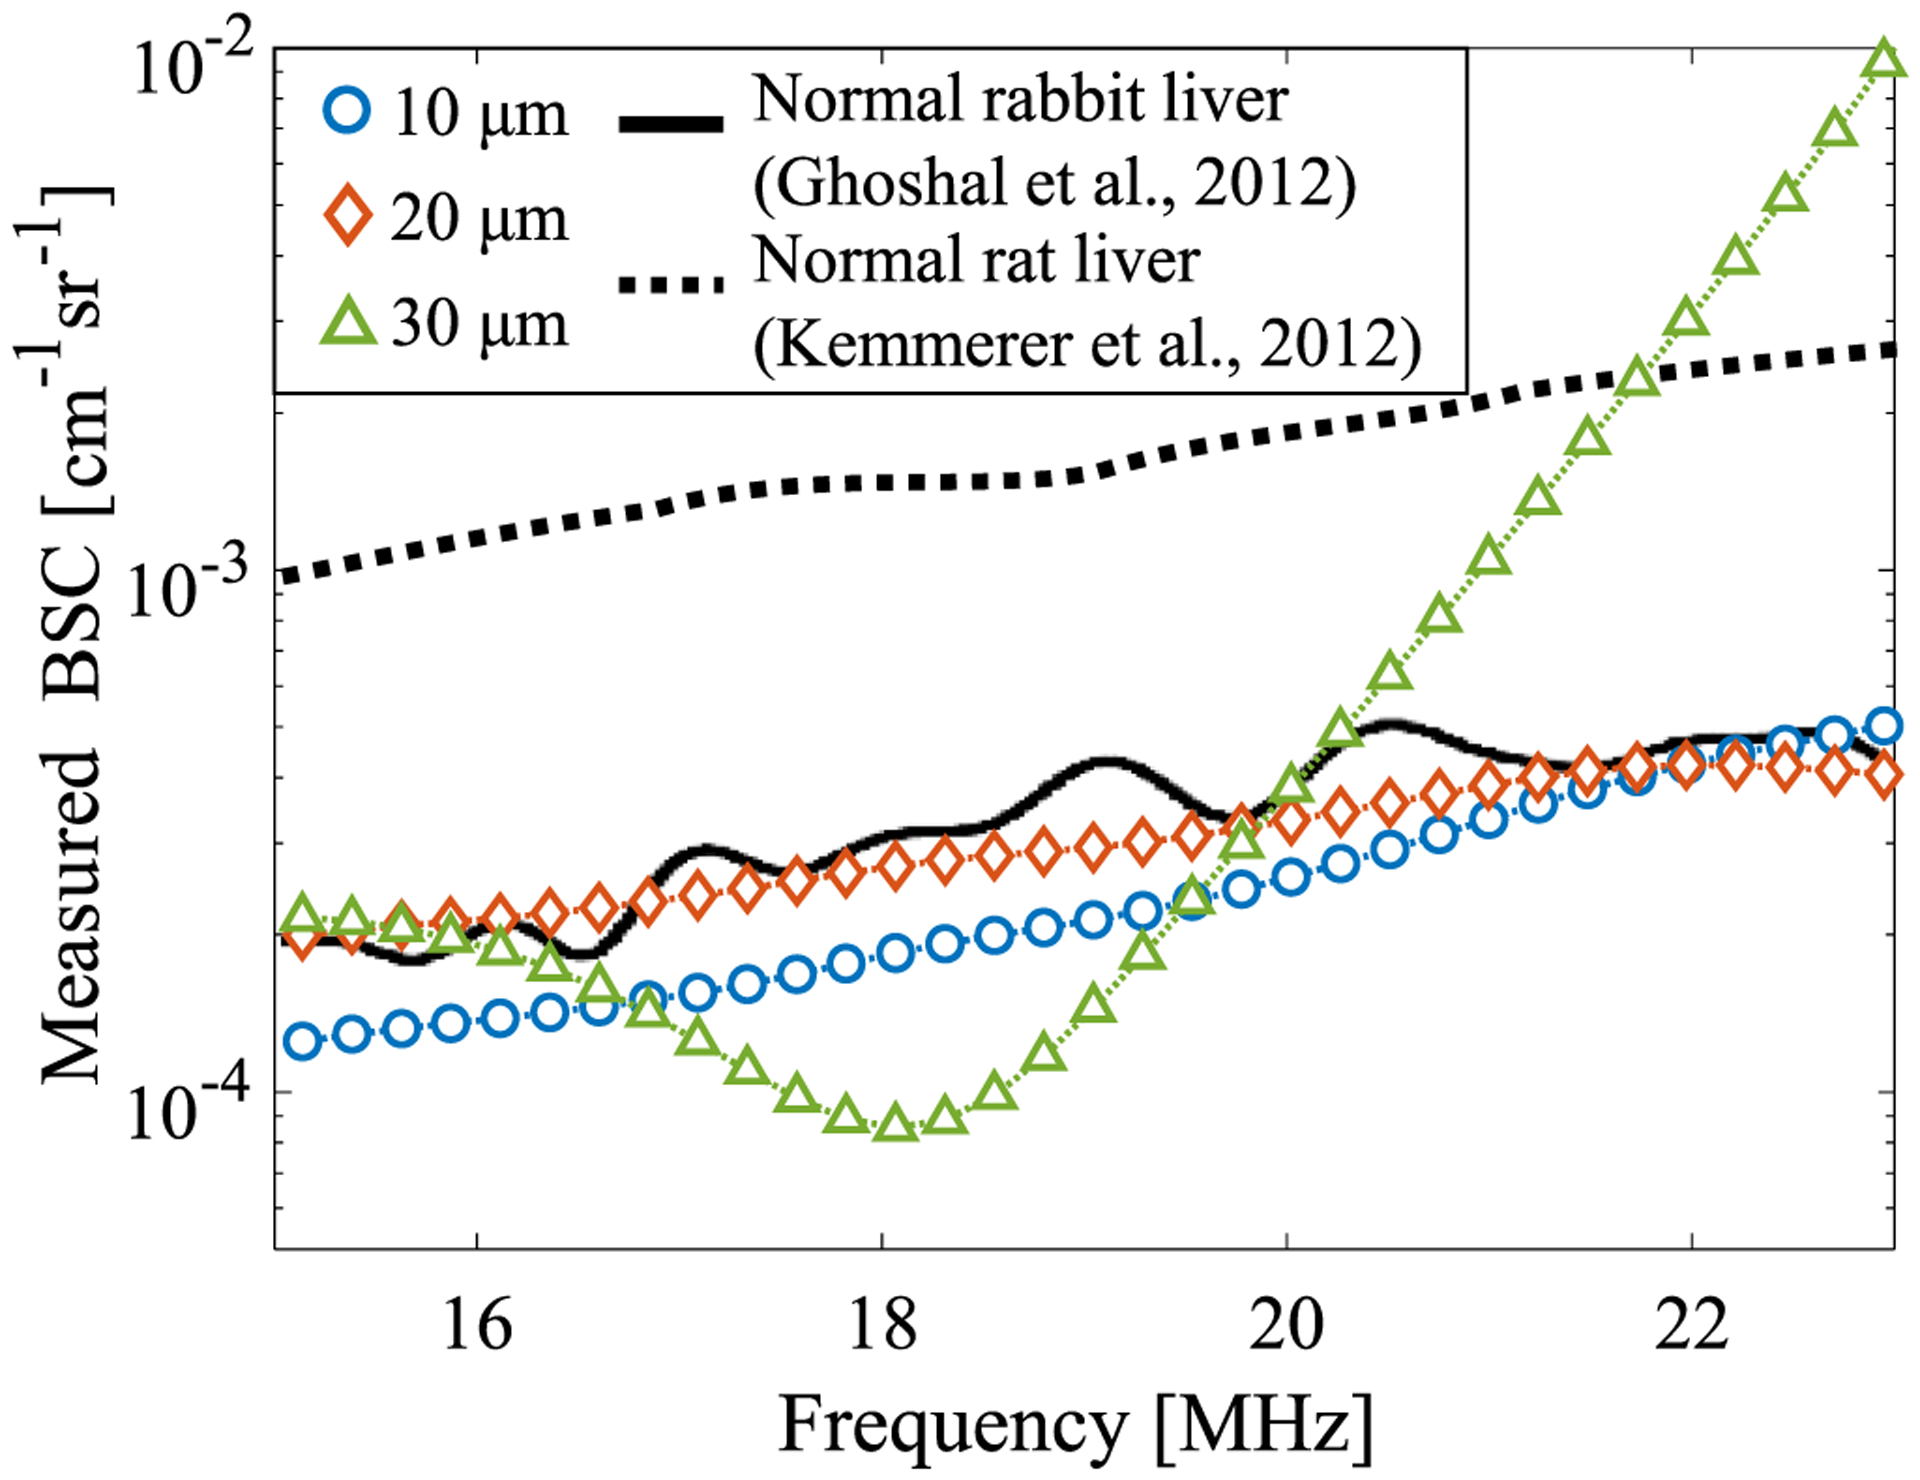
BSC of rat liver for various scatterer diameters in the reference medium (blood vessel wall was avoided). The black lines are the results from previous mammal studies.
Figures 8(a) and 8(b) show the mean and standard deviation values for the estimated QUS parameters μ and ESD, respectively, for the axial direction. The QUS methods were performed using regions without blood vessels to evaluate only the liver parenchyma, which is considered to have a homogeneous distribution of scatterers. For the logarithmic NA parameter, the SF case had better sensitivity than that of the FF case, and the mean value of the FF result reached the RA model condition because the rat liver was measured in a region shallower than the geometric focus. Even under the ex vivo condition, because the resolution was maintained over a wide DOF in the SF case, it is considered that the estimated parameter had no depth dependence, and thus the sensitivity was higher than that for the FF case. The value of the NA parameter for SF was close to a previously reported value.9) The ESD results were the same for the two focusing methods and showed no depth dependence. The ESD results also indicate that when a homogeneous scatterer distribution is assumed, even if it is not dense, the difference in beam characteristics is not reflected in the estimated parameter in the spectral-based analysis because of the applied compensation. The mean and standard deviation values of the parameter are almost within the range reported in previous studies on small animals.39,50) The trends in Figs. 8(a) and 8(b) are almost the same as those in the homogeneous phantom study and demonstrate that the backscatter characteristics can be analyzed with an annular array (SF) even when the biological tissue has a complex scattering source.
Fig. 8.
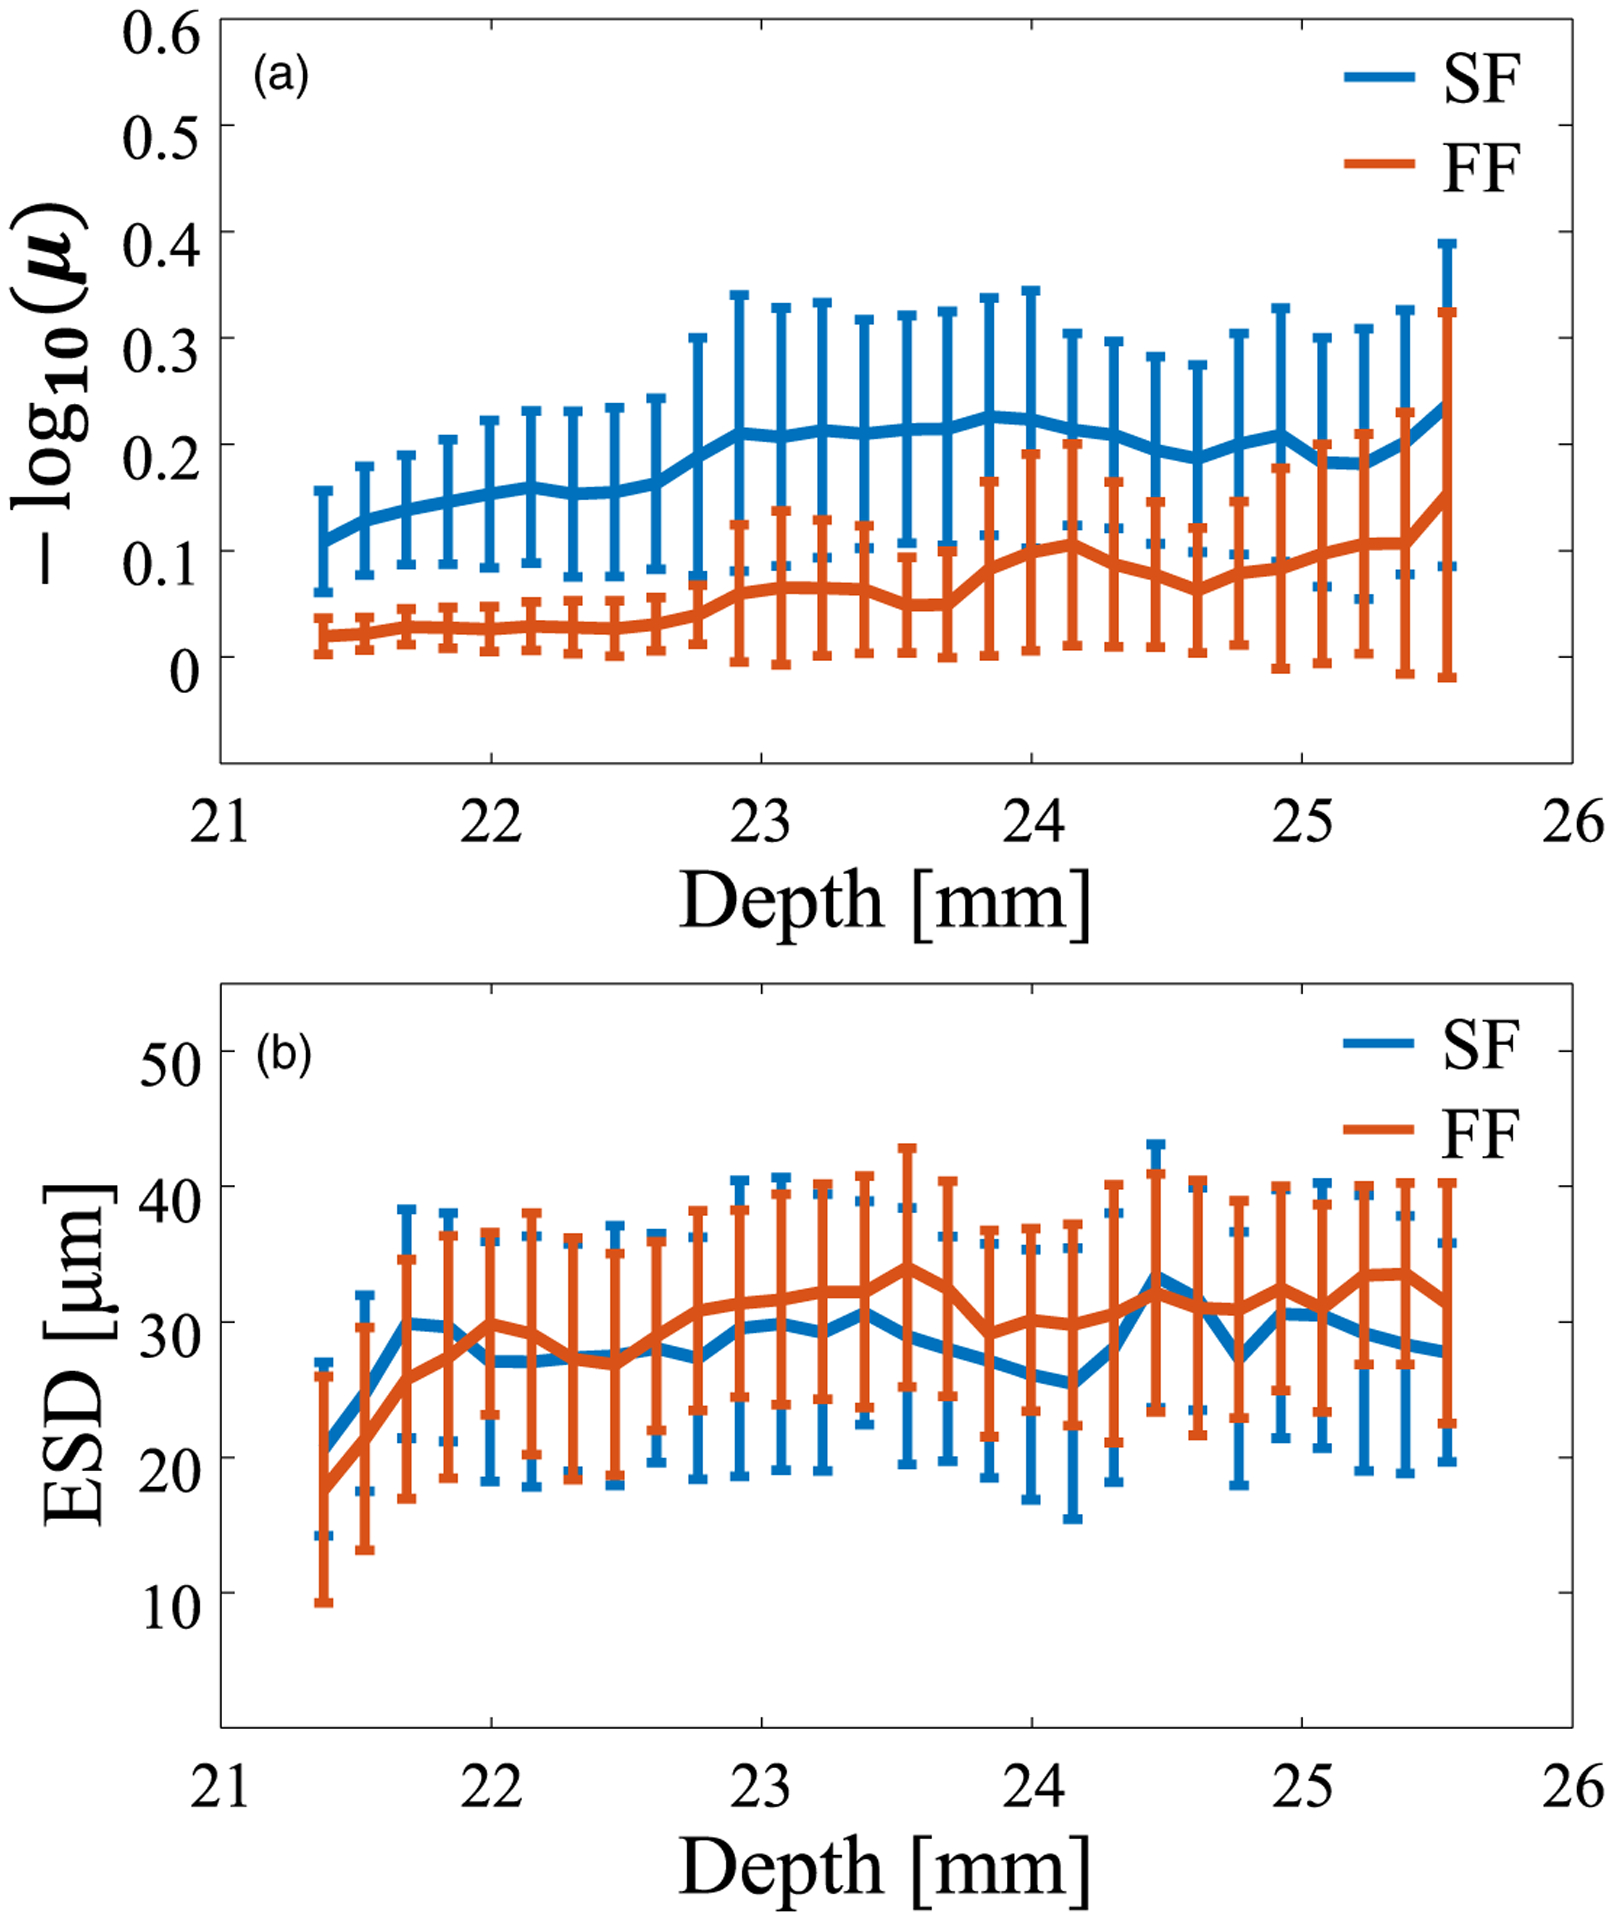
Fluctuation of QUS parameters versus depth for the two focusing methods. (a) NA parameter and (b) ESD.
If the main scatterer in the liver is hepatocytes with a diameter of 20 μm, it is expected that the scatterer density will be high (μ = 1) and that the ESD will be 20 μm in the SF evaluation. However, in Fig. 8, the scatterer density is sparse and the ESD is 30 μm, suggesting that multiple tissues of different sizes coexist in the liver at the micro level. A liver typically has micro blood vessel walls (or sinusoids), which have more massive structures than those of hepatocytes. The ROI can include information about the microstructure as well as that about hepatocytes. The reflections from the microstructure are reflected in all analysis windows, which may have led to a difference between the actual and estimated diameters. The accuracy of the evaluation of the relation between the estimated scatterer size and the biological tissue needs to be studied to clarify this matter. As a next step for estimating the scatterer diameter, in addition to the SGM, methods such as the structure factor model should be considered.25,26)
Based on the evaluation results in the homogeneous region, the amplitude envelope characteristics and frequency spectrum characteristics in the inhomogeneous region with the structure (blood vessel) were evaluated and output as a parametric image. Figure 9 shows the parametric images of the estimated QUS parameters. The NA parameter is shown in Figs. 9(a) and 9(d) and the ESD is shown in Figs. 9(b) and 9(c) for the SF and FF cases, respectively. For the NA parameter, the SF case has higher sensitivity than that for the FF case, which is consistent with Fig. 8(a). Regarding the parametric images of the ESD, the spatial distribution of the ESD looks blurry in the FF case, and the SF results are closer to the spatial distribution of the B-mode image. However, the average values for areas other than the blood vessel are the same for SF and FF [see Fig. 8(b)]. In the ultrasound images, SF successfully separates the blood vessels from surrounding tissue. FF shows the same value for the blood vessels as that for the surrounding tissue.
Fig. 9.
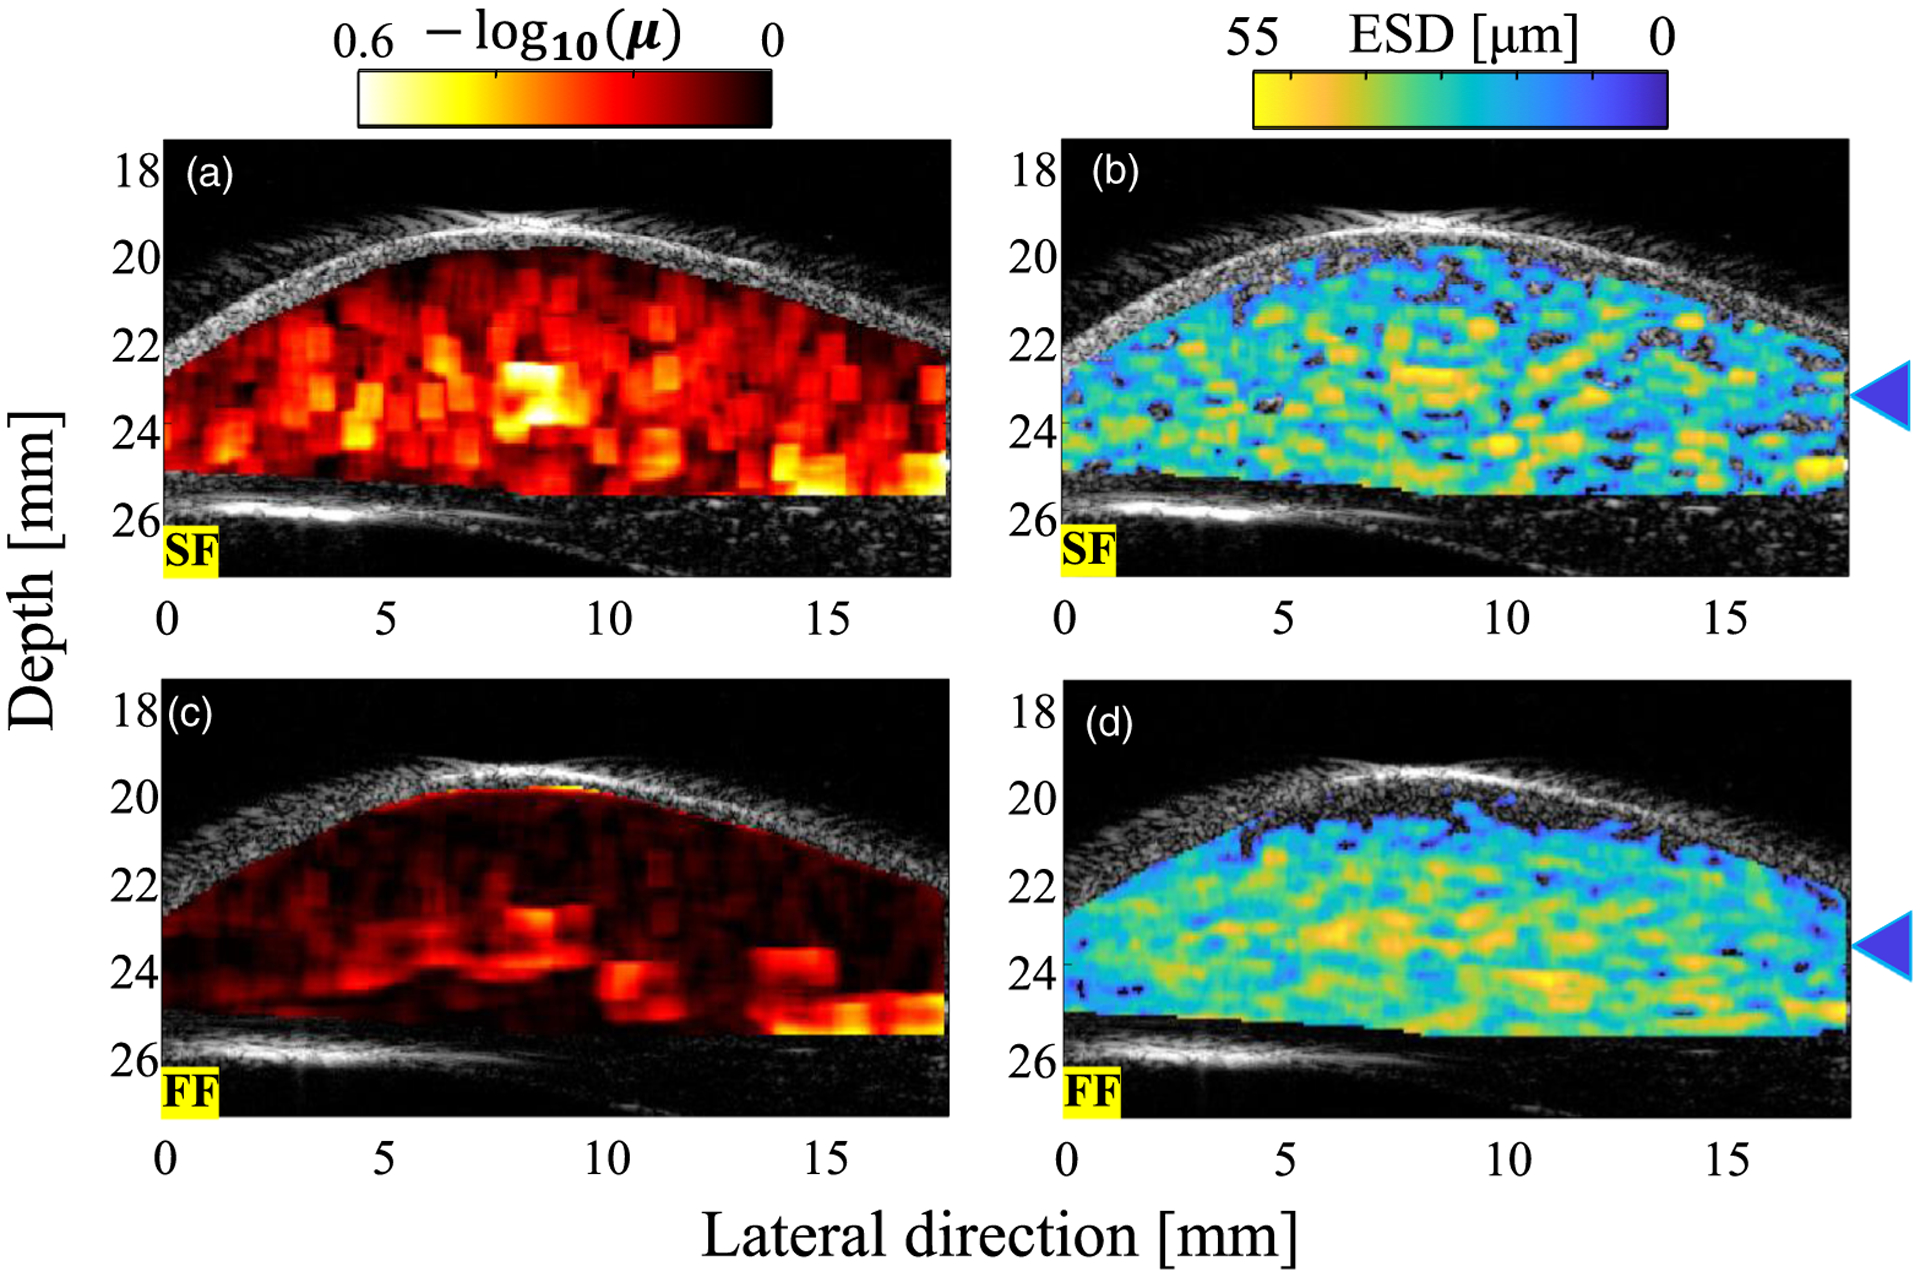
QUS parameters overlaid on the B-mode image of the rat liver for (a), (b) SF case and (c), (d) FF case. The blue triangles indicate the depth of the blood vessel.
To verify the resolution of QUS parameters for the blood vessel, the evaluation was performed focusing on the blood vessel wall. The blood vessel was at a depth of about 23.5 mm. Figures 10(a) and 10(b) show the results for the NA parameter and ESD, respectively. Figure 10 shows the distribution in the lateral direction at a depth of 23.5 mm. The annular array (SF) increased the sensitivity of the NA parameter and improved the dynamic range. This result is consistent with that for the phantom.
Fig. 10.
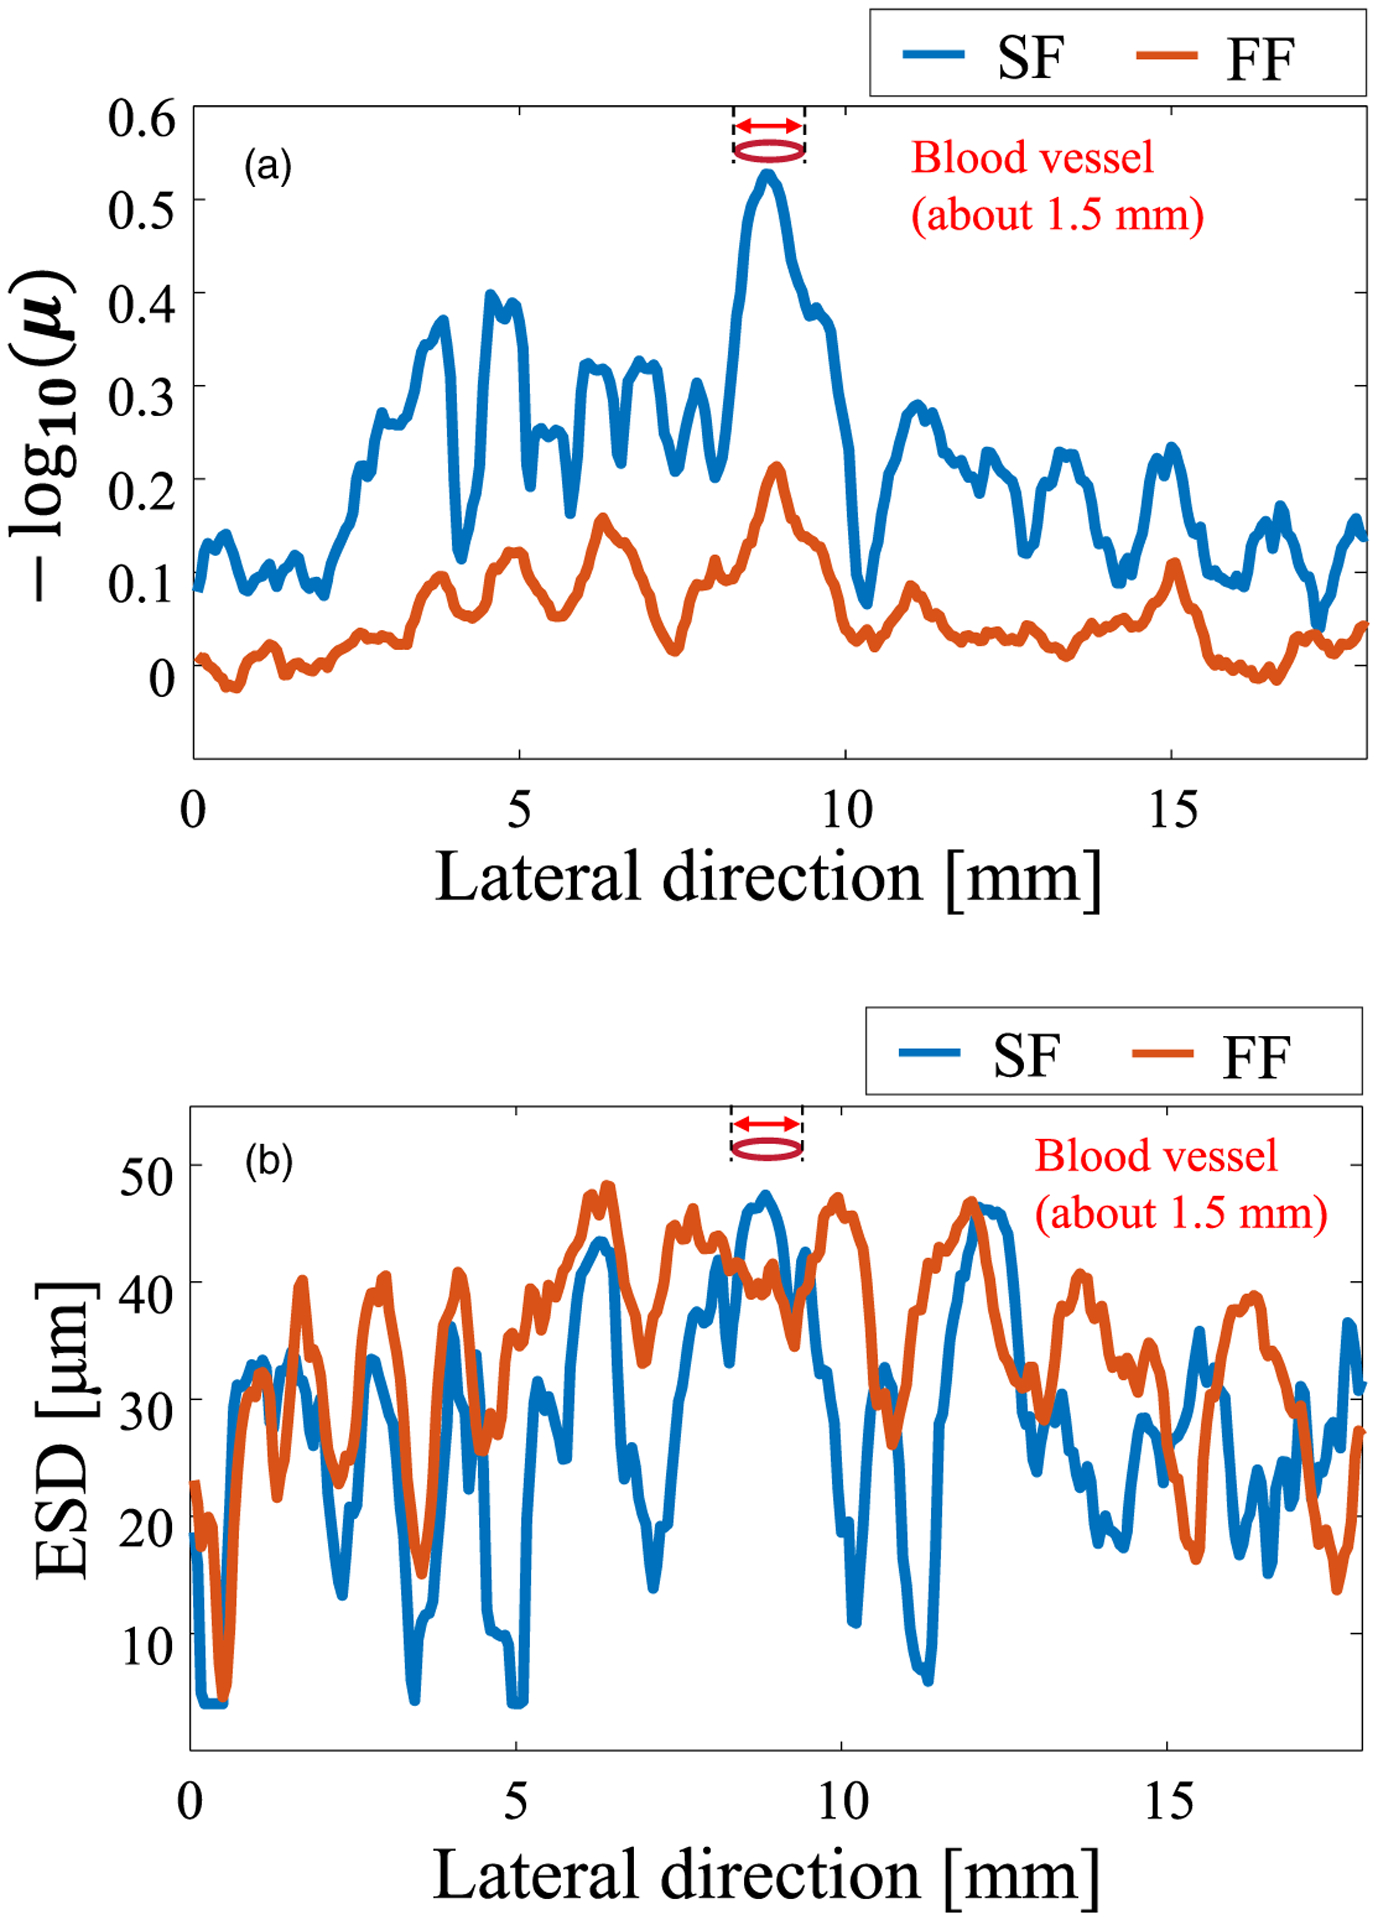
Fluctuation of the QUS parameters versus lateral direction for the two focusing methods at the blood vessel. (a) NA parameter and (b) ESD.
In Fig. 8(b), which shows the results for the homogeneous region, the difference in resolution was not reflected in the estimated ESD parameter. With heterogeneous structure conditions (scatterer density is higher than the surrounding tissue, the scatterer size is assumed to be large, or both), such as those where the ROI includes the blood vessel wall, the resolution of the ESD is improved because of the high resolution [Fig. 10(b)]. This difference is caused by the RF signal averaging the scattering within the beam diameter. Figure 11 shows the PSF at the depth of the blood vessel (23.5 mm) for the two beamforming cases. The SF case [Fig. 11(a)] has only the main lobe, whereas the FF case [Fig. 11(b)] also includes side lobes. A comparison of Fig. 10 around the blood vessel and Fig. 11 indicates that the PSF for each beamforming method is reflected in the texture of the estimated parameter. The blood vessel is not clearly shown in the ESD results due to the influence of the side lobe, and the region with a high ESD value extends in the lateral direction. If the scattering source is not homogeneous within the beam diameter, the estimated QUS parameter depends on the measurement resolution, as shown in Fig. 10(b). Figure 10 demonstrated that SF provides a high resolution QUS over a wide depth.
Fig. 11.

PSF at depth of 23.5 mm for (a) SF case and (b) FF case.
4. Conclusions
In QUS using HFU, the depth range that can ensure high-precision analysis is limited by the narrow DOF. To improve the accuracy and extend the region of QUS estimation, an annular array was applied to the HFU measurement. We employed the reference phantom method and verified the use of the HFU annular array on two QUS parameters using ex vivo liver measurements. In the validation experiments using an excised rat liver, the sensitivity and resolution of the estimated QUS parameter were improved in the defocus region of a single-element focused transducer with the same total aperture and geometric focus as those of the annular array. The present study demonstrated that the annular array is suitable for HFU measurement and QUS analysis for a large spatial region.
The accuracy of QUS may vary depending on the properties of tissues and ultrasound conditions (e.g. geometry and frequency). In order to achieve more accurate quantitative evaluation, various disease models (e.g. steatosis, hepatitis, and fibrosis) should be investigated in future studies to confirm the biological tissues that mainly affect the QUS parameter.
Acknowledgments
This work was supported in part by the JSPS Core-to-Core Program (A. Advanced Research Networks), KAKENHI Grant Nos. 15H03030, 17H05280, and 19H04482, the Institute for Global Prominent Research at Chiba University, the Marubun Research Promotion Foundation, and the National Institutes of Health (EB022950).
References
- 1).Shiina T et al. , Ultrasound Med. Biol 41, 1126 (2015). [DOI] [PubMed] [Google Scholar]
- 2).Kitazaki T, Kondo K, Yamakawa M, and Shiina T, Jpn. J. Appl. Phys 55, 07KF10 (2016). [Google Scholar]
- 3).Fujii S, Yamakawa M, Kondo K, Namita T, and Shiina T, Jpn. J. Appl. Phys 58, SGGE07 (2019). [Google Scholar]
- 4).Minagawa M, Hasegawa H, Yamaguchi T, and Yagi S, Jpn. J. Appl. Phys 57, 07LF07 (2018). [Google Scholar]
- 5).Mori S, Ohashi M, Hirata S, and Hachiya H, Jpn. J. Appl. Phys 55, 07KF09 (2016). [Google Scholar]
- 6).Mori S, Hirata S, Yamaguchi T, and Hachiya H, Jpn. J. Appl. Phys 57, 07LF17 (2018). [Google Scholar]
- 7).Omura M, Yoshida K, Kohta M, Kubo T, Ishiguro T, Kobayashi K, Hozumi N, and Yamaguchi T, Jpn. J. Appl. Phys 55, 07KF14 (2016). [Google Scholar]
- 8).Omura M, Yoshida K, Akita S, and Yamaguchi T, Jpn. J. Appl. Phys 57, 07LF15 (2018). [Google Scholar]
- 9).Tamura K, Yoshida K, Maruyama H, Hachiya H, and Yamaguchi T, Jpn. J. Appl. Phys 57, 07LD19 (2018). [Google Scholar]
- 10).Muleki-Seya P, Guillermin R, Guglielmi J, Chen J, Pourcher T, Konofagou E, and Franceschini E, IEEE Trans. Ultrason. Ferroelectr. Freq. Control 63, 1335 (2016). [DOI] [PubMed] [Google Scholar]
- 11).Mamou J, Coron A, Hata M, Machi J, Yanagihara E, Laugier P, and Feleppa EJ, Ultrasound Med. Biol 36, 361 (2010). [DOI] [PMC free article] [PubMed] [Google Scholar]
- 12).Kurokawa Y, Taki H, Yashiro S, Nagasawa K, Ishigaki Y, and Kanai H, Jpn. J. Appl. Phys 55, 07KF12 (2016). [Google Scholar]
- 13).Tsui PH, Liao YY, Chang CC, Kuo WH, Chang KJ, and Yeh CK, IEEE Trans. Med. Imaging 29, 513 (2010). [DOI] [PubMed] [Google Scholar]
- 14).Saegusa-Beecroft E, Machi J, Mamou J, Hata M, Coron A, Yanagihara ET, Yamaguchi T, Oelze ML, Laugier P, and Feleppa EJ, J. Surg. Res 183, 258 (2013). [DOI] [PMC free article] [PubMed] [Google Scholar]
- 15).Nasief HG, Rosado-Mendez IM, Zagzebski JA, and Hall TJ, Ultrasound Med. Biol 45, 1603 (2019). [DOI] [PMC free article] [PubMed] [Google Scholar]
- 16).Yamaguchi T and Hachiya H, J. Med. Ultrason 37, 155 (2010). [DOI] [PubMed] [Google Scholar]
- 17).Tsui PH, Zhou Z, Lin YH, Hung CM, Chung SJ, and Wan YL, PLoS One 12, e0181789 (2017). [DOI] [PMC free article] [PubMed] [Google Scholar]
- 18).Shankar PM, IEEE Trans. Ultrason. Ferroelectr. Freq. Control 47, 727 (2000). [DOI] [PubMed] [Google Scholar]
- 19).Insana MF, Wagner RF, Brown DG, and Hall TJ, J. Acoust. Soc. Am 87, 179 (1990). [DOI] [PMC free article] [PubMed] [Google Scholar]
- 20).Insana MF, Hall TJ, and Cook LT, IEEE Trans. Ultrason. Ferroelectr. Freq. Control 41, 714 (1994). [DOI] [PubMed] [Google Scholar]
- 21).Oelze ML and Mamou J, IEEE Trans. Ultrason. Ferroelectr. Freq. Control 63, 336 (2016). [DOI] [PMC free article] [PubMed] [Google Scholar]
- 22).Bamber J et al. , Ultraschall Med. 34, 169 (2013). [DOI] [PubMed] [Google Scholar]
- 23).Nitta N, Ishiguro Y, Sasanuma H, Taniguchi N, and Akiyama I, J. Med. Ultrason 42, 39 (2014). [DOI] [PubMed] [Google Scholar]
- 24).Ishiguro Y, Sasanuma H, Nitta N, Taniguchi N, Ogata Y, Yasuda Y, and Akiyama I, J. Med. Ultrason 42, 47 (2014). [DOI] [PubMed] [Google Scholar]
- 25).Franceschini E, Guillermin R, Tourniaire F, Roffino S, Lamy E, and Landrier J-F, J. Acoust. Soc. Am 135, 3620 (2014). [DOI] [PubMed] [Google Scholar]
- 26).Franceschini E, De Monchy R, and Mamou J, IEEE Trans. Ultrason. Ferroelectr. Freq. Control 63, 1321 (2016). [DOI] [PubMed] [Google Scholar]
- 27).Ketterling JA, Aristizábal O, Turnbull DH, and Lizzi FL, IEEE Trans. Ultrason. Ferroelectr. Freq. Control 52, 672 (2005). [DOI] [PMC free article] [PubMed] [Google Scholar]
- 28).Silverman RH, Ketterling JA, Mamou J, Lloyd HO, Filoux E, and Coleman DJ, Ophthalmic Surgery, Lasers Imaging 43, 82 (2012). [DOI] [PMC free article] [PubMed] [Google Scholar]
- 29).Silverman RH, Clin. Ophthalmol 10, 1865 (2016). [DOI] [PMC free article] [PubMed] [Google Scholar]
- 30).Aristizábal O, Mamou J, Ketterling JA, and Turnbull DH, Ultrasound Med. Biol 39, 2321 (2013). [DOI] [PMC free article] [PubMed] [Google Scholar]
- 31).Mamou J, Aristizábal O, Silverman RH, Ketterling JA, and Turnbull DH, Ultrasound Med. Biol 35, 1198 (2009). [DOI] [PMC free article] [PubMed] [Google Scholar]
- 32).Filoux E, Sampathkumar A, Chitnis PV, Aristizábal O, and Ketterling JA, Rev. Sci. Instrum 84, 053705 (2013). [DOI] [PMC free article] [PubMed] [Google Scholar]
- 33).Chitnis PV, Aristizábal O, Filoux E, Sampathkumar A, Mamou J, and Ketterling JA, Ultrason. Imaging 38, 32 (2016). [DOI] [PMC free article] [PubMed] [Google Scholar]
- 34).Mizoguchi T, Tamura K, Mamou J, Ketterling JA, Yoshida K, and Yamaguchi T, IEEE Int. Ultrason. Symp. Proc, 2018. [Google Scholar]
- 35).Mizoguchi T, Tamura K, Mamou J, Ketterling JA, Yoshida K, and Yamaguchi T, Jpn. J. Appl. Phys 58, SGGE08 (2019). [DOI] [PMC free article] [PubMed] [Google Scholar]
- 36).Oelze ML, Zachary JF, and O’Brien WD, J. Acoust. Soc. Am 112, 1202 (2002). [DOI] [PubMed] [Google Scholar]
- 37).Nakagami M, Stat. Methods Wave Propag (Pergamon, New York, 1960), p. 3. [Google Scholar]
- 38).Yao LX, Zagzebski JA, and Madsen EL, Ultrason. Imaging 12, 58 (1990). [DOI] [PubMed] [Google Scholar]
- 39).Ghoshal G, Lavarello RJ, Kemmerer JP, Miller RJ, and Oelze ML, Ultrasound Med. Biol 38, 2238 (2012). [DOI] [PMC free article] [PubMed] [Google Scholar]
- 40).Ketterling JA, Ramachandran S, and Aristizábal O, IEEE Trans. Ultrason. Ferroelectr. Freq. Control 53, 623 (2006). [DOI] [PMC free article] [PubMed] [Google Scholar]
- 41).Arditi M, Foster FS, and Hunt JW, Ultrason. Imaging 3, 37 (1981). [DOI] [PubMed] [Google Scholar]
- 42).Narayanan VM, Shankar PM, and Reid JM, IEEE Trans. Ultrason. Ferroelectr. Freq. Control 41, 845 (1994). [DOI] [PubMed] [Google Scholar]
- 43).Lin JJ, Cheng J, Huang L, Lin YH, Wan Y, and Tsui PH, Ultrasonics 77, 133 (2017). [DOI] [PubMed] [Google Scholar]
- 44).Faran JJ, J. Acoust. Soc. Am 23, 405 (1951). [Google Scholar]
- 45).Oelze ML and O’Brien WD, J. Acoust. Soc. Am 111, 2308 (2002). [DOI] [PubMed] [Google Scholar]
- 46).Franceschini E, Escoffre JM, Novell A, Auboire L, Mendes V, Benane YM, Bouakaz A, and Basset O, Ultrasound Med. Biol 45, 1777 (2019). [DOI] [PubMed] [Google Scholar]
- 47).Omura M, Hasegawa H, Nagaoka R, Yoshida K, and Yamaguchi T, J. Med. Ultrason 1, 3 (2019). [DOI] [PubMed] [Google Scholar]
- 48).Kuc R and Schwartz M, IEEE Trans. Sonics Ultrason 26, 353 (1979). [Google Scholar]
- 49).Mizoguchi T, Yoshida K, Mamou J, Ketterling JA, and Yamaguchi T, Proc. Symp. Ultrason. Electron, 2019. [Google Scholar]
- 50).Kemmerer JP and Oelze ML, Ultrasound Med. Biol 38, 2130 (2012). [DOI] [PMC free article] [PubMed] [Google Scholar]


