

Abstract
Numerous brain regions have been identified as contributing to withdrawal behaviors, but it is unclear the way in which these brain regions as a whole lead to withdrawal. The search for a final common brain pathway that is involved in withdrawal remains elusive. To address this question, we implanted osmotic minipumps containing either saline, nicotine (24 mg/kg/d), cocaine (60 mg/kg/d), or methamphetamine (4 mg/kg/d) for one week in male C57BL/6J mice. After one week, the minipumps were removed and brains collected 8 h (saline, nicotine, and cocaine) or 12 h (methamphetamine) after removal. We then performed single-cell whole-brain imaging of neural activity during the withdrawal period when brains were collected. We used hierarchical clustering and graph theory to identify similarities and differences in brain functional architecture. Although methamphetamine and cocaine shared some network similarities, the main common neuroadaptation between these psychostimulant drugs was a dramatic decrease in modularity, with a shift from a cortical-driven to subcortical-driven network, including a decrease in total hub brain regions. These results demonstrate that psychostimulant withdrawal produces the drug-dependent remodeling of functional architecture of the brain and suggest that the decreased modularity of brain functional networks and not a specific set of brain regions may represent the final common pathway associated with withdrawal.
Keywords: addiction, functional connectivity, graph theory, iDISCO, neural activity, withdrawal
Significance Statement
A key aspect of treating drug abuse is understanding similarities and differences of how drugs of abuse affect the brain. In the present study, we examined how the brain is altered during withdrawal from psychostimulants. We found that each drug produced a unique pattern of activity in the brain, but that brains in withdrawal from cocaine and methamphetamine shared similar features. Interestingly, we found the major common link between withdrawal from all psychostimulants, when compared with controls, was a shift in the broad organization of the brain in the form of reduced modularity. Reduced modularity has been shown in several brain disorders, including traumatic brain injury, and dementia, and may be the common link between drugs of abuse.
Introduction
Psychostimulants are a class of highly addictive and commonly abused drugs that includes cocaine, nicotine, and methamphetamine (Balfour, 2008; Phillips et al., 2014). A large number of brain regions have been implicated in withdrawal associated with psychostimulant use (Kalivas and McFarland, 2003; Robinson and Kolb, 2004; Kalivas, 2007; Everitt et al., 2008; Jedynak et al., 2012; Koob and Volkow, 2016; Bobadilla et al., 2017). However, the complete neural network that is associated with psychostimulant withdrawal remains understudied, and the search for a common brain pathway that is responsible for psychostimulant withdrawal remains elusive. Common features of withdrawal may not be found at the brain region level but rather at the network level.
The identification of changes in neural network structure that are caused by psychostimulant withdrawal may be critical to understanding the ways in which these drugs affect the brain. Previous studies identified changes in network function after psychostimulant use (Tomasi et al., 2010; Konova et al., 2013, 2015; Ma et al., 2015), but these analyses focused on macroscale changes and not the mesoscale level, or they focused on preselected regions of interest.
The present study sought to identify the ways in which withdrawal from different commonly abused psychostimulants alters functional architecture of the brain. We hypothesized that withdrawal from psychostimulants would result in changes in functional neural networks and decrease modular structuring of the brain. We further hypothesized that each psychostimulant that was examined herein (i.e., methamphetamine, nicotine, and cocaine) would have a unique neural network that is associated with withdrawal. We measured single-cell whole-brain activity using Fos as a marker for neuronal activation in mice that underwent withdrawal from chronic psychostimulant (cocaine, methamphetamine, and nicotine) administration. To accomplish this, mice were implanted with osmotic minipumps for one week to induce dependence to each drug. Following one-week minipumps were removed and brains were collected from mice during acute withdrawal. This method of acute withdrawal was chosen to control the amount of drug each animal received and create strong dependence in a short period of time. The psychostimulant doses were chosen based on previous studies that reported rewarding effects during use and observed withdrawal-like symptoms after the cessation of chronic exposure for each drug (Johnson et al., 2008; Fish et al., 2010; Eisener-Dorman et al., 2011; Stoker and Markou, 2011; Stoker et al., 2012; Tracy et al., 2016; Zhu et al., 2017). We then used single-cell whole-brain activity to identify coactivation patterns of brain regions in the network that was associated with each treatment using hierarchical clustering. The functional connectivity measures were used to determine the modular structuring of each network. Graph theory was then used to further characterize each network to determine the brain regions that are most heavily involved in intramodular and intermodular connectivity of the functional network.
Materials and Methods
Animals
Male C57BL/6J mice were bred at The Scripps Research Institute. They were 20–30 g and 60 d old at the start of the experiment. The mice were maintained on a 12/12 h light/dark cycle with ad libitum access to food and water. All of the procedures were conducted in strict adherence to the National Institutes of Health Guide for the Care and Use of Laboratory Animals and approved by The Scripps Research Institute Institutional Animal Care and Use Committee and by the Institutional Animal Care and Use Committee of the University of California.
Drugs
The doses were 4 mg/kg/d for methamphetamine, 24 mg/kg/d for nicotine, and 60 mg/kg/d for cocaine. These doses were chosen based on previous studies that indicated rewarding effects during use, resulting in withdrawal-like symptoms after the cessation of chronic use (Johnson et al., 2008; Fish et al., 2010; Eisener-Dorman et al., 2011; Stoker and Markou, 2011; Stoker et al., 2012; Tracy et al., 2016; Zhu et al., 2017). Each drug was dissolved in saline, and the pH was adjusted to 7.4. The drugs were loaded into osmotic minipumps (Alzet; model 1002). The minipumps sat overnight in saline before insertion to ensure that drug delivery would begin immediately.
Minipump implantation and removal
The mice were split into four groups for the experiment: methamphetamine withdrawal group (n = 5), nicotine withdrawal group (n = 5), cocaine withdrawal group (n = 5), and saline control group (n = 4). Each mouse was surgically implanted with an osmotic minipump for methamphetamine, nicotine, cocaine, and saline based on group assignment. The minipumps were implanted in the lower back of each mouse under anesthesia. After brief recovery, the mice were returned to their home cages. The mice remained in their home cages for one week to allow for chronic infusion of the drug.
After one week, the minipumps were surgically removed under anesthesia to allow for drug washout and withdrawal to begin. Mice in the nicotine, cocaine, and saline groups were perfused 8 h after removal of the minipumps. Mice in the methamphetamine group were perfused 12 h after removal of the minipumps. These time points were chosen to represent an acute withdrawal period from each drug (e.g., a minimum of 4 h without the drug present) and based on the half-life of each drug in mice (Benuck et al., 1987; Cho et al., 2001; Norman et al., 2007; Siu and Tyndale, 2007; Shabani et al., 2012).
Tissue collection
The mice were deeply anesthetized and perfused with 15 ml of PBS followed by 50 ml of 4% formaldehyde. The brains were postfixed in formaldehyde overnight. The next day, the brains were washed for 30 min three times with PBS and transferred to a PBS/0.1% azide solution at 4°C for 2–3 d before processing via iDISCO+.
iDISCO+
The iDISCO+ procedure was performed as reported previously (Renier et al., 2014, 2016). The associated immunostaining, sample clearing, and image collection for iDISCO+ are detailed below. For an experimental design overview see Figure 1.
Figure 1.
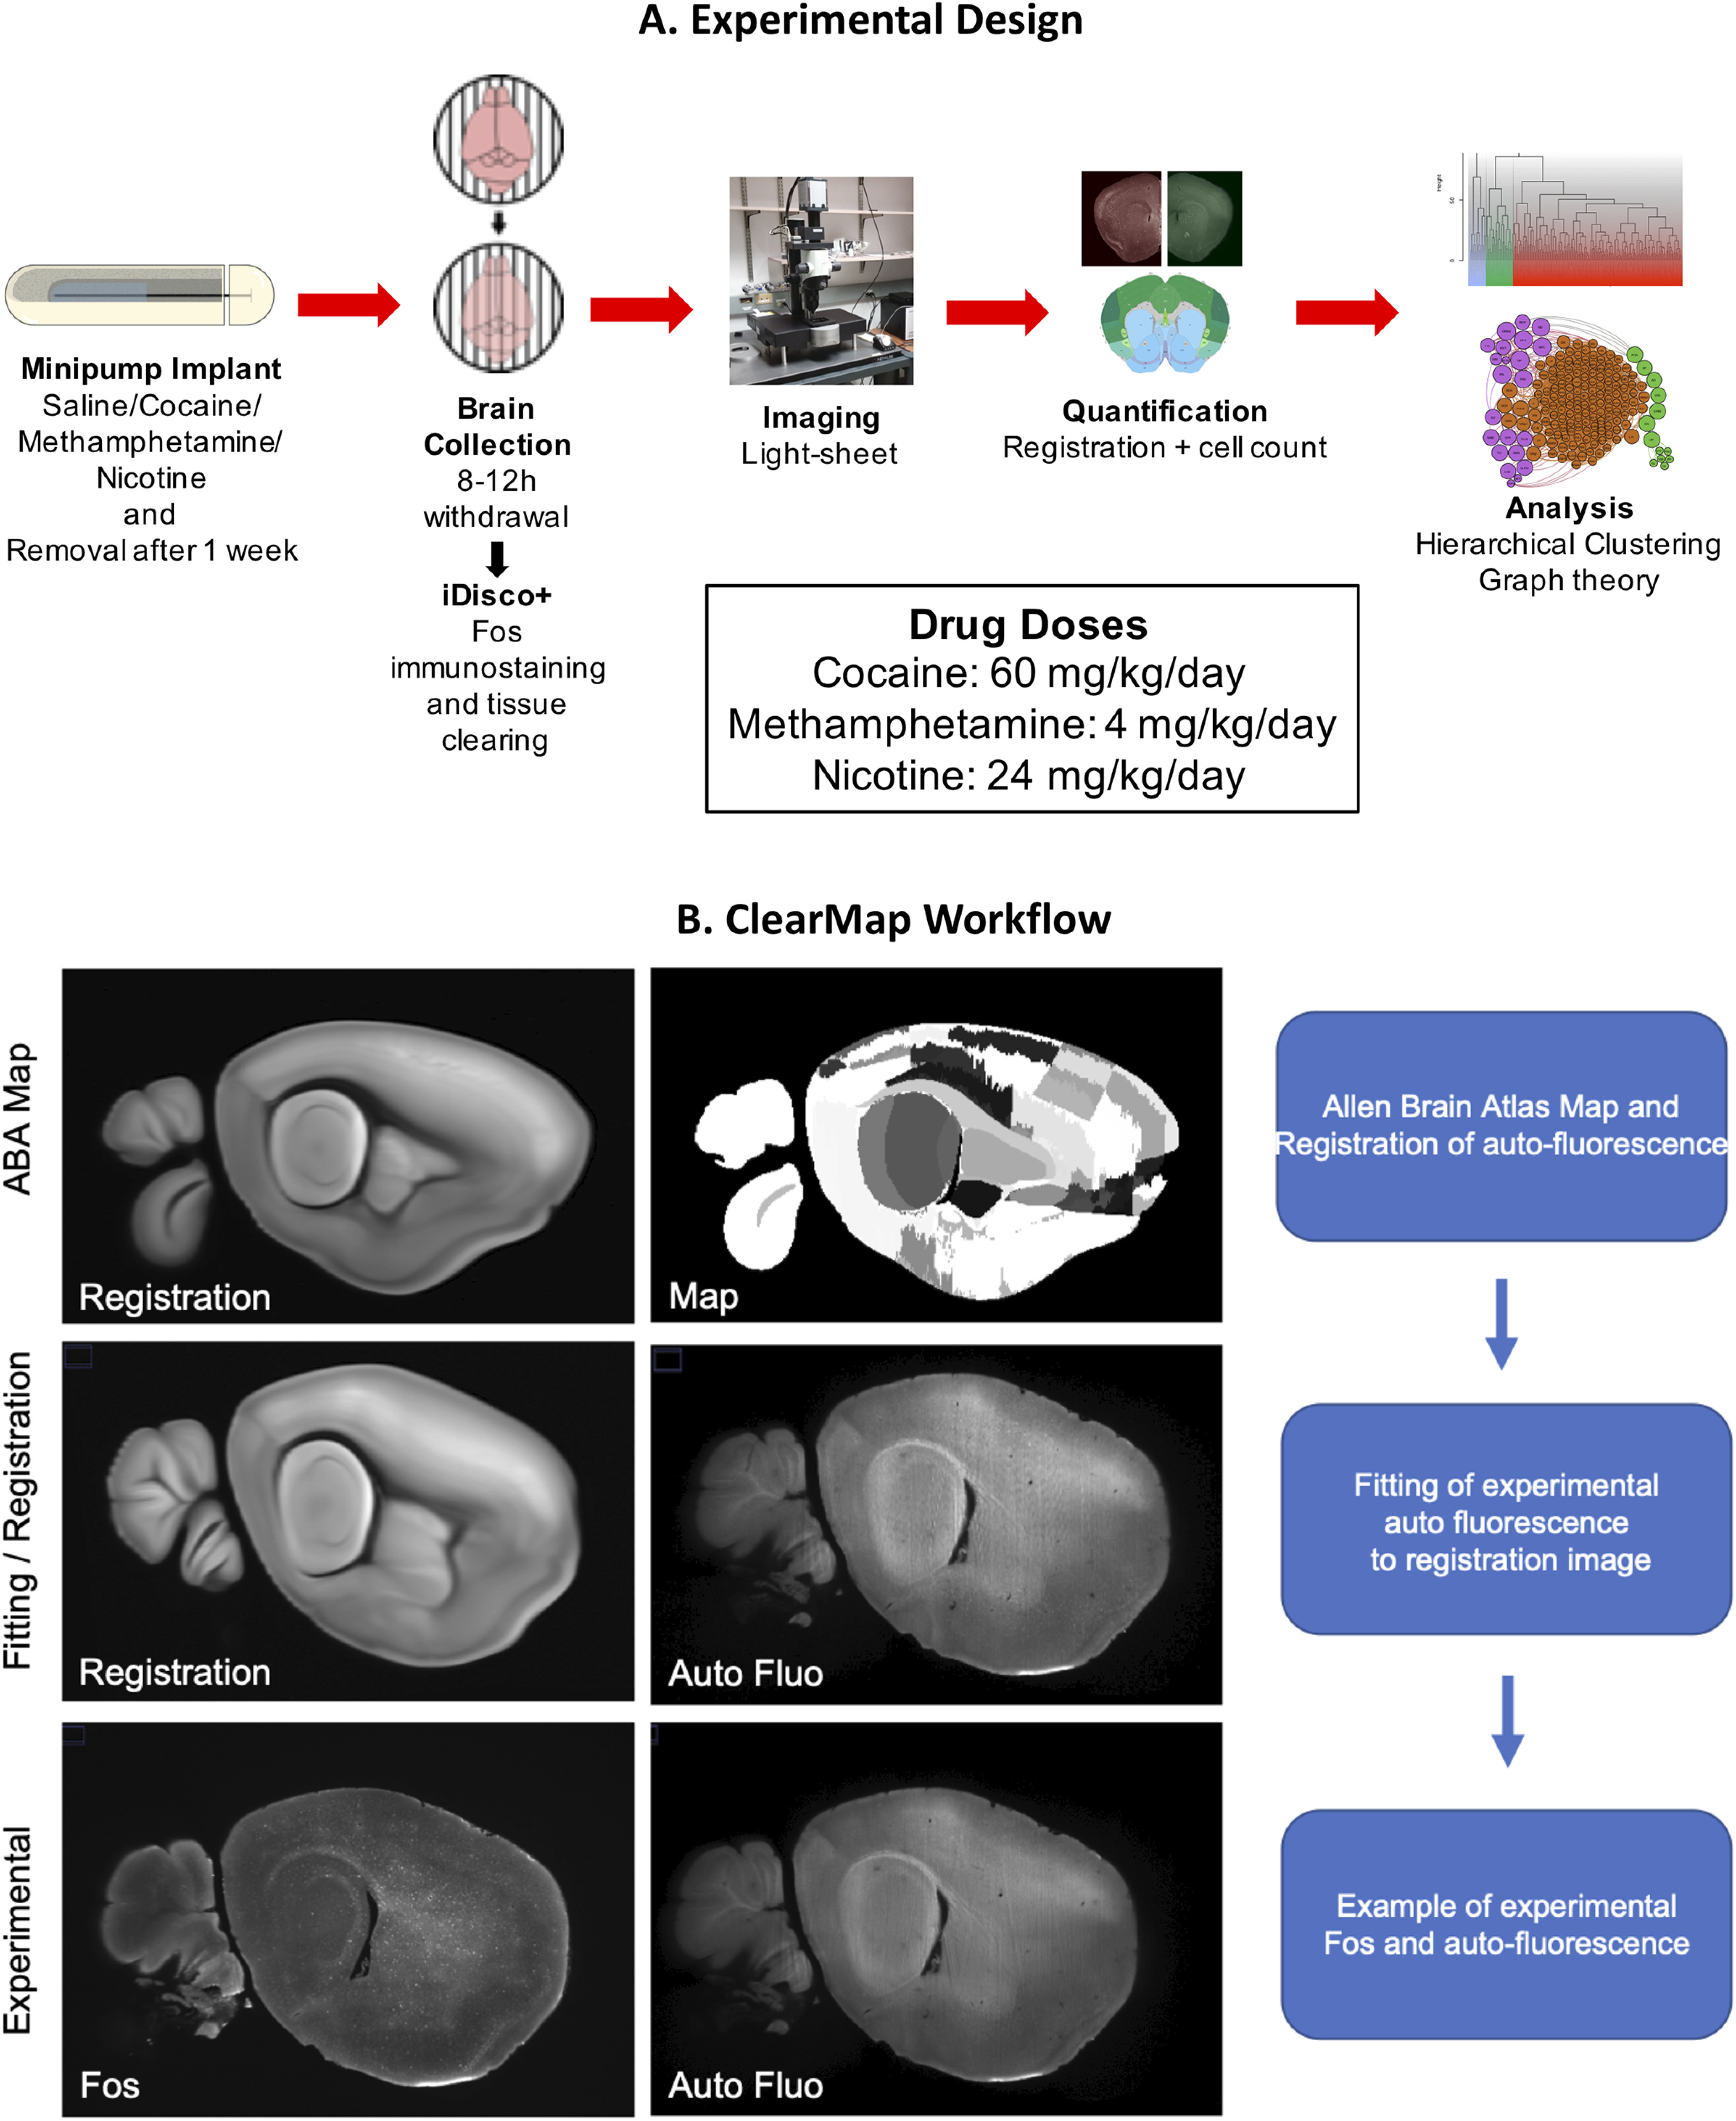
A, Experimental design. Mice were surgically implanted with an osmotic minipump that contained either saline or a psychostimulant (60 mg/kg/d cocaine, 4 mg/kg/d methamphetamine, or 24 mg/kg/d nicotine). They were then returned to their home cage for one week. After one week, the minipumps were surgically removed, and the mice were returned to their home cage until brain tissue was collected 8 h later (saline, cocaine, nicotine) or 12 h later (methamphetamine). Brains were then processed for whole-brain Fos immunohistochemistry and clearing via iDISCO+ and then imaged on a light-sheet microscope. Fos values were detected and registered to the Allen Brain Atlas using ClearMap Renier et al., 2016. Pearson correlations were then calculated to determine functional coactivation among brain regions. Brain regions were then grouped into modules based on their coactivation patterns through hierarchical clustering. Graph theory analyses was then performed to identify brain regions that are heavily involved in intramodular and intermodular connectivity. B, Workflow diagram of registration to the Allen Brain Atlas using ClearMap. Registration is performed by matching a the autofluorescence to a preregistered two-photon image set that has been matched to brain region delineations of the Allen Brain Atlas. The brain region demarcations mapped to the autofluorescence are then used to map onto the Fos values taken from the corresponding frame. Auto Fluo = Autofluorescence.
Immunostaining
Fixed samples were washed in 20% methanol (in double-distilled H2O) for 1 h, 40% methanol for 1 h, 60% methanol for 1 h, 80% methanol for 1 h, and 100% methanol for 1 h twice. The samples were then precleared with overnight incubation in 33% methanol and 66% dichloromethane (DCM; Sigma, catalog #270997-12X100ML). The next day, the samples were bleached with 5% H2O2 (1 volume of 30% H2O2 for 5 volumes of methanol, ice cold) at 4°C overnight. After bleaching, the samples were slowly re-equilibrated at room temperature and rehydrated in 80% methanol in double-distilled H2O for 1 h, 60% methanol for 1 h, 40% methanol for 1 h, 20% methanol for 1 h, PBS for 1 h, and PBS and 0.2% Triton X-100 for 1 h twice. The samples were then incubated in PBS, 0.2% Triton X-100, 20% dimethylsulfoxide (DMSO), 0.3 m glycine at 37°C for 2 d and then blocked in PBS, 0.2% Triton X-100, 10% DMSO, and 6% donkey serum at 37°C for 2 d. The samples were then incubated in rabbit anti c-fos (1:2000; Synaptic Systems catalog #226003) in PBS-0.2% Tween with 10 μg, ml heparin (PTwH), and 5% DMSO/3% donkey serum at 37°C for 7 d. The samples were then washed in PTwH for 24 h (five changes of the PTwH solution over that time) and incubated in donkey anti-rabbit Alexa Fluor 647 (1:500; Invitrogen, catalog #A31573) in PTwH/3% donkey serum at 37°C for 7 d. The samples were finally washed in PTwH for 1 d before clearing and imaging.
Sample clearing
Immunolabeled brains were cleared using the procedure of Renier et al. (2016). The samples were dehydrated in 20% methanol in double-distilled H2O for 1 h, 40% methanol for 1 h, 60% methanol for 1 h, 80% methanol for 1 h, 100% methanol for 1 h, and 100% methanol again overnight. The next day, the samples were incubated for 3 h in 33% methanol/66% DCM until they sank to the bottom of the incubation tube. The methanol was then washed for 20 min twice in 100% DCM. Finally, the samples were incubated in dibenzyl ether (DBE; Sigma, catalog #108014-1KG) until clear and then stored in DBE at room temperature until imaged.
Image acquisition
Left hemispheres of cleared samples were imaged in the sagittal orientation (right lateral side up). A single hemisphere was imaged as done in previous studies to avoid the need to stitch images or analyze separate image stacks for the same sample (Renier et al., 2014, 2016). Future studies examining both hemispheres would provide interesting additional results. Samples were imaged on a light-sheet microscope (Ultramicroscope II, LaVision Biotec) equipped with an sCMOS camera (Andor Neo) and 2×/0.5 objective lens (MVPLAPO 2×) equipped with a 6-mm working distance dipping cap. Imspector Microscope controller v144 software was used. The microscope was equipped with an NKT Photonics SuperK EXTREME EXW-12 white light laser with three fixed light sheet generating lenses on each side. Scans were made at 0.8× magnification (1.6× effective magnification) with a light sheet numerical aperture of 0.148. Excitation filters of 480/30, 560/40, and 630/30 nm were used. Emission filters of 525/50, 595/40, and 680/30 nm were used. The samples were scanned with a step size of 3 μm using dynamic horizontal scanning from one side (the right) for the 560- and 630-nm channels (20 acquisitions per plane with 240-ms exposure, combined into one image using the horizontal adaptive algorithm) and without horizontal scanning for the 480-nm channel using two-sided illumination (100-ms exposure for each side, combined into one image using the blending algorithm). To accelerate acquisition, both channels where acquired in two separate scans. The imaging resolution (x = 4 μm, y = 4 μm, z = 3 μm) was selected to minimize imaging time without loss in terms of sensitivity or selectivity of the cell detection process or brain segmentation. The approach of clearing, alignment, cell detection, and registration has been validated in great detail in the original Renier et al. (2016) paper and shows that cell count obtained using ClearMap is 99% similar to manual detection by a trained user (Renier et al., 2016) when using a conservative cell voxel size threshold of 20 pixel (as in our study). The cell segmentation parameters and intensity threshold used to identify Fos-positive cells in this study are the default settings included in the ClearMap package (Renier et al., 2016) without further validation, but visual confirmation was made manually on every brain to verify appropriate alignment to the reference atlas and to verify that thresholding and pixel detection were set to maximize the number of cells detected while ensuring that cells were not double counted. To account for micro-movements of the samples that may occur between scans, three-dimensional image affine registration was performed to align both channels using ClearMap (Renier et al., 2016). Representative images of Fos collected can be seen in Figure 2.
Figure 2.
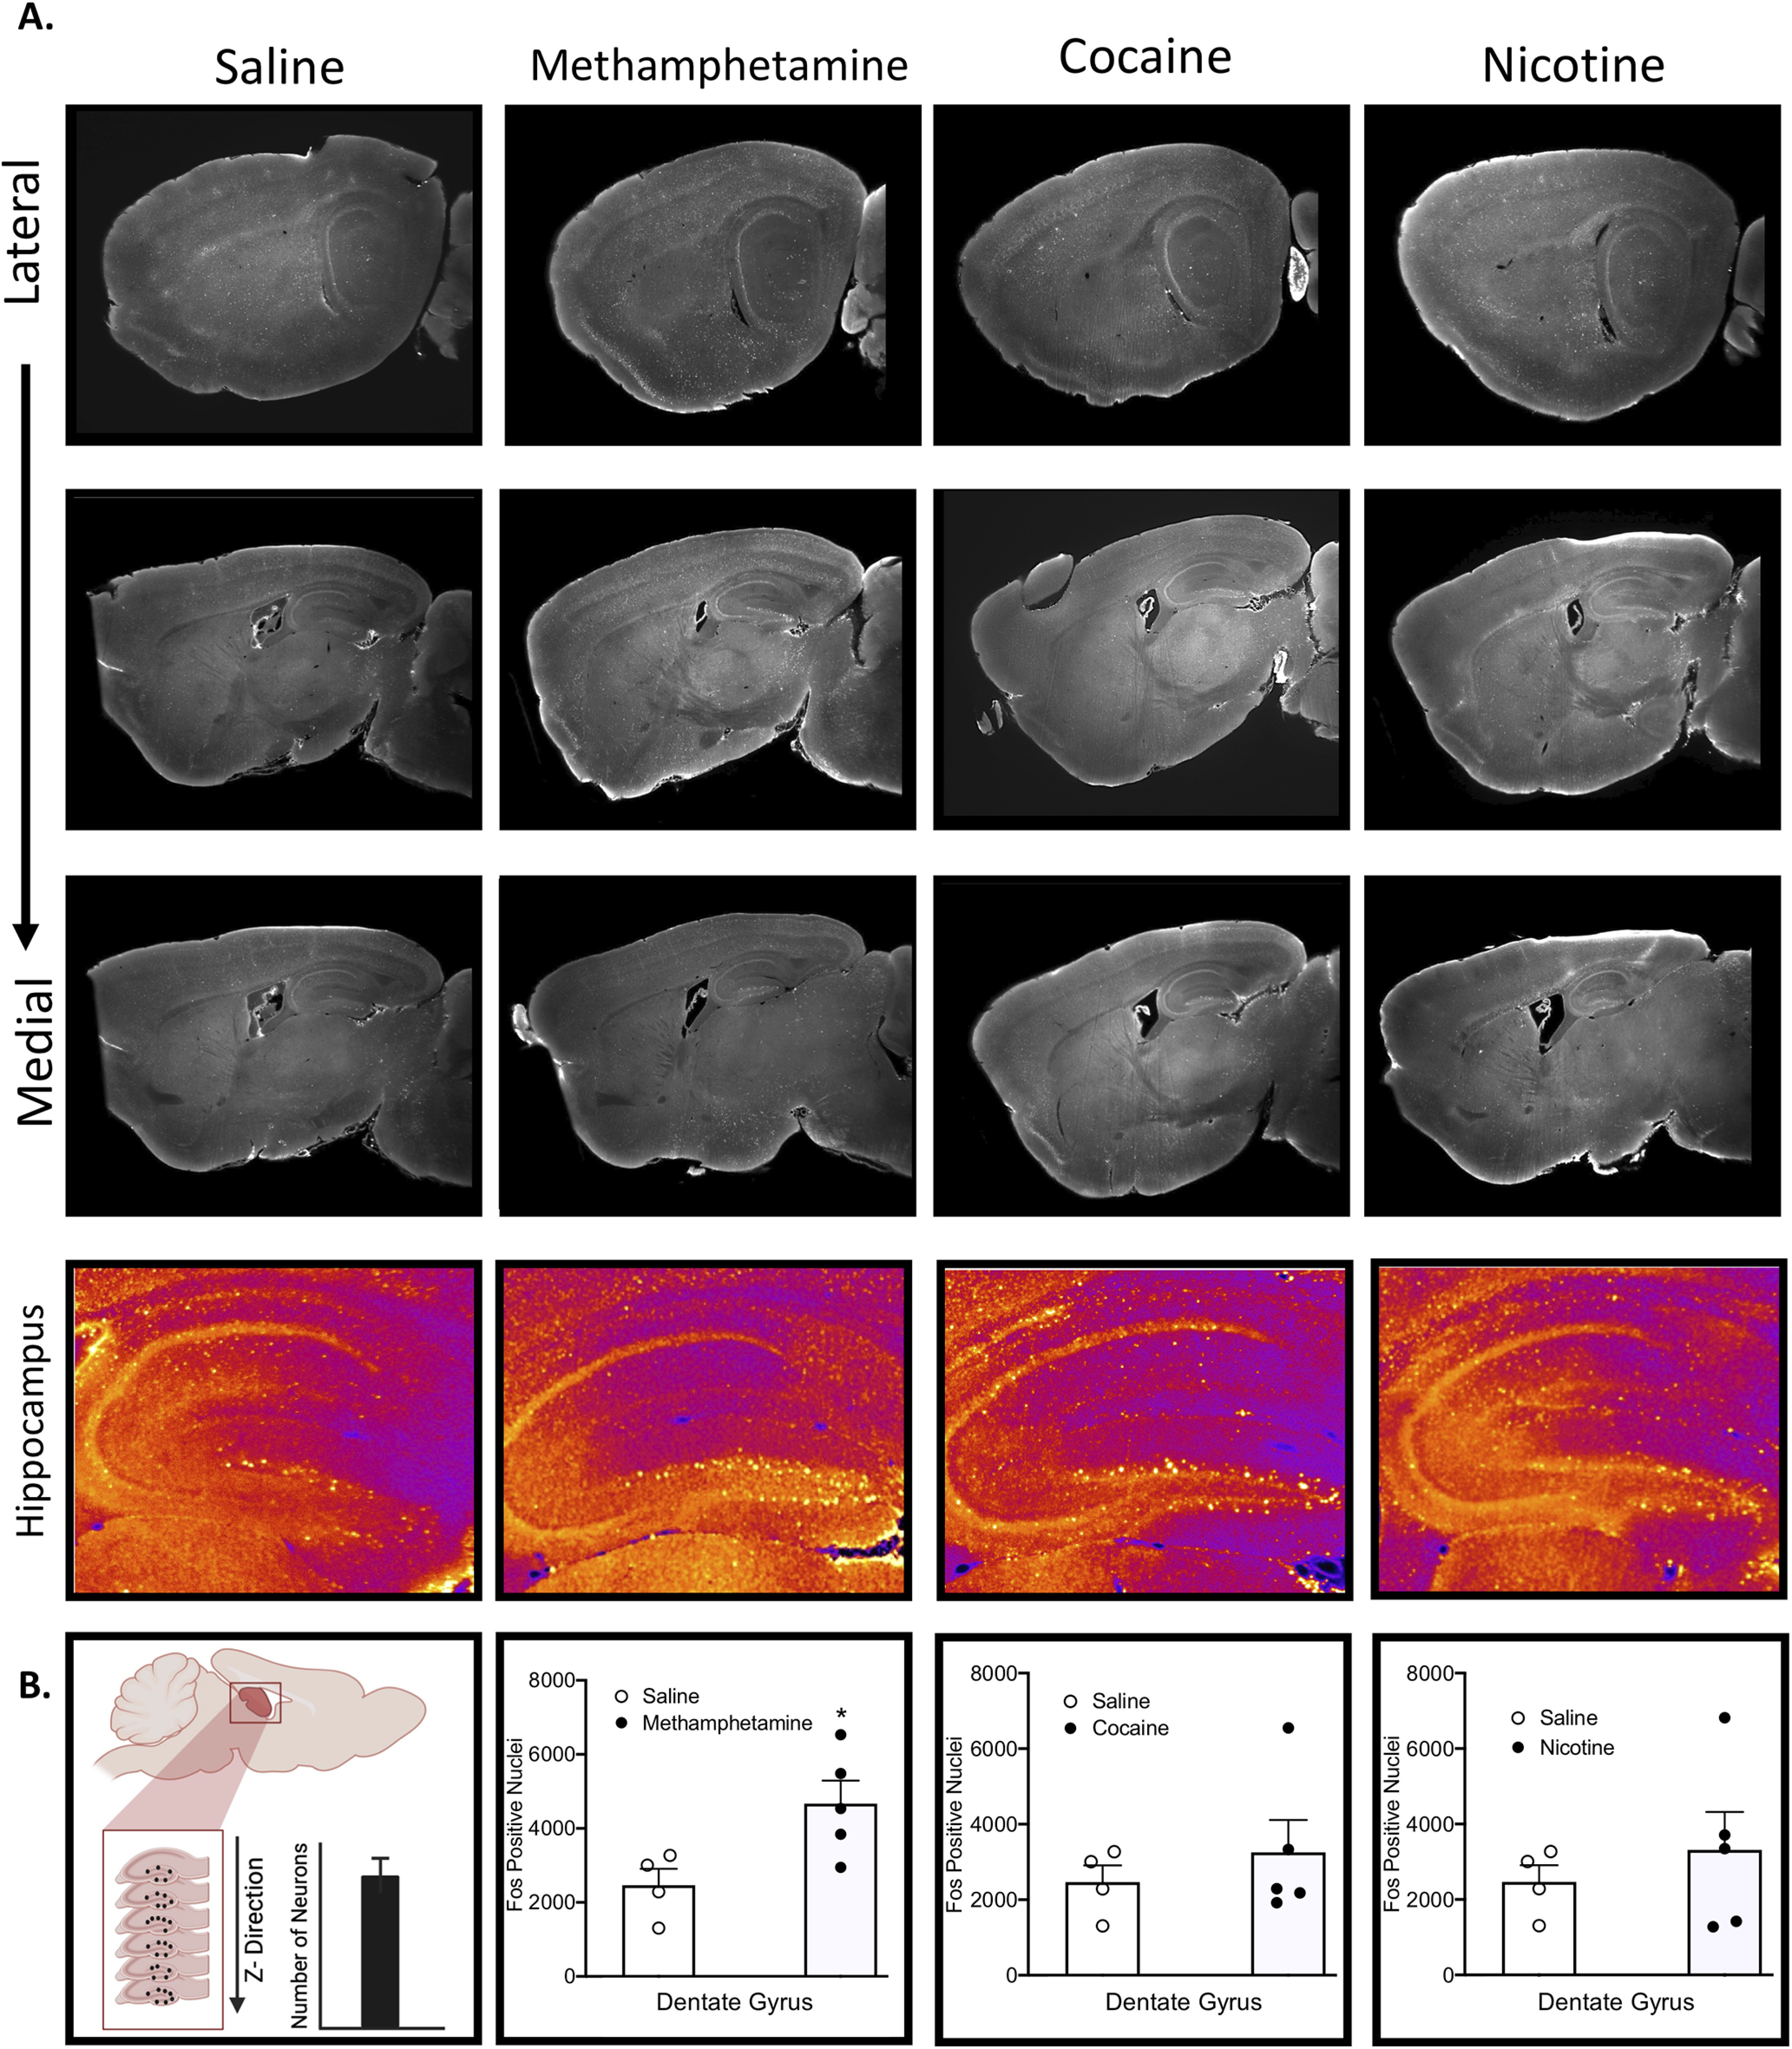
A, Lateral to medial sagittal representative sections of the brain and zoomed in representative hippocampal subsections for each treatment. B, Comparisons of Fos values for saline versus each treatment in the dentate gyrus. See Extended Data Figure 2-2 for raw Fos values and Extended Data Figure 2-1 for comparisons of raw Fos for treatments versus saline.
Fos counts of brain regions showing significant differences between a treatment and saline. Download Figure 2-1, TIF file (32.1MB, tif) .
Table of raw Fos values and group SEMs for each treatment. Download Figure 2-2, XLS file (108.5KB, xls) .
Data analysis
Identification of activated brain regions
Images that were acquired from the light-sheet microscope were analyzed from the end of the olfactory bulbs (the olfactory bulbs were not included in the analysis) to the beginning of the hindbrain and cerebellum. Counts of Fos-positive nuclei from each sample were identified for each brain region using ClearMap (Renier et al., 2016). ClearMap uses autofluorescence that is acquired in the 488-nm channel to align the brain to the Allen Mouse Brain Atlas (Allen Institute for Brain Science, 2004) and then registers Fos counts to regions that are annotated by the atlas. ClearMap has been validated and used now in several recent studies to identify labeled neurons and quantify the number labeled in a given brain region (Liebmann et al., 2016; Renier et al., 2016; Kimbrough et al., 2020; Kirst et al., 2020; Qian et al., 2021). For raw Fos counts and information on brain regions showing significant differences between saline and treatment Fos levels assessed by traditional comparison see the Extended Data Figures 2-1 and 2-2. A potential confound of the present approach is that possible errors in atlas registration, although unlikely, are would impact data from smaller brain regions more than larger brain regions. The data were normalized to a log10 value to reduce variability and bring brain regions with high numbers (e.g., thousands) and low numbers (e.g., tens to hundreds) of Fos counts to a similar scale.
Identification of functional connectivity within individual networks
Separate interregional Pearson correlations were then calculated using Statistica software (Tibco) across animals in the saline, cocaine, methamphetamine, and nicotine groups to compare the log10 Fos data from each brain region to each of the other brain regions. See Table 1 for a list of brain regions, their abbreviations, and their Allen atlas grouping. It should be noted that connectivity throughout refers to functional connectivity of brain regions and not structural connectivity.
Table 1.
Brain regions list
| Brain region | Abbreviation | Allen Group name |
|---|---|---|
| Agranular insular area posterior part | AIp | Cortical plate |
| Agranular insular area ventral part | AIv | Cortical plate |
| Anterior cingulate area dorsal part | ACAd | Cortical plate |
| Anterior cingulate area ventral part | ACAv | Cortical plate |
| Anterior olfactory nucleus | AON | Cortical plate |
| Anterolateral visual area | VISal | Cortical plate |
| Anteromedial visual area | VISam | Cortical plate |
| Cortical amygdalar area posterior part | COAp | Cortical plate |
| Dentate gyrus | DG | Cortical plate |
| Dorsal auditory area | AUDd | Cortical plate |
| Dorsal peduncular area | DP | Cortical plate |
| Ectorhinal area | ECT | Cortical plate |
| Entorhinal area lateral part | ENTl | Cortical plate |
| Entorhinal area medial part | ENTm | Cortical plate |
| Fasciola cinerea | FC | Cortical plate |
| Field CA1 | CA1 | Cortical plate |
| Field CA2 | CA2 | Cortical plate |
| Field CA3 | CA3 | Cortical plate |
| Frontal pole cerebral cortex | FRP | Cortical plate |
| Gustatory areas | GU | Cortical plate |
| Induseum griseum | IG | Cortical plate |
| Infralimbic area | ILA | Cortical plate |
| Lateral visual area | VISl | Cortical plate |
| Nucleus of the lateral olfactory tract | NLOT | Cortical plate |
| Orbital area lateral part | ORBl | Cortical plate |
| Orbital area medial part | ORBm | Cortical plate |
| Orbital area ventrolateral part | ORBvl | Cortical plate |
| Parasubiculum | PAR | Cortical plate |
| Perirhinal area | PERI | Cortical plate |
| Piriform area | PIR | Cortical plate |
| Piriform-amygdalar area | PAA | Cortical plate |
| Posterior auditory area | AUDpo | Cortical plate |
| Posterolateral visual area | VISpl | Cortical plate |
| Posteromedial visual area | VISpm | Cortical plate |
| Postpiriform transition area | TR | Cortical plate |
| Postsubiculum | POST | Cortical plate |
| Prelimbic area | PL | Cortical plate |
| Presubiculum | PRE | Cortical plate |
| Primary auditory area | AUDp | Cortical plate |
| Primary motor area | MOp | Cortical plate |
| Primary somatosensory area barrel field | SSp-bfd | Cortical plate |
| Primary somatosensory area lower limb | SSp-ll | Cortical plate |
| Primary somatosensory area mouth | SSp-m | Cortical plate |
| Primary somatosensory area nose | SSp-n | Cortical plate |
| Primary somatosensory area trunk | SSp-tr | Cortical plate |
| Primary somatosensory area upper limb | SSp-ul | Cortical plate |
| Primary visual area | VISp | Cortical plate |
| Retrosplenial area dorsal part | RSPd | Cortical plate |
| Retrosplenial area lateral agranular part | RSPagl | Cortical plate |
| Retrosplenial area ventral part | RSPv | Cortical plate |
| Secondary motor area | MOs | Cortical plate |
| Subiculum | SUB | Cortical plate |
| Supplemental somatosensory area | SSs | Cortical plate |
| Taenia tecta | TT | Cortical plate |
| Temporal association areas | TEa | Cortical plate |
| Ventral auditory area | AUDv | Cortical plate |
| Visceral area | VISC | Cortical plate |
| Basolateral amygdalar nucleus | BLA | Cortical subplate |
| Claustrum | CLA | Cortical subplate |
| Endopiriform nucleus | EP | Cortical subplate |
| Lateral amygdalar nucleus | LA | Cortical subplate |
| Posterior amygdalar nucleus | PA | Cortical subplate |
| Anterior amygdalar area | AAA | Striatum |
| Bed nucleus of the accessory olfactory tract | BA | Striatum |
| Caudoputamen | CP | Striatum |
| Central amygdalar nucleus | CEA | Striatum |
| Fundus of striatum | FS | Striatum |
| Intercalated amygdalar nucleus | IA | Striatum |
| Lateral septal complex | LSX | Striatum |
| Medial amygdalar nucleus | MEA | Striatum |
| Nucleus accumbens | ACB | Striatum |
| Olfactory tubercle | OT | Striatum |
| Septofimbrial nucleus | SF | Striatum |
| Bed nuclei of the stria terminalis | BST | Pallidum |
| Diagonal band nucleus | NDB | Pallidum |
| Globus pallidus external segment | GPe | Pallidum |
| Globus pallidus internal segment | GPi | Pallidum |
| Magnocellular nucleus | MA | Pallidum |
| Medial septal nucleus | MS | Pallidum |
| Substantia innominata | SI | Pallidum |
| Triangular nucleus of septum | TRS | Pallidum |
| Anterior group of the dorsal thalamus | ATN | Thalamus |
| Anterodorsal nucleus | AD | Thalamus |
| Anteroventral nucleus of thalamus | AV | Thalamus |
| Central lateral nucleus of the thalamus | CL | Thalamus |
| Central medial nucleus of the thalamus | CM | Thalamus |
| Dorsal part of the lateral geniculate complex | LGd | Thalamus |
| Interanterodorsal nucleus of the thalamus | IAD | Thalamus |
| Interanteromedial nucleus of the thalamus | IAM | Thalamus |
| Intergeniculate leaflet of the lateral geniculate complex | IGL | Thalamus |
| Intermediodorsal nucleus of the thalamus | IMD | Thalamus |
| Lateral dorsal nucleus of thalamus | LD | Thalamus |
| Lateral habenula | LH | Thalamus |
| Lateral posterior nucleus of the thalamus | LP | Thalamus |
| Medial geniculate complex | MG | Thalamus |
| Medial habenula | MH | Thalamus |
| Mediodorsal nucleus of thalamus | MD | Thalamus |
| Nucleus of reuniens | RE | Thalamus |
| Paracentral nucleus | PCN | Thalamus |
| Parafascicular nucleus | PF | Thalamus |
| Parataenial nucleus | PT | Thalamus |
| Paraventricular nucleus of the thalamus | PVT | Thalamus |
| Peripeduncular nucleus | PP | Thalamus |
| Posterior complex of the thalamus | PO | Thalamus |
| Posterior limiting nucleus of the thalamus | POL | Thalamus |
| Reticular nucleus of the thalamus | RT | Thalamus |
| Submedial nucleus of the thalamus | SMT | Thalamus |
| Subparafascicular nucleus | SPF | Thalamus |
| Thalamus sensory-motor cortex related | DORsm | Thalamus |
| Ventral anterior-lateral complex of the thalamus | VAL | Thalamus |
| Ventral medial nucleus of the thalamus | VM | Thalamus |
| Ventral part of the lateral geniculate complex | LGv | Thalamus |
| Ventral posterior complex of the thalamus | VP | Thalamus |
| Ventral posterolateral nucleus of the thalamus | VPL | Thalamus |
| Anterior hypothalamic nucleus | AHN | Hypothalamus |
| Anterodorsal preoptic nucleus | ADP | Hypothalamus |
| Anteroventral periventricular nucleus | AVPV | Hypothalamus |
| Anteroventral preoptic nucleus | AVP | Hypothalamus |
| Arcuate hypothalamic nucleus | ARH | Hypothalamus |
| Dorsal premammillary nucleus | PMd | Hypothalamus |
| Dorsomedial nucleus of the hypothalamus | DMH | Hypothalamus |
| Lateral hypothalamic area | LHA | Hypothalamus |
| Lateral preoptic area | LPO | Hypothalamus |
| Mammillary body | MBO | Hypothalamus |
| Medial preoptic area | MPO | Hypothalamus |
| Medial preoptic nucleus | MPN | Hypothalamus |
| Median preoptic nucleus | MEPO | Hypothalamus |
| Parastrial nucleus | PS | Hypothalamus |
| Parasubthalamic nucleus | PSTN | Hypothalamus |
| Paraventricular hypothalamic nucleus | PVH | Hypothalamus |
| Paraventricular hypothalamic nucleus descending division | PVHd | Hypothalamus |
| Periventricular hypothalamic nucleus posterior part | PVp | Hypothalamus |
| Periventricular hypothalamic nucleus preoptic part | PVpo | Hypothalamus |
| Periventricular zone | PVZ | Hypothalamus |
| Posterior hypothalamic nucleus | PH | Hypothalamus |
| Preparasubthalamic nucleus | PST | Hypothalamus |
| Retrochiasmatic area | RCH | Hypothalamus |
| Subparaventricular zone | SBPV | Hypothalamus |
| Subthalamic nucleus | STN | Hypothalamus |
| Suprachiasmatic nucleus | SCH | Hypothalamus |
| Supramammillary nucleus | SUM | Hypothalamus |
| Supraoptic nucleus | SO | Hypothalamus |
| Tuberal nucleus | TU | Hypothalamus |
| Ventrolateral preoptic nucleus | VLPO | Hypothalamus |
| Ventromedial hypothalamic nucleus | VMH | Hypothalamus |
| Zona incerta | ZI | Hypothalamus |
| Anterior pretectal nucleus | APN | Midbrain |
| Cuneiform nucleus | CUN | Midbrain |
| Inferior colliculus | IC | Midbrain |
| Interpeduncular nucleus | IPN | Midbrain |
| Medial pretectal area | MPT | Midbrain |
| Midbrain reticular nucleus | MRN | Midbrain |
| Midbrain reticular nucleus retrorubral area | RR | Midbrain |
| Nucleus of Darkschewitsch | ND | Midbrain |
| Nucleus of the brachium of the inferior colliculus | NB | Midbrain |
| Nucleus of the optic tract | NOT | Midbrain |
| Nucleus of the posterior commissure | NPC | Midbrain |
| Olivary pretectal nucleus | OP | Midbrain |
| Parabigeminal nucleus | PBG | Midbrain |
| Pedunculopontine nucleus | PPN | Midbrain |
| Periaqueductal gray | PAG | Midbrain |
| Posterior pretectal nucleus | PPT | Midbrain |
| Precommissural nucleus | PRC | Midbrain |
| Red nucleus | RN | Midbrain |
| Substantia nigra compact part | SNc | Midbrain |
| Substantia nigra reticular part | SNr | Midbrain |
| Superior colliculus motor related | SCm | Midbrain |
| Superior colliculus sensory related | SCs | Midbrain |
| Ventral tegmental area | VTA | Midbrain |
| Pons | P | Hindbrain |
| Pons motor related | P-mot | Hindbrain |
| Pontine reticular nucleus | PRNr | Hindbrain |
| Vestibular nuclei | VNC | Hindbrain |
| Ansiform lobule | AN | Cerebellum |
| Central lobule | CENT | Cerebellum |
| Culmen | CUL | Cerebellum |
| Paraflocculus | PFL | Cerebellum |
| Simple lobule | SIM | Cerebellum |
Hierarchical clustering
Previous rat and mouse studies that examined functional connectivity used five to eight animals (Wheeler et al., 2013; Orsini et al., 2018). The number of samples that are examined in functional connectivity studies is the number of potential functional connections (i.e., 178 total brain regions all connecting with each other for each treatment). Furthermore, hierarchical clustering organizes brain regions into modules by grouping regions that show a similar functional connectivity profile across all other brain regions. Thus, more total functional connections minimize the effect that an inaccurate brain region-to-brain region functional connection has on network organization and overall network structure.
Interregional Pearson correlations were then used to calculate complete Euclidean distances between each pair of brain regions in each group of mice. The distance matrices were then hierarchically clustered using R Studio software by both row and column using the complete method to identify modules of functional connectivity within each treatment group. The hierarchical cluster dendrograms were trimmed at half the height of each given tree to split the dendrogram into specific modules. The result of a decrease in modularity that is attributable to psychostimulant use was consistent across multiple tree-cutting thresholds (Fig. 3E).
Figure 3.
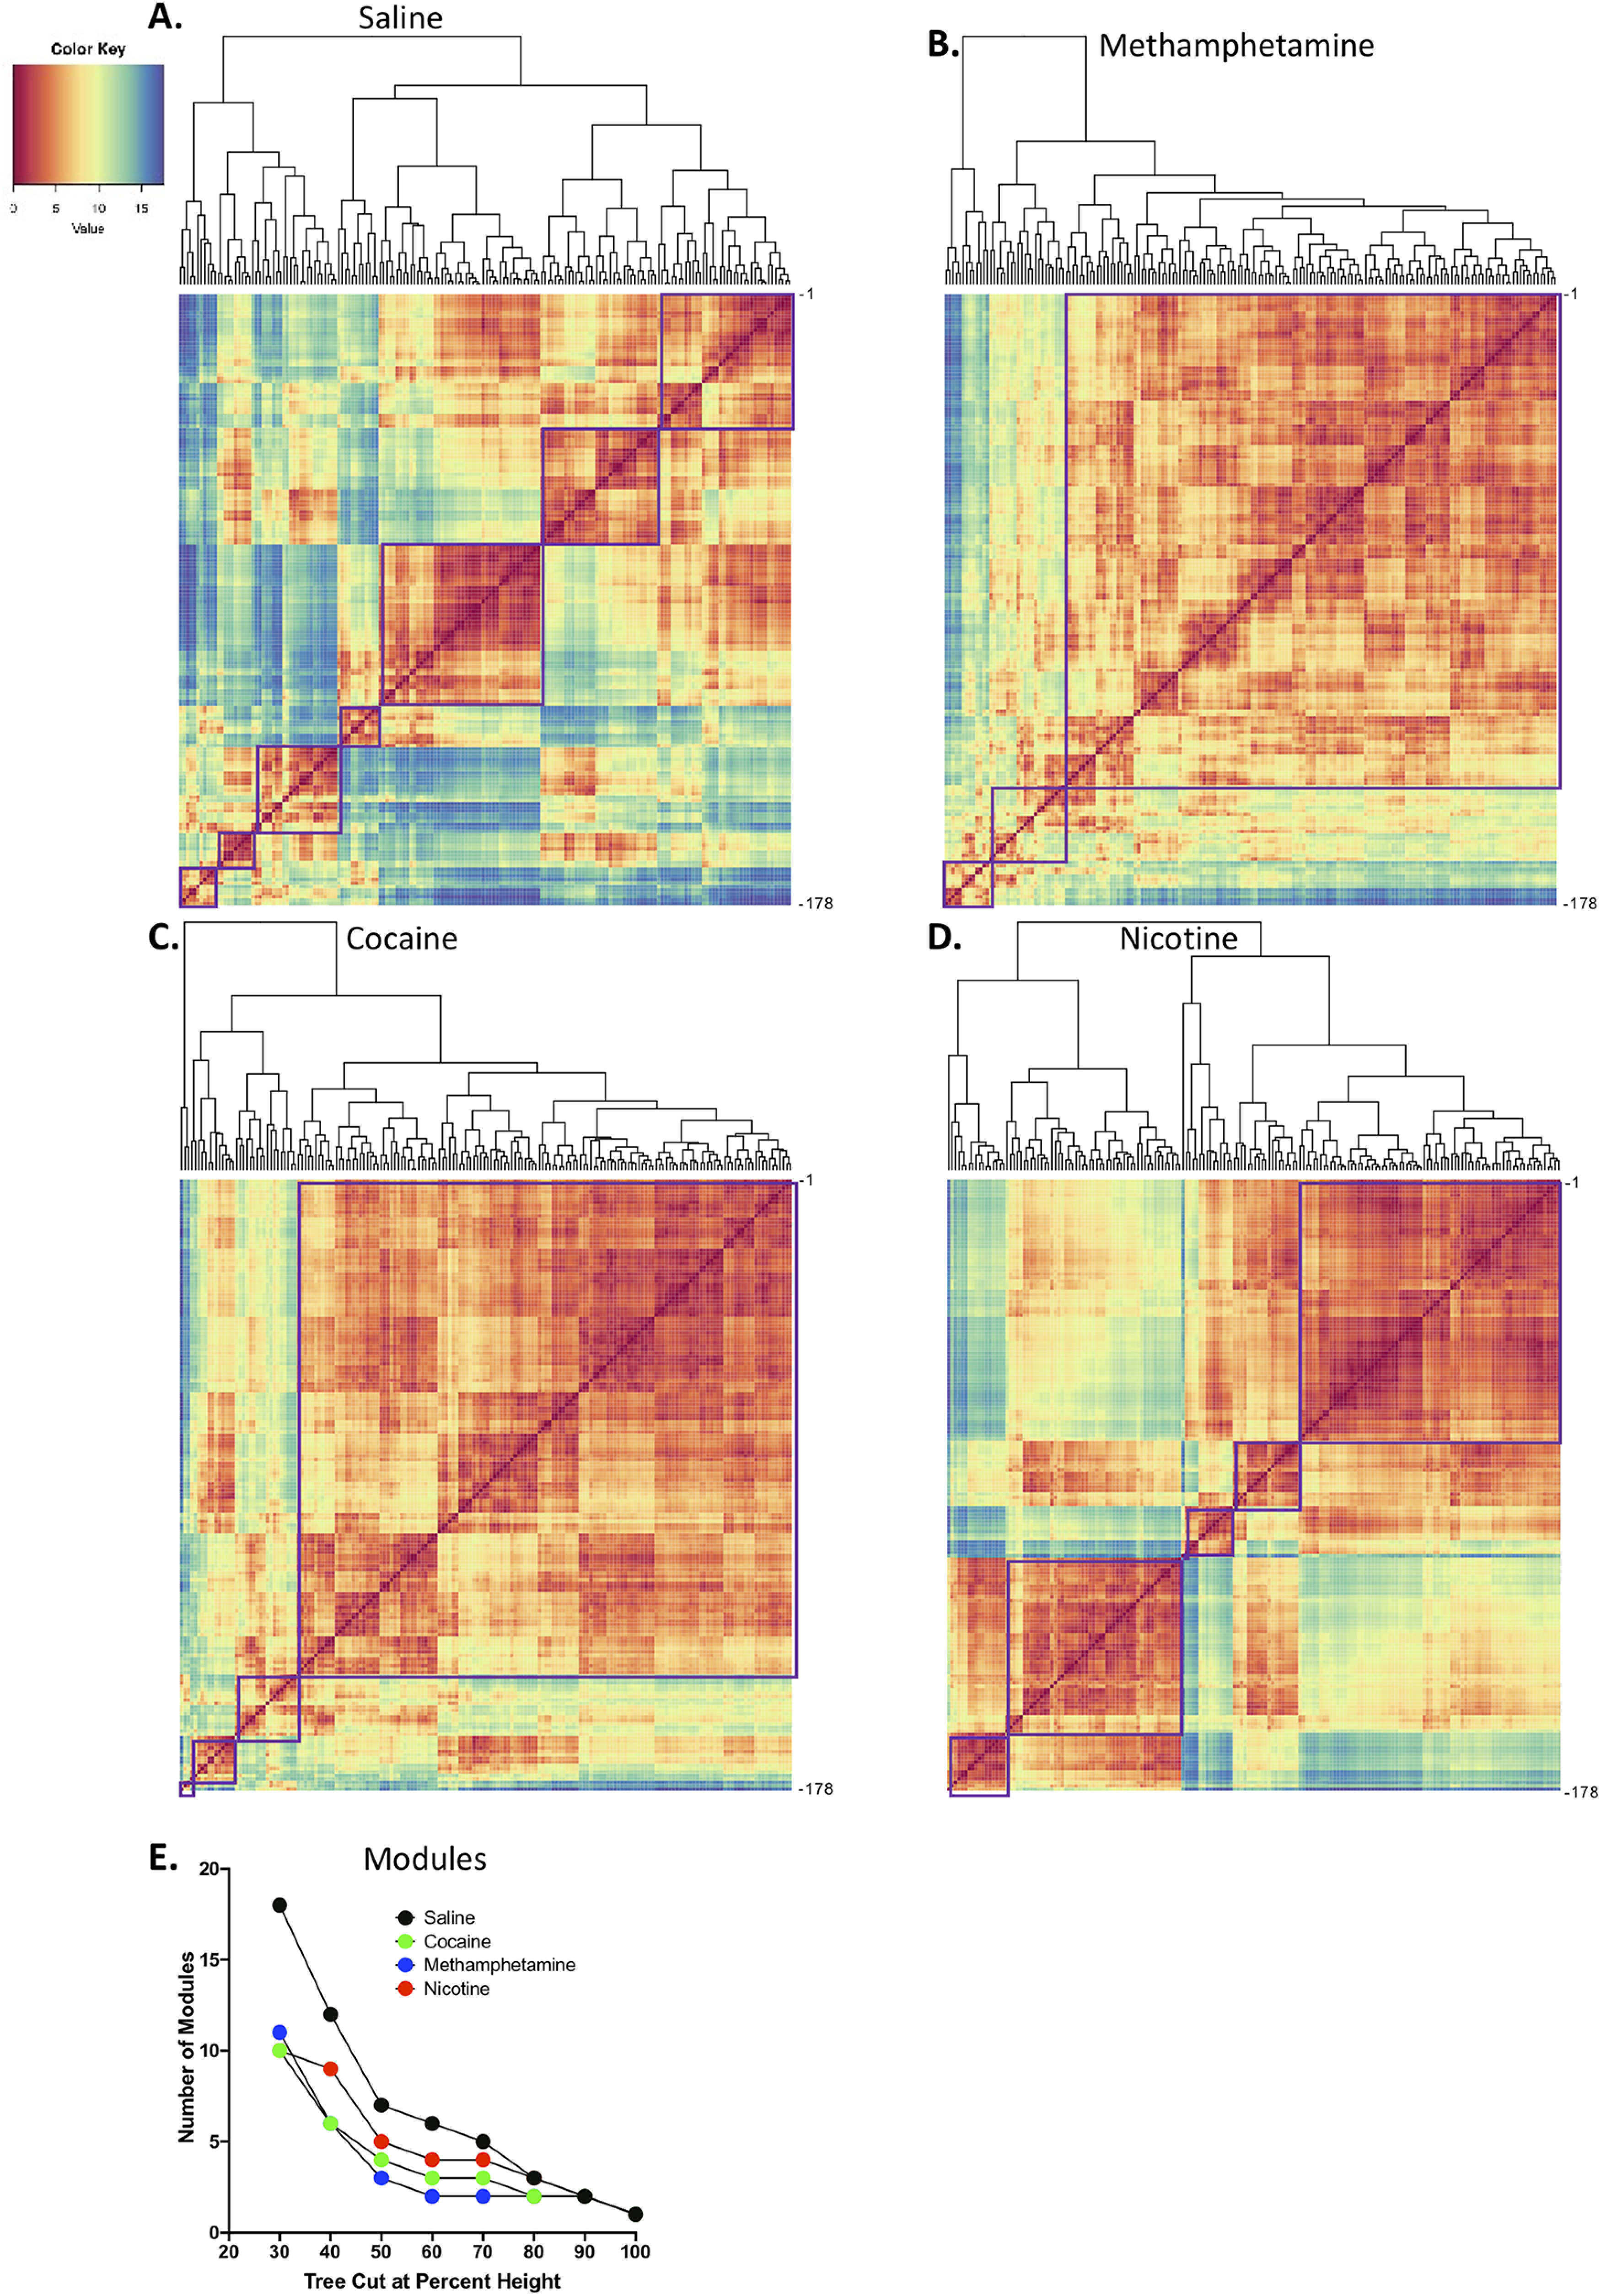
A–D, Hierarchical clustering of complete Euclidean distance matrices for each treatment. Modules were determined by cutting each dendrogram at half of the maximal tree height. A, Relative distance of each brain region relative to the others that were examined in saline control mice. In control mice, seven distinct modules of coactivation were identified. B, Relative distance of each brain region relative to the others that were examined in cocaine mice. In cocaine mice, four distinct modules of coactivation were identified. C, Relative distance of each brain region relative to the others that were examined in methamphetamine mice. In methamphetamine mice, three distinct modules of coactivation were identified. D, Relative distance of each brain region relative to the others that were examined in nicotine mice. In nicotine mice, five distinct modules of coactivation were identified. For all distance matrices, each module is boxed in purple. For the individual brain regions that are listed in panels A–D, see Table 6. E, Number of modules in each treatment condition after cutting the hierarchical clustered dendrogram at different percentages of tree height. In all cases (except at extreme cutoff values; e.g., 90–100%), the psychostimulant networks showed lower modularity compared with the control network. See Extended Data Figure 3-1 for correlation matrices for each treatment.
Pearson correlation matrices for showing functional connectivity measures of each treatment. Download Figure 3-1, TIF file (32.1MB, tif) .
Graph theory identification of functional networks
We used a graph theory-based approach to identify the functional neural networks that were associated with each treatment condition. Graph theory is a branch of mathematics that is used to analyze complex networks, such as social, financial, protein, and neural networks (Jeong et al., 2001; Barabasi, 2009; Chiang et al., 2011; Varshney et al., 2011; Babu et al., 2012; Jarrell et al., 2012; Bargmann and Marder, 2013; Wheeler et al., 2013; Oh et al., 2014; Markov et al., 2014; Cohen and D’Esposito, 2016; Vetere et al., 2017). Using graph theory, functional networks can be delineated, and key brain regions of the network can be identified (Sporns et al., 2007; Rubinov and Sporns, 2010; Wheeler et al., 2013; Vetere et al., 2017).
Previous studies of regional functional connectivity profiles using Fos have focused on global measures of connectivity (e.g., degree; Wheeler et al., 2013). However, in correlation-based networks, these measures can be strongly influenced by the size of the subnetwork (module) in which a node participates (Power et al., 2013). For the graph theory analyses, we were interested in regional properties and not module size per se. Thus, module structure needs to be considered when examining the role that each region plays in the network. To accomplish this, we used two widely used centrality metrics that were designed for application to modular systems. The Z-scored version of within-module degree (WMDz) indexes the relative importance of a region within its own module (e.g., intramodule connectivity), and the participation coefficient (PC) indexes the extent to which a region connects diversely to multiple modules (e.g., intermodule connectivity; Guimera and Nunes Amaral, 2005).
We used the Pearson correlation values that were calculated for the brain regions from each treatment. Before plotting and calculating regional connectivity metrics, the network was thresholded to remove any edges that were weaker than R = 0.75. As such, visualization and graph theory analyses were performed using only edges with positive weights. Regional connectivity metrics (PC and WMDz) were calculated as originally defined by Guimera and Nunes Amaral (2005), modified for application to networks with weighted edges. PC and WMDz were calculated using a customized version of the bctpy Python package (https://github.com/aestrivex/bctpy), which is derived from the MATLAB implementation of Brain Connectivity Toolbox (Rubinov and Sporns, 2010).
For WMDz, let (within-module degree) be the summed weight of all edges between region and other regions in module . Then, is the average within-module degree of all regions in module , and is the standard deviation of those values. The WMDz is then defined as:
This provides a measure of the extent to which each region is connected to other regions in the same module.
For PC, let (between-module degree) be the summed weight of all edges between region and regions in module , and let (total degree) be the summed weight of all edges between region and all other regions in the network. The PC of each region is then defined as:
This provides a measure of the extent to which the connections of a region are distributed mostly within its own module (PC approaching 0) or distributed evenly among all modules (PC approaching 1).
A high PC was considered ≥0.30, and a high WMDz was considered ≥0.80. Previous studies have used ranges of ≥0.30–0.80 for high PC and ≥1.5–2.5 for high WMDz (Guimera and Nunes Amaral, 2005; Cohen and D’Esposito, 2016). Because of differences in the sizes/types of networks that were examined and the methods that were used (e.g., Fos vs functional magnetic resonance imaging), we adjusted the range for consideration as having high PC and WMDz accordingly.
Network visualization was performed using a combination of Gephi 0.9.2 software (Bastian et al., 2009) and Adobe Illustrator software. Nodes were positioned using the Force Atlas 2 algorithm (Jacomy et al., 2014) with a handful of nodes that were repositioned manually for better visual organization.
Results
Psychostimulant withdrawal induces restructuring of brain functional networks
We examined the ways in which withdrawal from different psychostimulants alters functional connectivity and modular structuring of the brain. For an overview of the experimental design and analysis pipeline, see Figure 1. Representative examples Fos images collected can be seen in Figure 2. For all of the drugs tested, acute withdrawal produced widespread increases in the functional connectivity of brain regions compared with saline controls (Fig. 3A–D). Importantly, modular structuring of the brain decreased in response to withdrawal from each psychostimulant compared with controls. When using a threshold of 50% of tree height, saline control mice exhibited a modular structure of the brain that contained seven modules, whereas cocaine mice had four modules, methamphetamine mice had three modules, and nicotine mice had five modules and one isolated brain region that was not grouped with any other region (i.e., interanterodorsal nucleus of the thalamus; Fig. 3A–E). Notably, the decrease in the number of modules during withdrawal was independent of the clustering thresholds that were used (Fig. 3E). These data indicate that psychostimulant withdrawal decreases modularity of the functional network compared with controls.
Characterization of individual network features
To further characterize the features of each individual network, we used a graph theory approach to identify potential hub brain regions with the most intramodular and intermodular connectivity, which may drive activity within the network and thus be critical for neuronal function in the withdrawal state. We examined positive connectivity (thresholded to a Pearson correlation coefficient >0.75 [0.75R] for inclusion as a network connection) for the network for each treatment and used the modular organization that was identified by hierarchical clustering to partition the regions of the networks. The 0.75R threshold was chosen because all of the brain regions in each network showed connections to other regions at this threshold. Previous animal model studies used various thresholds, ranging from 0.3R to 0.85R (Wheeler et al., 2013; Orsini et al., 2018), to examine connectivity. Negative network connectivity was not examined herein because the precise meaning of such connectivity is controversial and thus is not often examined in network-based approaches (Giove et al., 2009; Meunier et al., 2009; Murphy et al., 2009; Chen et al., 2011).
We determined the PC (i.e., a measure of importance for intermodular connectivity) and the WMDz (i.e., a measure of importance for intramodular connectivity; Guimera and Nunes Amaral, 2005) for all brain regions in the networks. A high PC was considered ≥0.30, and a high WMDz was considered ≥0.80. Overall, the control and nicotine networks showed much greater intermodular connectivity (high PC) and a great number of regions with both high intermodular and intramodular connectivity (high PC and WMDz). The cocaine and methamphetamine networks showed higher levels of intramodular connectivity (high WMDz) and a low number of regions with intermodular connectivity (Fig. 4A-C). We named each module in each network based on the group of brain regions with the highest WMDz score in the module and considered these regions to be drivers of activity within individual modules (Figs. 5-8 for names).
Figure 4.
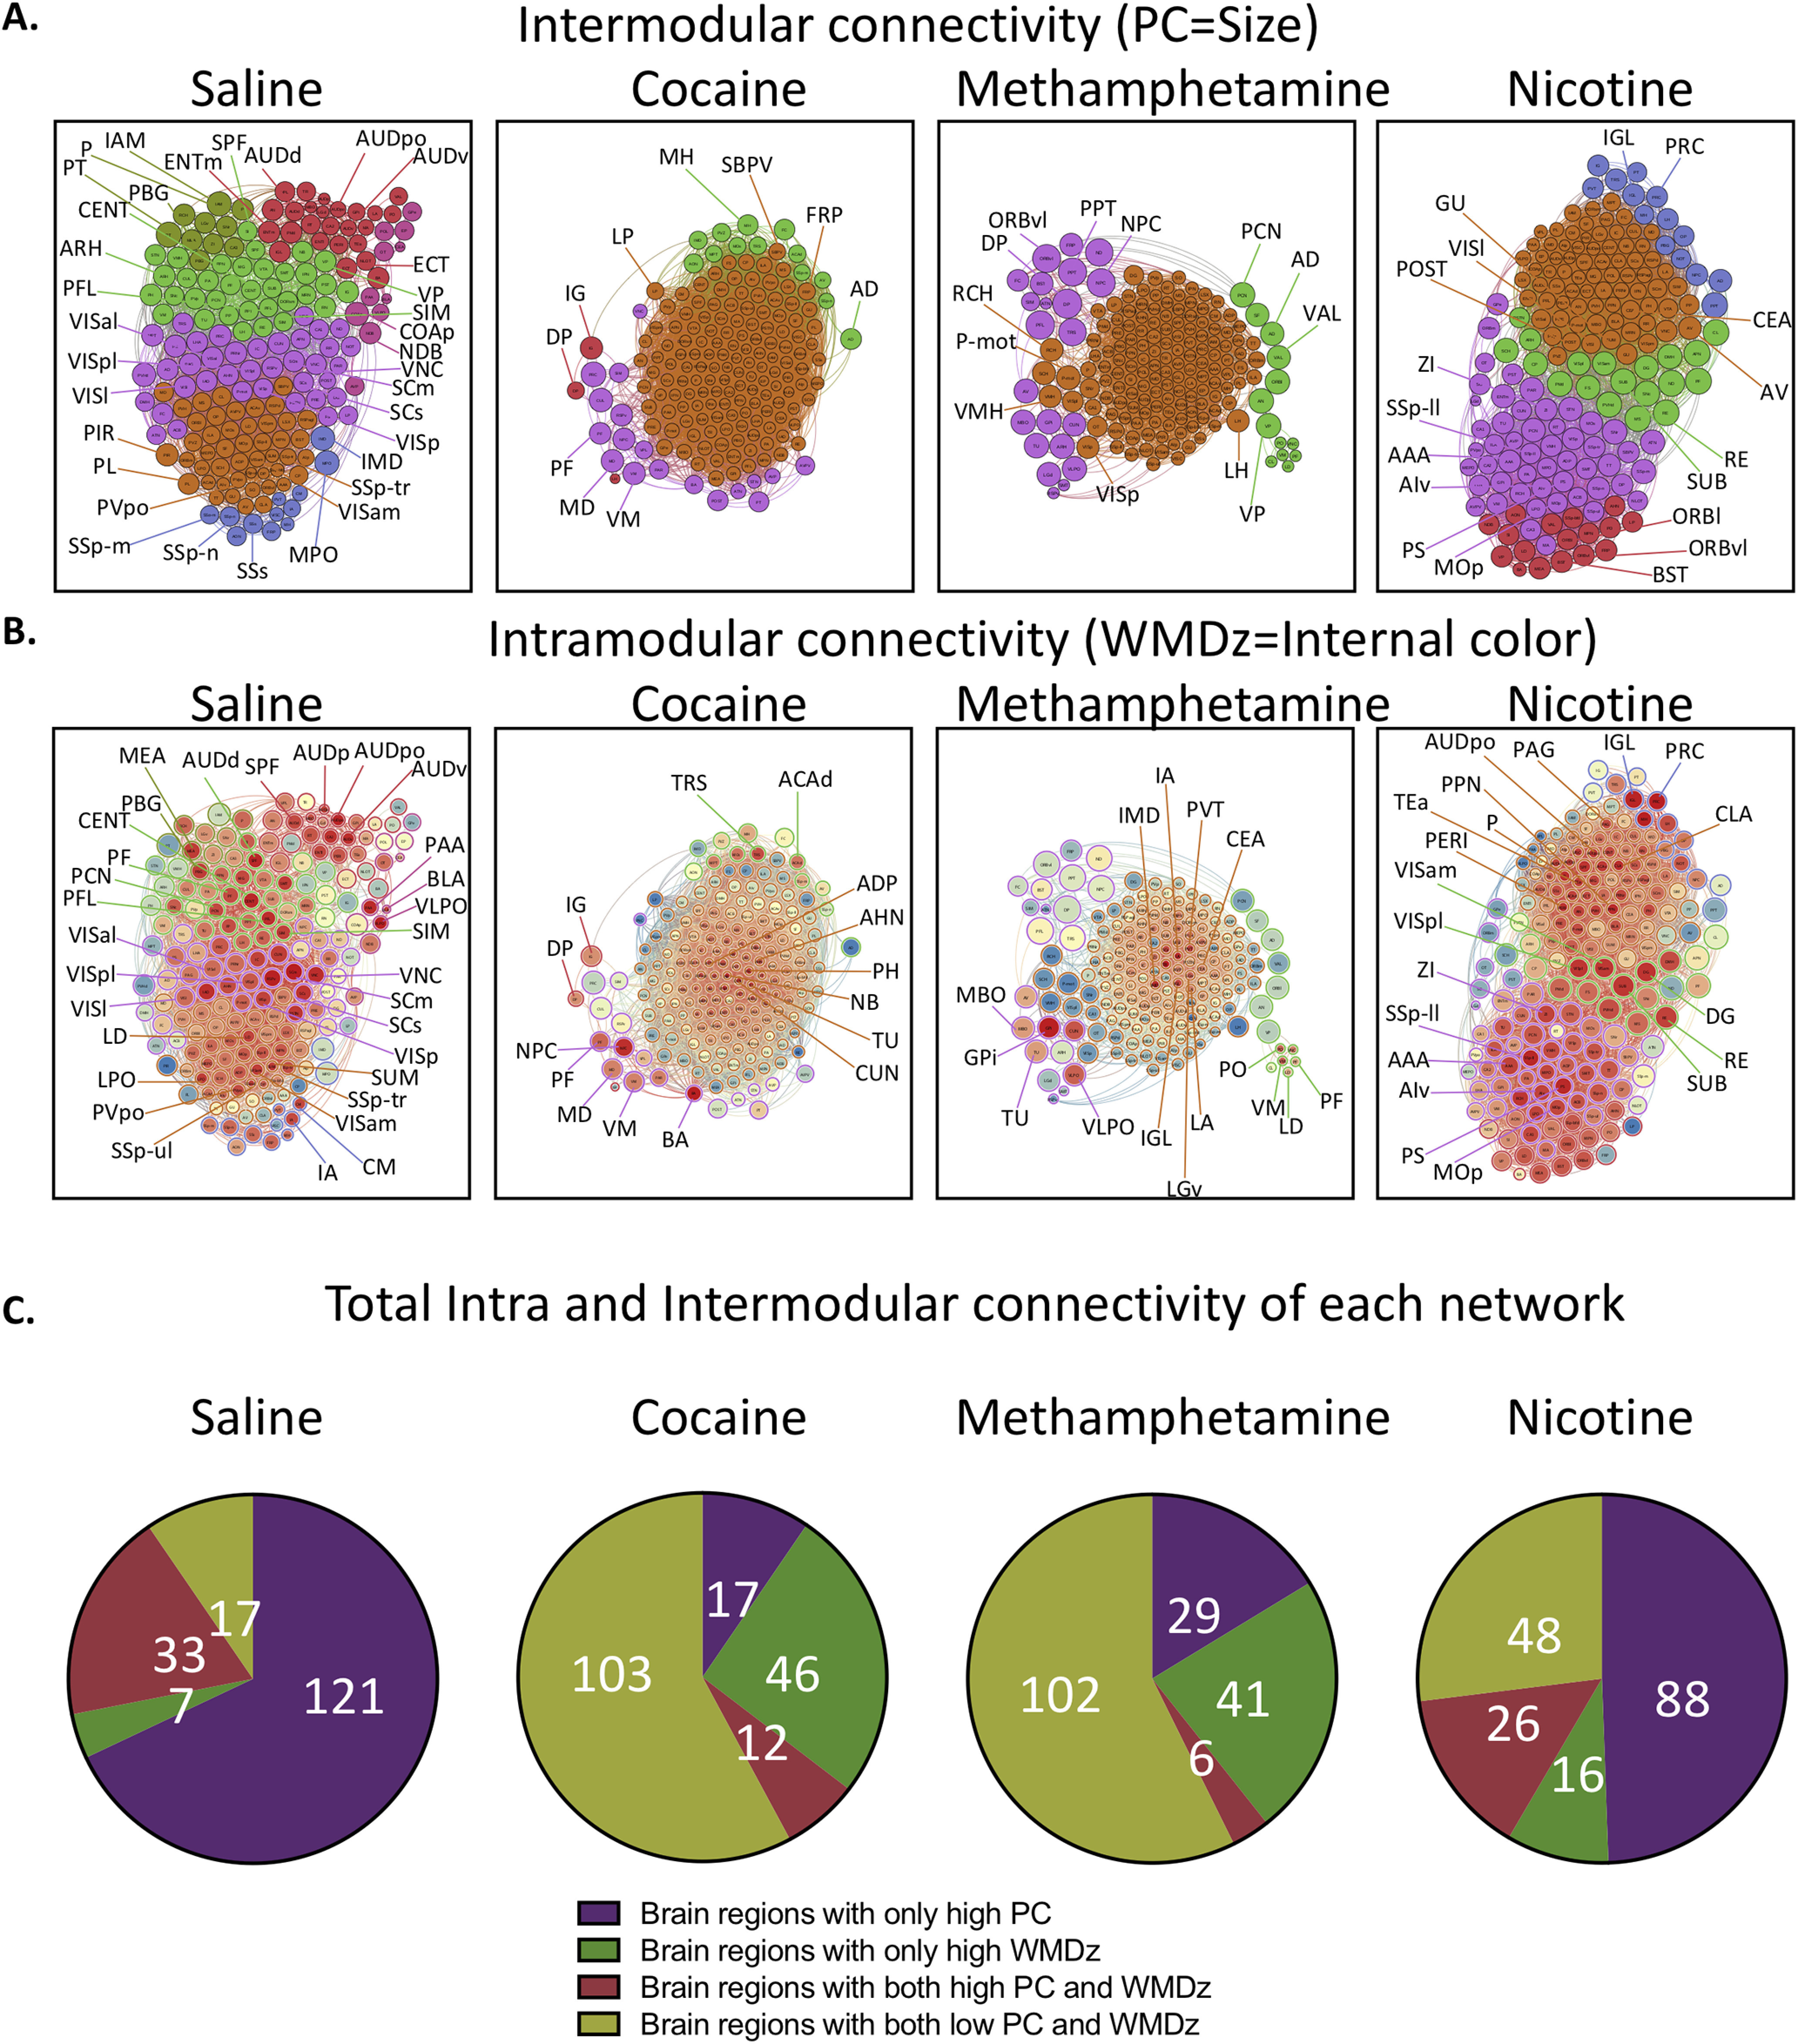
Intramodular (WMDz) and intermodular (PC) network features of each treatment. A high PC was considered ≥0.30, and a high WMDz was considered ≥0.80. A, Highlights of several regions with high PC in each module of each network (see Table 1 for names of abbreviations). B, Highlights of several regions with high WMDz (red, higher; blue, lower) in each module of each network. Note that the WMDz color intensity is only relative to the other regions within the same network and not other networks (see Table 1 for names of abbreviations). C, Total number of brain regions that accounted for high PC, high WMDz, or both in each network. The control and nicotine networks showed much greater intermodular connectivity and a greater number of regions with both high intermodular and intramodular connectivity. The cocaine and methamphetamine networks showed higher levels of intramodular connectivity and a low number of regions with intermodular connectivity.
Figure 5.
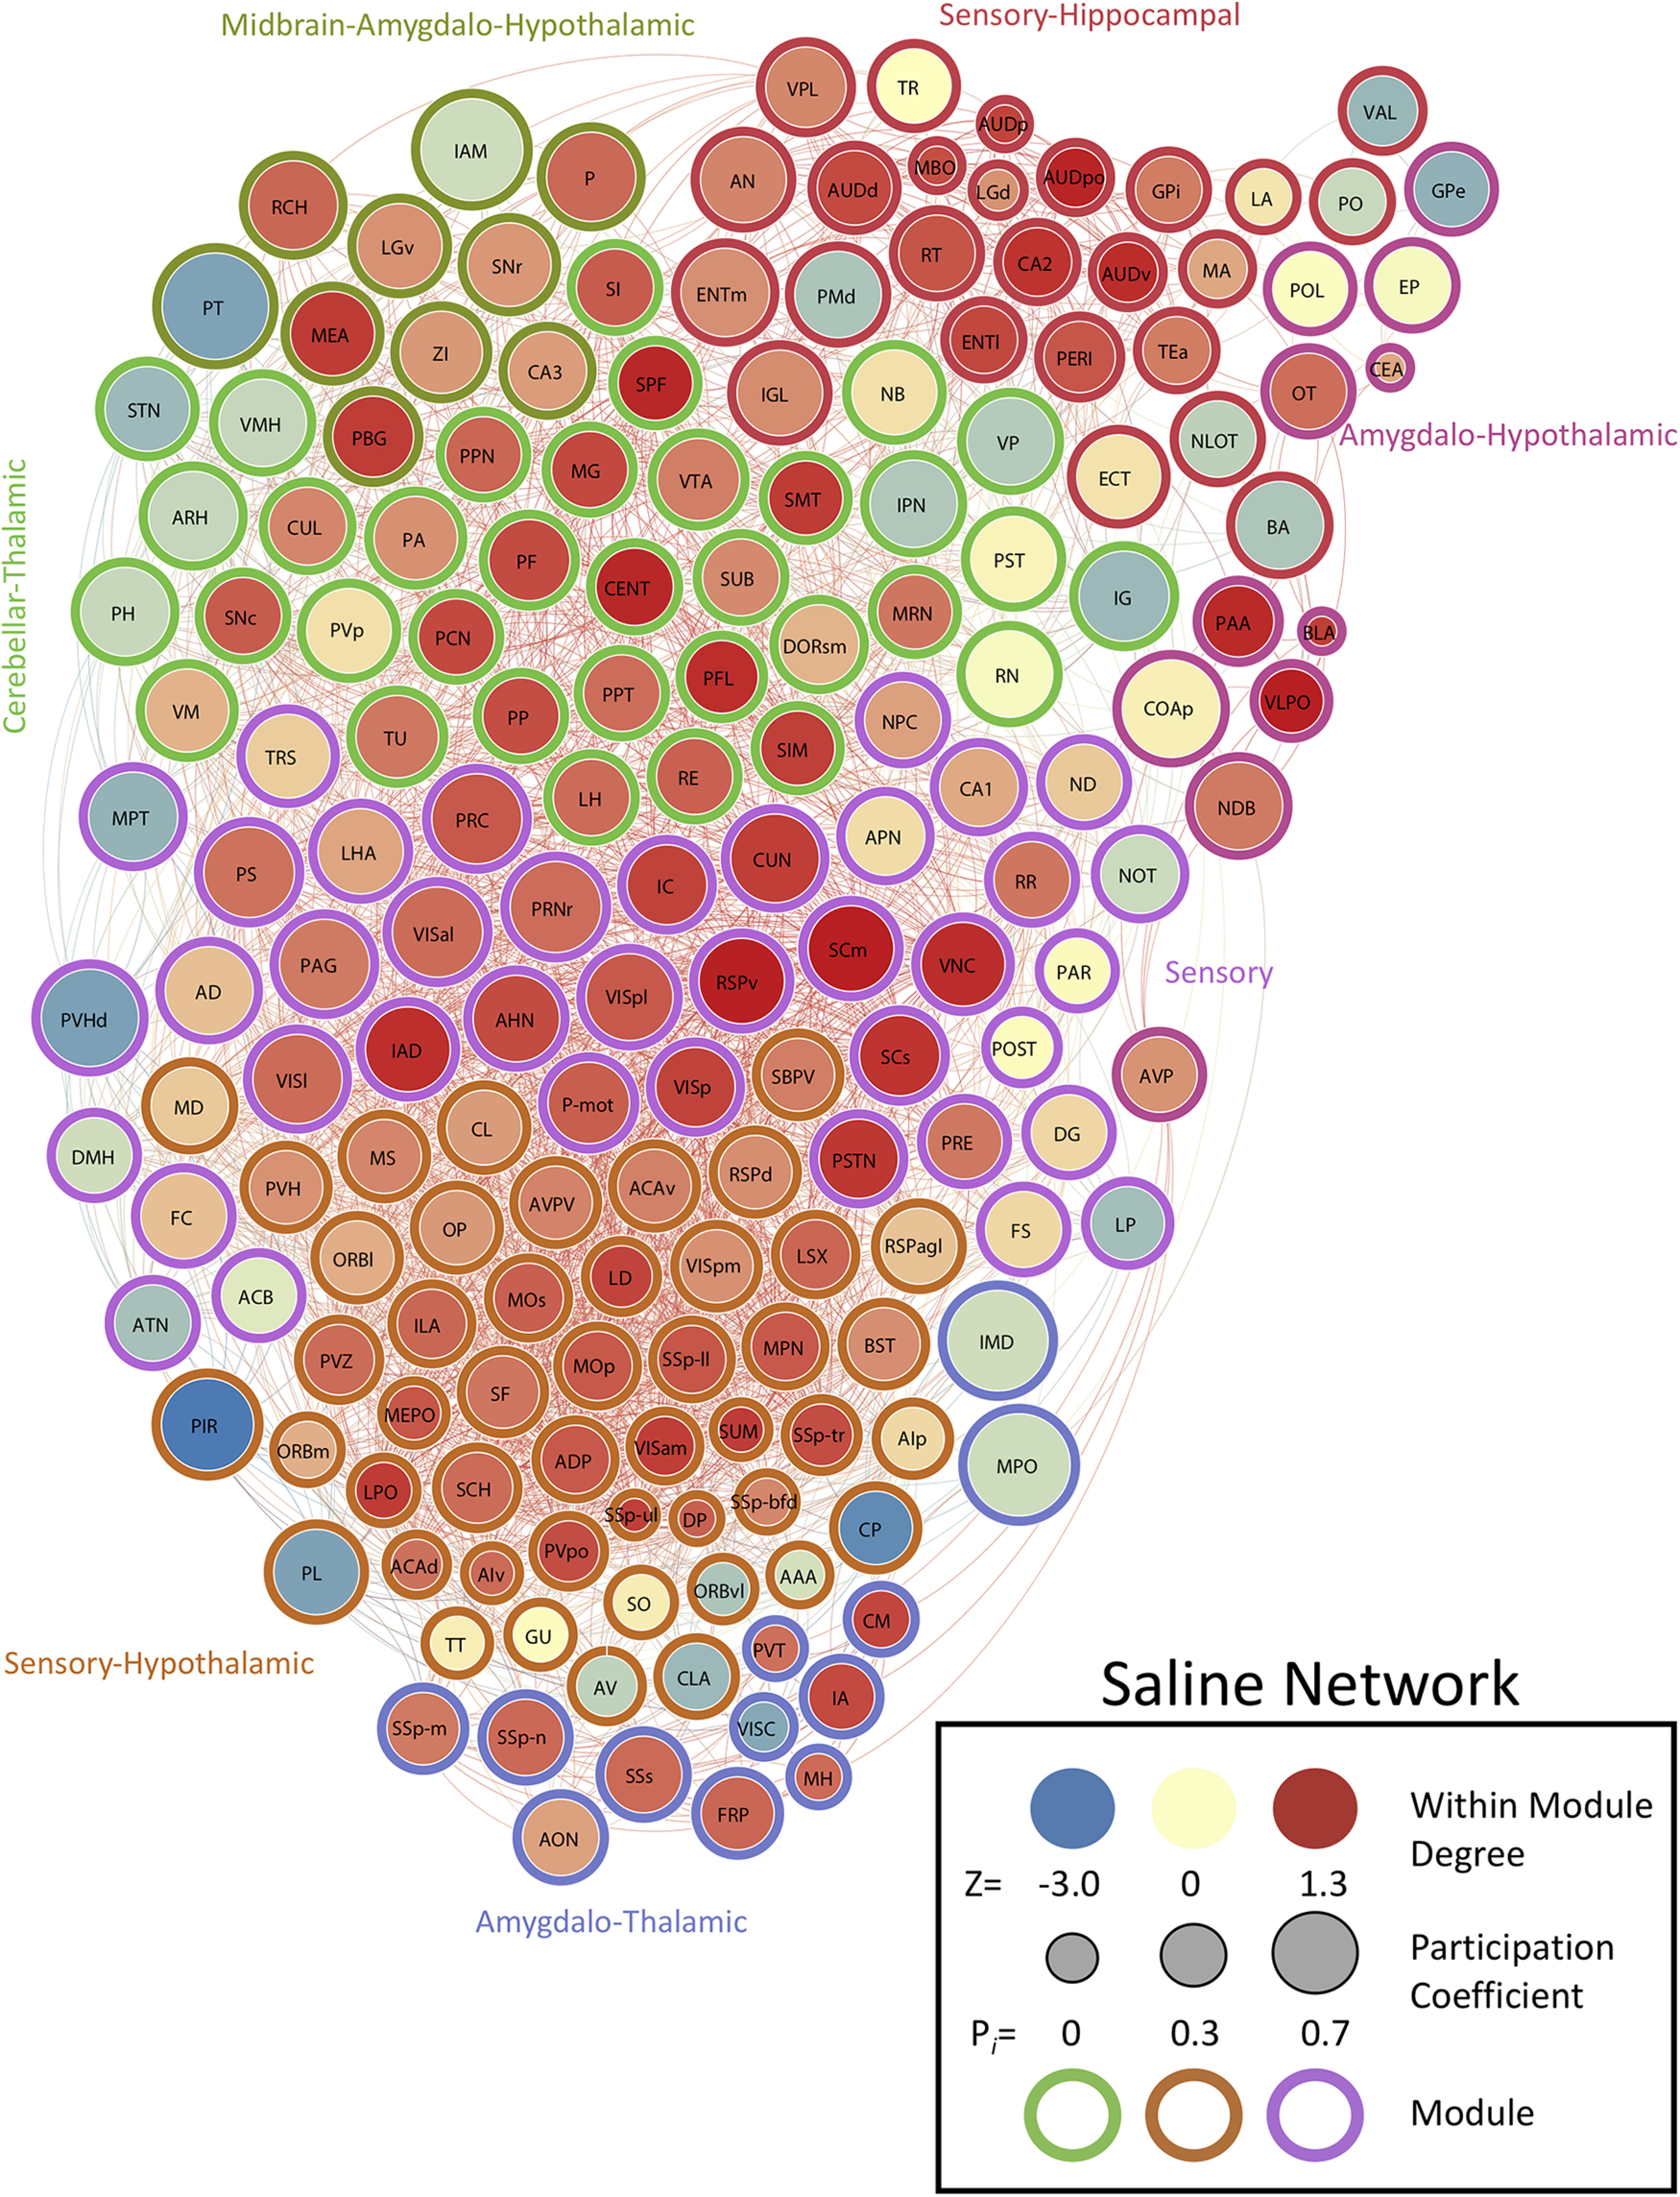
Neural network of control mice thresholded to 0.75R. Nodes/brain regions of the network are represented by circles. The size of the node represents the PC (smaller, lower PC; larger, higher PC). The internal color of each circle represents the WMDz (dark blue, lowest; dark red, highest). The color of the modules that are identified in Figure 1C are represented by different colored edges. See figure key for examples of each representative component of the figure.
Figure 8.
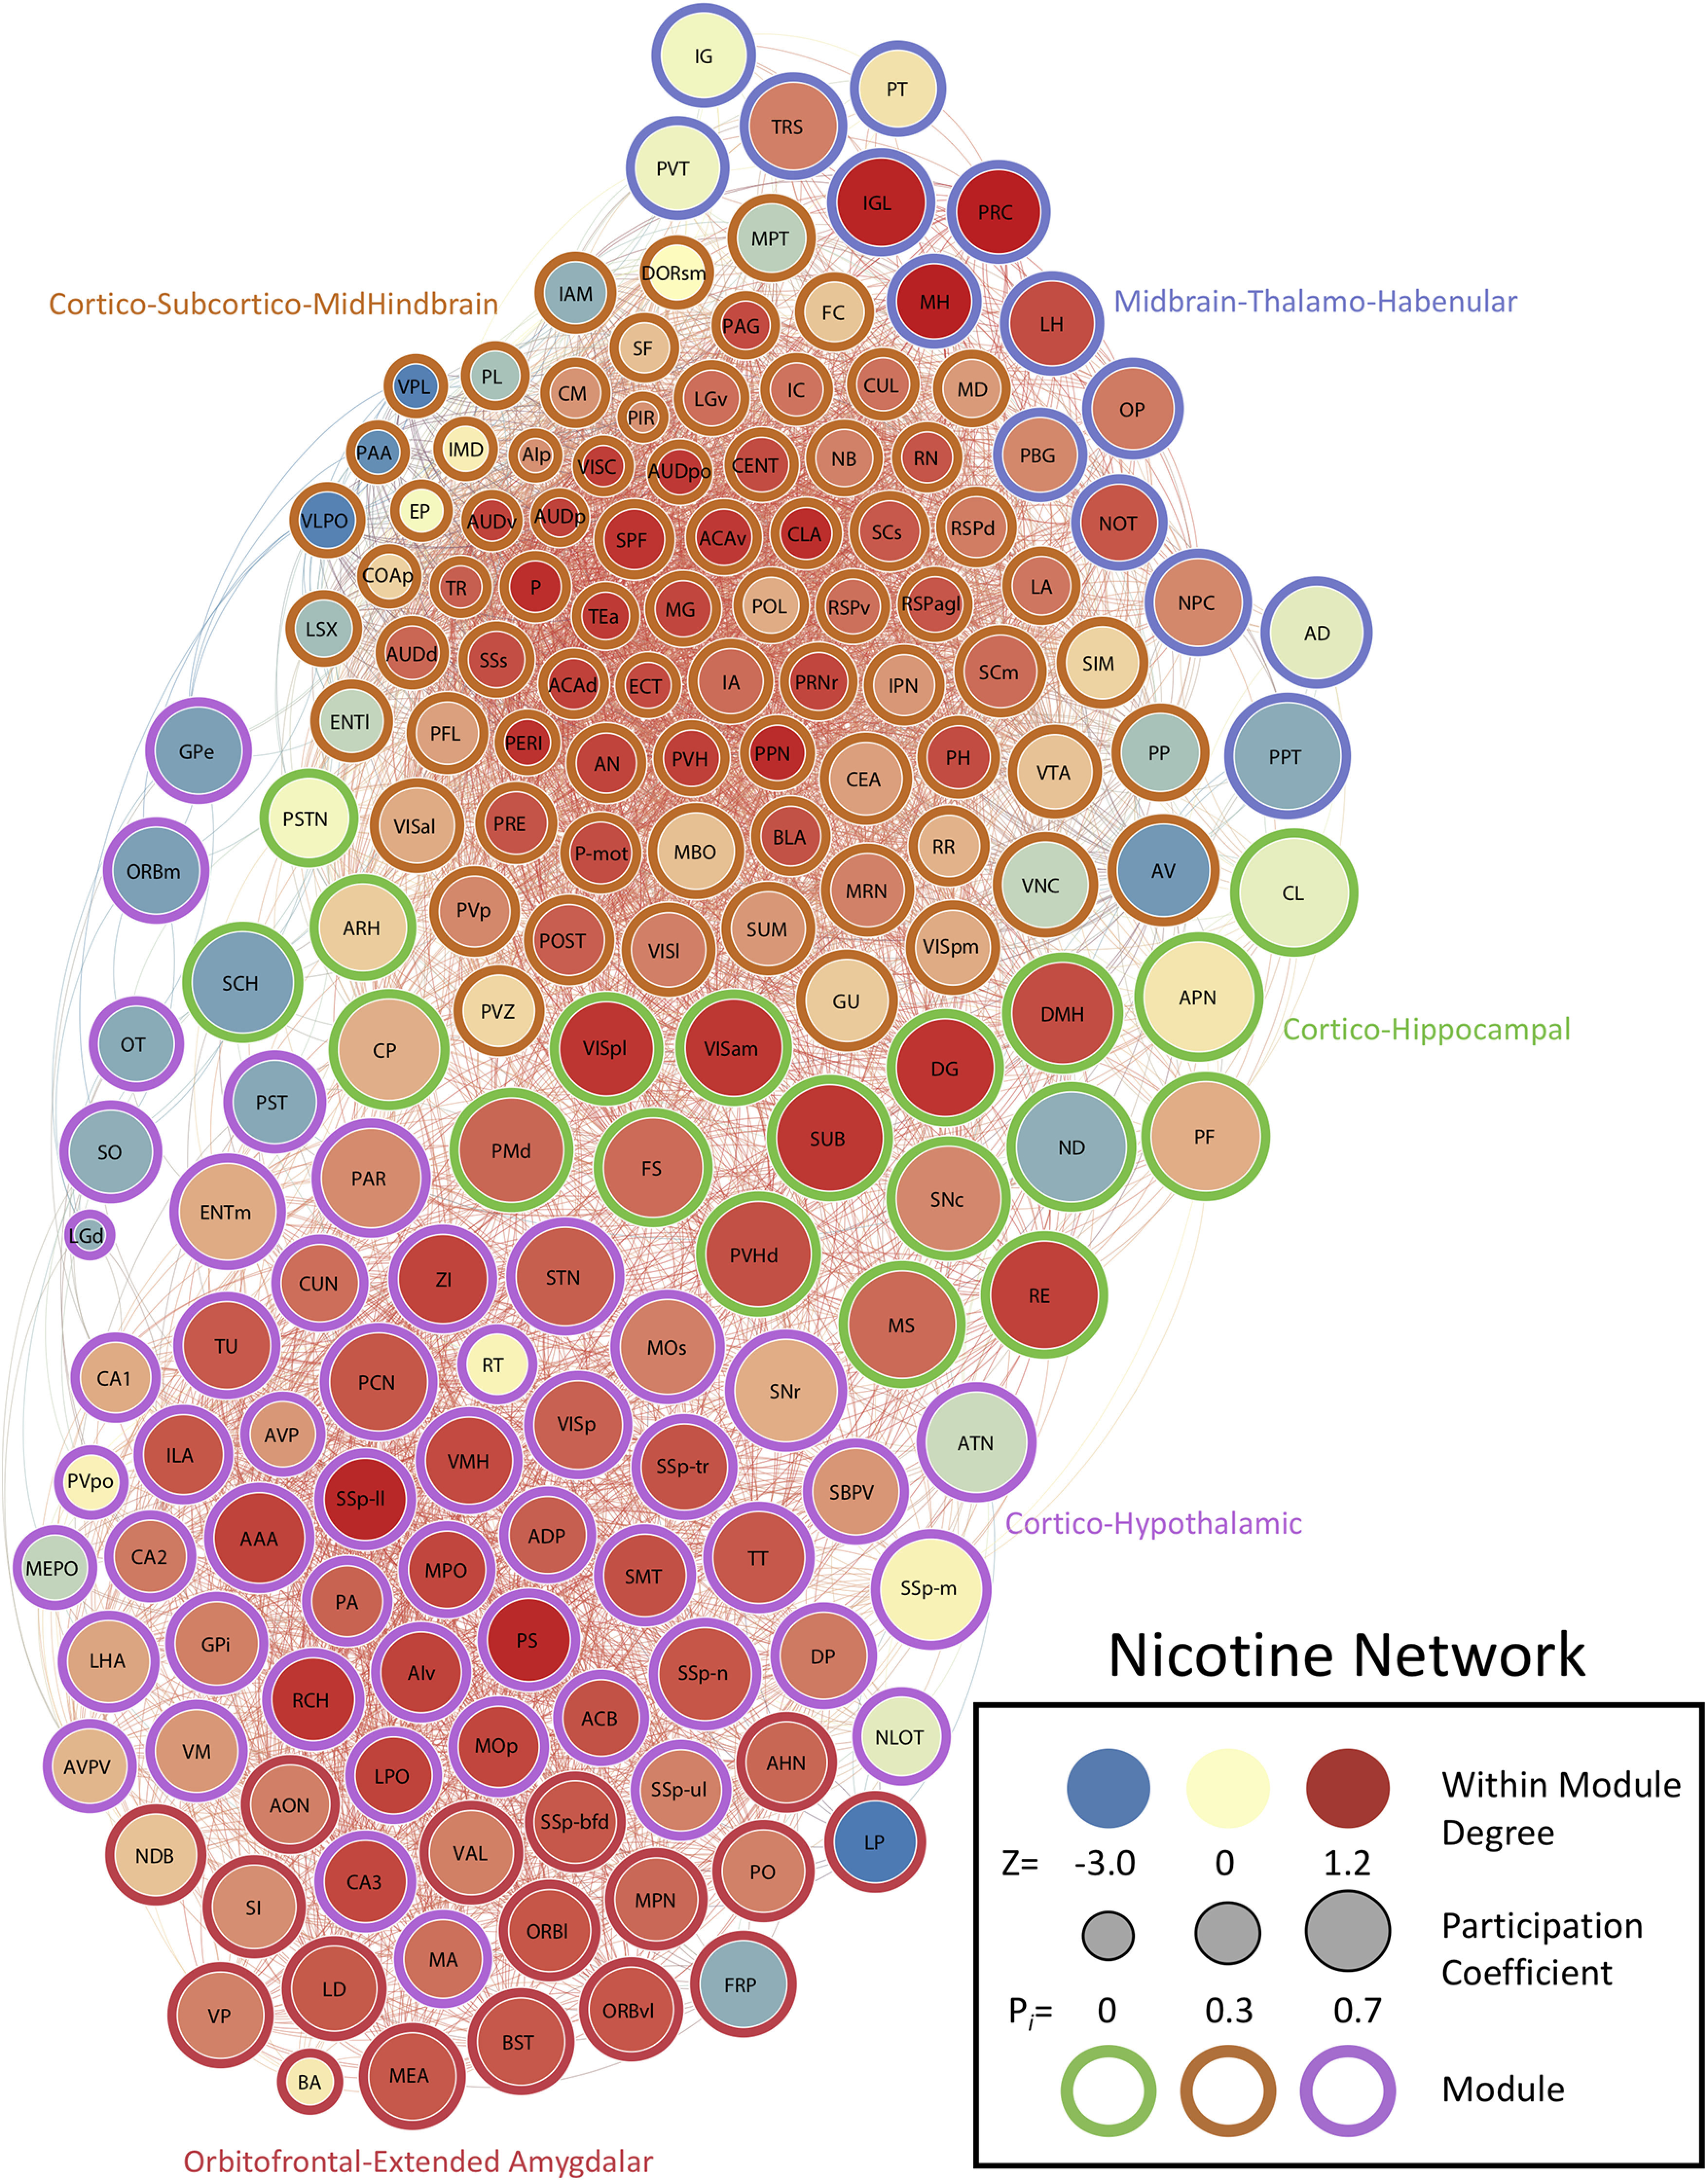
Neural network of nicotine mice during withdrawal thresholded to 0.75R. Nodes/brain regions of the network are represented by circles. The size of the node represents the PC (smaller, lower PC; larger, higher PC). The internal color of each circle represents the WMDz (dark blue, lowest; dark red, highest). The color of the modules that are identified in Figure 1F are represented by different colored edges. See figure key for examples of each representative component of the figure.
Figure 7.
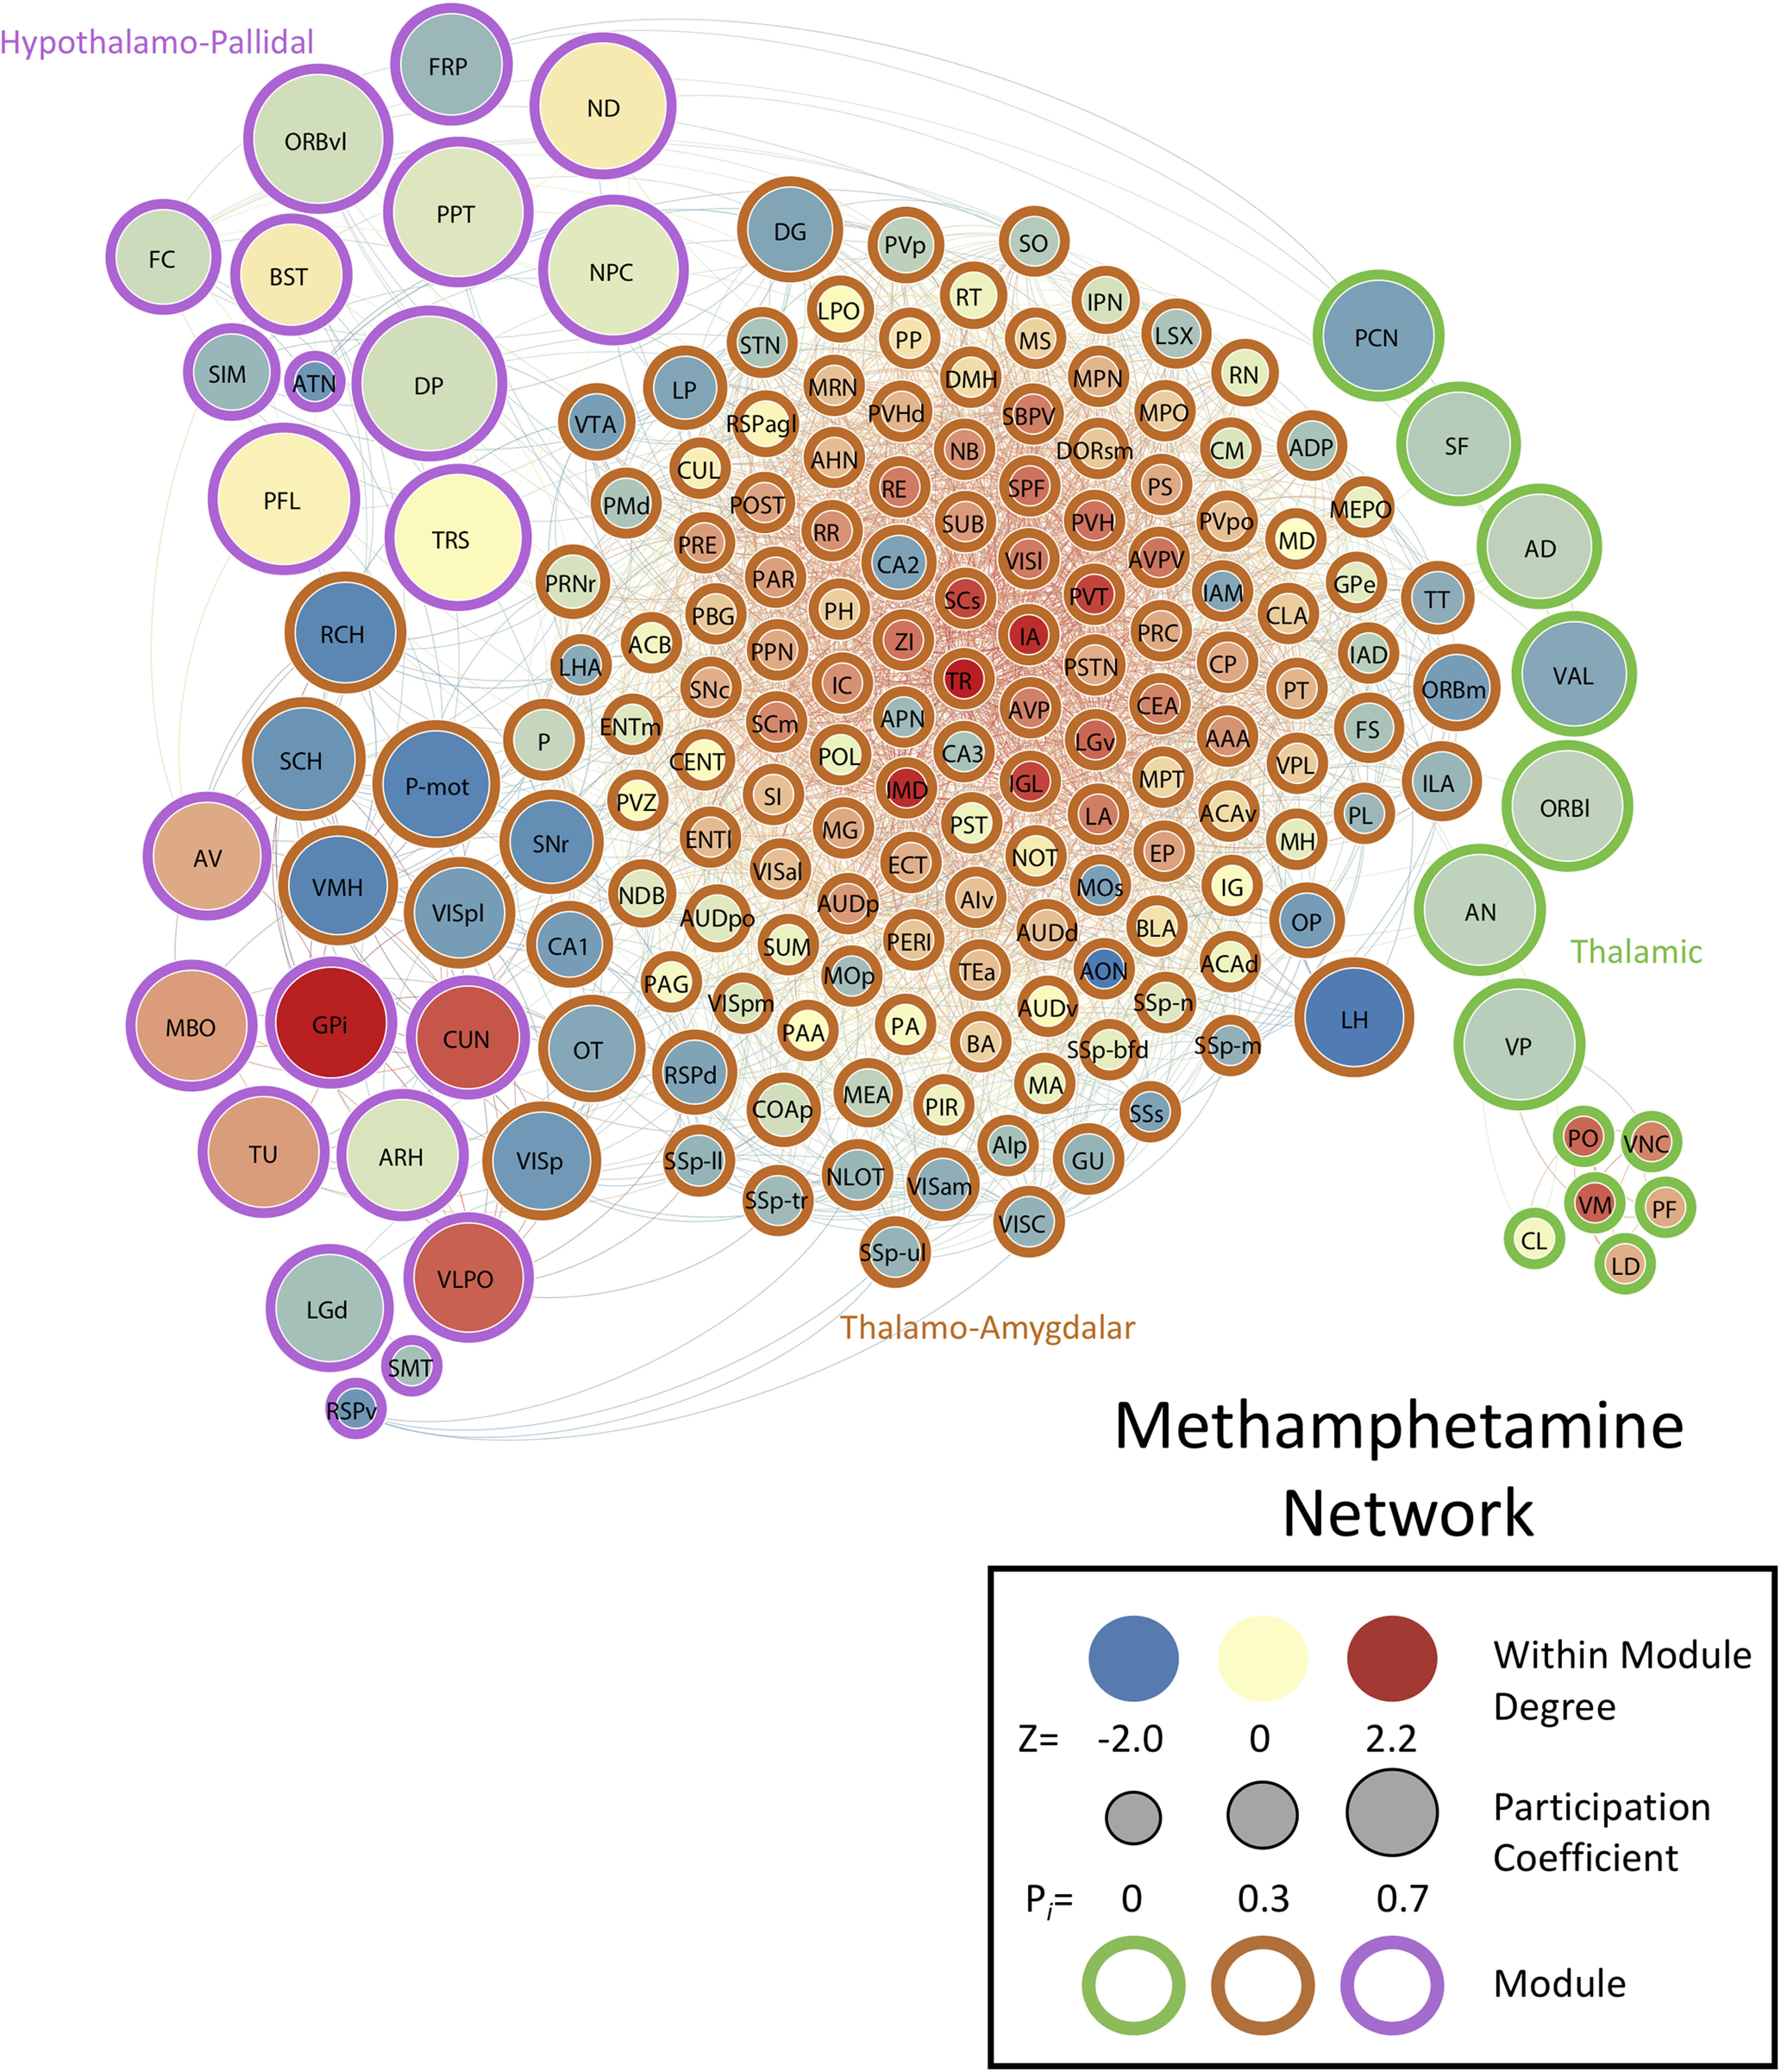
Neural network of methamphetamine mice during withdrawal thresholded to 0.75R. Nodes/brain regions of the network are represented by circles. The size of the node represents the PC (smaller, lower PC; larger, higher PC). The internal color of each circle represents the WMDz (dark blue, lowest; dark red, highest). The color of the modules that are identified in Figure 1E are represented by different colored edges. See figure key for examples of each representative component of the figure.
The control network is driven by sensory-motor regions
The saline control network had 3176 total functional connections and consisted of seven modules, many of which were heavily driven by sensory-motor brain regions. Of these seven modules, five contained several sensory or motor brain regions that were ranked in the top five for intramodular connectivity (high WMDz). In most cases, a separate set of thalamic brain regions was responsible for intermodular connectivity (high PC; see Table 2 for a full list of values for the network). Overall, the control network had more brain regions with high WMDz, high PC, or both in individual modules compared with other networks. This indicates a more interconnected network with more hub regions (Figs. 2, 3).
Table 2.
Saline network values
| Brain region | Module | PC | WMDz |
|---|---|---|---|
| Agranular insular area posterior part | 3 | 0.35 | −0.48 |
| Agranular insular area ventral part | 3 | 0.15 | 0.56 |
| Anterior cingulate area dorsal part | 3 | 0.22 | 0.49 |
| Anterior cingulate area ventral part | 3 | 0.47 | 0.34 |
| Anterior olfactory nucleus | 4 | 0.50 | 0.02 |
| Anterolateral visual area | 1 | 0.65 | 0.53 |
| Anteromedial visual area | 3 | 0.31 | 0.99 |
| Cortical amygdalar area posterior part | 7 | 0.72 | −0.69 |
| Dentate gyrus | 1 | 0.49 | −0.46 |
| Dorsal auditory area | 5 | 0.48 | 0.87 |
| Dorsal peduncular area | 3 | 0.08 | 0.66 |
| Ectorhinal area | 5 | 0.58 | −0.57 |
| Entorhinal area lateral part | 5 | 0.40 | 0.89 |
| Entorhinal area medial part | 5 | 0.63 | 0.20 |
| Fasciola cinerea | 1 | 0.60 | −0.26 |
| Field CA1 | 1 | 0.52 | −0.04 |
| Field CA2 | 5 | 0.41 | 1.11 |
| Field CA3 | 6 | 0.52 | 0.08 |
| Frontal pole cerebral cortex | 4 | 0.46 | 0.59 |
| Gustatory areas | 3 | 0.26 | −0.79 |
| Induseum griseum | 2 | 0.64 | −1.94 |
| Infralimbic area | 3 | 0.42 | 0.59 |
| Lateral visual area | 1 | 0.63 | 0.54 |
| Nucleus of the lateral olfactory tract | 5 | 0.50 | −1.57 |
| Orbital area lateral part | 3 | 0.47 | −0.09 |
| Orbital area medial part | 3 | 0.29 | −0.10 |
| Orbital area ventrolateral part | 3 | 0.25 | −1.76 |
| Parasubiculum | 1 | 0.38 | −0.78 |
| Perirhinal area | 5 | 0.44 | 0.75 |
| Piriform area | 3 | 0.66 | −2.98 |
| Piriform-amygdalar area | 7 | 0.44 | 1.21 |
| Posterior auditory area | 5 | 0.32 | 1.25 |
| Posterolateral visual area | 1 | 0.61 | 0.72 |
| Posteromedial visual area | 3 | 0.46 | 0.19 |
| Postpiriform transition area | 5 | 0.47 | −0.83 |
| Postsubiculum | 1 | 0.34 | −0.78 |
| Prelimbic area | 3 | 0.59 | −2.32 |
| Presubiculum | 1 | 0.49 | 0.42 |
| Primary auditory area | 5 | 0.09 | 0.94 |
| Primary motor area | 3 | 0.42 | 0.73 |
| Primary somatosensory area barrel field | 3 | 0.19 | 0.28 |
| Primary somatosensory area lower limb | 3 | 0.41 | 0.76 |
| Primary somatosensory area mouth | 4 | 0.45 | 0.40 |
| Primary somatosensory area nose | 4 | 0.50 | 0.57 |
| Primary somatosensory area trunk | 3 | 0.34 | 0.84 |
| Primary somatosensory area upper limb | 3 | 0.04 | 0.97 |
| Primary visual area | 1 | 0.53 | 0.94 |
| Retrosplenial area dorsal part | 3 | 0.47 | 0.22 |
| Retrosplenial area lateral agranular part | 3 | 0.49 | −0.27 |
| Retrosplenial area ventral part | 1 | 0.59 | 1.30 |
| Secondary motor area | 3 | 0.42 | 0.65 |
| Subiculum | 2 | 0.50 | 0.25 |
| Supplemental somatosensory area | 4 | 0.50 | 0.56 |
| Taenia tecta | 3 | 0.25 | −0.68 |
| Temporal association areas | 5 | 0.40 | 0.38 |
| Ventral auditory area | 5 | 0.32 | 1.17 |
| Visceral area | 4 | 0.21 | −2.23 |
| Basolateral amygdalar nucleus | 7 | 0.00 | 0.99 |
| Claustrum | 3 | 0.39 | −1.94 |
| Endopiriform nucleus | 7 | 0.50 | −0.93 |
| Lateral amygdalar nucleus | 5 | 0.28 | −0.60 |
| Posterior amygdalar nucleus | 2 | 0.57 | 0.18 |
| Anterior amygdalar area | 3 | 0.21 | −1.32 |
| Bed nucleus of the accessory olfactory tract | 5 | 0.62 | −1.74 |
| Caudoputamen | 3 | 0.46 | −2.69 |
| Central amygdalar nucleus | 7 | 0.00 | −0.01 |
| Fundus of striatum | 1 | 0.49 | −0.47 |
| Intercalated amygdalar nucleus | 4 | 0.39 | 0.87 |
| Lateral septal complex | 3 | 0.43 | 0.60 |
| Medial amygdalar nucleus | 6 | 0.58 | 1.02 |
| Nucleus accumbens | 1 | 0.48 | −1.18 |
| Olfactory tubercle | 7 | 0.50 | 0.51 |
| Septofimbrial nucleus | 3 | 0.46 | 0.44 |
| Bed nuclei of the stria terminalis | 3 | 0.46 | 0.21 |
| Diagonal band nucleus | 7 | 0.62 | 0.39 |
| Globus pallidus external segment | 7 | 0.48 | −2.08 |
| Globus pallidus internal segment | 5 | 0.39 | 0.38 |
| Magnocellular nucleus | 5 | 0.31 | −0.02 |
| Medial septal nucleus | 3 | 0.47 | 0.29 |
| Substantia innominata | 2 | 0.50 | 0.69 |
| Triangular nucleus of septum | 1 | 0.58 | −0.37 |
| Anterior group of the dorsal thalamus | 1 | 0.50 | −1.82 |
| Anterodorsal nucleus | 1 | 0.62 | −0.25 |
| Anteroventral nucleus of thalamus | 3 | 0.33 | −1.54 |
| Central lateral nucleus of the thalamus | 3 | 0.48 | 0.09 |
| Central medial nucleus of the thalamus | 4 | 0.29 | 0.91 |
| Dorsal part of the lateral geniculate complex | 5 | 0.13 | 0.17 |
| Interanterodorsal nucleus of the thalamus | 1 | 0.59 | 1.15 |
| Interanteromedial nucleus of the thalamus | 6 | 0.77 | −1.38 |
| Intergeniculate leaflet of the lateral geniculate complex | 5 | 0.60 | 0.22 |
| Intermediodorsal nucleus of the thalamus | 4 | 0.75 | −1.36 |
| Lateral dorsal nucleus of thalamus | 3 | 0.34 | 0.94 |
| Lateral habenula | 2 | 0.50 | 0.53 |
| Lateral posterior nucleus of the thalamus | 1 | 0.47 | −1.86 |
| Medial geniculate complex | 2 | 0.50 | 0.88 |
| Medial habenula | 4 | 0.18 | 0.55 |
| Mediodorsal nucleus of thalamus | 3 | 0.51 | −0.33 |
| Nucleus of reuniens | 2 | 0.49 | 0.64 |
| Paracentral nucleus | 2 | 0.49 | 0.88 |
| Parafascicular nucleus | 2 | 0.55 | 0.85 |
| Parataenial nucleus | 6 | 0.82 | −2.30 |
| Paraventricular nucleus of the thalamus | 4 | 0.18 | 0.49 |
| Peripeduncular nucleus | 2 | 0.50 | 0.83 |
| Posterior complex of the thalamus | 5 | 0.40 | −1.44 |
| Posterior limiting nucleus of the thalamus | 7 | 0.48 | −0.86 |
| Reticular nucleus of the thalamus | 5 | 0.50 | 0.77 |
| Submedial nucleus of the thalamus | 2 | 0.47 | 1.02 |
| Subparafascicular nucleus | 2 | 0.48 | 1.22 |
| Thalamus sensory-motor cortex related | 2 | 0.53 | −0.14 |
| Ventral anterior-lateral complex of the thalamus | 5 | 0.43 | −1.98 |
| Ventral medial nucleus of the thalamus | 2 | 0.57 | −0.13 |
| Ventral part of the lateral geniculate complex | 6 | 0.59 | 0.18 |
| Ventral posterior complex of the thalamus | 2 | 0.61 | −1.67 |
| Ventral posterolateral nucleus of the thalamus | 5 | 0.54 | 0.28 |
| Anterior hypothalamic nucleus | 1 | 0.61 | 0.85 |
| Anterodorsal preoptic nucleus | 3 | 0.41 | 0.72 |
| Anteroventral periventricular nucleus | 3 | 0.46 | 0.32 |
| Anteroventral preoptic nucleus | 7 | 0.49 | 0.16 |
| Arcuate hypothalamic nucleus | 2 | 0.63 | −1.47 |
| Dorsal premammillary nucleus | 5 | 0.60 | −1.76 |
| Dorsomedial nucleus of the hypothalamus | 1 | 0.49 | −1.35 |
| Lateral hypothalamic area | 1 | 0.59 | −0.01 |
| Lateral preoptic area | 3 | 0.28 | 1.02 |
| Mammillary body | 5 | 0.10 | 0.84 |
| Medial preoptic area | 4 | 0.77 | −1.38 |
| Medial preoptic nucleus | 3 | 0.41 | 0.72 |
| Median preoptic nucleus | 3 | 0.26 | 0.76 |
| Parastrial nucleus | 1 | 0.65 | 0.47 |
| Parasubthalamic nucleus | 1 | 0.53 | 1.06 |
| Paraventricular hypothalamic nucleus | 3 | 0.46 | 0.18 |
| Paraventricular hypothalamic nucleus descending division | 1 | 0.72 | −2.34 |
| Periventricular hypothalamic nucleus posterior part | 2 | 0.58 | −0.54 |
| Periventricular hypothalamic nucleus preoptic part | 3 | 0.33 | 0.84 |
| Periventricular zone | 3 | 0.43 | 0.53 |
| Posterior hypothalamic nucleus | 2 | 0.63 | −1.46 |
| Preparasubthalamic nucleus | 2 | 0.59 | −0.72 |
| Retrochiasmatic area | 6 | 0.63 | 0.59 |
| Subparaventricular zone | 3 | 0.46 | 0.36 |
| Subthalamic nucleus | 2 | 0.58 | −1.93 |
| Suprachiasmatic nucleus | 3 | 0.44 | 0.53 |
| Supramammillary nucleus | 3 | 0.16 | 1.01 |
| Supraoptic nucleus | 3 | 0.28 | −0.67 |
| Tuberal nucleus | 2 | 0.56 | 0.42 |
| Ventrolateral preoptic nucleus | 7 | 0.36 | 1.31 |
| Ventromedial hypothalamic nucleus | 2 | 0.61 | −1.47 |
| Zona incerta | 6 | 0.56 | 0.11 |
| Anterior pretectal nucleus | 1 | 0.52 | −0.52 |
| Cuneiform nucleus | 1 | 0.63 | 0.99 |
| Inferior colliculus | 1 | 0.53 | 0.95 |
| Interpeduncular nucleus | 2 | 0.61 | −1.72 |
| Medial pretectal area | 1 | 0.63 | −2.05 |
| Midbrain reticular nucleus | 2 | 0.48 | 0.43 |
| Midbrain reticular nucleus retrorubral area | 1 | 0.50 | 0.44 |
| Nucleus of Darkschewitsch | 1 | 0.49 | −0.33 |
| Nucleus of the brachium of the inferior colliculus | 2 | 0.59 | −0.55 |
| Nucleus of the optic tract | 1 | 0.52 | −1.41 |
| Nucleus of the posterior commissure | 1 | 0.50 | 0.04 |
| Olivary pretectal nucleus | 3 | 0.47 | 0.12 |
| Parabigeminal nucleus | 6 | 0.54 | 1.00 |
| Pedunculopontine nucleus | 2 | 0.49 | 0.60 |
| Periaqueductal gray | 1 | 0.64 | 0.39 |
| Posterior pretectal nucleus | 2 | 0.50 | 0.52 |
| Precommissural nucleus | 1 | 0.64 | 0.72 |
| Red nucleus | 2 | 0.60 | −0.92 |
| Substantia nigra compact part | 2 | 0.50 | 0.69 |
| Substantia nigra reticular part | 6 | 0.57 | 0.13 |
| Superior colliculus motor related | 1 | 0.60 | 1.32 |
| Superior colliculus sensory related | 1 | 0.54 | 1.10 |
| Ventral tegmental area | 2 | 0.56 | 0.37 |
| Pons | 6 | 0.63 | 0.57 |
| Pons motor related | 1 | 0.55 | 0.67 |
| Pontine reticular nucleus | 1 | 0.65 | 0.52 |
| Vestibular nuclei | 1 | 0.58 | 1.16 |
| Ansiform lobule | 5 | 0.60 | 0.30 |
| Central lobule | 2 | 0.51 | 1.22 |
| Culmen | 2 | 0.51 | 0.28 |
| Paraflocculus | 2 | 0.46 | 1.16 |
| Simple lobule | 2 | 0.47 | 0.98 |
The cocaine withdrawal network is driven by cortico-thalamo-hypothalamic regions
The cocaine network had 7127 total functional connections and consisted of four modules, one with the majority of all brain regions and three others with a small subset of regions. In the large module (module 1; 144 brain regions), nearly one-third (32%) of the total brain regions within the module (i.e., a mixed set of midbrain-cortico-thalamic-hypothalamic-amygdalar brain regions) had high WMDz. The brain regions that drive intramodular connectivity (high WMDz) in this module did not have any intermodular connectivity (PC). Interestingly, only three brain regions in this module (subparaventricular zone, lateral posterior nucleus of the thalamus, and frontal pole cerebral cortex) reached the criterion (PC ≥ 0.30) for a high level of intermodular connectivity, suggesting sparse communication with other modules.
One of the smaller modules, a septal (triangular nucleus of the septum) and cortical (e.g., secondary motor area and dorsal anterior cingulate area) module (module 3) had a different set of thalamic brain regions that had high PC. The other two smaller modules, a prefrontal-habenular module [module 4; dorsal peduncular area (DP), induseum griseum, and lateral habenula] and a thalamic (parafascicular nucleus, mediodorsal nucleus of the thalamus, and ventral medial nucleus of the thalamus), midbrain (nucleus of the posterior commissure), and striatal (bed nucleus of the accessory olfactory tract) module (module 2) contained regions with both a high WMDz and high PC, suggesting that these regions may be potential hubs within the network. Overall, the cocaine network contained the highest number of functional connections in any network but had minimal interconnection between modules (Figs. 2, 4; see Table 3 for a full list of values for the network).
Table 3.
Cocaine network values
| Brain region | Module | PC | WMDz |
|---|---|---|---|
| Agranular insular area posterior part | 1 | 0.07 | −0.69 |
| Agranular insular area ventral part | 1 | 0.22 | −0.76 |
| Anterior cingulate area dorsal part | 3 | 0.34 | 0.93 |
| Anterior cingulate area ventral part | 1 | 0.21 | −0.30 |
| Anterior olfactory nucleus | 3 | 0.41 | −0.32 |
| Anterolateral visual area | 1 | 0.09 | 0.74 |
| Anteromedial visual area | 1 | 0.05 | 0.80 |
| Cortical amygdalar area posterior part | 1 | 0.16 | −0.72 |
| Dentate gyrus | 1 | 0.02 | 0.36 |
| Dorsal auditory area | 1 | 0.05 | 0.35 |
| Dorsal peduncular area | 4 | 0.32 | 0.71 |
| Ectorhinal area | 1 | 0.01 | 1.37 |
| Entorhinal area lateral part | 1 | 0.04 | 1.05 |
| Entorhinal area medial part | 1 | 0.17 | −0.58 |
| Fasciola cinerea | 3 | 0.47 | −0.19 |
| Field CA1 | 1 | 0.02 | 0.71 |
| Field CA2 | 1 | 0.02 | −0.11 |
| Field CA3 | 1 | 0.05 | 0.89 |
| Frontal pole cerebral cortex | 1 | 0.32 | −1.86 |
| Gustatory areas | 1 | 0.21 | −0.85 |
| Induseum griseum | 4 | 0.55 | 0.71 |
| Infralimbic area | 1 | 0.25 | −1.28 |
| Lateral visual area | 1 | 0.00 | 1.11 |
| Nucleus of the lateral olfactory tract | 1 | 0.18 | −0.41 |
| Orbital area lateral part | 1 | 0.10 | 0.66 |
| Orbital area medial part | 1 | 0.07 | 0.39 |
| Orbital area ventrolateral part | 1 | 0.04 | 1.10 |
| Parasubiculum | 2 | 0.53 | −0.16 |
| Perirhinal area | 1 | 0.05 | 0.61 |
| Piriform area | 1 | 0.00 | 0.47 |
| Piriform-amygdalar area | 1 | 0.17 | −0.63 |
| Posterior auditory area | 1 | 0.07 | 0.11 |
| Posterolateral visual area | 1 | 0.00 | 1.58 |
| Posteromedial visual area | 1 | 0.13 | −1.88 |
| Postpiriform transition area | 1 | 0.10 | 0.52 |
| Postsubiculum | 2 | 0.60 | −0.47 |
| Prelimbic area | 1 | 0.23 | −1.08 |
| Presubiculum | 1 | 0.28 | −1.55 |
| Primary auditory area | 1 | 0.00 | 1.19 |
| Primary motor area | 1 | 0.12 | 0.37 |
| Primary somatosensory area barrel field | 1 | 0.07 | 0.31 |
| Primary somatosensory area lower limb | 1 | 0.19 | −0.44 |
| Primary somatosensory area mouth | 3 | 0.29 | 0.47 |
| Primary somatosensory area nose | 3 | 0.25 | −0.72 |
| Primary somatosensory area trunk | 1 | 0.02 | 1.01 |
| Primary somatosensory area upper limb | 1 | 0.16 | 0.07 |
| Primary visual area | 1 | 0.06 | 0.92 |
| Retrosplenial area dorsal part | 1 | 0.02 | 0.80 |
| Retrosplenial area lateral agranular part | 1 | 0.00 | 1.32 |
| Retrosplenial area ventral part | 2 | 0.17 | −0.53 |
| Secondary motor area | 3 | 0.32 | 0.95 |
| Subiculum | 1 | 0.22 | −0.86 |
| Supplemental somatosensory area | 1 | 0.14 | −1.08 |
| Taenia tecta | 1 | 0.13 | −0.63 |
| Temporal association areas | 1 | 0.01 | 1.19 |
| Ventral auditory area | 1 | 0.02 | 0.81 |
| Visceral area | 1 | 0.12 | −0.03 |
| Basolateral amygdalar nucleus | 1 | 0.03 | 0.83 |
| Claustrum | 1 | 0.08 | −0.82 |
| Endopiriform nucleus | 1 | 0.00 | 1.06 |
| Lateral amygdalar nucleus | 1 | 0.07 | −0.35 |
| Posterior amygdalar nucleus | 1 | 0.14 | −0.55 |
| Anterior amygdalar area | 1 | 0.00 | 0.83 |
| Bed nucleus of the accessory olfactory tract | 2 | 0.42 | 0.84 |
| Caudoputamen | 1 | 0.27 | −1.88 |
| Central amygdalar nucleus | 1 | 0.06 | 0.13 |
| Fundus of striatum | 1 | 0.19 | −1.88 |
| Intercalated amygdalar nucleus | 1 | 0.03 | 0.97 |
| Lateral septal complex | 1 | 0.20 | −0.72 |
| Medial amygdalar nucleus | 1 | 0.24 | −1.74 |
| Nucleus accumbens | 1 | 0.15 | 0.13 |
| Olfactory tubercle | 1 | 0.00 | 1.23 |
| Septofimbrial nucleus | 1 | 0.17 | −0.31 |
| Bed nuclei of the stria terminalis | 1 | 0.11 | 0.91 |
| Diagonal band nucleus | 1 | 0.17 | −1.14 |
| Globus pallidus external segment | 1 | 0.28 | −1.46 |
| Globus pallidus internal segment | 1 | 0.18 | −1.30 |
| Magnocellular nucleus | 1 | 0.12 | 0.87 |
| Medial septal nucleus | 1 | 0.21 | −1.35 |
| Substantia innominata | 1 | 0.00 | 0.95 |
| Triangular nucleus of septum | 3 | 0.34 | 1.31 |
| Anterior group of the dorsal thalamus | 2 | 0.38 | 1.78 |
| Anterodorsal nucleus | 3 | 0.48 | −2.30 |
| Anteroventral nucleus of thalamus | 3 | 0.29 | 0.00 |
| Central lateral nucleus of the thalamus | 1 | 0.13 | −1.96 |
| Central medial nucleus of the thalamus | 1 | 0.16 | −0.82 |
| Dorsal part of the lateral geniculate complex | 1 | 0.03 | 1.01 |
| Interanterodorsal nucleus of the thalamus | 1 | 0.11 | −0.89 |
| Interanteromedial nucleus of the thalamus | 1 | 0.00 | 0.42 |
| Intergeniculate leaflet of the lateral geniculate complex | 1 | 0.12 | −0.18 |
| Intermediodorsal nucleus of the thalamus | 3 | 0.36 | −1.56 |
| Lateral dorsal nucleus of thalamus | 1 | 0.12 | 0.47 |
| Lateral habenula | 4 | 0.00 | −1.41 |
| Lateral posterior nucleus of the thalamus | 1 | 0.32 | −2.30 |
| Medial geniculate complex | 1 | 0.10 | −0.86 |
| Medial habenula | 3 | 0.47 | 0.46 |
| Mediodorsal nucleus of thalamus | 2 | 0.55 | 0.82 |
| Nucleus of reuniens | 1 | 0.19 | −2.35 |
| Paracentral nucleus | 1 | 0.16 | −1.09 |
| Parafascicular nucleus | 2 | 0.45 | 0.18 |
| Parataenial nucleus | 2 | 0.24 | −0.20 |
| Paraventricular nucleus of the thalamus | 1 | 0.00 | 1.09 |
| Peripeduncular nucleus | 1 | 0.03 | −0.79 |
| Posterior complex of the thalamus | 1 | 0.03 | 0.85 |
| Posterior limiting nucleus of the thalamus | 1 | 0.02 | −0.23 |
| Reticular nucleus of the thalamus | 1 | 0.17 | −1.27 |
| Submedial nucleus of the thalamus | 1 | 0.15 | 0.50 |
| Subparafascicular nucleus | 1 | 0.12 | 0.33 |
| Thalamus sensory-motor cortex related | 1 | 0.07 | 0.30 |
| Ventral anterior-lateral complex of the thalamus | 1 | 0.13 | −0.70 |
| Ventral medial nucleus of the thalamus | 2 | 0.66 | −0.94 |
| Ventral part of the lateral geniculate complex | 1 | 0.11 | −0.02 |
| Ventral posterior complex of the thalamus | 1 | 0.07 | −0.50 |
| Ventral posterolateral nucleus of the thalamus | 2 | 0.40 | −1.10 |
| Anterior hypothalamic nucleus | 1 | 0.06 | 1.22 |
| Anterodorsal preoptic nucleus | 1 | 0.00 | 1.28 |
| Anteroventral periventricular nucleus | 2 | 0.54 | 1.62 |
| Anteroventral preoptic nucleus | 2 | 0.52 | 1.08 |
| Arcuate hypothalamic nucleus | 1 | 0.17 | −0.98 |
| Dorsal premammillary nucleus | 1 | 0.06 | 1.26 |
| Dorsomedial nucleus of the hypothalamus | 1 | 0.21 | −0.49 |
| Lateral hypothalamic area | 1 | 0.07 | 0.67 |
| Lateral preoptic area | 1 | 0.10 | 0.53 |
| Mammillary body | 1 | 0.22 | −1.28 |
| Medial preoptic area | 1 | 0.02 | 0.83 |
| Medial preoptic nucleus | 1 | 0.15 | −1.12 |
| Median preoptic nucleus | 1 | 0.13 | −1.07 |
| Parastrial nucleus | 1 | 0.02 | 0.96 |
| Parasubthalamic nucleus | 1 | 0.10 | 0.97 |
| Paraventricular hypothalamic nucleus | 1 | 0.22 | −0.40 |
| Paraventricular hypothalamic nucleus descending division | 1 | 0.13 | 0.22 |
| Periventricular hypothalamic nucleus posterior part | 1 | 0.24 | −1.54 |
| Periventricular hypothalamic nucleus preoptic part | 1 | 0.25 | −0.91 |
| Periventricular zone | 3 | 0.38 | 0.12 |
| Posterior hypothalamic nucleus | 1 | 0.04 | 1.47 |
| Preparasubthalamic nucleus | 1 | 0.06 | −0.14 |
| Retrochiasmatic area | 1 | 0.06 | 0.70 |
| Subparaventricular zone | 1 | 0.30 | −1.46 |
| Subthalamic nucleus | 2 | 0.48 | −0.73 |
| Suprachiasmatic nucleus | 1 | 0.12 | −0.77 |
| Supramammillary nucleus | 1 | 0.06 | 0.69 |
| Supraoptic nucleus | 1 | 0.00 | 1.32 |
| Tuberal nucleus | 1 | 0.00 | 1.40 |
| Ventrolateral preoptic nucleus | 1 | 0.07 | −1.56 |
| Ventromedial hypothalamic nucleus | 1 | 0.13 | 0.16 |
| Zona incerta | 1 | 0.11 | −0.75 |
| Anterior pretectal nucleus | 1 | 0.10 | −0.21 |
| Cuneiform nucleus | 1 | 0.00 | 1.54 |
| Inferior colliculus | 1 | 0.03 | 0.94 |
| Interpeduncular nucleus | 1 | 0.06 | −0.20 |
| Medial pretectal area | 3 | 0.30 | 0.84 |
| Midbrain reticular nucleus | 1 | 0.00 | 1.08 |
| Midbrain reticular nucleus retrorubral area | 1 | 0.09 | 1.03 |
| Nucleus of Darkschewitsch | 1 | 0.05 | −0.40 |
| Nucleus of the brachium of the inferior colliculus | 1 | 0.00 | 1.60 |
| Nucleus of the optic tract | 1 | 0.07 | 0.98 |
| Nucleus of the posterior commissure | 2 | 0.36 | 0.33 |
| Olivary pretectal nucleus | 1 | 0.21 | −0.61 |
| Parabigeminal nucleus | 1 | 0.09 | 0.20 |
| Pedunculopontine nucleus | 1 | 0.05 | 0.90 |
| Periaqueductal gray | 1 | 0.12 | 0.70 |
| Posterior pretectal nucleus | 1 | 0.06 | −1.07 |
| Precommissural nucleus | 2 | 0.24 | −0.50 |
| Red nucleus | 1 | 0.01 | 1.32 |
| Substantia nigra compact part | 1 | 0.01 | 1.18 |
| Substantia nigra reticular part | 1 | 0.00 | 1.23 |
| Superior colliculus motor related | 1 | 0.11 | 0.71 |
| Superior colliculus sensory related | 1 | 0.11 | −0.05 |
| Ventral tegmental area | 1 | 0.11 | 0.26 |
| Pons | 1 | 0.01 | 1.03 |
| Pons motor related | 1 | 0.21 | −1.09 |
| Pontine reticular nucleus | 1 | 0.02 | 0.98 |
| Vestibular nuclei | 2 | 0.19 | −2.26 |
| Ansiform lobule | 1 | 0.15 | −1.44 |
| Central lobule | 1 | 0.20 | −0.79 |
| Culmen | 2 | 0.56 | 0.82 |
| Paraflocculus | 1 | 0.17 | −1.50 |
| Simple lobule | 2 | 0.41 | −0.57 |
The methamphetamine withdrawal network is driven by thalamic regions
The methamphetamine network had 3182 functional connections and consisted of three modules, one with the majority of all brain regions and two others with a small subset of regions. In the large module (module 1), a group of thalamic (e.g., intermediodorsal nucleus of the thalamus, paraventricular nucleus of the thalamus, intergeniculate leaflet of the lateral geniculate complex, and ventral part of the lateral geniculate complex) and amygdalar (intercalated amygdala, central amygdala, and lateral amygdala) regions had high WMDz, but these brain regions did not have any intermodular connectivity (PC), and a separate set of hypothalamic, cortical, and mid/hindbrain regions was responsible for intermodular connectivity.
The second module (module 2) had several hypothalamic (e.g., mammillary body, ventrolateral preoptic nucleus, and tuberal nucleus) and pallidal (globus pallidus and internal segment) brain regions with high WMDz and a separate set of cortical regions (e.g., DP and orbital area, ventral part) and midbrain regions (e.g., posterior pretectal nucleus, nucleus of the posterior commissure, and nucleus of Darkschewitsch) that had high interconnectivity with other modules (high PC).
The third module (module 3), a thalamic module, had several thalamic regions with high WMDz (e.g., ventral medial nucleus of the thalamus, posterior complex of the thalamus, parafascicular nucleus, and lateral dorsal nucleus of the thalamus). Interestingly, within this module, a separate set of thalamic regions (e.g., paracentral nucleus, ventral anterior-lateral complex of the thalamus, ventral posterior complex of the thalamus, and anterodorsal nucleus) had high PC, indicating that this module is internally directed by thalamic regions and also externally communicates through these regions. Overall, the methamphetamine network had a similar number of total connections to the control network, but it had minimal interconnections between modules (Figs. 2, 5; see Table 4 for a full list of values for the network).
Table 4.
Methamphetamine network values
| Brain region | Module | PC | WMDz |
|---|---|---|---|
| Agranular insular area posterior part | 1 | 0.00 | −0.90 |
| Agranular insular area ventral part | 1 | 0.00 | 0.64 |
| Anterior cingulate area dorsal part | 1 | 0.00 | −0.08 |
| Anterior cingulate area ventral part | 1 | 0.00 | 0.41 |
| Anterior olfactory nucleus | 1 | 0.00 | −2.01 |
| Anterolateral visual area | 1 | 0.00 | 0.65 |
| Anteromedial visual area | 1 | 0.08 | −1.15 |
| Cortical amygdalar area posterior part | 1 | 0.09 | −0.41 |
| Dentate gyrus | 1 | 0.32 | −1.31 |
| Dorsal auditory area | 1 | 0.00 | 0.67 |
| Dorsal peduncular area | 2 | 0.67 | −0.41 |
| Ectorhinal area | 1 | 0.00 | 0.81 |
| Entorhinal area lateral part | 1 | 0.00 | 0.70 |
| Entorhinal area medial part | 1 | 0.00 | −0.26 |
| Fasciola cinerea | 2 | 0.38 | −0.46 |
| Field CA1 | 1 | 0.18 | −1.45 |
| Field CA2 | 1 | 0.10 | −1.36 |
| Field CA3 | 1 | 0.00 | −0.84 |
| Frontal pole cerebral cortex | 2 | 0.43 | −1.01 |
| Gustatory areas | 1 | 0.07 | −1.09 |
| Induseum griseum | 1 | 0.00 | 0.05 |
| Infralimbic area | 1 | 0.13 | −1.04 |
| Lateral visual area | 1 | 0.00 | 1.30 |
| Nucleus of the lateral olfactory tract | 1 | 0.07 | −1.03 |
| Orbital area lateral part | 3 | 0.50 | −0.59 |
| Orbital area medial part | 1 | 0.18 | −1.44 |
| Orbital area ventrolateral part | 2 | 0.63 | −0.41 |
| Parasubiculum | 1 | 0.00 | 0.95 |
| Perirhinal area | 1 | 0.00 | 0.61 |
| Piriform area | 1 | 0.00 | −0.10 |
| Piriform-amygdalar area | 1 | 0.00 | 0.11 |
| Posterior auditory area | 1 | 0.05 | −0.25 |
| Posterolateral visual area | 1 | 0.35 | −1.44 |
| Posteromedial visual area | 1 | 0.00 | −0.29 |
| Postpiriform transition area | 1 | 0.00 | 2.19 |
| Postsubiculum | 1 | 0.00 | 0.92 |
| Prelimbic area | 1 | 0.00 | −1.01 |
| Presubiculum | 1 | 0.00 | 0.98 |
| Primary auditory area | 1 | 0.00 | 1.01 |
| Primary motor area | 1 | 0.00 | −0.94 |
| Primary somatosensory area barrel field | 1 | 0.00 | −0.18 |
| Primary somatosensory area lower limb | 1 | 0.08 | −1.08 |
| Primary somatosensory area mouth | 1 | 0.00 | −1.12 |
| Primary somatosensory area nose | 1 | 0.00 | −0.26 |
| Primary somatosensory area trunk | 1 | 0.07 | −0.97 |
| Primary somatosensory area upper limb | 1 | 0.07 | −1.08 |
| Primary visual area | 1 | 0.41 | −1.52 |
| Retrosplenial area dorsal part | 1 | 0.17 | −1.33 |
| Retrosplenial area lateral agranular part | 1 | 0.04 | 0.18 |
| Retrosplenial area ventral part | 2 | 0.00 | −1.56 |
| Secondary motor area | 1 | 0.00 | −1.40 |
| Subiculum | 1 | 0.00 | 1.00 |
| Supplemental somatosensory area | 1 | 0.00 | −1.37 |
| Taenia tecta | 1 | 0.09 | −1.18 |
| Temporal association areas | 1 | 0.00 | 0.66 |
| Ventral auditory area | 1 | 0.00 | 0.15 |
| Visceral area | 1 | 0.07 | −1.11 |
| Basolateral amygdalar nucleus | 1 | 0.00 | 0.35 |
| Claustrum | 1 | 0.00 | 0.54 |
| Endopiriform nucleus | 1 | 0.00 | 0.93 |
| Lateral amygdalar nucleus | 1 | 0.00 | 1.26 |
| Posterior amygdalar nucleus | 1 | 0.00 | 0.01 |
| Anterior amygdalar area | 1 | 0.00 | 1.07 |
| Bed nucleus of the accessory olfactory tract | 1 | 0.00 | 0.51 |
| Caudoputamen | 1 | 0.00 | 0.87 |
| Central amygdalar nucleus | 1 | 0.00 | 1.21 |
| Fundus of striatum | 1 | 0.06 | −0.84 |
| Intercalated amygdalar nucleus | 1 | 0.00 | 2.04 |
| Lateral septal complex | 1 | 0.06 | −0.83 |
| Medial amygdalar nucleus | 1 | 0.06 | −0.61 |
| Nucleus accumbens | 1 | 0.00 | −0.05 |
| Olfactory tubercle | 1 | 0.32 | −1.28 |
| Septofimbrial nucleus | 3 | 0.45 | −0.71 |
| Bed nuclei of the stria terminalis | 2 | 0.43 | 0.28 |
| Diagonal band nucleus | 1 | 0.05 | −0.24 |
| Globus pallidus external segment | 1 | 0.00 | −0.20 |
| Globus pallidus internal segment | 2 | 0.50 | 2.18 |
| Magnocellular nucleus | 1 | 0.00 | −0.13 |
| Medial septal nucleus | 1 | 0.00 | 0.49 |
| Substantia innominata | 1 | 0.00 | 0.66 |
| Triangular nucleus of septum | 2 | 0.61 | 0.15 |
| Anterior group of the dorsal thalamus | 2 | 0.00 | −1.56 |
| Anterodorsal nucleus | 3 | 0.45 | −0.61 |
| Anteroventral nucleus of thalamus | 2 | 0.48 | 0.85 |
| Central lateral nucleus of the thalamus | 3 | 0.00 | −0.03 |
| Central medial nucleus of the thalamus | 1 | 0.00 | −0.30 |
| Dorsal part of the lateral geniculate complex | 2 | 0.47 | −0.90 |
| Interanterodorsal nucleus of the thalamus | 1 | 0.00 | −0.67 |
| Interanteromedial nucleus of the thalamus | 1 | 0.00 | −1.28 |
| Intergeniculate leaflet of the lateral geniculate complex | 1 | 0.00 | 1.80 |
| Intermediodorsal nucleus of the thalamus | 1 | 0.00 | 2.04 |
| Lateral dorsal nucleus of thalamus | 3 | 0.00 | 0.81 |
| Lateral habenula | 1 | 0.41 | −1.97 |
| Lateral posterior nucleus of the thalamus | 1 | 0.16 | −1.32 |
| Medial geniculate complex | 1 | 0.00 | 0.87 |
| Medial habenula | 1 | 0.00 | −0.19 |
| Mediodorsal nucleus of thalamus | 1 | 0.00 | 0.08 |
| Nucleus of reuniens | 1 | 0.00 | 1.27 |
| Paracentral nucleus | 3 | 0.50 | −1.38 |
| Parafascicular nucleus | 3 | 0.00 | 0.85 |
| Parataenial nucleus | 1 | 0.00 | 0.74 |
| Paraventricular nucleus of the thalamus | 1 | 0.00 | 1.82 |
| Peripeduncular nucleus | 1 | 0.00 | 0.33 |
| Posterior complex of the thalamus | 3 | 0.00 | 1.48 |
| Posterior limiting nucleus of the thalamus | 1 | 0.00 | −0.12 |
| Reticular nucleus of the thalamus | 1 | 0.04 | −0.11 |
| Submedial nucleus of the thalamus | 2 | 0.00 | −0.90 |
| Subparafascicular nucleus | 1 | 0.00 | 1.36 |
| Thalamus sensory-motor cortex related | 1 | 0.00 | 0.57 |
| Ventral anterior-lateral complex of the thalamus | 3 | 0.45 | −1.28 |
| Ventral medial nucleus of the thalamus | 3 | 0.00 | 1.54 |
| Ventral part of the lateral geniculate complex | 1 | 0.00 | 1.48 |
| Ventral posterior complex of the thalamus | 3 | 0.50 | −0.68 |
| Ventral posterolateral nucleus of the thalamus | 1 | 0.00 | 0.54 |
| Anterior hypothalamic nucleus | 1 | 0.00 | 0.69 |
| Anterodorsal preoptic nucleus | 1 | 0.06 | −0.84 |
| Anteroventral periventricular nucleus | 1 | 0.00 | 1.34 |
| Anteroventral preoptic nucleus | 1 | 0.00 | 1.23 |
| Arcuate hypothalamic nucleus | 2 | 0.50 | −0.32 |
| Dorsal premammillary nucleus | 1 | 0.07 | −0.82 |
| Dorsomedial nucleus of the hypothalamus | 1 | 0.00 | 0.39 |
| Lateral hypothalamic area | 1 | 0.00 | −1.22 |
| Lateral preoptic area | 1 | 0.04 | 0.14 |
| Mammillary body | 2 | 0.50 | 0.98 |
| Medial preoptic area | 1 | 0.00 | 0.53 |
| Medial preoptic nucleus | 1 | 0.00 | 0.75 |
| Median preoptic nucleus | 1 | 0.00 | −0.14 |
| Parastrial nucleus | 1 | 0.00 | 0.86 |
| Parasubthalamic nucleus | 1 | 0.00 | 0.82 |
| Paraventricular hypothalamic nucleus | 1 | 0.00 | 1.36 |
| Paraventricular hypothalamic nucleus descending division | 1 | 0.00 | 0.75 |
| Periventricular hypothalamic nucleus posterior part | 1 | 0.11 | −0.62 |
| Periventricular hypothalamic nucleus preoptic part | 1 | 0.00 | 0.65 |
| Periventricular zone | 1 | 0.00 | 0.14 |
| Posterior hypothalamic nucleus | 1 | 0.00 | 0.52 |
| Preparasubthalamic nucleus | 1 | 0.00 | −0.08 |
| Retrochiasmatic area | 1 | 0.43 | −1.79 |
| Subparaventricular zone | 1 | 0.00 | 1.26 |
| Subthalamic nucleus | 1 | 0.07 | −0.83 |
| Suprachiasmatic nucleus | 1 | 0.44 | −1.61 |
| Supramammillary nucleus | 1 | 0.00 | −0.11 |
| Supraoptic nucleus | 1 | 0.07 | −0.73 |
| Tuberal nucleus | 2 | 0.50 | 0.97 |
| Ventrolateral preoptic nucleus | 2 | 0.49 | 1.53 |
| Ventromedial hypothalamic nucleus | 1 | 0.41 | −1.83 |
| Zona incerta | 1 | 0.00 | 1.35 |
| Anterior pretectal nucleus | 1 | 0.00 | −0.98 |
| Cuneiform nucleus | 2 | 0.44 | 1.64 |
| Inferior colliculus | 1 | 0.00 | 1.08 |
| Interpeduncular nucleus | 1 | 0.05 | −0.36 |
| Medial pretectal area | 1 | 0.00 | 0.45 |
| Midbrain reticular nucleus | 1 | 0.00 | 0.65 |
| Midbrain reticular nucleus retrorubral area | 1 | 0.00 | 1.08 |
| Nucleus of Darkschewitsch | 2 | 0.60 | 0.27 |
| Nucleus of the brachium of the inferior colliculus | 1 | 0.00 | 1.09 |
| Nucleus of the optic tract | 1 | 0.00 | 0.27 |
| Nucleus of the posterior commissure | 2 | 0.63 | −0.23 |
| Olivary pretectal nucleus | 1 | 0.10 | −1.47 |
| Parabigeminal nucleus | 1 | 0.00 | 0.57 |
| Pedunculopontine nucleus | 1 | 0.00 | 0.86 |
| Periaqueductal gray | 1 | 0.00 | −0.01 |
| Posterior pretectal nucleus | 2 | 0.63 | −0.27 |
| Precommissural nucleus | 1 | 0.00 | 0.85 |
| Red nucleus | 1 | 0.04 | −0.18 |
| Substantia nigra compact part | 1 | 0.00 | 0.80 |
| Substantia nigra reticular part | 1 | 0.30 | −1.69 |
| Superior colliculus motor related | 1 | 0.00 | 1.18 |
| Superior colliculus sensory related | 1 | 0.00 | 1.79 |
| Ventral tegmental area | 1 | 0.11 | −1.43 |
| Pons | 1 | 0.14 | −0.54 |
| Pons motor related | 1 | 0.47 | −1.84 |
| Pontine reticular nucleus | 1 | 0.09 | −0.34 |
| Vestibular nuclei | 3 | 0.00 | 1.21 |
| Ansiform lobule | 3 | 0.50 | −0.60 |
| Central lobule | 1 | 0.00 | 0.14 |
| Culmen | 1 | 0.00 | 0.23 |
| Paraflocculus | 2 | 0.64 | 0.22 |
| Simple lobule | 2 | 0.26 | −1.03 |
The nicotine withdrawal network is driven by cortical and extended amygdalar regions
The nicotine network had 4957 functional connections, the second most of all conditions, and consisted of five modules and one brain region (interanterodorsal nucleus of the thalamus) that was disconnected from the entire network. Overall, the nicotine network was relatively interconnected between modules and had two large modules and three medium modules.
One of the large modules (module 1) contained midbrain (e.g., pedunculopontine nucleus and periaqueductal gray), hindbrain (e.g., pons and pontine reticular nucleus), cortical (e.g., perirhinal area, posterior auditory area, ventral anterior cingulate temporal association areas, and visceral area), and subcortical (claustrum) brain regions that had high WMDz. A separate set of cortical (e.g., postsubiculum, lateral visual area, and gustatory areas), thalamic (e.g., anteroventral nucleus of the thalamus and peripeduncular nucleus), hypothalamic (e.g., posterior periventricular nucleus, supramammillary nucleus, and periventricular zone), and midbrain (e.g., midbrain reticular nucleus, ventral tegmental area, and medial pretectal area) brain regions and a few others that included the central amygdala and vestibular nuclei had high PC.
In the second large module (module 4), a set of sensory/cortical [e.g., primary somatosensory area, lower limb, ventral agranular insular area (AIv), and primary motor area] and hypothalamic (e.g., parastriatal nucleus, retrochiasmatic area, lateral preoptic area, medial preoptic area, and zona incerta) brain regions had high WMDz. All of the same sensory/cortical and hypothalamic regions had high PC and a number of other thalamic and sensory regions. Additionally, the anterior amygdalar area (AAA) also showed both high WMDz and high PC.
One of the smaller modules (module 2) consisted of hippocampal (dentate gyrus) and sensory/cortical (e.g., posterolateral visual area, anteromedial visual area, and subiculum [SUB]) regions, along with the nucleus of reuniens (RE) with high WMDz. The SUB and RE also had high PC, along with other thalamic, hypothalamic, and midbrain regions.
In another smaller module (module 3), the precommissural nucleus (PRC), medial habenula, and intergeniculate leaflet of the lateral geniculate complex (IGL) had high WMDz and high PC. Other midbrain and thalamic regions also had high PC.
In the last small module (module 5), no regions reached the criterion for high WMDz, but the orbitofrontal cortex (lateral and ventrolateral orbital area), bed nucleus of the stria terminalis, and medial amygdalar nucleus were all in the top five values (WMDz = 0.64–0.67). However, every region in this module, with the exception of the bed nucleus of the accessory olfactory tract, reached the criterion for high PC (Figs. 2, 6; see Table 5 for a full list of values for the network).
Figure 6.
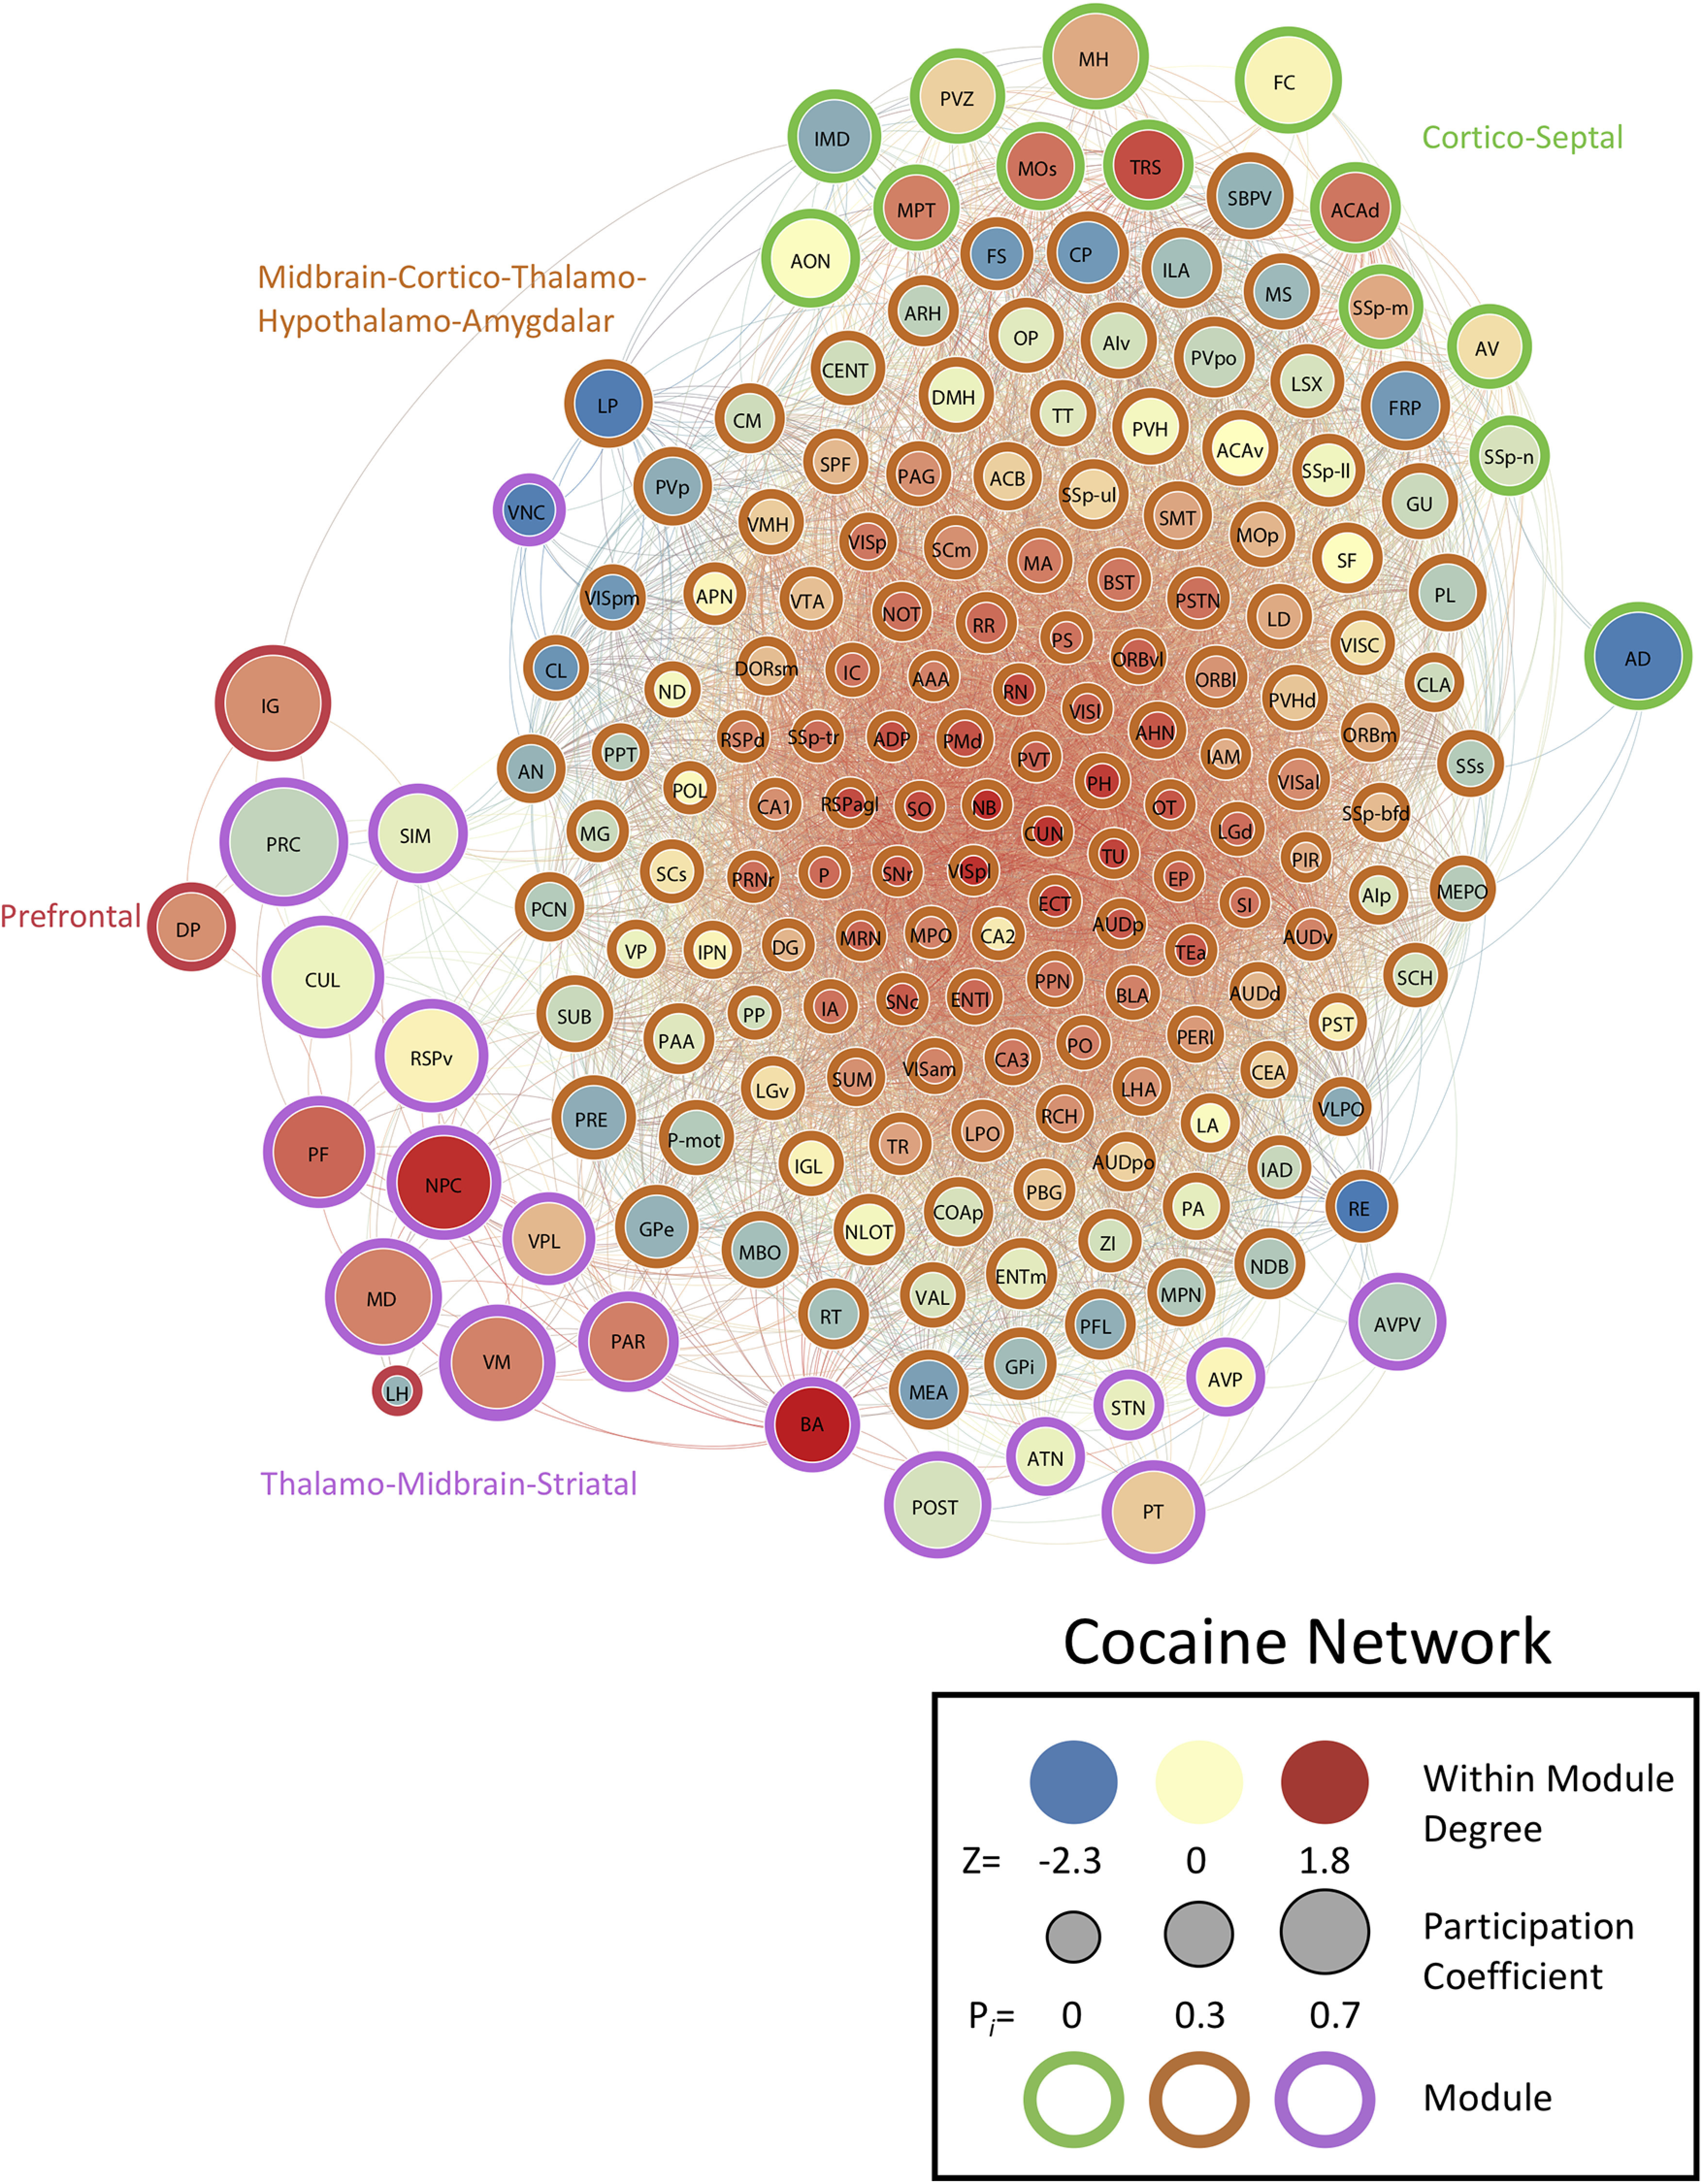
Neural network of cocaine mice during withdrawal thresholded to 0.75R. Nodes/brain regions of the network are represented by circles. The size of the node represents the PC (smaller, lower PC; larger, higher PC). The internal color of each circle represents the WMDz (dark blue, lowest; dark red, highest). The color of the modules that are identified in Figure 1D are represented by different colored edges. See figure key for examples of each representative component of the figure.
Table 5.
Nicotine network values
| Region | Module | PC | WMDz |
|---|---|---|---|
| Agranular insular area posterior part | 1 | 0.03 | 0.12 |
| Agranular insular area ventral part | 4 | 0.43 | 0.85 |
| Anterior cingulate area dorsal part | 1 | 0.17 | 0.87 |
| Anterior cingulate area ventral part | 1 | 0.22 | 0.94 |
| Anterior olfactory nucleus | 5 | 0.42 | 0.27 |
| Anterolateral visual area | 1 | 0.38 | −0.12 |
| Anteromedial visual area | 2 | 0.57 | 0.97 |
| Cortical amygdalar area posterior part | 1 | 0.12 | −0.46 |
| Dentate gyrus | 2 | 0.58 | 0.99 |
| Dorsal auditory area | 1 | 0.20 | 0.52 |
| Dorsal peduncular area | 4 | 0.49 | 0.33 |
| Ectorhinal area | 1 | 0.13 | 0.78 |
| Entorhinal area lateral part | 1 | 0.28 | −1.50 |
| Entorhinal area medial part | 4 | 0.57 | −0.12 |
| Fasciola cinerea | 1 | 0.25 | −0.35 |
| Field CA1 | 4 | 0.34 | −0.11 |
| Field CA2 | 4 | 0.36 | 0.33 |
| Field CA3 | 4 | 0.44 | 0.80 |
| Frontal pole cerebral cortex | 5 | 0.49 | −2.12 |
| Gustatory areas | 1 | 0.44 | −0.40 |
| Induseum griseum | 3 | 0.47 | −1.01 |
| Infralimbic area | 4 | 0.42 | 0.66 |
| Lateral visual area | 1 | 0.38 | 0.27 |
| Nucleus of the lateral olfactory tract | 4 | 0.41 | −1.16 |
| Orbital area lateral part | 5 | 0.44 | 0.67 |
| Orbital area medial part | 4 | 0.48 | −2.31 |
| Orbital area ventrolateral part | 5 | 0.46 | 0.66 |
| Parasubiculum | 4 | 0.59 | 0.18 |
| Perirhinal area | 1 | 0.13 | 1.02 |
| Piriform area | 1 | 0.00 | 0.11 |
| Piriform-amygdalar area | 1 | 0.11 | −2.62 |
| Posterior auditory area | 1 | 0.12 | 0.95 |
| Posterolateral visual area | 2 | 0.55 | 0.98 |
| Posteromedial visual area | 1 | 0.38 | −0.12 |
| Postpiriform transition area | 1 | 0.10 | 0.58 |
| Postsubiculum | 1 | 0.34 | 0.58 |
| Prelimbic area | 1 | 0.16 | −1.81 |
| Presubiculum | 1 | 0.27 | 0.69 |
| Primary auditory area | 1 | 0.07 | 0.85 |
| Primary motor area | 4 | 0.43 | 0.82 |
| Primary somatosensory area barrel field | 5 | 0.43 | 0.58 |
| Primary somatosensory area lower limb | 4 | 0.44 | 1.12 |
| Primary somatosensory area mouth | 4 | 0.61 | −0.75 |
| Primary somatosensory area nose | 4 | 0.54 | 0.67 |
| Primary somatosensory area trunk | 4 | 0.48 | 0.70 |
| Primary somatosensory area upper limb | 4 | 0.44 | 0.26 |
| Primary visual area | 4 | 0.50 | 0.56 |
| Retrosplenial area dorsal part | 1 | 0.26 | 0.30 |
| Retrosplenial area lateral agranular part | 1 | 0.21 | 0.67 |
| Retrosplenial area ventral part | 1 | 0.20 | 0.41 |
| Secondary motor area | 4 | 0.55 | 0.27 |
| Subiculum | 2 | 0.66 | 0.97 |
| Supplemental somatosensory area | 1 | 0.22 | 0.73 |
| Taenia tecta | 4 | 0.53 | 0.65 |
| Temporal association areas | 1 | 0.14 | 0.93 |
| Ventral auditory area | 1 | 0.09 | 0.85 |
| Visceral area | 1 | 0.09 | 0.90 |
| Basolateral amygdalar nucleus | 1 | 0.25 | 0.71 |
| Claustrum | 1 | 0.18 | 1.06 |
| Endopiriform nucleus | 1 | 0.10 | −0.96 |
| Lateral amygdalar nucleus | 1 | 0.24 | 0.36 |
| Posterior amygdalar nucleus | 4 | 0.35 | 0.54 |
| Anterior amygdalar area | 4 | 0.52 | 0.86 |
| Bed nucleus of the accessory olfactory tract | 5 | 0.13 | −0.68 |
| Caudoputamen | 2 | 0.61 | −0.17 |
| Central amygdalar nucleus | 1 | 0.36 | −0.01 |
| Fundus of striatum | 2 | 0.59 | 0.47 |
| Intercalated amygdalar nucleus | 1 | 0.29 | 0.46 |
| Lateral septal complex | 1 | 0.22 | −1.88 |
| Medial amygdalar nucleus | 5 | 0.49 | 0.64 |
| Nucleus accumbens | 4 | 0.39 | 0.70 |
| Olfactory tubercle | 4 | 0.39 | −2.16 |
| Septofimbrial nucleus | 1 | 0.16 | −0.31 |
| Bed nuclei of the stria terminalis | 5 | 0.49 | 0.65 |
| Diagonal band nucleus | 5 | 0.44 | −0.33 |
| Globus pallidus external segment | 4 | 0.49 | −2.31 |
| Globus pallidus internal segment | 4 | 0.45 | 0.27 |
| Magnocellular nucleus | 4 | 0.41 | 0.43 |
| Medial septal nucleus | 2 | 0.66 | 0.48 |
| Substantia innominata | 5 | 0.46 | 0.14 |
| Triangular nucleus of septum | 3 | 0.49 | 0.28 |
| Anterior group of the dorsal thalamus | 4 | 0.60 | −1.42 |
| Anterodorsal nucleus | 3 | 0.53 | −1.16 |
| Anteroventral nucleus of thalamus | 1 | 0.53 | −2.45 |
| Central lateral nucleus of the thalamus | 2 | 0.67 | −1.12 |
| Central medial nucleus of the thalamus | 1 | 0.17 | 0.09 |
| Dorsal part of the lateral geniculate complex | 4 | 0.00 | −2.07 |
| Interanteromedial nucleus of the thalamus | 1 | 0.27 | −2.07 |
| Intergeniculate leaflet of the lateral geniculate complex | 3 | 0.50 | 1.16 |
| Intermediodorsal nucleus of the thalamus | 1 | 0.12 | −0.71 |
| Lateral dorsal nucleus of thalamus | 5 | 0.47 | 0.64 |
| Lateral habenula | 3 | 0.47 | 0.75 |
| Lateral posterior nucleus of the thalamus | 5 | 0.44 | −2.94 |
| Medial geniculate complex | 1 | 0.22 | 0.81 |
| Medial habenula | 3 | 0.38 | 1.19 |
| Mediodorsal nucleus of thalamus | 1 | 0.23 | 0.03 |
| Nucleus of reuniens | 2 | 0.67 | 0.86 |
| Paracentral nucleus | 4 | 0.58 | 0.66 |
| Parafascicular nucleus | 2 | 0.68 | −0.14 |
| Parataenial nucleus | 3 | 0.40 | −0.61 |
| Paraventricular nucleus of the thalamus | 3 | 0.46 | −1.06 |
| Peripeduncular nucleus | 1 | 0.41 | −1.81 |
| Posterior complex of the thalamus | 5 | 0.45 | 0.26 |
| Posterior limiting nucleus of the thalamus | 1 | 0.21 | −0.13 |
| Reticular nucleus of the thalamus | 4 | 0.25 | −0.76 |
| Submedial nucleus of the thalamus | 4 | 0.45 | 0.72 |
| Subparafascicular nucleus | 1 | 0.25 | 0.99 |
| Thalamus sensory-motor cortex related | 1 | 0.20 | −0.83 |
| Ventral anterior-lateral complex of the thalamus | 5 | 0.46 | 0.27 |
| Ventral medial nucleus of the thalamus | 4 | 0.45 | 0.06 |
| Ventral part of the lateral geniculate complex | 1 | 0.21 | 0.44 |
| Ventral posterior complex of the thalamus | 5 | 0.48 | 0.26 |
| Ventral posterolateral nucleus of the thalamus | 1 | 0.12 | −2.84 |
| Anterior hypothalamic nucleus | 5 | 0.44 | 0.51 |
| Anterodorsal preoptic nucleus | 4 | 0.40 | 0.58 |
| Anteroventral periventricular nucleus | 4 | 0.38 | −0.22 |
| Anteroventral preoptic nucleus | 4 | 0.30 | 0.05 |
| Arcuate hypothalamic nucleus | 2 | 0.49 | −0.42 |
| Dorsal premammillary nucleus | 2 | 0.64 | 0.50 |
| Dorsomedial nucleus of the hypothalamus | 2 | 0.61 | 0.75 |
| Lateral hypothalamic area | 4 | 0.44 | −0.06 |
| Lateral preoptic area | 4 | 0.40 | 0.85 |
| Mammillary body | 1 | 0.39 | −0.30 |
| Medial preoptic area | 4 | 0.40 | 0.81 |
| Medial preoptic nucleus | 5 | 0.45 | 0.50 |
| Median preoptic nucleus | 4 | 0.29 | −1.51 |
| Parastrial nucleus | 4 | 0.45 | 1.11 |
| Parasubthalamic nucleus | 2 | 0.42 | −0.99 |
| Paraventricular hypothalamic nucleus | 1 | 0.22 | 0.88 |
| Paraventricular hypothalamic nucleus descending division | 2 | 0.65 | 0.72 |
| Periventricular hypothalamic nucleus posterior part | 1 | 0.34 | 0.21 |
| Periventricular hypothalamic nucleus preoptic part | 4 | 0.21 | −0.74 |
| Periventricular zone | 1 | 0.35 | −0.50 |
| Posterior hypothalamic nucleus | 1 | 0.28 | 0.76 |
| Preparasubthalamic nucleus | 4 | 0.45 | −2.20 |
| Retrochiasmatic area | 4 | 0.45 | 0.98 |
| Subparaventricular zone | 4 | 0.48 | 0.07 |
| Subthalamic nucleus | 4 | 0.59 | 0.58 |
| Suprachiasmatic nucleus | 2 | 0.61 | −2.32 |
| Supramammillary nucleus | 1 | 0.37 | 0.05 |
| Supraoptic nucleus | 4 | 0.45 | −2.10 |
| Tuberal nucleus | 4 | 0.49 | 0.64 |
| Ventrolateral preoptic nucleus | 1 | 0.22 | −2.82 |
| Ventromedial hypothalamic nucleus | 4 | 0.49 | 0.77 |
| Zona incerta | 4 | 0.50 | 0.85 |
| Anterior pretectal nucleus | 2 | 0.68 | −0.63 |
| Cuneiform nucleus | 4 | 0.40 | 0.44 |
| Inferior colliculus | 1 | 0.19 | 0.38 |
| Interpeduncular nucleus | 1 | 0.26 | 0.06 |
| Medial pretectal area | 1 | 0.33 | −1.59 |
| Midbrain reticular nucleus | 1 | 0.37 | 0.26 |
| Midbrain reticular nucleus retrorubral area | 1 | 0.26 | −0.19 |
| Nucleus of Darkschewitsch | 2 | 0.69 | −2.09 |
| Nucleus of the brachium of the inferior colliculus | 1 | 0.22 | 0.26 |
| Nucleus of the optic tract | 3 | 0.40 | 0.67 |
| Nucleus of the posterior commissure | 3 | 0.49 | 0.20 |
| Olivary pretectal nucleus | 3 | 0.44 | 0.33 |
| Parabigeminal nucleus | 3 | 0.38 | 0.20 |
| Pedunculopontine nucleus | 1 | 0.21 | 1.08 |
| Periaqueductal gray | 1 | 0.15 | 0.78 |
| Posterior pretectal nucleus | 3 | 0.66 | −2.16 |
| Precommissural nucleus | 3 | 0.46 | 1.21 |
| Red nucleus | 1 | 0.17 | 0.68 |
| Substantia nigra compact part | 2 | 0.64 | 0.19 |
| Substantia nigra reticular part | 4 | 0.62 | −0.15 |
| Superior colliculus motor related | 1 | 0.36 | 0.45 |
| Superior colliculus sensory related | 1 | 0.25 | 0.64 |
| Ventral tegmental area | 1 | 0.37 | −0.33 |
| Pons | 1 | 0.18 | 1.06 |
| Pons motor related | 1 | 0.26 | 0.75 |
| Pontine reticular nucleus | 1 | 0.23 | 0.82 |
| Vestibular nuclei | 1 | 0.47 | −1.51 |
| Ansiform lobule | 1 | 0.25 | 0.84 |
| Central lobule | 1 | 0.20 | 0.76 |
| Culmen | 1 | 0.19 | 0.40 |
| Paraflocculus | 1 | 0.27 | −0.03 |
| Simple lobule | 1 | 0.36 | −0.48 |
Table 6.
Top to bottom order of brain regions in Figure 1
| Number | Saline hierarchical order | Cocaine hierarchical order |
|---|---|---|
| 1 | Retrosplenial area ventral part | Inferior colliculus |
| 2 | Interanterodorsal nucleus of the thalamus | Primary visual area |
| 3 | Anterior hypothalamic nucleus | Nucleus of the optic tract |
| 4 | Posterolateral visual area | Thalamus sensory-motor cortex related |
| 5 | Precommissural nucleus | Retrosplenial area dorsal part |
| 6 | Superior colliculus motor related | Field CA1 |
| 7 | Cuneiform nucleus | Retrosplenial area lateral agranular part |
| 8 | Primary visual area | Anterior amygdalar area |
| 9 | Superior colliculus sensory related | Anterodorsal preoptic nucleus |
| 10 | Parasubthalamic nucleus | Primary somatosensory area trunk |
| 11 | Vestibular nuclei | Interanteromedial nucleus of the thalamus |
| 12 | Pons motor related | Subparafascicular nucleus |
| 13 | Lateral visual area | Superior colliculus motor related |
| 14 | Anterolateral visual area | Periaqueductal gray |
| 15 | Pontine reticular nucleus | Magnocellular nucleus |
| 16 | Periaqueductal gray | Bed nuclei of the stria terminalis |
| 17 | Parastrial nucleus | Midbrain reticular nucleus retrorubral area |
| 18 | Fasciola cinerea | Ventromedial hypothalamic nucleus |
| 19 | Anterodorsal nucleus | Ventral tegmental area |
| 20 | Triangular nucleus of septum | Anterior pretectal nucleus |
| 21 | Lateral hypothalamic area | Endopiriform nucleus |
| 22 | Dorsomedial nucleus of the hypothalamus | Olfactory tubercle |
| 23 | Nucleus accumbens | Tuberal nucleus |
| 24 | Anterior group of the dorsal thalamus | Piriform area |
| 25 | Paraventricular hypothalamic nucleus descending division | Substantia innominata |
| 26 | Medial pretectal area | Ventral auditory area |
| 27 | Postsubiculum | Dorsal part of the lateral geniculate complex |
| 28 | Parasubiculum | Posterolateral visual area |
| 29 | Nucleus of the optic tract | Nucleus of the brachium of the inferior colliculus |
| 30 | Midbrain reticular nucleus retrorubral area | Supraoptic nucleus |
| 31 | Inferior colliculus | Cuneiform nucleus |
| 32 | Anterior pretectal nucleus | Paraventricular nucleus of the thalamus |
| 33 | Nucleus of Darkschewitsch | Lateral visual area |
| 34 | Field CA1 | Orbital area ventrolateral part |
| 35 | Nucleus of the posterior commissure | Red nucleus |
| 36 | Fundus of striatum | Parastrial nucleus |
| 37 | Dentate gyrus | Parasubthalamic nucleus |
| 38 | Presubiculum | Anterior hypothalamic nucleus |
| 39 | Lateral posterior nucleus of the thalamus | Posterior hypothalamic nucleus |
| 40 | Parafascicular nucleus | Dorsal premammillary nucleus |
| 41 | Peripeduncular nucleus | Lateral hypothalamic area |
| 42 | Central lobule | Retrochiasmatic area |
| 43 | Posterior pretectal nucleus | Perirhinal area |
| 44 | Lateral habenula | Field CA3 |
| 45 | Nucleus of reuniens | Posterior complex of the thalamus |
| 46 | Ventral medial nucleus of the thalamus | Entorhinal area lateral part |
| 47 | Tuberal nucleus | Intercalated amygdalar nucleus |
| 48 | Periventricular hypothalamic nucleus posterior part | Substantia nigra compact part |
| 49 | Posterior amygdalar nucleus | Basolateral amygdalar nucleus |
| 50 | Ventromedial hypothalamic nucleus | Pedunculopontine nucleus |
| 51 | Posterior hypothalamic nucleus | Medial preoptic area |
| 52 | Arcuate hypothalamic nucleus | Ectorhinal area |
| 53 | Subthalamic nucleus | Primary auditory area |
| 54 | Paracentral nucleus | Temporal association areas |
| 55 | Substantia nigra compact part | Pontine reticular nucleus |
| 56 | Culmen | Substantia nigra reticular part |
| 57 | Pedunculopontine nucleus | Pons |
| 58 | Interpeduncular nucleus | Midbrain reticular nucleus |
| 59 | Ventral posterior complex of the thalamus | Field CA2 |
| 60 | Induseum griseum | Supramammillary nucleus |
| 61 | Preparasubthalamic nucleus | Anteromedial visual area |
| 62 | Nucleus of the brachium of the inferior colliculus | Posterior auditory area |
| 63 | Red nucleus | Visceral area |
| 64 | Ventral tegmental area | Primary motor area |
| 65 | Substantia innominata | Paraventricular hypothalamic nucleus descending division |
| 66 | Medial geniculate complex | Lateral dorsal nucleus of thalamus |
| 67 | Subiculum | Primary somatosensory area barrel field |
| 68 | Midbrain reticular nucleus | Orbital area medial part |
| 69 | Thalamus sensory-motor cortex related | Orbital area lateral part |
| 70 | Simple lobule | Anterolateral visual area |
| 71 | Paraflocculus | Median preoptic nucleus |
| 72 | Submedial nucleus of the thalamus | Suprachiasmatic nucleus |
| 73 | Subparafascicular nucleus | Supplemental somatosensory area |
| 74 | Olivary pretectal nucleus | Agranular insular area posterior part |
| 75 | Central lateral nucleus of the thalamus | Primary somatosensory area lower limb |
| 76 | Medial septal nucleus | Septofimbrial nucleus |
| 77 | Subparaventricular zone | Anterior cingulate area ventral part |
| 78 | Anterior cingulate area ventral part | Paraventricular hypothalamic nucleus |
| 79 | Secondary motor area | Primary somatosensory area upper limb |
| 80 | Suprachiasmatic nucleus | Submedial nucleus of the thalamus |
| 81 | Periventricular zone | Nucleus accumbens |
| 82 | Septofimbrial nucleus | Claustrum |
| 83 | Paraventricular hypothalamic nucleus | Agranular insular area ventral part |
| 84 | Orbital area lateral part | Lateral septal complex |
| 85 | Mediodorsal nucleus of thalamus | Taenia tecta |
| 86 | Posteromedial visual area | Arcuate hypothalamic nucleus |
| 87 | Retrosplenial area dorsal part | Olivary pretectal nucleus |
| 88 | Anteroventral periventricular nucleus | Dorsomedial nucleus of the hypothalamus |
| 89 | Bed nuclei of the stria terminalis | Prelimbic area |
| 90 | Retrosplenial area lateral agranular part | Periventricular hypothalamic nucleus preoptic part |
| 91 | Medial preoptic nucleus | Gustatory areas |
| 92 | Anterodorsal preoptic nucleus | Frontal pole cerebral cortex |
| 93 | Primary motor area | Subparaventricular zone |
| 94 | Lateral septal complex | Caudoputamen |
| 95 | Primary somatosensory area lower limb | Fundus of striatum |
| 96 | Lateral dorsal nucleus of thalamus | Infralimbic area |
| 97 | Primary somatosensory area trunk | Medial septal nucleus |
| 98 | Anteromedial visual area | Central lateral nucleus of the thalamus |
| 99 | Lateral preoptic area | Posteromedial visual area |
| 100 | Periventricular hypothalamic nucleus preoptic part | Lateral posterior nucleus of the thalamus |
| 101 | Median preoptic nucleus | Central lobule |
| 102 | Infralimbic area | Central medial nucleus of the thalamus |
| 103 | Primary somatosensory area upper limb | Periventricular hypothalamic nucleus posterior part |
| 104 | Supramammillary nucleus | Cortical amygdalar area posterior part |
| 105 | Gustatory areas | Nucleus of the lateral olfactory tract |
| 106 | Taenia tecta | Entorhinal area medial part |
| 107 | Supraoptic nucleus | Zona incerta |
| 108 | Claustrum | Ventral anterior-lateral complex of the thalamus |
| 109 | Anteroventral nucleus of thalamus | Posterior amygdalar nucleus |
| 110 | Prelimbic area | Postpiriform transition area |
| 111 | Piriform area | Lateral preoptic area |
| 112 | Agranular insular area ventral part | Parabigeminal nucleus |
| 113 | Dorsal peduncular area | Intergeniculate leaflet of the lateral geniculate complex |
| 114 | Anterior cingulate area dorsal part | Ventral part of the lateral geniculate complex |
| 115 | Orbital area medial part | Interanterodorsal nucleus of the thalamus |
| 116 | Orbital area ventrolateral part | Lateral amygdalar nucleus |
| 117 | Anterior amygdalar area | Ventrolateral preoptic nucleus |
| 118 | Caudoputamen | Central amygdalar nucleus |
| 119 | Primary somatosensory area barrel field | Dorsal auditory area |
| 120 | Agranular insular area posterior part | Preparasubthalamic nucleus |
| 121 | Paraventricular nucleus of the thalamus | Ventral posterior complex of the thalamus |
| 122 | Medial habenula | Interpeduncular nucleus |
| 123 | Frontal pole cerebral cortex | Peripeduncular nucleus |
| 124 | Anterior olfactory nucleus | Dentate gyrus |
| 125 | Central medial nucleus of the thalamus | Superior colliculus sensory related |
| 126 | Intercalated amygdalar nucleus | Piriform-amygdalar area |
| 127 | Medial preoptic area | Medial geniculate complex |
| 128 | Intermediodorsal nucleus of the thalamus | Posterior pretectal nucleus |
| 129 | Supplemental somatosensory area | Nucleus of Darkschewitsch |
| 130 | Primary somatosensory area nose | Posterior limiting nucleus of the thalamus |
| 131 | Primary somatosensory area mouth | Paracentral nucleus |
| 132 | Visceral area | Subiculum |
| 133 | Dorsal auditory area | Ansiform lobule |
| 134 | Entorhinal area lateral part | Diagonal band nucleus |
| 135 | Field CA2 | Medial preoptic nucleus |
| 136 | Mammillary body | Paraflocculus |
| 137 | Posterior auditory area | Medial amygdalar nucleus |
| 138 | Ventral auditory area | Globus pallidus internal segment |
| 139 | Temporal association areas | Nucleus of reuniens |
| 140 | Ventral posterolateral nucleus of the thalamus | Mammillary body |
| 141 | Ansiform lobule | Globus pallidus external segment |
| 142 | Entorhinal area medial part | Reticular nucleus of the thalamus |
| 143 | Intergeniculate leaflet of the lateral geniculate complex | Presubiculum |
| 144 | Perirhinal area | Pons motor related |
| 145 | Reticular nucleus of the thalamus | Mediodorsal nucleus of thalamus |
| 146 | Ectorhinal area | Ventral medial nucleus of the thalamus |
| 147 | Posterior complex of the thalamus | Retrosplenial area ventral part |
| 148 | Ventral anterior-lateral complex of the thalamus | Nucleus of the posterior commissure |
| 149 | Dorsal part of the lateral geniculate complex | Parafascicular nucleus |
| 150 | Primary auditory area | Culmen |
| 151 | Postpiriform transition area | Simple lobule |
| 152 | Magnocellular nucleus | Precommissural nucleus |
| 153 | Globus pallidus internal segment | Vestibular nuclei |
| 154 | Lateral amygdalar nucleus | Parasubiculum |
| 155 | Nucleus of the lateral olfactory tract | Ventral posterolateral nucleus of the thalamus |
| 156 | Bed nucleus of the accessory olfactory tract | Bed nucleus of the accessory olfactory tract |
| 157 | Dorsal premammillary nucleus | Anteroventral preoptic nucleus |
| 158 | Substantia nigra reticular part | Subthalamic nucleus |
| 159 | Zona incerta | Anterior group of the dorsal thalamus |
| 160 | Ventral part of the lateral geniculate complex | Parataenial nucleus |
| 161 | Parabigeminal nucleus | Anteroventral periventricular nucleus |
| 162 | Field CA3 | Postsubiculum |
| 163 | Pons | Anterior cingulate area dorsal part |
| 164 | Retrochiasmatic area | Secondary motor area |
| 165 | Medial amygdalar nucleus | Triangular nucleus of septum |
| 166 | Parataenial nucleus | Primary somatosensory area mouth |
| 167 | Interanteromedial nucleus of the thalamus | Medial pretectal area |
| 168 | Piriform-amygdalar area | Anterior olfactory nucleus |
| 169 | Diagonal band nucleus | Primary somatosensory area nose |
| 170 | Ventrolateral preoptic nucleus | Anteroventral nucleus of thalamus |
| 171 | Anteroventral preoptic nucleus | Periventricular zone |
| 172 | Cortical amygdalar area posterior part | Intermediodorsal nucleus of the thalamus |
| 173 | Globus pallidus external segment | Medial habenula |
| 174 | Posterior limiting nucleus of the thalamus | Anterodorsal nucleus |
| 175 | Endopiriform nucleus | Fasciola cinerea |
| 176 | Olfactory tubercle | Dorsal peduncular area |
| 177 | Central amygdalar nucleus | Induseum griseum |
| 178 | Basolateral amygdalar nucleus | Lateral habenula |
| Number | Methamphetamine hierarchical order | Nicotine hierarchical order |
| 1 | Caudoputamen | Ventral tegmental area |
| 2 | Anterior amygdalar area | Midbrain reticular nucleus retrorubral area |
| 3 | Parataenial nucleus | Superior colliculus motor related |
| 4 | Periventricular hypothalamic nucleus preoptic part | Midbrain reticular nucleus |
| 5 | Claustrum | Simple lobule |
| 6 | Medial habenula | Posterior hypothalamic nucleus |
| 7 | Medial pretectal area | Basolateral amygdalar nucleus |
| 8 | Ventral part of the lateral geniculate complex | Pedunculopontine nucleus |
| 9 | Anteroventral preoptic nucleus | Subparafascicular nucleus |
| 10 | Parasubthalamic nucleus | Pons motor related |
| 11 | Precommissural nucleus | Anterior cingulate area dorsal part |
| 12 | Parastrial nucleus | Paraventricular hypothalamic nucleus |
| 13 | Anteroventral periventricular nucleus | Ansiform lobule |
| 14 | Central amygdalar nucleus | Presubiculum |
| 15 | Lateral amygdalar nucleus | Dorsal auditory area |
| 16 | Endopiriform nucleus | Supplemental somatosensory area |
| 17 | Paraventricular nucleus of the thalamus | Posterior limiting nucleus of the thalamus |
| 18 | Intercalated amygdalar nucleus | Intercalated amygdalar nucleus |
| 19 | Intermediodorsal nucleus of the thalamus | Central amygdalar nucleus |
| 20 | Postpiriform transition area | Posteromedial visual area |
| 21 | Intergeniculate leaflet of the lateral geniculate complex | Lateral visual area |
| 22 | Ventral auditory area | Supramammillary nucleus |
| 23 | Bed nucleus of the accessory olfactory tract | Anterolateral visual area |
| 24 | Basolateral amygdalar nucleus | Gustatory areas |
| 25 | Dorsal auditory area | Mammillary body |
| 26 | Primary somatosensory area barrel field | Postsubiculum |
| 27 | Magnocellular nucleus | Periventricular hypothalamic nucleus posterior part |
| 28 | Primary somatosensory area nose | Periventricular zone |
| 29 | Induseum griseum | Paraflocculus |
| 30 | Anterior cingulate area ventral part | Peripeduncular nucleus |
| 31 | Anterior cingulate area dorsal part | Vestibular nuclei |
| 32 | Pedunculopontine nucleus | Anteroventral nucleus of thalamus |
| 33 | Superior colliculus motor related | Endopiriform nucleus |
| 34 | Inferior colliculus | Cortical amygdalar area posterior part |
| 35 | Entorhinal area lateral part | Postpiriform transition area |
| 36 | Substantia innominata | Prelimbic area |
| 37 | Nucleus accumbens | Intermediodorsal nucleus of the thalamus |
| 38 | Central lobule | Lateral septal complex |
| 39 | Posterior hypothalamic nucleus | Entorhinal area lateral part |
| 40 | Substantia nigra compact part | Ventrolateral preoptic nucleus |
| 41 | Parabigeminal nucleus | Visceral area |
| 42 | Parasubiculum | Posterior auditory area |
| 43 | Presubiculum | Temporal association areas |
| 44 | Postsubiculum | Primary auditory area |
| 45 | Diagonal band nucleus | Ventral auditory area |
| 46 | Posterior auditory area | Ectorhinal area |
| 47 | Piriform-amygdalar area | Perirhinal area |
| 48 | Periaqueductal gray | Pontine reticular nucleus |
| 49 | Supramammillary nucleus | Medial geniculate complex |
| 50 | Anterolateral visual area | Anterior cingulate area ventral part |
| 51 | Primary auditory area | Claustrum |
| 52 | Ectorhinal area | Pons |
| 53 | Medial geniculate complex | Central lobule |
| 54 | Temporal association areas | Red nucleus |
| 55 | Perirhinal area | Retrosplenial area lateral agranular part |
| 56 | Agranular insular area ventral part | Lateral amygdalar nucleus |
| 57 | Paraventricular hypothalamic nucleus | Retrosplenial area dorsal part |
| 58 | Subparafascicular nucleus | Interpeduncular nucleus |
| 59 | Subparaventricular zone | Superior colliculus sensory related |
| 60 | Paraventricular hypothalamic nucleus descending division | Inferior colliculus |
| 61 | Nucleus of the brachium of the inferior colliculus | Retrosplenial area ventral part |
| 62 | Midbrain reticular nucleus | Periaqueductal gray |
| 63 | Anterior hypothalamic nucleus | Ventral part of the lateral geniculate complex |
| 64 | Peripeduncular nucleus | Nucleus of the brachium of the inferior colliculus |
| 65 | Subiculum | Mediodorsal nucleus of thalamus |
| 66 | Lateral visual area | Culmen |
| 67 | Superior colliculus sensory related | Fasciola cinerea |
| 68 | Midbrain reticular nucleus retrorubral area | Agranular insular area posterior part |
| 69 | Nucleus of reuniens | Piriform area |
| 70 | Zona incerta | Central medial nucleus of the thalamus |
| 71 | Culmen | Interanteromedial nucleus of the thalamus |
| 72 | Retrosplenial area lateral agranular part | Medial pretectal area |
| 73 | Lateral preoptic area | Thalamus sensory-motor cortex related |
| 74 | Anterior pretectal nucleus | Septofimbrial nucleus |
| 75 | Posterior limiting nucleus of the thalamus | Ventral posterolateral nucleus of the thalamus |
| 76 | Preparasubthalamic nucleus | Piriform-amygdalar area |
| 77 | Nucleus of the optic tract | Dorsomedial nucleus of the hypothalamus |
| 78 | Medial preoptic area | Dentate gyrus |
| 79 | Thalamus sensory-motor cortex related | Anteromedial visual area |
| 80 | Medial preoptic nucleus | Posterolateral visual area |
| 81 | Dorsomedial nucleus of the hypothalamus | Fundus of striatum |
| 82 | Red nucleus | Caudoputamen |
| 83 | Lateral septal complex | Arcuate hypothalamic nucleus |
| 84 | Central medial nucleus of the thalamus | Parasubthalamic nucleus |
| 85 | Interpeduncular nucleus | Suprachiasmatic nucleus |
| 86 | Reticular nucleus of the thalamus | Subiculum |
| 87 | Medial septal nucleus | Medial septal nucleus |
| 88 | Supraoptic nucleus | Nucleus of reuniens |
| 89 | Periventricular hypothalamic nucleus posterior part | Substantia nigra compact part |
| 90 | Interanteromedial nucleus of the thalamus | Dorsal premammillary nucleus |
| 91 | Secondary motor area | Paraventricular hypothalamic nucleus descending division |
| 92 | Field CA2 | Central lateral nucleus of the thalamus |
| 93 | Field CA3 | Nucleus of Darkschewitsch |
| 94 | Posteromedial visual area | Anterior pretectal nucleus |
| 95 | Primary motor area | Parafascicular nucleus |
| 96 | Anteromedial visual area | Intergeniculate leaflet of the lateral geniculate complex |
| 97 | Medial amygdalar nucleus | Precommissural nucleus |
| 98 | Piriform area | Lateral habenula |
| 99 | Posterior amygdalar nucleus | Medial habenula |
| 100 | Primary somatosensory area trunk | Parabigeminal nucleus |
| 101 | Nucleus of the lateral olfactory tract | Nucleus of the optic tract |
| 102 | Primary somatosensory area upper limb | Nucleus of the posterior commissure |
| 103 | Primary somatosensory area lower limb | Olivary pretectal nucleus |
| 104 | Cortical amygdalar area posterior part | Anterodorsal nucleus |
| 105 | Visceral area | Posterior pretectal nucleus |
| 106 | Agranular insular area posterior part | Parataenial nucleus |
| 107 | Gustatory areas | Induseum griseum |
| 108 | Supplemental somatosensory area | Triangular nucleus of septum |
| 109 | Primary somatosensory area mouth | Paraventricular nucleus of the thalamus |
| 110 | Anterior olfactory nucleus | Interanterodorsal nucleus of the thalamus |
| 111 | Interanterodorsal nucleus of the thalamus | Medial preoptic area |
| 112 | Globus pallidus external segment | Lateral preoptic area |
| 113 | Anterodorsal preoptic nucleus | Nucleus accumbens |
| 114 | Mediodorsal nucleus of thalamus | Ventral medial nucleus of the thalamus |
| 115 | Ventral posterolateral nucleus of the thalamus | Globus pallidus internal segment |
| 116 | Median preoptic nucleus | Lateral hypothalamic area |
| 117 | Orbital area medial part | Anteroventral periventricular nucleus |
| 118 | Infralimbic area | Magnocellular nucleus |
| 119 | Prelimbic area | Dorsal peduncular area |
| 120 | Taenia tecta | Primary motor area |
| 121 | Fundus of striatum | Primary somatosensory area upper limb |
| 122 | Lateral habenula | Nucleus of the lateral olfactory tract |
| 123 | Olivary pretectal nucleus | Median preoptic nucleus |
| 124 | Entorhinal area medial part | Anterodorsal preoptic nucleus |
| 125 | Periventricular zone | Primary somatosensory area lower limb |
| 126 | Pons | Zona incerta |
| 127 | Dorsal premammillary nucleus | Agranular insular area ventral part |
| 128 | Pontine reticular nucleus | Field CA3 |
| 129 | Substantia nigra reticular part | Ventromedial hypothalamic nucleus |
| 130 | Lateral hypothalamic area | Parastrial nucleus |
| 131 | Ventral tegmental area | Primary visual area |
| 132 | Dentate gyrus | Taenia tecta |
| 133 | Lateral posterior nucleus of the thalamus | Field CA1 |
| 134 | Subthalamic nucleus | Field CA2 |
| 135 | Suprachiasmatic nucleus | Anteroventral preoptic nucleus |
| 136 | Posterolateral visual area | Retrochiasmatic area |
| 137 | Pons motor related | Infralimbic area |
| 138 | Ventromedial hypothalamic nucleus | Anterior amygdalar area |
| 139 | Retrochiasmatic area | Primary somatosensory area nose |
| 140 | Primary visual area | Submedial nucleus of the thalamus |
| 141 | Olfactory tubercle | Primary somatosensory area mouth |
| 142 | Retrosplenial area dorsal part | Secondary motor area |
| 143 | Field CA1 | Subparaventricular zone |
| 144 | Mammillary body | Primary somatosensory area trunk |
| 145 | Globus pallidus internal segment | Reticular nucleus of the thalamus |
| 146 | Arcuate hypothalamic nucleus | Periventricular hypothalamic nucleus preoptic part |
| 147 | Ventrolateral preoptic nucleus | Preparasubthalamic nucleus |
| 148 | Cuneiform nucleus | Anterior group of the dorsal thalamus |
| 149 | Tuberal nucleus | Posterior amygdalar nucleus |
| 150 | Submedial nucleus of the thalamus | Tuberal nucleus |
| 151 | Dorsal part of the lateral geniculate complex | Paracentral nucleus |
| 152 | Retrosplenial area ventral part | Cuneiform nucleus |
| 153 | Paraflocculus | Subthalamic nucleus |
| 154 | Bed nuclei of the stria terminalis | Substantia nigra reticular part |
| 155 | Anteroventral nucleus of thalamus | Entorhinal area medial part |
| 156 | Simple lobule | Parasubiculum |
| 157 | Fasciola cinerea | Orbital area medial part |
| 158 | Dorsal peduncular area | Globus pallidus external segment |
| 159 | Triangular nucleus of septum | Olfactory tubercle |
| 160 | Orbital area ventrolateral part | Supraoptic nucleus |
| 161 | Posterior pretectal nucleus | Dorsal part of the lateral geniculate complex |
| 162 | Nucleus of the posterior commissure | Medial preoptic nucleus |
| 163 | Nucleus of Darkschewitsch | Posterior complex of the thalamus |
| 164 | Frontal pole cerebral cortex | Orbital area lateral part |
| 165 | Anterior group of the dorsal thalamus | Ventral anterior-lateral complex of the thalamus |
| 166 | Vestibular nuclei | Orbital area ventrolateral part |
| 167 | Ventral posterior complex of the thalamus | Lateral dorsal nucleus of thalamus |
| 168 | Orbital area lateral part | Substantia innominata |
| 169 | Ansiform lobule | Diagonal band nucleus |
| 170 | Ventral anterior-lateral complex of the thalamus | Anterior olfactory nucleus |
| 171 | Anterodorsal nucleus | Primary somatosensory area barrel field |
| 172 | Septofimbrial nucleus | Anterior hypothalamic nucleus |
| 173 | Paracentral nucleus | Medial amygdalar nucleus |
| 174 | Posterior complex of the thalamus | Bed nuclei of the stria terminalis |
| 175 | Ventral medial nucleus of the thalamus | Ventral posterior complex of the thalamus |
| 176 | Central lateral nucleus of the thalamus | Frontal pole cerebral cortex |
| 177 | Lateral dorsal nucleus of thalamus | Lateral posterior nucleus of the thalamus |
| 178 | Parafascicular nucleus | Bed nucleus of the accessory olfactory tract |
Discussion
The present study used unbiased single-cell whole-brain imaging to identify changes in brain functional architecture after withdrawal from chronic exposure to psychostimulants. Withdrawal from psychostimulants resulted in increased functional connectivity that was associated with a decrease in modularity with varying degrees of severity, depending on the drug, compared with control mice. This decreased modularity resulted in the emergence of new network architecture and organization of the brain. Using graph theory, we identified brain regions that are most responsible for intermodular and intramodular communication within each network. Withdrawal from all of the psychostimulants that were tested in the present study resulted in different network organization than the control network. The methamphetamine and cocaine withdrawal networks closely resembled each other in structural organization, primarily through thalamic motifs, whereas the nicotine withdrawal network shared some similarities with the control network. These unbiased whole-brain analyses demonstrate that psychostimulant withdrawal produces the drug-dependent remodeling of functional architecture of the brain and suggest that decreased modularity of the brain functional network may be a central feature of withdrawal.
Changes to modularity and structure of the brain caused by psychostimulant withdrawal
We found that cocaine, methamphetamine, and nicotine withdrawal produced major increases in functional connectivity throughout the brain compared with control mice. We further found that withdrawal resulted in a decrease in modular structuring of the brain compared with control mice (seven modules). The decrease in modularity was most evident for methamphetamine withdrawal (three modules) and cocaine withdrawal (four modules), whereas nicotine withdrawal showed a smaller reduction of modularity (five modules). Using the same approaches (i.e., whole-brain network analysis of Fos) reduced modularity after abstinence from alcohol dependence in mice was similarly found (Kimbrough et al., 2020). Further, humans who suffer from dementia and traumatic brain injury have shown reduced modularity that is associated with cognitive deficits (de Haan et al., 2012; Brier et al., 2014; Arnemann et al., 2015; Gallen et al., 2016; Sporns and Betzel, 2016; Bertolero et al., 2018). Changes in network structure/functional connectivity (Tomasi et al., 2010; Konova et al., 2013, 2015; Ma et al., 2015) and cognitive function (Spronk et al., 2013; Ashare et al., 2014; Sabrini et al., 2019) have been observed after chronic drug use and withdrawal, suggesting that similar mechanisms may be active between these different neural disorders.
Features of psychostimulant networks
We examined the components of individual modules within each network and found that the control network was heavily driven by sensory and motor brain regions. This result confers validity to our single-cell whole-brain network analysis approach for characterizing network features because it fits with what might be expected from a normal, awake, behaving animal that explores the environment and relies heavily on sensory/motor systems. Furthermore, the control network was more interconnected between modules overall and contained several regions that could be classified as hubs of each module that are critical for network function, based on high intramodular and intermodular connectivity. This suggests that the control brain may be more resilient to the disruption of function because additional hub regions may compensate more easily in response to such disruptions.
In the networks that were associated with withdrawal from psychostimulants, a shift was observed from sensory/motor regions to more subcortical (e.g., amygdalar, thalamic, hypothalamic, and midbrain) regions that drive the network. A similar effect was seen in nonhuman primates after cocaine abstinence (Murnane et al., 2015), and alterations of functional connectivity of the somatosensory cortex are associated with smokers (Claus and Weywadt, 2020). This may represent a shift from top-down cortical network control (Gilbert and Sigman, 2007) to bottom-up subcortical network control and may reflect the greater influence of internal drives that are associated with negative affect during withdrawal in controlling the whole-brain network (Koob, 2015). This shift may be a major reason why drugs are so addictive because higher cortical functional connectivity in humans may protect against relapse (McHugh et al., 2017).
Given the modular organization of the different networks, both the control network and nicotine network had a much higher incidence of intermodular connectivity, whereas the methamphetamine and cocaine networks had only a small subset of brain regions that were connected between different modules. Similar changes in neural activity, combined with decreases in interconnectivity and network efficiency, have been observed in humans after psychostimulant use (Ahmadlou et al., 2013; Wang et al., 2015; Liang et al., 2015). The nicotine network was different from the methamphetamine and cocaine networks and somewhat resembled a slightly altered control network. Similarities and differences in network properties of the three different drugs are likely to be caused by differences in receptor mechanisms and locations where each drug acts throughout the brain. Indeed, both cocaine and methamphetamine target the same dopamine transporter, whereas nicotine acts on nicotinic receptors (Rothman and Baumann, 2003; Nestler, 2005; Sulzer et al., 2005; D’Souza and Markou, 2011).
The interanterodorsal nucleus of the thalamus was disconnected from the nicotine network, suggesting that it may not be involved in controlling the withdrawal network, although we cannot exclude the possibility that its disconnection may instead be a critical feature of nicotine withdrawal. One of the larger modules in the nicotine network was driven by several brain regions, two of which included the AAA and AIv, which have been suggested to be associated with nicotine withdrawal in humans (Naqvi et al., 2007; Sutherland et al., 2013). The methamphetamine and cocaine networks, although having distinctly different features, shared an overall motif of lower modularity and being heavily driven by thalamic brain regions. This suggests that, in a destabilized and less structured neural network, the thalamus becomes more critical to controlling the whole-brain network. The thalamus is thought to play a major role in relaying information, and the reliance of these networks on this group of regions suggests that the thalamus is not simply a relay station but has greater importance in cognitive and emotional function (Sherman, 2007; Ahissar and Oram, 2015). Substantial evidence corroborates the importance of the thalamus in psychostimulant addiction and withdrawal. In a rat model of cocaine self-administration, the thalamus was found to be heavily involved in network function during acute abstinence, but changes in the network disappeared after two weeks (Orsini et al., 2018). Interestingly, the thalamus in humans has been shown to be hypoactive in cocaine abusers (Tomasi et al., 2007), and thalamic connectivity is predictive of cocaine dependence (Zhang et al., 2016) and altered in infants who are exposed to cocaine (Salzwedel et al., 2016). Although network changes that are induced by acute withdrawal are reversed over time (Orsini et al., 2018), prolonged use may lead to more permanent restructuring of the brain, and major differences between the nicotine and methamphetamine/cocaine networks may account for differences in the severity of each drug after long-term use (Nestler, 2005; Grant et al., 2012; Spronk et al., 2013).
In conclusion, in the past 40 years, the substance use disorder field has made tremendous progress by identifying numerous brain regions that are dysregulated after psychostimulant exposure and contribute to withdrawal behaviors (Kalivas and McFarland, 2003; Robinson and Kolb, 2004; Kalivas, 2007; Everitt et al., 2008; Jedynak et al., 2012; Koob and Volkow, 2016; Bobadilla et al., 2017). The present results confirm that a substantial number of brain regions are affected by psychostimulant exposure and suggest that a common pathway that is associated with withdrawal may not reside at the level of brain regions or even single neural circuits. Instead, these results suggest that the main common phenomenon that is observed among all three of these psychostimulants is decreased modularity of whole-brain functional architecture, suggesting that a common feature may reside at the whole-network level. This interpretation is consistent with the literature on the modularity of complex systems, including the brain and mind, showing that lower modularity reduces the capacity of the system to adapt to its environment (Kashtan and Alon, 2005). It is however worth noting that further studies will be necessary to determine whether lower modularity is simply a feature of increased functional connectivity regardless of whether it is because of withdrawal or other mechanisms. One limitation of the present study is that it did not assess withdrawal behaviors after minipump removal for comparison to network changes. This was done to avoid confounds as to the source of Fos production (e.g., withdrawal or behavioral testing). Another limitation of the present study is the lack of direct comparisons between neural activation of each treatment. The approaches used within this study can be leveraged to study and better understand numerous cognitive states (Smith and Kimbrough, 2020; Simpson et al., 2021). However, in the future assessing neural and network differences in more quantitative ways will be necessary.
In summary, the present study showed that withdrawal from psychostimulants results in changes in neural network structure, including increases in functional connectivity among brain regions and decreases in modularity. Psychostimulant withdrawal resulted in a shift from a sensory/motor-driven network to a network that is highly driven by subcortical regions. We also found that different psychostimulants do not produce the same neural networks, although methamphetamine and cocaine shared similar properties. These findings shed light on alterations of brain function that are caused by drug exposure and identify potential brain regions that warrant future study. The present study demonstrates that psychostimulant withdrawal produces drug-dependent remodeling of the functional architecture of the brain and suggests that decreased modularity of the brain functional networks may be a common feature of withdrawal. These findings may prove critical to designing future treatment approaches for withdrawal symptoms.
Synthesis
Reviewing Editor: Yavin Shaham, NIDA-IRP/NIH
Decisions are customarily a result of the Reviewing Editor and the peer reviewers coming together and discussing their recommendations until a consensus is reached. When revisions are invited, a fact-based synthesis statement explaining their decision and outlining what is needed to prepare a revision will be listed below. The following reviewer(s) agreed to reveal their identity: NONE. Note: If this manuscript was transferred from JNeurosci and a decision was made to accept the manuscript without peer review, a brief statement to this effect will instead be what is listed below.
The authors satisfactory addressed many of the comments of the reviewers but one of the reviewers continue to raise significant technical concerns that should be addressed in the revision. Note that while reviewer 1 was initially very positive, after the editorial consultations the reviewer agreed that the technical concerns of reviewer 2 are valid and should be addressed in the revision. In the revision, we recommend moving most supplemental figures to the main text, and also include the new validation figures in the main text. I enclose the original reviewers’ comments below.
REVIEWER 1
The authors have addressed all my concerns by providing the requested supplementary data and by limiting the discussion to drug withdrawal. I look forward to future studies testing whether (and how) the identified network shifts affect drug-seeking.
REVIEWER 2
I apologize for the negative comments that follow, but I feel more technical questions have been raised by the inclusion of the new Extended Figure 1 than have been answered. I am uncomfortable reviewing the major biological findings of the manuscript until the technical concerns have been addressed properly. I believed this would be easy for the authors to accomplish, since such validation of their staining, imagining, and analysis must have been performed, but it is not shown in the resubmission.
Specifically, my technical concerns are not alleviated by the data shown in the resubmission. Because of the omission of raw data in the initial submission, my main critique was to include raw data in the resubmission, along with some validation of cell segmentation and brain registration. Since the graph theory analysis, which is the cornerstone of this manuscript, depends on accurate cell segmentation and brain registration, the continued omission of detailed raw data or validation is troubling.
Specifically, I asked: “ Representative IHC planes from the imaged volumes, both zoomed out for the whole plane and insets with areas of interest, of regions with significant differences between groups that are used in further analysis.”
In response, Extended Figure 1 includes low-resolution insets from a single plane within the hippocampus. These representative images raise more questions and concerns than they answer. The comparison I will draw is to papers using standard Fos IHC, where at a minimum I would ask for clear representative images from each condition. With an approach like whole brain imaging, there is an even greater need for such images and validation experiments. How consistent is staining throughout the whole volume? How consistent is imaging throughout the whole volume? How were the parameters for automated ClearMap segmentation validated?
I am surprised that such images are not being highlighted in this manuscript, like most other whole brain papers, so that readers can appreciate the scope of the data provided by this method!
These images should be easy to produce, as the full analysis is based on them. It is troubling that they are not. At the very least Extended Figure 1 should be included as a main figure so that readers of the manuscript can judge the quality of whole brain staining and imaging within the context of the more computational analysis provided. It should not be hidden in the Extended Figures.
Again, until the technical concerns are alleviated I will not comment on the interpretation of the data.
References
- Ahissar E, Oram T (2015) Thalamic relay or cortico-thalamic processing? Old question, new answers. Cereb Cortex 25:845–848. 10.1093/cercor/bht296 [DOI] [PubMed] [Google Scholar]
- Ahmadlou M, Ahmadi K, Rezazade M, Azad-Marzabadi E (2013) Global organization of functional brain connectivity in methamphetamine abusers. Clin Neurophysiol 124:1122–1131. 10.1016/j.clinph.2012.12.003 [DOI] [PubMed] [Google Scholar]
- Allen Institute for Brain Science (2004) Allen mouse brain atlas. Allen Institute for Brain Science. Available at http://mouse.brain-map.org/. [Google Scholar]
- Arnemann KL, Chen AJ, Novakovic-Agopian T, Gratton C, Nomura EM, D’Esposito M (2015) Functional brain network modularity predicts response to cognitive training after brain injury. Neurology 84:1568–1574. [DOI] [PMC free article] [PubMed] [Google Scholar]
- Ashare RL, Falcone M, Lerman C (2014) Cognitive function during nicotine withdrawal: implications for nicotine dependence treatment. Neuropharmacology 76 [Pt B]:581–591. [DOI] [PMC free article] [PubMed] [Google Scholar]
- Babu M, Vlasblom J, Pu S, Guo X, Graham C, Bean BDM, Burston HE, Vizeacoumar FJ, Snider J, Phanse S, Fong V, Tam YYC, Davey M, Hnatshak O, Bajaj N, Chandran S, Punna T, Christopolous C, Wong V, Yu A, et al. (2012) Interaction landscape of membrane-protein complexes in Saccharomyces cerevisiae. Nature 489:585–589. [DOI] [PubMed] [Google Scholar]
- Balfour DJK (2008) The psychobiology of nicotine dependence. Eur Respir Rev 17:172–181. 10.1183/09059180.00011001 [DOI] [Google Scholar]
- Barabasi AL (2009) Scale-free networks: a decade and beyond. Science 325:412–413. [DOI] [PubMed] [Google Scholar]
- Bargmann CI, Marder E (2013) From the connectome to brain function. Nat Methods 10:483–490. 10.1038/nmeth.2451 [DOI] [PubMed] [Google Scholar]
- Bastian M, Heymann S, Jacomy M (2009) Gephi: an open source software for exploring and manipulating networks. International AAAI Conference on Weblogs and Social Media. [Google Scholar]
- Benuck M, Lajtha A, Reith ME (1987) Pharmacokinetics of systemically administered cocaine and locomotor stimulation in mice. J Pharmacol Exp Ther 243:144–149. [PubMed] [Google Scholar]
- Bertolero MA, Yeo BTT, Bassett DS, D’Esposito M (2018) A mechanistic model of connector hubs, modularity and cognition. Nat Hum Behav 2:765–777. 10.1038/s41562-018-0420-6 [DOI] [PMC free article] [PubMed] [Google Scholar]
- Bobadilla AC, Heinsbroek JA, Gipson CD, Griffin WC, Fowler CD, Kenny PJ, Kalivas PW (2017) Corticostriatal plasticity, neuronal ensembles, and regulation of drug-seeking behavior. Prog Brain Res 235:93–112. [DOI] [PMC free article] [PubMed] [Google Scholar]
- Brier MR, Thomas JB, Fagan AM, Hassenstab J, Holtzman DM, Benzinger TL, Morris JC, Ances BM (2014) Functional connectivity and graph theory in preclinical Alzheimer’s disease. Neurobiol Aging 35:757–768. [DOI] [PMC free article] [PubMed] [Google Scholar]
- Chen G, Chen G, Xie C, Li SJ (2011) Negative functional connectivity and its dependence on the shortest path length of positive network in the resting-state human brain. Brain Connect 1:195–206. 10.1089/brain.2011.0025 [DOI] [PMC free article] [PubMed] [Google Scholar]
- Chiang AS, Lin CY, Chuang CC, Chang HM, Hsieh CH, Yeh CW, Shih CT, Wu JJ, Wang GT, Chen YC, Wu CC, Chen GY, Ching YT, Lee PC, Lin CY, Lin HH, Wu CC, Hsu HW, Huang YA, Chen JY, et al. (2011) Three-dimensional reconstruction of brain-wide wiring networks in Drosophila at single-cell resolution. Curr Biol 21:1–11. [DOI] [PubMed] [Google Scholar]
- Cho AK, Melega WP, Kuczenski R, Segal DS (2001) Relevance of pharmacokinetic parameters in animal models of methamphetamine abuse. Synapse 39:161–166. 10.1002/1098-2396(200102)39:2<161::AID-SYN7>3.0.CO;2-E [DOI] [PubMed] [Google Scholar]
- Claus ED, Weywadt CR (2020) Resting-state connectivity in former, current and never smokers. Nicotine Tob Res 22:180–187. [DOI] [PubMed] [Google Scholar]
- Cohen JR, D’Esposito M (2016) The segregation and integration of distinct brain networks and their relationship to cognition. J Neurosci 36:12083–12094. [DOI] [PMC free article] [PubMed] [Google Scholar]
- de Haan W, Van Der Flier WM, Koene T, Smits LL, Scheltens P, Stam CJ (2012) Disrupted modular brain dynamics reflect cognitive dysfunction in Alzheimer’s disease. Neuroimage 59:3085–3093. [DOI] [PubMed] [Google Scholar]
- D’Souza MS, Markou A (2011) Neuronal mechanisms underlying development of nicotine dependence: implications for novel smoking-cessation treatments. Addict Sci Clin Pract 6:4–16. [PMC free article] [PubMed] [Google Scholar]
- Eisener-Dorman AF, Grabowski-Boase L, Tarantino LM (2011) Cocaine locomotor activation, sensitization and place preference in six inbred strains of mice. Behav Brain Funct 7:29. [DOI] [PMC free article] [PubMed] [Google Scholar]
- Everitt BJ, Belin D, Economidou D, Pelloux Y, Dalley JW, Robbins TW (2008) Review. Neural mechanisms underlying the vulnerability to develop compulsive drug-seeking habits and addiction. Philos Trans R Soc Lond B Biol Sci 363:3125–3135. [DOI] [PMC free article] [PubMed] [Google Scholar]
- Fish EW, Riday TT, Mcguigan MM, Faccidomo S, Hodge CW, Malanga CJ (2010) Alcohol, cocaine, and brain stimulation-reward in C57Bl6/J and DBA2/J mice. Alcohol Clin Exp Res 34:81–89. [DOI] [PMC free article] [PubMed] [Google Scholar]
- Gallen CL, Baniqued PL, Chapman SB, Aslan S, Keebler M, Didehbani N, D’Esposito M (2016) Modular brain network organization predicts response to cognitive training in older adults. PLoS One 11:e0169015. [DOI] [PMC free article] [PubMed] [Google Scholar]
- Gilbert CD, Sigman M (2007) Brain states: top-down influences in sensory processing. Neuron 54:677–696. [DOI] [PubMed] [Google Scholar]
- Giove F, Gili T, Iacovella V, Macaluso E, Maraviglia B (2009) Images-based suppression of unwanted global signals in resting-state functional connectivity studies. Magn Reson Imaging 27:1058–1064. [DOI] [PubMed] [Google Scholar]
- Grant KM, Levan TD, Wells SM, Li M, Stoltenberg SF, Gendelman HE, Carlo G, Bevins RA (2012) Methamphetamine-associated psychosis. J Neuroimmune Pharmacol 7:113–139. [DOI] [PMC free article] [PubMed] [Google Scholar]
- Guimera R, Nunes Amaral LA (2005) Functional cartography of complex metabolic networks. Nature 433:895–900. [DOI] [PMC free article] [PubMed] [Google Scholar]
- Jacomy M, Venturini T, Heymann S, Bastian M (2014) ForceAtlas2, a continuous graph layout algorithm for handy network visualization designed for the Gephi software. PLoS One 9:e98679. [DOI] [PMC free article] [PubMed] [Google Scholar]
- Jarrell TA, Wang Y, Bloniarz AE, Brittin CA, Xu M, Thomson JN, Albertson DG, Hall DH, Emmons SW (2012) The connectome of a decision-making neural network. Science 337:437–444. [DOI] [PubMed] [Google Scholar]
- Jedynak JP, Cameron CM, Robinson TE (2012) Repeated methamphetamine administration differentially alters fos expression in caudate-putamen patch and matrix compartments and nucleus accumbens. PLoS One 7:e34227. [DOI] [PMC free article] [PubMed] [Google Scholar]
- Jeong H, Mason SP, Barabasi AL, Oltvai ZN (2001) Lethality and centrality in protein networks. Nature 411:41–42. [DOI] [PubMed] [Google Scholar]
- Johnson PM, Hollander JA, Kenny PJ (2008) Decreased brain reward function during nicotine withdrawal in C57BL6 mice: evidence from intracranial self-stimulation (ICSS) studies. Pharmacol Biochem Behav 90:409–415. [DOI] [PMC free article] [PubMed] [Google Scholar]
- Kalivas PW (2007) Cocaine and amphetamine-like psychostimulants: neurocircuitry and glutamate neuroplasticity. Dialogues Clin Neurosci 9:389–397. [DOI] [PMC free article] [PubMed] [Google Scholar]
- Kalivas PW, Mcfarland K (2003) Brain circuitry and the reinstatement of cocaine-seeking behavior. Psychopharmacology (Berl) 168:44–56. 10.1007/s00213-003-1393-2 [DOI] [PubMed] [Google Scholar]
- Kashtan N, Alon U (2005) Spontaneous evolution of modularity and network motifs. Proc Natl Acad Sci USA 102:13773–13778. [DOI] [PMC free article] [PubMed] [Google Scholar]
- Kimbrough A, Lurie DJ, Collazo A, Kreifeldt M, Sidhu H, Macedo GC, D’Esposito M, Contet C, George O (2020) Brain-wide functional architecture remodeling by alcohol dependence and abstinence. Proc Natl Acad Sci USA 117:2149–2159. [DOI] [PMC free article] [PubMed] [Google Scholar]
- Kirst C, Skriabine S, Vieites-Prado A, Topilko T, Bertin P, Gerschenfeld G, Verny F, Topilko P, Michalski N, Tessier-Lavigne M, Renier N (2020) Mapping the fine-scale organization and plasticity of the brain vasculature. Cell 180:780–795.e25. [DOI] [PubMed] [Google Scholar]
- Konova AB, Moeller SJ, Tomasi D, Volkow ND, Goldstein RZ (2013) Effects of methylphenidate on resting-state functional connectivity of the mesocorticolimbic dopamine pathways in cocaine addiction. JAMA Psychiatry 70:857–868. [DOI] [PMC free article] [PubMed] [Google Scholar]
- Konova AB, Moeller SJ, Tomasi D, Goldstein RZ (2015) Effects of chronic and acute stimulants on brain functional connectivity hubs. Brain Res 1628:147–156. [DOI] [PMC free article] [PubMed] [Google Scholar]
- Koob GF (2015) The dark side of emotion: the addiction perspective. Eur J Pharmacol 753:73–87. [DOI] [PMC free article] [PubMed] [Google Scholar]
- Koob GF, Volkow ND (2016) Neurobiology of addiction: a neurocircuitry analysis. Lancet Psychiatry 3:760–773. [DOI] [PMC free article] [PubMed] [Google Scholar]
- Liang X, He Y, Salmeron BJ, Gu H, Stein EA, Yang Y (2015) Interactions between the salience and default-mode networks are disrupted in cocaine addiction. J Neurosci 35:8081–8090. [DOI] [PMC free article] [PubMed] [Google Scholar]
- Liebmann T, Renier N, Bettayeb K, Greengard P, Tessier-Lavigne M, Flajolet M (2016) Three-dimensional study of Alzheimer’s disease hallmarks using the iDISCO clearing method. Cell Rep 16:1138–1152. [DOI] [PMC free article] [PubMed] [Google Scholar]
- Ma L, Steinberg JL, Moeller FG, Johns SE, Narayana PA (2015) Effect of cocaine dependence on brain connections: clinical implications. Expert Rev Neurother 15:1307–1319. [DOI] [PMC free article] [PubMed] [Google Scholar]
- Markov NT, Ercsey-Ravasz MM, Ribeiro Gomes AR, Lamy C, Magrou L, Vezoli J, Misery P, Falchier A, Quilodran R, Gariel MA, Sallet J, Gamanut R, Huissoud C, Clavagnier S, Giroud P, Sappey-Marinier D, Barone P, Dehay C, Toroczkai Z, Knoblauch K, et al. (2014) A weighted and directed interareal connectivity matrix for macaque cerebral cortex. Cereb Cortex 24:17–36. [Database] 10.1093/cercor/bhs270 [DOI] [PMC free article] [PubMed] [Google Scholar]
- Mchugh MJ, Gu H, Yang Y, Adinoff B, Stein EA (2017) Executive control network connectivity strength protects against relapse to cocaine use. Addict Biol 22:1790–1801. [DOI] [PubMed] [Google Scholar]
- Meunier D, Achard S, Morcom A, Bullmore E (2009) Age-related changes in modular organization of human brain functional networks. Neuroimage 44:715–723. [DOI] [PubMed] [Google Scholar]
- Murnane KS, Gopinath KS, Maltbie E, Daunais JB, Telesford QK, Howell LL (2015) Functional connectivity in frontal-striatal brain networks and cocaine self-administration in female rhesus monkeys. Psychopharmacology (Berl) 232:745–754. [DOI] [PMC free article] [PubMed] [Google Scholar]
- Murphy K, Birn RM, Handwerker DA, Jones TB, Bandettini PA (2009) The impact of global signal regression on resting state correlations: are anti-correlated networks introduced? Neuroimage 44:893–905. 10.1016/j.neuroimage.2008.09.036 [DOI] [PMC free article] [PubMed] [Google Scholar]
- Naqvi NH, Rudrauf D, Damasio H, Bechara A (2007) Damage to the insula disrupts addiction to cigarette smoking. Science 315:531–534. [DOI] [PMC free article] [PubMed] [Google Scholar]
- Nestler EJ (2005) The neurobiology of cocaine addiction. Sci Pract Perspect 3:4–10. [DOI] [PMC free article] [PubMed] [Google Scholar]
- Norman AB, Tabet MR, Norman MK, Buesing WR, Pesce AJ, Ball WJ (2007) A chimeric human/murine anticocaine monoclonal antibody inhibits the distribution of cocaine to the brain in mice. J Pharmacol Exp Ther 320:145–153. [DOI] [PubMed] [Google Scholar]
- Oh SW, Harris JA, Ng L, Winslow B, Cain N, Mihalas S, Wang Q, Lau C, Kuan L, Henry AM, Mortrud MT, Ouellette B, Nguyen Tn, Sorensen SA, Slaughterbeck CR, Wakeman W, Li Y, Feng D, Ho A, Nicholas E, et al. (2014) A mesoscale connectome of the mouse brain. Nature 508:207–214. [DOI] [PMC free article] [PubMed] [Google Scholar]
- Orsini CA, Colon-Perez LM, Heshmati SC, Setlow B, Febo M (2018) Functional connectivity of chronic cocaine use reveals progressive neuroadaptations in neocortical, striatal, and limbic networks. eNeuro 5:ENEURO.0081-18.2018. [DOI] [PMC free article] [PubMed] [Google Scholar]
- Phillips KA, Epstein DH, Preston KL (2014) Psychostimulant addiction treatment. Neuropharmacology 87:150–160. [DOI] [PMC free article] [PubMed] [Google Scholar]
- Power JD, Schlaggar BL, Lessov-Schlaggar CN, Petersen SE (2013) Evidence for hubs in human functional brain networks. Neuron 79:798–813. [DOI] [PMC free article] [PubMed] [Google Scholar]
- Qian K, Liu J, Cao Y, Yang J, Qiu S (2021) Intraperitoneal injection of lithium chloride induces lateralized activation of the insular cortex in adult mice. Mol Brain 14:71. [DOI] [PMC free article] [PubMed] [Google Scholar]
- Renier N, Wu Z, Simon Dj, Yang J, Ariel P, Tessier-Lavigne M (2014) iDISCO: a simple, rapid method to immunolabel large tissue samples for volume imaging. Cell 159:896–910. 10.1016/j.cell.2014.10.010 [DOI] [PubMed] [Google Scholar]
- Renier N, Adams EL, Kirst C, Wu Z, Azevedo R, Kohl J, Autry AE, Kadiri L, Umadevi Venkataraju K, Zhou Y, Wang VX, Tang CY, Olsen O, Dulac C, Osten P, Tessier-Lavigne M (2016) Mapping of brain activity by automated volume analysis of immediate early genes. Cell 165:1789–1802. [DOI] [PMC free article] [PubMed] [Google Scholar]
- Robinson Te, Kolb B (2004) Structural plasticity associated with exposure to drugs of abuse. Neuropharmacology 47 [Suppl 1]:33–46. [DOI] [PubMed] [Google Scholar]
- Rothman Rb, Baumann MH (2003) Monoamine transporters and psychostimulant drugs. Eur J Pharmacol 479:23–40. [DOI] [PubMed] [Google Scholar]
- Rubinov M, Sporns O (2010) Complex network measures of brain connectivity: uses and interpretations. Neuroimage 52:1059–1069. [DOI] [PubMed] [Google Scholar]
- Sabrini S, Wang GY, Lin JC, Ian JK, Curley LE (2019) Methamphetamine use and cognitive function: a systematic review of neuroimaging research. Drug Alcohol Depend 194:75–87. 10.1016/j.drugalcdep.2018.08.041 [DOI] [PubMed] [Google Scholar]
- Salzwedel AP, Grewen KM, Goldman BD, Gao W (2016) Thalamocortical functional connectivity and behavioral disruptions in neonates with prenatal cocaine exposure. Neurotoxicol Teratol 56:16–25. [DOI] [PMC free article] [PubMed] [Google Scholar]
- Shabani S, Mckinnon CS, Cunningham CL, Phillips TJ (2012) Profound reduction in sensitivity to the aversive effects of methamphetamine in mice bred for high methamphetamine intake. Neuropharmacology 62:1134–1141. [DOI] [PMC free article] [PubMed] [Google Scholar]
- Sherman SM (2007) The thalamus is more than just a relay. Curr Opin Neurobiol 17:417–422. [DOI] [PMC free article] [PubMed] [Google Scholar]
- Simpson S, Chen Y, Wellmeyer E, Smith LC, Montes BA, George O, Kimbrough A (2021) The hidden brain: uncovering previously overlooked brain regions by employing novel preclinical unbiased network approaches. Front Syst Neuroscil 15:595507. [DOI] [PMC free article] [PubMed] [Google Scholar]
- Siu EC, Tyndale RF (2007) Characterization and comparison of nicotine and cotinine metabolism in vitro and in vivo in DBA/2 and C57BL/6 mice. Mol Pharmacol 71:826–834. 10.1124/mol.106.032086 [DOI] [PubMed] [Google Scholar]
- Smith LC, Kimbrough A (2020) Leveraging neural networks in preclinical alcohol research. Brain Sci 10:578. [DOI] [PMC free article] [PubMed] [Google Scholar]
- Sporns O, Betzel RF (2016) Modular brain networks. Annu Rev Psychol 67:613–640. [DOI] [PMC free article] [PubMed] [Google Scholar]
- Sporns O, Honey CJ, Kotter R (2007) Identification and classification of hubs in brain networks. PLoS One 2:e1049. [DOI] [PMC free article] [PubMed] [Google Scholar]
- Spronk DB, Van Wel JH, Ramaekers JQ, Verkes RJ (2013) Characterizing the cognitive effects of cocaine: a comprehensive review. Neurosci Biobehav Rev 37:1838–1859. [DOI] [PubMed] [Google Scholar]
- Stoker AK, Markou A (2011) Withdrawal from chronic cocaine administration induces deficits in brain reward function in C57BL/6J mice. Behav Brain Res 223:176–181. [DOI] [PMC free article] [PubMed] [Google Scholar]
- Stoker AK, Olivier B, Markou A (2012) Involvement of metabotropic glutamate receptor 5 in brain reward deficits associated with cocaine and nicotine withdrawal and somatic signs of nicotine withdrawal. Psychopharmacology (Berl) 221:317–327. 10.1007/s00213-011-2578-8 [DOI] [PMC free article] [PubMed] [Google Scholar]
- Sulzer D, Sonders MS, Poulsen NW, Galli A (2005) Mechanisms of neurotransmitter release by amphetamines: a review. Prog Neurobiol 75:406–433. [DOI] [PubMed] [Google Scholar]
- Sutherland MT, Carroll AJ, Salmeron BJ, Ross TJ, Hong LE, Stein EA (2013) Down-regulation of amygdala and insula functional circuits by varenicline and nicotine in abstinent cigarette smokers. Biol Psychiatry 74:538–546. [DOI] [PMC free article] [PubMed] [Google Scholar]
- Tomasi D, Goldstein RZ, Telang F, Maloney T, Alia-Klein N, Caparelli EC, Volkow ND (2007) Thalamo-cortical dysfunction in cocaine abusers: implications in attention and perception. Psychiatry Res 155:189–201. [DOI] [PMC free article] [PubMed] [Google Scholar]
- Tomasi D, Volkow ND, Wang R, Carrillo JH, Maloney T, Alia-Klein N, Woicik PA, Telang F, Goldstein RZ (2010) Disrupted functional connectivity with dopaminergic midbrain in cocaine abusers. PLoS One 5:e10815. [DOI] [PMC free article] [PubMed] [Google Scholar]
- Tracy ME, Banks ML, Shelton KL (2016) Negative allosteric modulation of GABAA receptors inhibits facilitation of brain stimulation reward by drugs of abuse in C57BL6/J mice. Psychopharmacology (Berl) 233:715–725. 10.1007/s00213-015-4155-z [DOI] [PMC free article] [PubMed] [Google Scholar]
- Varshney LR, Chen BL, Paniagua E, Hall DH, Chklovskii DB (2011) Structural properties of the Caenorhabditis elegans neuronal network. PLoS Comput Biol 7:e1001066. [DOI] [PMC free article] [PubMed] [Google Scholar]
- Vetere G, Kenney JW, Tran LM, Xia F, Steadman PE, Parkinson J, Josselyn SA, Frankland PW (2017) Chemogenetic Interrogation of a brain-wide fear memory network in mice. Neuron 94:363–374.e4. [DOI] [PubMed] [Google Scholar]
- Wang Z, Suh J, Li Z, Li Y, Franklin T, O’Brien C, Childress AR (2015) A hyper-connected but less efficient small-world network in the substance-dependent brain. Drug Alcohol Depend 152:102–108. [DOI] [PMC free article] [PubMed] [Google Scholar]
- Wheeler AL, Teixeira CM, Wang AH, Xiong X, Kovacevic N, Lerch JP, Mcintosh AR, Parkinson J, Frankland PW (2013) Identification of a functional connectome for long-term fear memory in mice. PLoS Comput Biol 9:e1002853. [DOI] [PMC free article] [PubMed] [Google Scholar]
- Zhang S, Hu S, Sinha R, Potenza MN, Malison RT, Li CS (2016) Cocaine dependence and thalamic functional connectivity: a multivariate pattern analysis. Neuroimage Clin 12:348–358. 10.1016/j.nicl.2016.08.006 [DOI] [PMC free article] [PubMed] [Google Scholar]
- Zhu J, Zhao N, Chen Y, Zhu L, Zhong Q, Liu J, Chen T (2017) Sodium butyrate modulates a methamphetamine-induced conditioned place preference. J Neurosci Res 95:1044–1052. [DOI] [PubMed] [Google Scholar]
Associated Data
This section collects any data citations, data availability statements, or supplementary materials included in this article.
Supplementary Materials
Fos counts of brain regions showing significant differences between a treatment and saline. Download Figure 2-1, TIF file (32.1MB, tif) .
Table of raw Fos values and group SEMs for each treatment. Download Figure 2-2, XLS file (108.5KB, xls) .
Pearson correlation matrices for showing functional connectivity measures of each treatment. Download Figure 3-1, TIF file (32.1MB, tif) .