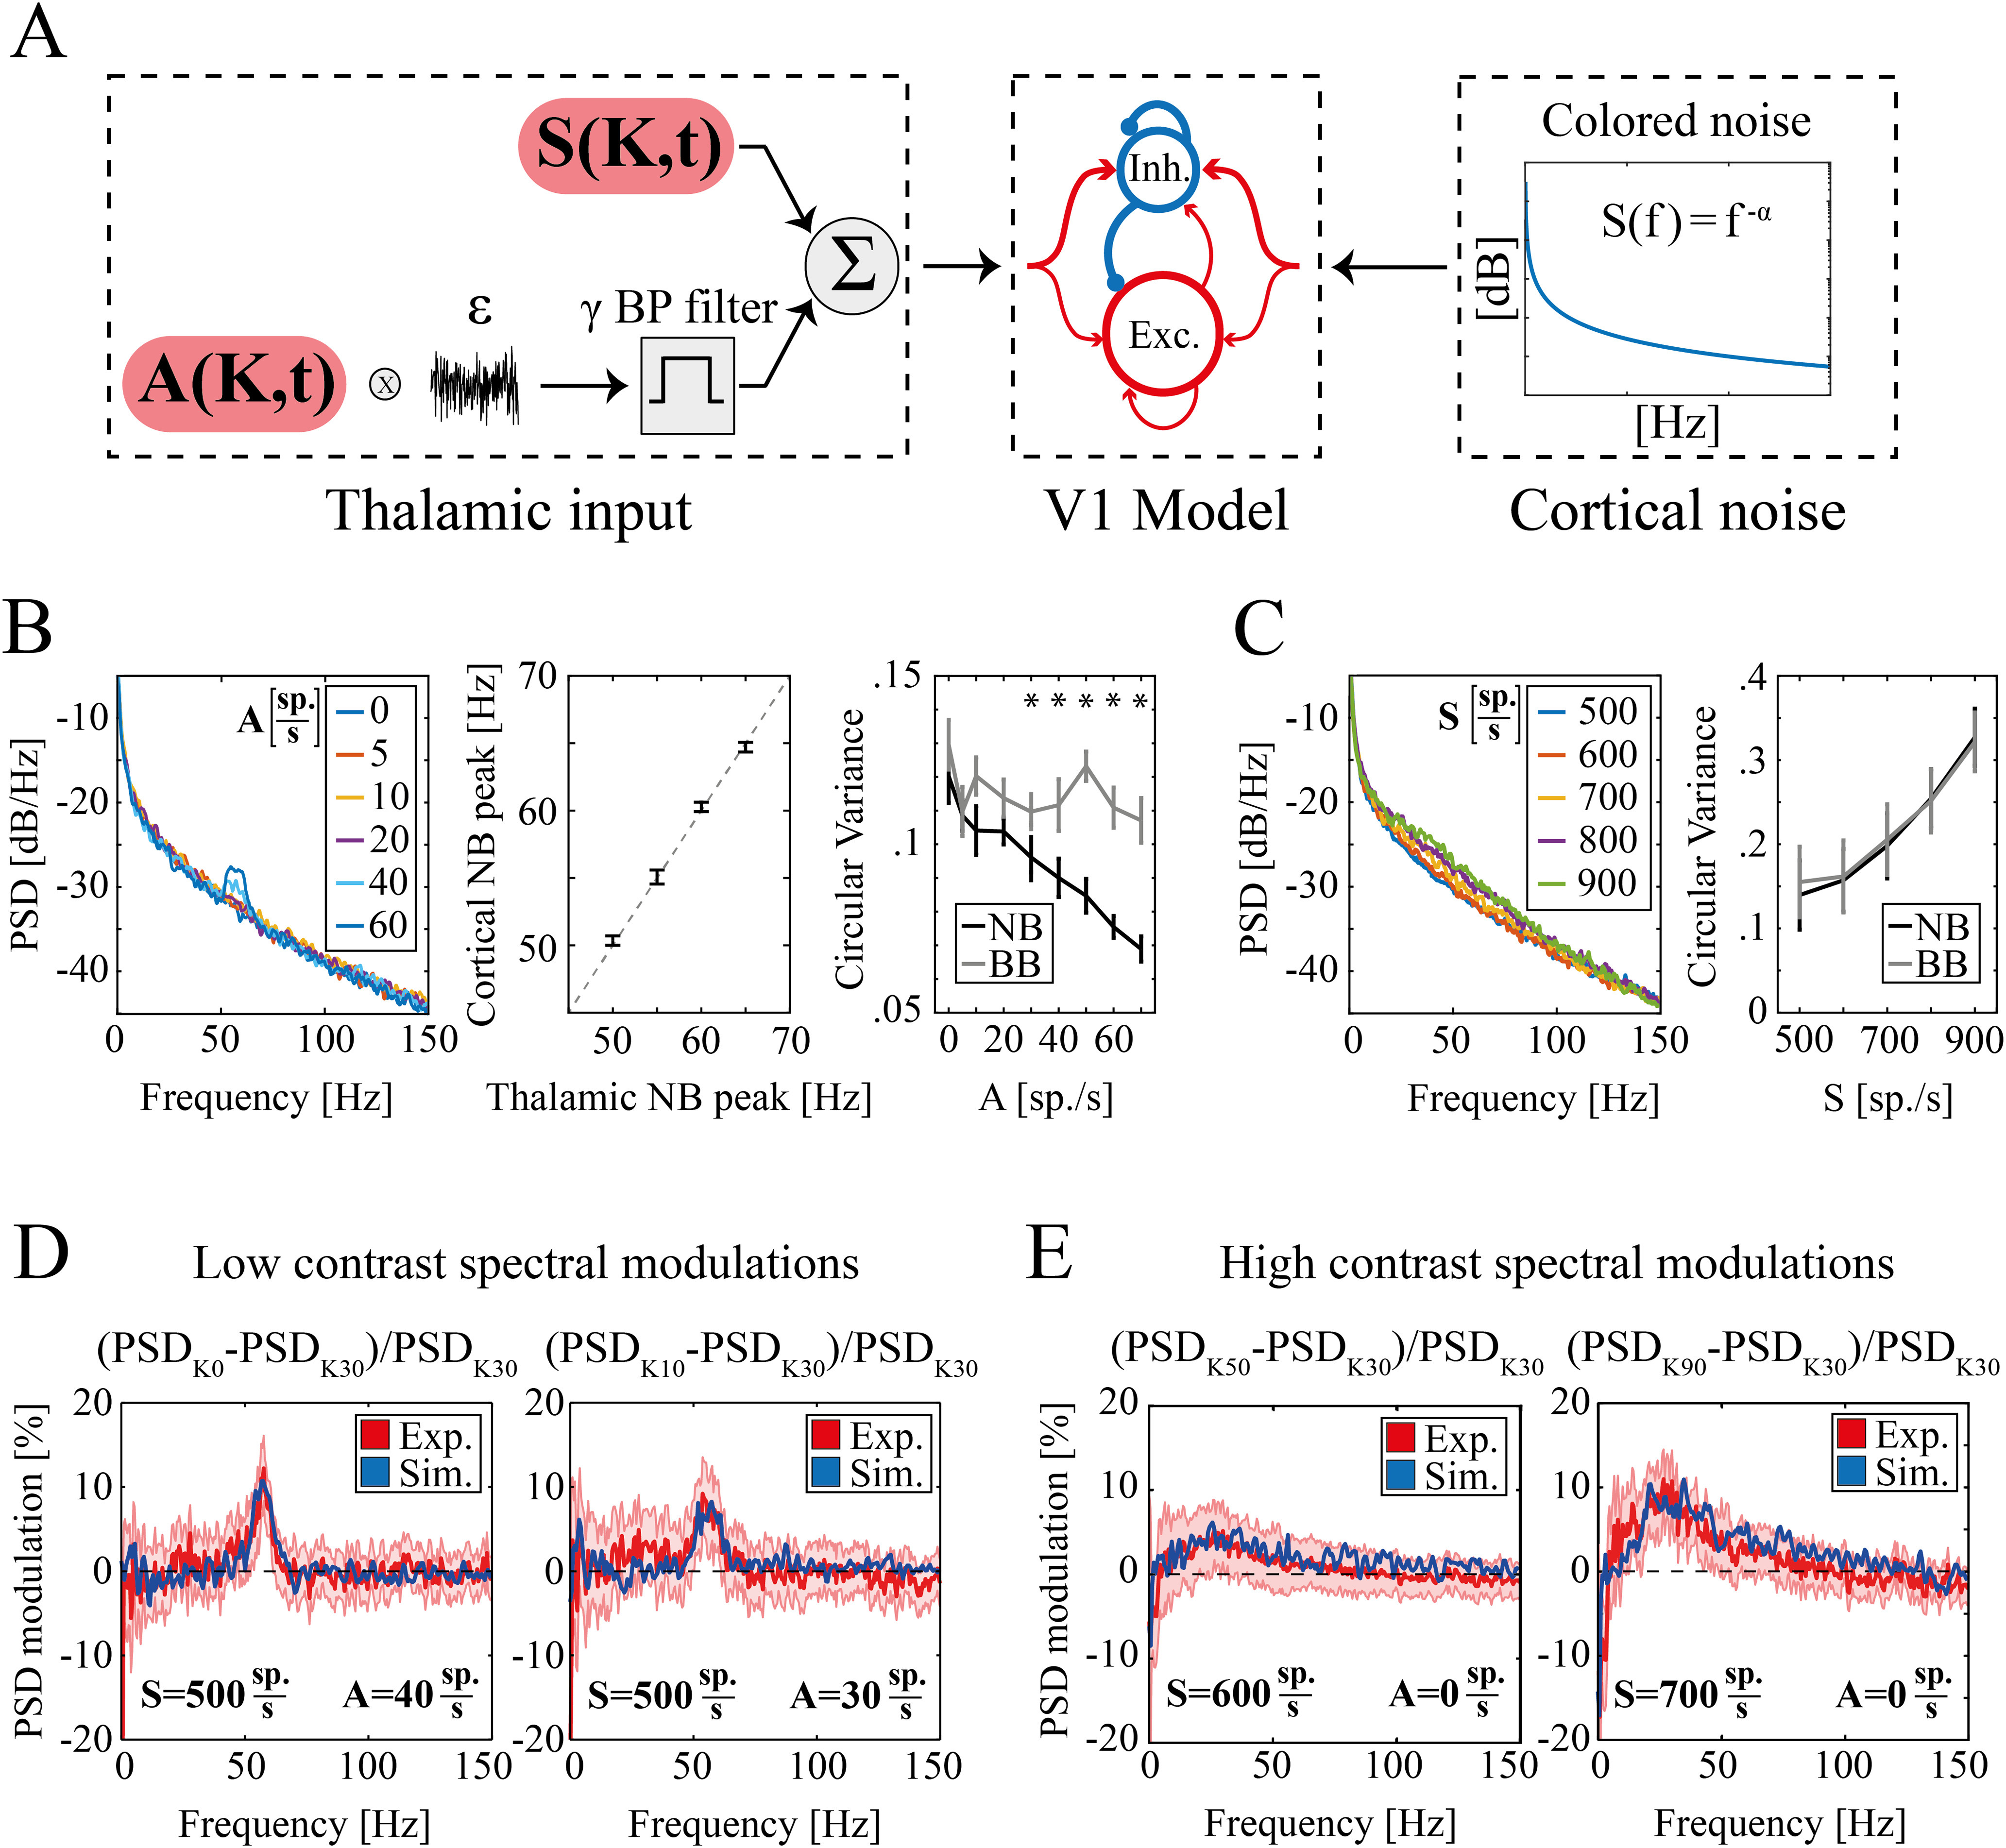
Figure 5.

Experimental and simulated spectral modulation at different visual contrasts. A, Schematic representation of the primary visual cortex (V1) model network. From left to right, (1) Thalamic inputs; sustained component S(K,t) (top) and periodic component of amplitude A(K,t) (bottom); (2) sparse LIF network of excitatory (n = 4000, red) and inhibitory neurons (n = 1000, blue). The size of the arrows represents schematically the strength of single synapses. In addition to recurrent interactions, both populations receive external excitatory inputs; (3) colored noise (see Materials and Methods) modeling ongoing unstructured cortical inputs. B, left, power spectral density (PSD) of simulated LFPs as a function of the amplitude of periodic thalamic input A (legend in the inset indicate A values). Middle, Cortical NB frequency peak as a function of the corresponding frequency peak of the thalamic NB. Dashed gray line indicates the identity line. Right, Circular variance of the phase difference between the simulated LFP and the thalamic input within the NB (black line) and within the BB (gray line) as a function of the amplitude of periodic thalamic input A. Asterisks indicate levels of input for which NB circular variance is significantly less than BB (p = 0.002). C, left, PSD of simulated LFPs for increasing levels of the sustained component of the thalamic input S (legend in the inset indicate S values). Right, Circular variance as a function of the amplitude of the sustained thalamic input S for the phase difference between the simulated LFP and the thalamic input within the NB (black line) and the BB (gray line). Circular variance was significantly modulated by the sustained component of the thalamic input S both within the NB (K–W test p ≪ 0.001) and the BB (K–W test p ≪ 0.001). Circular variance was likewise modulated within these two bands [two-way ANOVA: p = 0.99 for the interaction between the value of sustained thalamic input (S) and the frequency band (NB or BB)]. D, Modulation of LFP PSD for K = 0 (left) and K = 10 (right) with respect to K = 30 in experimental (red) and simulated (blue) data. The red shaded area represents SEM of experimental data across animals and recordings. In both simulations, sustained thalamic input was set to S = 500 sp./s, while the periodic input was set to A = 40 sp./s for K = 0 (left) and A = 30 sp./s for K = 10 (right). E, Modulation of LFP PSD for K = 50 (left) and K = 90 (right) with respect to K = 30 in experimental (red) and simulated (blue) data. The red shaded area represents SEM of experimental data across animals and recordings. In both simulations, periodic thalamic input was set to A = 0 sp./s, while the sustained input was S = 600 sp./s for K = 50 (left) and S = 700 sp./s for K = 90 (right).
