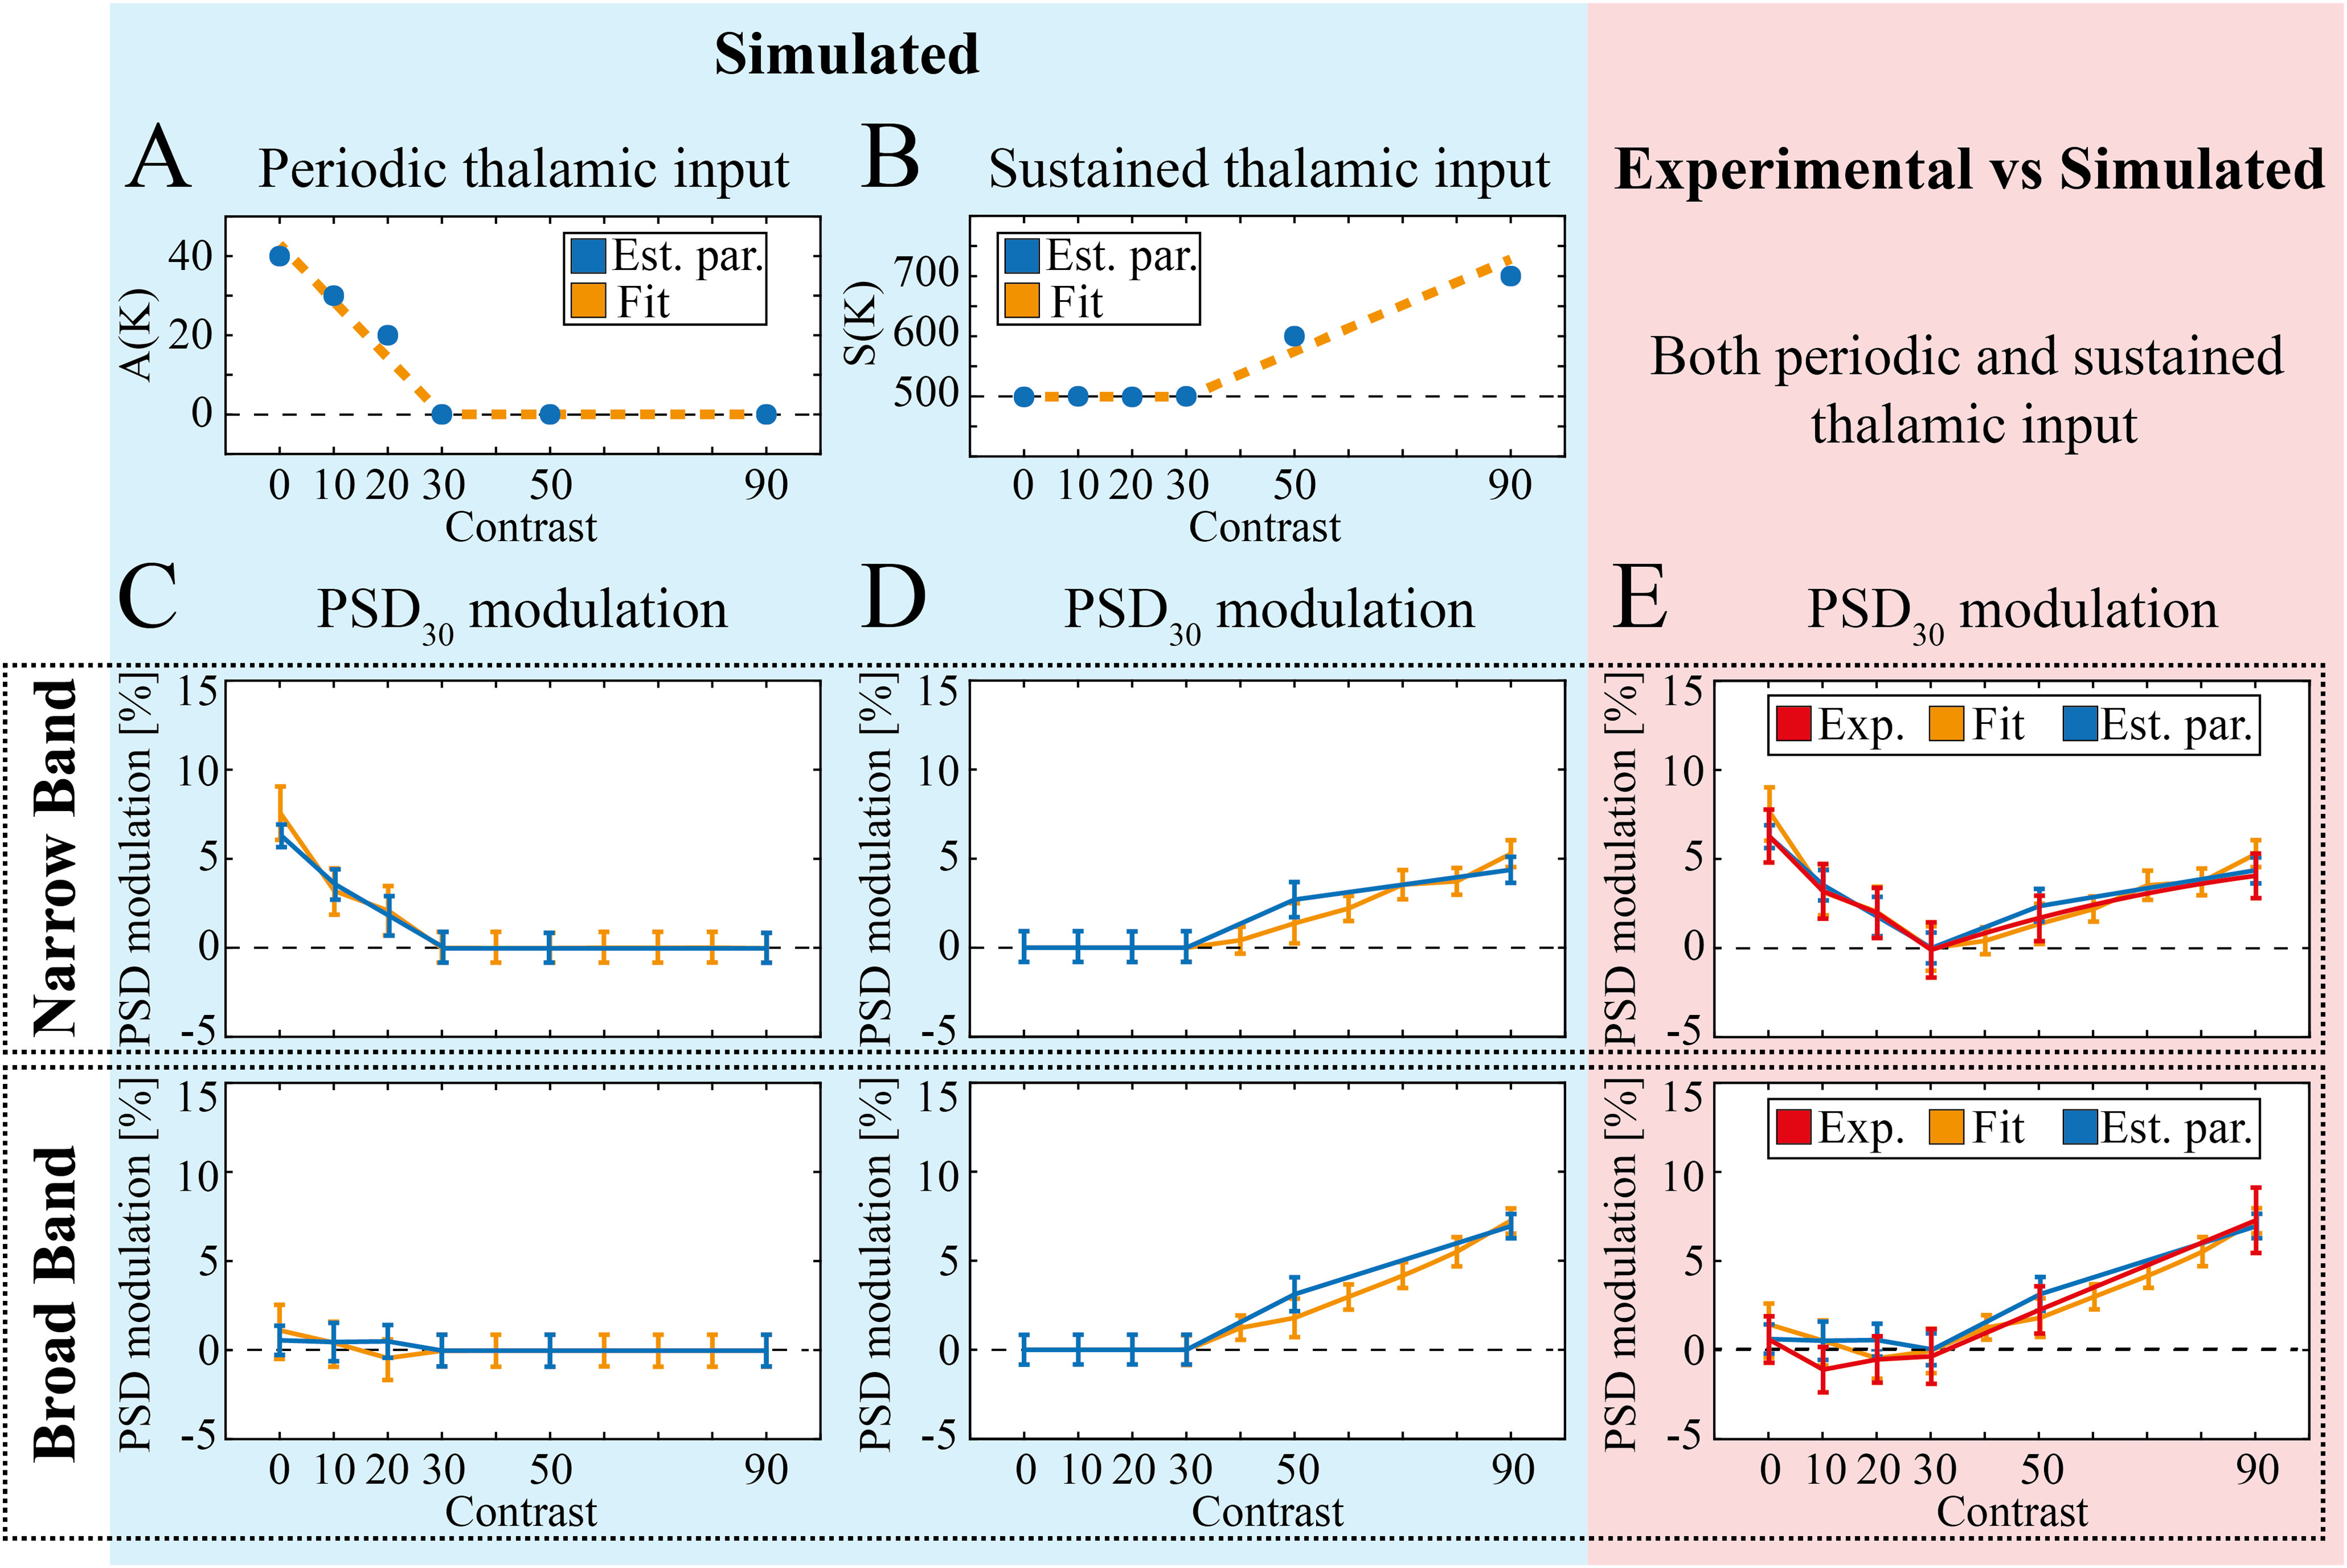
Figure 6.

Simulation of NB and BB γ over the whole contrast range. A, B, Optimal amplitude of periodic (A) and sustained (B) thalamic input amplitude for each value of contrast K (blue markers) and corresponding fit (dashed orange line). C, PSD30 modulation (see Materials and Methods) of NB (top) and BB (bottom) with fixed sustained input S = 500 sp./s and individual A(K) values shown in (A; blue line) and overall fit (orange line). Error bars indicate mean ± SEM here and in the following panels. D, PSD30 modulation (see Materials and Methods) of NB (top) and BB (bottom) with sustained input S(K) values shown in B (blue line) or associated fit (orange line) and no periodic input. E, Comparison of PSD30 modulation in NB (top) and BB (bottom) for experiments (red) and simulations with A(K) and S(K) values determined by local optimization (blue) or associated fit (orange).
