

Summary
Background
We previously described the contributions of increased total airway mucin concentrations to the pathogenesis and diagnosis of the chronic bronchitic component of chronic obstructive pulmonary disease (COPD). Here, we investigated the relative contribution of each of the major airway gel-forming mucins, MUC5AC and MUC5B, to the initiation, progression, and early diagnosis of airways disease in COPD.
Methods
SPIROMICS was a multicentre, observational study in patients aged 40–80 years recruited from six clinical sites and additional subsites in the USA. In this analysis, MUC5AC and MUC5B were quantitated by stable isotope-labelled mass spectrometry in induced sputum samples from healthy never-smokers, ever-smokers at risk for COPD, and ever-smokers with COPD. Participants were extensively characterised using results from questionnaires, such as the COPD assessment test (CAT) and St George’s Respiratory Questionnaire; quantitative CT, such as residual volume/total lung capacity ratio (RV/TLC) and parametric response mapping-functional small airway disease (PRM-fSAD); and pulmonary function tests, such as FEV1, forced vital capacity (FVC), and forced expiratory flow, midexpiratory phase (FEF25–75%). Absolute concentrations of both MUC5AC and MUC5B were related to cross-sectional (baseline, initial visit) and 3-year follow-up longitudinal data, including lung function, small airways obstruction, prospective acute exacerbations, and smoking status as primary outcomes. This study is registered with ClinicalTrials.gov (NCT01969344).
Findings
This analysis included 331 participants (mean age 63 years [SEM 9.40]), of whom 40 were healthy never-smokers, 90 were at-risk ever-smokers, and 201 were ever-smokers with COPD. Increased MUC5AC concentrations were more reliably associated with manifestations of COPD than were MUC5B concentrations, including decreased FEV1 and FEF25–75%, and increased prospective exacerbation frequency, RV/TLC, PRM-fSAD, and COPD assessment scores. MUC5AC concentrations were more reactive to cigarette smoke exposure than were MUC5B concentrations. Longitudinal data from 3-year follow-up visits generated a multivariate-adjusted odds ratio for two or more exacerbations of 1.24 (95% CI 1.04–1.47, p=0.015) for individuals with high baseline MUC5AC concentration. Increased MUC5AC, but not MUC5B, concentration at baseline was a significant predictor of FEV1, FEV1/FVC, FEF25–75%, and CAT score decline during the 3-year follow-up. Moreover, current smokers in the at-risk group showed raised MUC5AC concentrations at initial visits and decreased lung function over 3 years. By contrast, former smokers in the at-risk group showed normal MUC5AC concentrations at the initial visit and preserved lung function over 3 years.
Interpretation
These data indicate that increased MUC5AC concentration in the airways might contribute to COPD initiation, progression, exacerbation risk, and overall pathogenesis. Compared with MUC5B, greater relative changes in MUC5AC concentrations were observed as a function of COPD severity, and MUC5AC concentration seems to be an objective biomarker to detect disease in at-risk and pre-COPD individuals. These data suggest that MUC5AC-producing pathways could be potential targets for future therapeutic strategies. Thus, MUC5AC could be a novel biomarker for COPD prognosis and for testing the efficacy of therapeutic agents.
Introduction
Chronic obstructive pulmonary disease (COPD) is a complex disease, characterised by bronchitic and emphysematous components. COPD is typically caused by inhaled environmental insults, most commonly chronic cigarette smoke exposure. In response to the more than 5000 compounds inhaled as part of cigarette smoke exposure, abnormalities in mucin production and secretion, oxidative stress, and inflammation are manifest in the COPD lung.1
The Subpopulations and Intermediate Outcome Measures in COPD Study (SPIROMICS) is a multicentre, observational study designed to identify subgroups of COPD patients for targeted enrolment in future therapeutic clinical trials and to determine intermediate endpoint discovery and validation.2 SPIROMICS 1 included approximately 2770 participants, with a mean age of 63 years, consisting of 205 never-smokers, 920 ever-smokers at risk for COPD, and 1645 patients with COPD (from mild to severe). Patients with very severe COPD were excluded.
The Global Initiative for Chronic Obstructive Lung Disease (GOLD) defines COPD severity on the basis of decrements in lung function measurement by spirometry. Outside the classic GOLD classification, ever-smokers (current and former smokers) who have preserved lung function (FEV1 >90%), but symptoms of chronic cough and sputum production,3 are now referred to as an at-risk group (formerly defined as GOLD stage 0). The term pre-COPD has been proposed to define the at-risk population.2 Intense interest has focused on this earliest stage of COPD4,5 in an effort to better predict risks and rates of progression from this state to more severe disease. However, it has been difficult to predict which smoker at-risk or pre-COPD individuals will progress to more severe disease because of the absence of an understanding of disease-causing pathways and relevant biomarkers. Although FEV1 and FEV1/forced vital capacity (FVC) are currently used to define the stages of COPD, spirometry alone is not sufficiently sensitive to identify early disease and predict which individuals will progress from an at-risk and pre-COPD status to COPD. Therefore, it is essential to identify markers that sensitively and specifically track the pathogenesis of muco-obstructive lung disease.
Symptoms related to abnormal mucus are diagnostic of at-risk individuals and persist in patients with COPD GOLD stages 1–4. Recent data suggest that an abnormal (raised) concentration of mucus is required to produce the intrapulmonary mucus accumulation that results in the symptoms associated with sputum production.6–8 However, the role of mucus composition in symptom and sputum production is less well known. Two gel-forming mucins dominate airway mucus, MUC5AC and MUC5B. In health, MUC5B is the major gel-forming mucin in the lung7 and is required for mucociliary clearance.9 By contrast, MUC5AC is the minor mucin in the healthy lung and does not seem to be required for mechanical clearance of mucus from the lung.9 However, MUC5AC seems to be responsive to several environmental stresses or infectious agents.10 Data suggest that MUC5AC concentrations increase disproportionately in muco-obstructive diseases considered to be MUC5B dominated (eg, non-cystic fibrosis bronchiectasis, cystic fibrosis).11,12 Our previous chronic bronchitis study also suggested that sputum MUC5AC concentrations were low in the healthy baseline condition, but increased disproportionately, compared with MUC5B concentrations, in COPD.7 On the basis of our previous and ongoing studies, we hypothesise that mucin MUC5AC hyperconcentration in the airways is an important pathobiological component of COPD initiation and progression and MUC5AC is the more sensitive mucin to early airway damage induced by cigarette smoke. We therefore propose that MUC5AC concentration could be an early and sensitive biomarker for at-risk smokers for development of COPD.
To test this hypothesis, the relative sensitivities of MUC5B and MUC5AC and their ratio to cigarette smoking status and history, symptoms, and disease progression and severity of COPD were assessed in a large cohort of SPIROMICS participants with longitudinal data. Special emphasis was placed on characterisation of novel biomarkers to identify the at-risk and pre-COPD individuals who progress to chronic airway obstruction.
Methods
Study design and participants
SPIROMICS is a multicentre, observational study done at six clinical sites and additional subsites in the USA.13 The study recruited 2981 participants, classified into four different strata based on smoking status, FEV1, and FEV1/FVC ratio. All participants were 40–80 years of age with body-mass index (BMI) of less than 40 kg/m2 at baseline. Other exclusion criteria were history of diseases or treatments likely to interfere with interpretation of pulmonary function testing, hypersensitivity to salbutamol, ipratropium bromide, or propellants or excipients of the inhalers used in study assessments, non-COPD obstructive lung disease, and a current diagnosis of asthma.13 The study included one baseline visit (visit 1) and three annual in-person follow-up visits (visits 2–4). Induced sputum was collected from participants at the baseline visit.13
All protocols were reviewed and approved by institutional review boards in each participating site. All participants provided written informed consent before any procedures and understood the study goals. SPIROMICS patient recruitment and baseline clinic examinations were done between Nov 3, 2010, and July 31, 2015, and mucin concentrations were measured between Feb 13, 2014, and July 10, 2018. All forms and protocols are available on the SPIROMICS website.
Additional information for study design, size, settings, participants, quantitative variables, clinical definitions, methods, and statistical details are given in the appendix (pp 3–7).
Procedures
The ever-smoker SPIROMICS population includes both current and former smokers, with at least a 20-pack per year smoking history. Participants were categorised by disease severity, according to GOLD status, into five different groups: (1) healthy never-smokers; (2) at-risk (ever-smokers, at risk for COPD, FEV1/FVC ≥0.70, FEV1 ≥80%); (3) GOLD stage 1 (ever-smokers, mild COPD, FEV1/FVC ≤0.70, FEV1 ≥80%); (4) GOLD stage 2 (ever-smokers, moderate COPD, FEV1/FVC ≤0.70, FEV1 50–80%); and (5) GOLD stage 3 (ever-smokers, severe COPD, FEV1/FVC ≤0.70, FEV1 30–50%). For the longitudinal study cohort, lung function changes (FEV1, FVC, FEV1/FVC, COPD assessment test [CAT] scores) over three follow-up visits were related to baseline MUC5AC concentrations and analysed, comparing healthy and at-risk groups (current and former smokers without COPD).
The validity of sputum MUC5AC and MUC5B concentrations, and their ratios, and the usefulness of their concentrations as a risk indicator in the at-risk group were also explored in a 34-participant, single-site (University of North Carolina at Chapel Hill, NC, USA) independent cohort. Sputum collection and mucin measurements were identical to SPIROMICS procedures.
Sample preparation and data acquisition
Sputum was induced by inhalation of hypertonic saline solution in participants with predicted FEV1 higher than 35% according to the SPIROMICS protocol7,13,14 and American Thoracic Society and European Respiratory Society standards.15 Collected sputum was diluted into guanidine hydrochloride 6 M and stored at 4°C until further analysis.
Sputum samples (100 µL) were prepared via the filter aided sample preparation method.16 Briefly, samples were reduced by adding dithiothreitol and alkylated with iodoacetamide (Sigma, Saint Louis, MO, USA). Samples were washed twice with 50 mM ammonium hydrogen carbonate and modified trypsin (0.5 μg, proteomics grade, Sigma, Saint Louis, MO) was added for digestion and incubated for 18 h at 37°C. The peptides were concentrated by a vacuum centrifuge system and then dissolved in 30 µL of 0.1% formic acid water. The internal standard was prepared by pooling four heavy isotope internal standard peptides for each mucin to a final concentration of 500 fmol/µL. 2 µL of the internal standard were added and mixed with 8 µL of each sample. The targeted selected ion monitoring-data independent acquisition (tSIM-DIA) assay was performed with a Dionex Ultimate 3000 RSLCnano system coupled to a hybrid quadrupole orbitrap mass spectrometer with a Nano spray source (Q-Exactive, Thermo Fisher, Bremen, Germany). For peptide delivery and separation, 1 µL of the sample was loaded into an Acclaim PepMap RSLC, 75 µm × 15 cm, nanoViper C18 2 µm 100 Å column (Thermo Fisher Scientific, Waltham, MA, USA). The liquid chromatography–mass spectrometry run was 30 min long. For mass spectrometry, peptides were analysed by a targeted method combining a tSIM scan method with a time-scheduled duplexed DIA method. Data were acquired at a resolution of 70 000 at m/z 200, target automatic gain control value of 5e5, maximum fill times of 200 ms, a multiplex degree of 6 with an isolation width of 3 m/z. Fragmentation was performed with a normalised collision energy of 27.
Data processing
All raw files obtained from tSIM-DIA analyses of sputum digest samples were processed by Skyline (MacCross Lab, version 20.1). For each peptide, the ratio between the corresponding endogenous and internal standard peak areas of each precursor (mass spectrometry) and top three highest intensity product ions (tandem mass spectrometry) were calculated. Ratios from three peptides were averaged and MUC5B and MUC5AC concentrations were calculated.
Outcomes
Our primary outcomes were absolute mucin subtype; MUC5AC and MUC5B concentrations (main predictors: COPD, smoking); spirometry lung function measures, including FEV1, FVC, and forced expiratory flow midexpiratory phase (FEF25–75%); CT-based small airway (as the earliest sites of airway obstruction) metrics, including residual volume/total lung volume ratio (RV/TLC) and parametric response mapping-functional small airway disease (PRM-fSAD); prospective acute exacerbations over 3 years; and effects of smoking status in participants at risk for COPD. Our secondary outcomes were smoking pack history, questionnaire-based CAT and St George’s Respiratory Questionnaire (SGRQ) scores, prospective exacerbations requiring hospital admission in 1 year, and eosinophilic or neutrophilic inflammation markers. For all outcomes apart from mucins, mucins were the primary predictors. Our covariates for multivariate analyses were age, sex, race, ethnicity, BMI, chronic bronchitis, emphysema, asthma, and current smoking. Gastro-oesophageal reflux disease was included as a covariate when mucins were an outcome.
Statistical analysis
Mucin concentrations and their ratios were log10-transformed for analysis. Smoking status was defined as current, former, or never, based on self-report. Associations with variables were assessed using linear regression and ANOVA. Multiple comparisons were adjusted using the Tukey-Kramer approach, apart from the association with GOLD stage of COPD severity, where comparisons were made with healthy controls only and were adjusted using Dunnett’s method. Additionally, because of the large variability of the data and low linear associations, participants were divided into terciles of MUC5AC and MUC5B concentrations for analysis where indicated to identify trends in the association between variables (MUC5AC: low <8.94 pmol/mL, mid 8.94–51.93 pmol/mL, high >51.93 pmol/mL; MUC5B: low <95.82 pmol/mL, mid 95.82–219.22 pmol/mL, high >219.22 pmol/mL; MUC5AC/MUC5B: low <0.071 pmol/mL, mid 0.071–0.28 pmol/mL, high >0.28 pmol/mL). Since terciles of mucins were considered ordinal variables, we did tests for linear trend analyses using GraphPad Prism version 8.4.3. For tercile analyses, linear analysis was also done as sensitivity analyses and presented in the appendix (pp 9, 11). Data are presented as bar graphs. For some analyses, scatter plots are also presented in the appendix (pp 8, 9, 12–15, and 17). Longitudinal data were analysed with repeated models, using visit as the repeated factor. Missing data were considered as random. All statistical analyses were performed in SAS version 6.4. All tests were two-sided with a significance level of α=0.05. Results are reported as mean (SEM).
SPIROMICS is registered with ClinicalTrials.gov (NCT01969344).
Role of the funding source
The funder of the study had no role in study design, data collection, data analysis, data interpretation, or writing of the report.
Results
Of 2981 participants recruited to SPIROMICS, 1011 produced an induced sputum sample at the baseline visit for mucin analysis. 917 sputum samples were used in the previous total mucin concentration study,7 of which 331 were included in this analysis (figure 1). 40 participants were healthy never-smokers, 90 were ever-smokers at risk with no COPD, and 201 were ever-smokers with COPD. Mean age was 63 years (SEM 9.40). Characteristics of the 331 participants are shown in the table. This cohort was representative of both the SPIROMICS cohort13 and the total mucin concentration study cohort.7 Median follow-up was 371 days (IQR 364–384) at visit 2, 738 days (729–774) at visit 3, and 1122 days (1097–1175) at visit 4.
Figure 1:

Participant flow diagram
Table:
Study population characteristics
| Healthy never-smokers (n=40) |
At risk (n=90) |
GOLD stage 1 (n=59) |
GOLD stage 2 (n=70) |
GOLD stage 3 (n=72) |
Total (n=331) |
Total mucin study7 (n=917) |
Entire SPIROMICS cohort (n=2978*) |
|
|---|---|---|---|---|---|---|---|---|
| Age (years) | 58.7 (9.94) | 60.3 (10.23) | 65.3 (8.43) | 63.8 (8.33) | 66.5 (7.63) | 63.1 (9.40) | 63.1 (9.40) | 63.0 (9.30) |
| Sex | ||||||||
| Men | 21 (52.5%) | 42 (46.7%) | 40 (67.8%) | 43 (61.4%) | 39 (54.2%) | 185 (55.9%) | 533 (58.1%) | 1578 (53.0%) |
| Women | 19 (47.5%) | 48 (53.3%) | 19 (32.2%) | 27 (38.6%) | 33 (45.8%) | 146 (44.1%) | 384 (41.9%) | 1400 (47.0%) |
| Current smokers | 0 | 52 (57.8%) | 28 (47.5%) | 32 (45.7%) | 23 (31.9%) | 135 (40.8%) | 374 (40.8%) | 1094 (36.7%) |
| Emphysema | 5 (12.5%) | 12 (13.3%) | 17 (28.8%) | 24 (34.3%) | 54 (75.0%) | 112 (33.8%) | 259 (28.2%) | 1030 (34.6%) |
| Chronic bronchitis | 3 (7.5%) | 19 (21.1%) | 13 (22.0%) | 29 (41.4%) | 20 (27.8%) | 84 (25.4%) | 201 (21.9%) | 587 (19.7%) |
| Chronic bronchitis and emphysema | 1 (2.5%) | 4 (4.4%) | 4 (6.8%) | 11 (15.7%) | 17 (23.6%) | 37 (11.2%) | 66 (7.2%) | 239 (8.0%) |
| Current asthma | 0 | 10 (11.1%) | 8 (13.6%) | 12 (17.1%) | 7 (9.7%) | 37 (11.2%) | 113 (12.3%) | 576 (19.3%) |
| FEV1 (%) | 101.10% (1.93) | 96.94% (1.48) | 90.02% (1.27) | 65.74% (1.10) | 43.46% (0.47) | 77.74% (1.34) | 81.20% (0.71) | 74.96% (0.49) |
| FVC (%) | 96.97% (1.60) | 96.10% (1.51) | 108.60% (1.83) | 89.23% (1.34) | 80.55% (1.78) | 93.44% (0.89) | 95.31% (0.51) | 91.75% (0.33) |
| FEV1/FVC (%) | 103.92% (0.86) | 100.73% (0.68) | 83.28% (0.98) | 74.02% (1.25) | 55.49% (1.27) | 82.34% (1.09) | 84.77% (0.57) | 79.99% (0.39) |
| CAT score, median (IQR)† | 2.00 (5.00) | 10.00 (11.00) | 10.50 (12.00) | 15.50 (13.75) | 15.00 (9.50) | 11.00 (13.00) | 11.00 (13.00) | 13.00 (13.00) |
| SGRQ score, median (IQR)‡ | 5.29 (4.85) | 20.69 (30.29) | 25.77 (30.20) | 36.09 (30.77) | 39.06 (20.91) | 27.83 (30.78) | 26.37 (29.55) | 29.80 (33.89) |
Data are mean (SEM) or n (%), unless otherwise stated. Participants were categorised by disease severity, according to GOLD status, into five different groups (see Methods section for details). More information for the table variables can be found in the appendix (p 3). CAT=COPD assessment test. COPD=chronic obstructive pulmonary disease. FVC=forced vital capacity. GOLD=Global Initiative for Chronic Obstructive Lung Disease. SGRQ=St George’s Respiratory Questionnaire.
The core database does not have information for three participants in the total cohort.
CAT score ranges from 0 to 40, with higher scores denoting a more severe impact of COPD on a patient’s life.
SGRQ score ranges from 0 to 100, with higher scores indicating more limitations.
In healthy never-smokers, MUC5B was the dominant mucin (127 pmol/mL [SEM 16]), with mean concentration about eight times higher than that for MUC5AC (16 pmol/mL [4]; figure 2A, B; appendix p 8). The MUC5AC/MUB5B ratio was 0.14 (SEM 0.03; figure 2C). Compared with healthy never-smokers, mean MUC5AC concentration in participants with COPD was about six times higher (97 pmol/mL [SEM 18]), mean MUC5B concentration was about two times higher (257 pmol/mL [31]), and the MUC5AC/MUC5B ratio was higher at 0.6 pmol/mL (0.1; figure 2A–C). Multivariate analyses indicated that MUC5AC concentration, MUC5B concentration, and the MUC5AC/MUC5B ratio were affected by smoking status (p<0.0001, p=0.038, and p=0.0002, respectively) and COPD status, but not by age, sex, BMI, chronic bronchitis, emphysema, and asthma status (appendix p 10).
Figure 2: Individual mucin concentrations and COPD severity, and the association between lung function and mucin subtypes and their ratio.

(A–C) Absolute mean concentrations of MUC5B and MUC5AC, and their ratio, in never-smoker controls, ever-smokers without evidence of COPD by spirometry (at-risk; formerly known as GOLD stage 0), and ever-smokers with mild (GOLD1), moderate (GOLD2), and severe (GOLD3) COPD. (D–F) Mean FEV1 percentage predicted in tercile groups of MUC5AC concentration, MUC5B concentration, and MUC5AC/MUC5B ratio. (G–I) Mean FEV1/FVC in tercile groups of MUC5AC concentration, MUC5B concentration, and MUC5AC/MUC5B ratio. Error bars represent SEM. Sample size for each group is shown in the middle of the bar. COPD=chronic obstructive pulmonary disease. FVC=forced vital capacity. GOLD=Global Initiative for Chronic Obstructive Lung Disease. *p≤0.01. †p≤0.005. ‡p≤0.001. §p≤0.05.
The greatest relative increases in both MUC5AC and MUC5B concentrations compared with healthy never-smokers were seen in the at-risk group, while their relative change between at-risk versus COPD groups were only slightly elevated (figure 2A, B). Sputum MUC5AC and MUC5B concentrations were also measured in a single-site, 34-participant cohort of people who had never smoked versus current smokers without COPD. Mean concentrations of both MUC5AC and MUC5B in never-smokers and at-risk current smokers of the independent cohort were comparable to those in the full study cohort (appendix p 9).
Associations between MUC5AC and MUC5B concentrations and lung function were tested after MUC5AC and MUC5B concentrations were divided into terciles (figure 2D–I). The analyses indicated that participants in the MUC5AC high tercile group showed significantly lower mean FEV1 (percentage predicted 71.09% [SEM 2.2]) compared with participants in the MUC5AC low (81.59% [2.7], p=0.008) and mid (79.94% [1.9], p=0.017) tercile groups (figure 2D). Similarly, participants in the MUC5AC high tercile group showed significantly lower mean FEV1/FVC (77.05 [SEM 1.8]) compared with participants in the MUC5AC low (85.74 [2.1], p=0.0018) and mid (83.87 [1.6], p=0.013) tercile groups (figure 2G). No significant associations were detected comparing the MUC5B terciles with FEV1 percentage predicted or FEV1/FVC (figure 2E, H; appendix p 9). The association between MUC5AC concentration and FEV1 percentage predicted remained significant (p=0.0031) in multivariate analyses, after age, sex, BMI, race, ethnicity, chronic bronchitis, and percentage emphysema were included as covariates. The association also remained significant after correcting for smoking (p=0.041) and asthma status (p=0.049) in the analyses (appendix p 10). Trend analyses indicated that the slope between MUC5AC terciles and FEV1 and FEV1/FVC was –4.955 (SE –1.609, p=0.0022) and –3.547 (–1.440, p=0.014), respectively (appendix p 11).
Measures of peripheral airway obstruction (ie, FEF25–75%, RV/TLC, and PRM-fSAD) were compared with MUC5AC and MUC5B concentrations using ANOVA and Tukey-Kramer tests for terciles analysis and the test of trend analyses (figure 3, appendix p 11). Tercile analyses showed that FEF25–75% was inversely related to MUC5AC concentration (low vs high tercile p=0.0014, mid vs high tercile p=0.0056) but not MUC5B concentration (low vs high tercile p=0.44, mid vs high tercile p>0.99; figure 3A, B). Analyses of MUC5AC and MUC5B concentrations and CT measures of peripheral airway structure showed that increased MUC5AC, but not MUC5B, concentrations were associated with increased RV/TLC (low vs high tercile p=0.0003; figure 3D, E). The correlations between MUC5AC concentration and FEF25–75% and RV/TLC remained significant when age, sex, race, chronic bronchitis, percentage emphysema, smoking status, and current asthma were included in ANOVA models (p=0.001 and p=0.049, respectively). The test of trend analyses indicated that the slope between MUC5AC terciles and FEF25–75%, RV/TLC, and PRM-fSAD was −14.03 (SE −3.32, p<0.0001), 0.04 (0.01, p=0.0001), and 2.61 (1.10, p=0.019), respectively (appendix p 11).
Figure 3: Association between individual mucin concentrations and small airway patency and total future exacerbations.

Mean FEF25–75% predicted (A–C) and mean RV/TLC (D–F) in tercile groups of MUC5AC concentration, MUC5B concentration, and MUC5AC/MUC5B ratio. (G–I) Association between individual mucin concentrations and total future exacerbations (in all participants who completed 3-year follow-up visits). Panels G and H show mean MUC5AC and MUC5B concentrations and the prospective yearly total exacerbation rates (calculted by dividing the number of total exacerbations by follow-up time expressed in days multiplying by 365) from enrolment until the end of the study (until 3-year follow-up or death). Total exacerbations shown as zero exacerbations in next 3 years (92 participants), more than zero but fewer than two exacerbations (30 participants), and two or more exacerbations (44 participants). The multivariate adjusted odd ratios to predict future exacerbations is shown in the appendix (p 12). Error bars represent SEM. Sample size for each group is shown in the middle of the bar. FEF25–75%=forced expiratory flow, midexpiratory phase. RV/TLC=residual volume/total lung volume ratio. *p≤0.01. †p≤0.001. ‡p≤0.05. §p≤0.005.
Mean MUC5AC, but not MUC5B, concentration was higher in participants who had exacerbations than in those without exacerbations (≥2 exacerbations, 90.6 pmol/mL [SEM 20.1], p=0.0089; >0 to <2 exacerbations, 86.2 pmol/mL [31.6]; and 0 exacerbations, 47.7 pmol/mL [9.4]) during the 3-year follow-up period (figure 3G, H; appendix p 12). MUC5AC/MUC5B ratios were also higher in participants who had two or more exacerbations (0.60 [SEM 0.20], p=0.0078) compared with participants who had no exacerbations (0.29 [0.07]) during the 3-year follow-up period (figure 3I). In individuals with high baseline MUC5AC concentration, the multivariable-adjusted odds ratio for having two or more exacerbations was 1.24 (95% CI 1.04–1.47; p=0.015) in the 3 years of follow-up (appendix p 12). Similar data were observed for MUC5AC concentration and exacerbations requiring hospital admission (p=0.0033; appendix p 12). Exacerbation frequencies were not different as a function of MUC5B concentration, nor did MUC5B concentration predict future exacerbations (0.82, 95% CI 0.61–1.10; p=0.18; appendix p 12).
Associations between MUC5AC and MUC5B concentrations and CAT and SGRQ scores were investigated using terciles (figure 4). CAT scores were significantly associated with MUC5AC concentration (p=0.0002) and MUC5AC/MUC5B ratio (p=0.0005), but not MUC5B concentration (figure 4A–C). Mean CAT scores were higher in the MUC5AC mid (12.89 [SEM 0.69], p=0.02) and high (14.93 [0.87], p=0.0001) tercile groups compared with the low tercile group (9.77 [0.77]). Similarly, MUC5AC concentration (p=0.013) and MUC5AC/MUC5B ratio (p=0.0032), but not MUC5B concentration (p=0.27), were associated with overall SGRQ scores (figure 4D–F). The test of linear trend analyses indicated that the slope between MUC5AC terciles and CAT scores was 2.56 (SE 0.59, p<0.0001), and for MUC5AC/MUC5B the slope was 2.42 (0.60, p<0.0001; appendix p 11). Specific symptoms related to chronic bronchitis captured in the SGRQ instrument (ie, cough and phlegm) are reported in the appendix (p 13).
Figure 4: Associations between mucin concentrations and assessment scores.
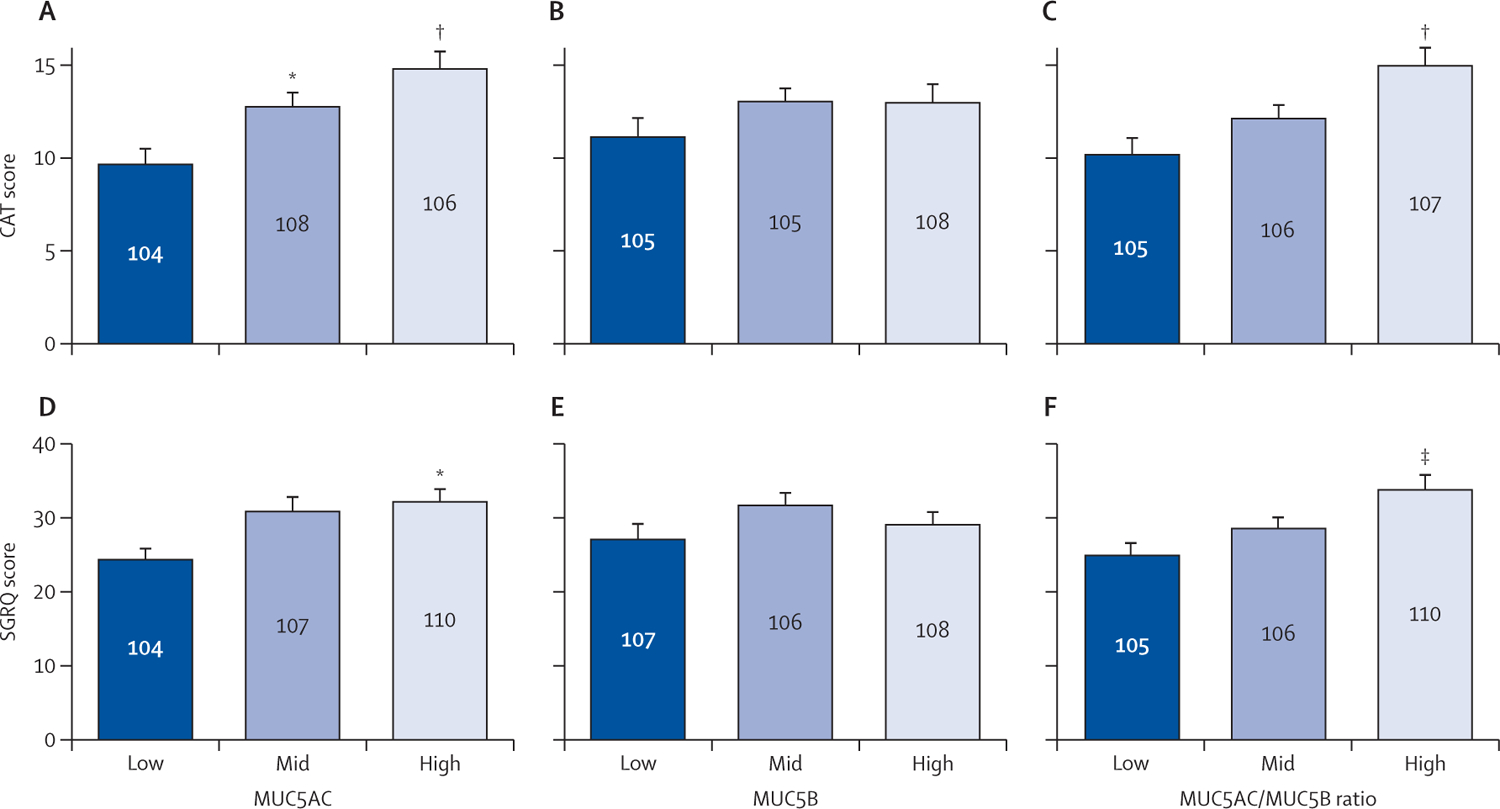
Mean CAT scores (A–C) and mean SGRQ scores (D–F) in tercile groups of MUC5AC concentration, MUC5B concentration, and MUC5AC/MUC5B ratio. MUC5AC concentration (D; p=0.013) and MUC5AC/MUC5B ratio (F; p=0.0032), but not MUC5B concentration (E; p=0.094), were associated with overall SGRQ scores. CAT score ranges from 0 to 40, with higher scores denoting a more severe impact of COPD on a patient’s life. SGRQ score ranges from 0 to 100, with higher scores indicating more limitations. Error bars represent SEM. Sample size for each group is shown in the middle of the bar. CAT=COPD assessment test. COPD=chronic obstructive pulmonary disease. SGRQ=St George’s Respiratory Questionnaire. *p≤0.05. †p≤0.005. ‡p≤0.01.
Because MUC5AC is associated with type 2 (eosinophilic) asthma,17,18 we explored relations between MUC5AC concentration and asthma biomarkers (appendix p 14). MUC5AC tercile analysis indicated that sputum MUC5AC concentrations were not closely associated with blood or sputum eosinophil counts or percentages, or blood IgE concentrations. However, increased MUC5AC concentrations and MUC5AC/MUC5B ratios were associated with increased blood and sputum neutrophil counts (appendix p 14).
Associations between MUC5AC and MUC5B concentrations and smoking pack history were tested by dividing the cigarette pack-year variable into terciles (appendix p 15). Notably, mean MUC5AC concentration was significantly higher in the lowest tercile group than in never-smokers (p=0.020), a difference strengthened by increments of concentration in the mid and upper tercile groups (p<0.0001; appendix pp 15–16). Increased MUC5B concentrations versus never-smokers were associated with the mid and upper pack-year categories (p=0.0065 and p=0.020, respectively; appendix p 15–16).
Participants in the at-risk group (ever-smokers with no COPD) who had quit smoking had lower mean MUC5AC concentration (21.2 pmol/mL [SEM 4.4]) than current smokers in the at-risk group (87.8 pmol/mL [25.5], p=0.0088), with concentrations very similar to the healthy never-smokers group (15.7 pmol/mL [4.1]; figure 5A, appendix p 17). Similarly, mean MUC5B concentration in at-risk participants who had quit smoking was lower (190.6 pmol/mL [SEM 16.4]) than that in at-risk participants who were current smokers (235.5 pmol/mL [42.4]), but this difference was not significant (figure 5B). In participants with COPD (GOLD stages 1–3), mean MUC5AC concentration in former smokers was also significantly lower (53.3 pmol/mL [SEM 9.0]) than the mean concentration in current smokers (119.0 pmol/mL [17.5], p=0.0002; figure 5A, appendix p 17). However, MUC5AC concentrations in participants with COPD who had quit smoking remained significantly elevated (p=0.0054) compared with healthy never-smokers (appendix p 17). Smoking cessation had lesser effects on MUC5B concentrations in the at-risk and COPD groups (figure 5B). Using smoking status (former vs current) with active years of smoking as a covariate, MUC5AC concentration and MUC5AC/MUC5B ratio were significantly associated with both smoking status (p=0.0004 and p=0.012, respectively) and active years of smoking (p=0.0007 and p=0.0012, respectively), whereas MUC5B concentration was significantly associated with smoking status only (p=0.031). The effect of smoking cessation as a function of smoking intensity is shown in the appendix (p 17).
Figure 5: Effect of smoking cessation on individual mucin concentrations and prospective lung function over follow-up visits.

(A–B) Effect of smoking status (former smoker vs current smoker) on MUC5AC and MUC5B concentration in at-risk ever-smokers and patients with COPD (GOLD stage 1–3). Data are means and error bars represent SEM. Sample size for each group is shown in the middle of the bar. (C) Comparison of lung function longitudinally over four visits. Comparison of mean FEV1 percentage predicted in healthy never-smokers, at-risk former smokers, and at-risk current smokers from enrolment until the end of the study (until 3-year follow-up). Error bars represent SEM. COPD=chronic obstructive pulmonary disease. GOLD=Global Initiative for Chronic Obstructive Lung Disease. *p≤0.05. †p≤0.01. ‡p≤0.005. §p≤0.001.
A more detailed examination of participants in the at-risk group with respect to mucin concentrations, and smoking status, COPD assessment, and lung function is summarised in the appendix (p 18). Compared with at-risk former smokers, at-risk current smokers showed higher MUC5AC concentrations, MUC5AC/MUC5B ratios, and CAT scores, but similar FEV1 values. Cough and phlegm scores within the CAT were also markedly reduced in at-risk former smokers compared with current smokers (appendix p 18). The rank order of fold differences for at-risk current smokers versus at-risk former smokers was MUC5AC (4×), MUC5AC/MUC5B ratio (2×), CAT cough and sputum (1.5×), and total CAT score (1.2×).
Relations between baseline visit mucin concentrations, smoking status, measures of airway obstruction, and CAT scores were sought for the three subsequent yearly visits for never-smokers and participants at risk for COPD. Never-smokers had normal mucin concentrations and showed persistently normal pulmonary functions and CAT scores during this observational interval (appendix p 18). At the baseline visit, mean FEV1 percentage predicted values for at-risk current smokers and at-risk former smokers were almost identical to those for healthy never-smokers (98.47% [SEM 3.1] and 98.44% [4.0] vs 101.31% [2.6]; 17 at-risk current smokers, 17 at-risk former smokers, and 24 never-smokers completed all four visits). However, at-risk current smokers, with elevated MUC5AC concentrations at the baseline visit, showed a progressive decline in lung function (FEV1) during visits 2 to 4 (visit 2, p=0.044; visit 3, p=0.033; visit 4, p=0.0030; figure 5C, appendix pp 18–19). By contrast, at-risk former smokers, with baseline MUC5AC concentrations not different from those in healthy never-smokers, had preserved lung function over the following four visits but unimproved CAT scores (appendix p 18). Using the 3-year longitudinal data, statistical models indicated that baseline MUC5AC concentration is a significant predictor for longitudinal outcomes such as FEV1 (p=0.010), FEV1/FVC (p=0.013), FEF25–75% (p=0.0005), and CAT score decline (p<0.0001), but not FVC (p=0.14), during the 3-year follow-up (appendix p 19). MUC5B concentration was not significantly associated with these longitudinal data.
Because of the observed associations between total mucin concentrations in sputum and bronchitis symptoms, spirometry, and exacerbation frequency manifestations of COPD, we explored the sensitivity and specificity of MUC5AC and MUC5B concentrations as stage-specific markers for COPD. By use of data from healthy never-smokers versus ever-smokers (current and former) with airflow-obstruction (COPD), the MUC5AC concentration area under the receiver-operating-characteristic (ROC) curve (AUC) was 0.74 (95% CI 0.66–0.81; figure 6). MUC5B concentration AUC for never-smokers versus ever-smokers, regardless of COPD status, was 0.66 (95% CI 0.57–0.75; figure 6). The AUC for MUC5AC concentration in ever-smokers, regardless of COPD status, compared with never-smokers in the mucin analysis cohort was 0.80 (95% CI 0.73–0.87, appendix p 20). Sputum MUC5AC concentration in participants in the independent cohort (at-risk current smokers and healthy never-smokers) yielded an AUC of 0.82 (95% CI 0.68–0.96) as a risk indicator whereas MUC5B concentration yielded an AUC of 0.62 (0.43–0.81; appendix p 20).
Figure 6: ROC curves of mucin concentrations.

MUC5AC and MUC5B ROC curves in participants with COPD (FEV1/FVC <0.7) compared with never-smokers. The AUC for MUC5AC in all smokers, with or without COPD, was 0.80 (95% CI 0.73–0.87) compared with never-smokers (appendix p 20). AUC=area under the ROC curve. COPD=chronic obstructive pulmonary disease. FVC=forced vital capacity. ROC=receiver-operating characteristic.
To assess the repeatability (precision) of the MUC5AC and MUC5B measurements, five replicates from a single sputum sample were prepared individually and analysed by mass spectrometry. The coefficient of variation of the measurements was 15.81% for MUC5AC and 9.14% for MUC5B (appendix p 20). These values are within the international acceptable range (<20%) of liquid chromatography with tandem mass spectrometry-based protein measurements.19
Discussion
We have previously shown that increased total mucin concentrations in sputum were associated with COPD exacerbation frequencies and disease severity as indexed by spirometry7 and with small airway obstruction20 the likely site of initiation of COPD.1,21 Here, distinct from our previous studies and by use of cross-sectional and longitudinal clinical data, the primary goal of this SPIROMICS mucin substudy was to elucidate whether there were distinct contributions of MUC5AC versus MUC5B to the initiation, progression, and early diagnosis of COPD. Changes in MUC5AC, but not MUC5B, concentrations were significantly and inversely related to lung function. In part, the strength of these associations might reflect a greater dynamic range in changes in MUC5AC concentration in COPD compared with MUC5B. MUC5AC concentrations increased by approximately six times in patients with COPD compared with healthy controls. Although the absolute changes in MUC5B concentrations associated with the key pathobiological stimulus (eg, smoking status and history) were greater than those for MUC5AC, MUC5B fold increases (about two times) were smaller than those for MUC5AC, reflecting the higher MUC5B basal concentrations.
The greater fold concentration changes in MUC5AC than MUC5B with COPD status raised two questions: first, are the two mucins differentially regulated in the context of cigarette smoking and COPD; and second, might each mucin have a unique contribution to COPD pathogenesis? With respect to the first question, robust datasets indicate that MUC5AC overexpression is closely associated with type 2 cytokine overproduction (eg, interleukin [IL]-13 and IL-4), and eosinophil concentrations in the context of type 2 inflammation in asthma.17,18 Importantly, type 2 cytokines also tend to depress MUC5B concentrations.17 Associations between MUC5AC and asthma biomarkers were tested in this study, and no significant correlations were found between MUC5AC concentration and serum or sputum eosinophil counts, or serum IgE concentrations. Instead, MUC5AC concentration was significantly associated with serum and sputum neutrophil concentrations and MUC5B concentration was increased in association with cigarette smoke exposure and COPD. These findings suggest that MUC5AC and MUC5B concentrations might be upregulated coordinately in COPD as reported for non-type-2 pathways (eg, IL-1β, IL-17, epidermal growth factor receptor, Toll-like receptor-mediated high-mobility group box 1 pathways).22–25 The IL-1αβ and IL-1 receptor pathways have been shown not only to upregulate MUC5AC and MUC5B but also to exert neutrophilic proinflammatory activities.26
The functional consequences of raised MUC5AC and MUC5B concentrations should be additive in the context of the mucin osmotic pressures that govern mucus transport rates (mucociliary clearance),7,27,28 because MUC5B concentrations dominated in all phases of COPD. Hence, MUC5B likely dominates the mucus osmotic pressure characteristics of COPD mucus. However, data have emerged from studies of IL-13-induced MUC5AC in human bronchial epithelial cultures that MUC5AC may be more adhesive to airway cell surfaces than MUC5B.10 Whether these properties lead to increased mucus airway adhesion (eg, non-coughable mucus, accumulation, and airflow obstruction in COPD) in the absence of T-helper-2 dominated regulation is not clear. The observed association between raised MUC5AC concentration and FEV1 decline (ie, airway obstruction, and slowing of in-vitro mucociliary clearance rates)10 supports the hypothesis that MUC5AC may contribute to COPD initiation and progression in addition to mucus accumulation or obstruction mediated via the total mucin concentration-dependent osmotic pressure.
Small airways are likely to be the earliest sites of airway obstruction in COPD4,21,29 and FEF25–75% (spirometry), RV/TLC (CT), and PRM-fSAD (CT) measurements seem to be sensitive in detecting small airways disease.30,31 Hyperconcentrated total mucin concentrations have been shown to be associated with spirometry and CT measures of peripheral airways disease.20 A significant association was observed between MUC5AC concentration and multiple measures of small airways disease, including a spirometrically determined measure of peripheral airflow (ie, FEF25–75%), CT-defined RV/TLC, and PRM-fSAD measures. No significant correlations were observed between MUC5B concentration and small airway measures. It is not clear whether this discrepancy reflects a role for MUC5AC independent of MUC5B concentration in the initiation of mucus adhesion or obstruction in the small airways, or a lack of sensitivity of MUC5B concentrations due to the higher basal concentrations and, hence, smaller dynamic range. Regardless, because MUC5AC sensitivity correlated with small airways dysfunction, in addition to FEV1 decline, we speculate that MUC5AC could be a sensitive biomarker of COPD initiation and progression.
Increased frequencies of COPD exacerbations are closely related with more rapid and irreversible losses of lung function and mortality.32,33 Higher total mucin concentrations were closely associated with 1-year exacerbation frequency,7 but the association between individual mucins and COPD exacerbations was not previously investigated. In 3-year prospective exacerbation data, we observed relations between MUC5AC, but not MUC5B, and prospective exacerbation frequencies. MUC5AC concentration was higher in participants who had two or more exacerbations during the 3 years after the initial visit than in participants who had no exacerbations. The multivariate adjusted odds ratio (1.24, 95% CI 1.04–1.47) for log MUC5AC concentration indicates, for each ten times increase of MUC5AC, the odds of having exacerbations are 24% higher. Therefore, we can postulate that MUC5AC is a significant predictor of future exacerbations and could contribute to disease progression.
Because mucin concentrations are reactive to cigarette smoke inhalation,34–36 we investigated the relations between mucin concentrations and COPD pathogenesis and progression, with a focus on participants at risk for COPD. By definition, FEV1 and FEF25–75% values in at-risk smokers did not differ from those in healthy controls irrespective of smoking status. However, MUC5AC and, to a lesser relative extent, MUC5B, concentrations in at-risk smokers were significantly increased compared with healthy never-smokers. Importantly, mean MUC5AC concentration in at-risk former smokers was similar to that in never-smokers. By contrast, CAT and SGRQ scores were, by definition, raised in at-risk participants and remained on the threshold of a low impact level despite smoking cessation. These findings have two implications: first, only MUC5AC was sufficiently sensitive to detect early reversal of a bronchitic pathophysiology; and second, changes in CAT and SGRQ scores might reflect factors in addition to chronic bronchitis symptoms (cough and phlegm score).
To characterise the COPD at-risk population more comprehensively, associations between at-risk status, cigarette smoking, and MUC5AC concentration were investigated using 3-year longitudinal data. The lung function (ie, FEV1) of at-risk current smokers, with raised baseline visit MUC5AC concentrations, declined significantly over 4 years. By contrast, at-risk former smokers, with normal MUC5AC concentrations, did not show a decline in FEV1 over the same observational interval. Given the association between decreased lung function and increased MUC5AC concentration, we speculate that MUC5AC concentration could be a sensitive and objective biomarker linking smoking history to the early airway disease that progresses from an at-risk preserved lung function status to GOLD stage 1 COPD with time. Importantly, the MUC5AC concentration versus smoking status data in the at-risk group suggest that smoking cessation before airway obstruction is detectable is a simple way to normalise MUC5AC concentration and to prevent loss of lung function in at-risk individuals.
Previous studies that measured inflammation parameters in COPD cohorts indicated that at a certain level of disease severity, inflammation persisted irrespective of smoking status.37,38 Within the COPD (GOLD stage 1–3) ever-smoker cohort, former smokers showed significantly reduced MUC5AC concentrations compared with current smokers. However, MUC5AC concentrations of the former smokers with COPD did not recover to normal levels and remained significantly higher than those for healthy never-smokers. Poor reversibility with smoking cessation was also observed with MUC5B concentration. These data suggest that persistent airflow restriction, inflammation, and persistent increase in mucin concentration might be linked.
Recent studies have focused on early stages of COPD2,4,5,39 and targeted individuals younger than 50 years with a smoking history of less than ten pack-years and with no airflow obstruction. These at-risk individuals can be distinguished by symptoms.5 However, because of the poor validity of cigarette smoking and history, there is a need for an objective biological measure for this high-risk COPD group to predict risk and progression to established disease and to develop personalised interventions. Currently, there is no biological measure to predict which at-risk individuals will progress to more severe disease because of the absence of well described disease-causing pathways and relevant biomarkers. Although FEV1 and FEV 1/FVC are currently used to define the stages of COPD, spirometry is not sufficiently sensitive to identify early disease and predict which individuals will progress from being at risk for COPD. The associations between mucin subtypes, especially MUC5AC, and COPD parameters suggest the diagnostic utility of mucin subtypes as prognostic and quantitative biomarkers for COPD risk and progression. The ROC curves for MUC5AC concentration and current smokers with spirometrically diagnosed COPD versus controls yielded a good outcome (AUC 0.80). When ROC analyses were applied to ever-smokers with COPD versus never-smokers in the full cohort, the AUC was fair (0.74), a better AUC value compared with MUC5B and total mucin concentrations. When an independent, one-site cohort was used and the ROC analysis applied to current smokers with no COPD versus never-smokers, the AUC was also good (0.82).
Like most large multicentre observational studies, there are limitations to our study. Although the mucin data are representative of the entire SPIROMICS cohort, we do not know how applicable our results will be to other large cohorts (eg, COPDGene and ECLIPSE). This limitation argues for collaborative studies in the future with standardised protocols for induced and spontaneous sputum collection. Sputum collection is challenging in a large cohort study. In SPIROMICS, induced sputum collection was standardised at all 12 clinical sites, but we anticipate that the induction protocol and collection might have varied qualitatively between sites, which could contribute to large variability of our data, added to the known individual variability of COPD.40 We have previously shown that a single-site replication cohort produced much tighter and less variable data compared with SPIROMICS multicentre data in terms of total mucin concentration data.7 In the current analysis, we compared multicentre MUC5AC and MUC5B data to a single-site independent cohort with never-smokers and current smokers. The results indicated that the mean values were comparable between the two different cohorts, but the AUC values were better in the single-site independent cohort. Another limitation of our data with respect to correlations of sputum concentrations and lung function longitudinally is the absence of longitudinal sputum data in SPIROMICS. However, this omission has been corrected in the ongoing SPIROMICS 2. Finally, although we present cross-sectional and longitudinal relations between MUC5AC concentration and airway abnormalities in this cohort, there is no clear way to determine causality between MUC5AC and airway abnormalities from these data. Such insight will require data from in-vitro and in-vivo models.
We propose that analyses of MUC5AC and MUC5B mucin subtype concentrations in respiratory samples (ie, induced or spontaneous sputum) could be widely applicable to future COPD studies including those focused on early COPD and pre-COPD. The use of standardised protocols for collection and processing of induced and spontaneous sputum will be important for such studies. Mucin subtype measurement may also be used as a biomarker to identify and predict the risk for chronic bronchitis or COPD, in individuals in need, and as an outcome measure or endpoint in clinical trials. Standardised validation efforts are ongoing, and the mass spectrometry methods are highly precise, sensitive, and accurate. Widespread adoption of the individual mucin biomarkers will require measurement at centres with suitable mass spectrometry capabilities, which are, indeed, available in most tertiary hospital or diagnostic centres.
In conclusion, the SPIROMICS data suggest that increased airway MUC5AC concentrations could have diagnostic and prognostic utility in COPD. The greater dynamic range of MUC5AC concentrations in response to cigarette smoke and chronic bronchitic symptoms compared with MUC5B suggests that MUC5AC could provide a novel and disease-associated biomarker to detect at-risk and pre-COPD individuals. Increased MUC5AC concentrations may also add an important pathobiological component to COPD initiation and progression over and above increased total mucin or MUC5B concentrations. These studies could guide detection of novel targets in the mucin-producing pathways and biomarkers to assist novel therapeutic approaches to COPD.
Supplementary Material
Research in context.
Evidence before this study
We searched PubMed using the terms “COPD”, “mucin”, “cigarette smoking”, “exacerbation”, or “small airways” for articles published up until Jan 1, 2021, with no publication date or language restrictions. We found no studies that measured absolute sputum concentrations of MUC5AC and MUC5B mucins in large sample sizes or correlated specific mucin concentrations with large cohort clinical data including questionnaires, quantitative CT, and pulmonary function tests, either cross-sectionally or longitudinally. Only a single study, our previous publication from the SPIROMICS cohort, reported a limited dataset (148 participants) on MUC5AC and MUC5B concentrations in chronic obstructive pulmonary disease (COPD); this previous analysis did not examine associations between MUC5AC or MUC5B concentrations and COPD, chronic bronchitis severity and assessment scores, smoking status and duration, small airways patency, and longitudinal lung function data or prospective exacerbations.
Added value of this study
To our knowledge, this is the first human clinical study to report associations between concentrations of the specific MUC5AC and MUC5B mucins with cross-sectional and 3-year longitudinal clinical data from smokers at risk for COPD and patients with COPD. Compared with healthy never-smokers, at-risk and COPD groups showed increased MUC5AC concentrations that were closely associated with decreased FEV1 and forced mid-expiratory flow (FEF25–75%); increased residual volume/total lung capacity ratio and parametric response mapping-functional small airway disease; worsened COPD assessment test scores; and increased prospective exacerbation frequencies, wheezing, and cough. Our prospective analyses showed that current smokers in the at-risk group had raised MUC5AC concentrations at initial visits that were associated with decreased lung function over 3 years. By contrast, former smokers in the at-risk group had normal initial visit MUC5AC concentrations and preserved lung function over 3 years.
Implications of all the available evidence
These results suggest that MUC5AC hyperconcentration in the airways might represent an important pathobiological element of COPD initiation and progression. MUC5AC shows a greater dynamic range than MUC5B in response to cigarette smoke exposure and was more strongly associated with COPD phenotypes. Importantly, MUC5AC concentration might provide a novel, disease-associated biomarker to detect individuals at risk of progression to COPD. Finally, our results may guide selection of novel targets and biomarkers for the development of future COPD therapies.
Acknowledgments
We thank the SPIROMICS participants and participating physicians, investigators, and staff for making this research possible. More information about the study and how to access SPIROMICS data is available at http://www.spiromics.org. We acknowledge the University of North Carolina at Chapel Hill BioSpecimen Processing Facility for sample processing, storage, and sample disbursements (http://bsp.web.unc.edu/). This SPIROMICS ancillary study is mainly supported by National Institutes of Health NIH/NHLBI R01HL110906 (MK) and partially supported by R01HL103940 (MK). This study was further supported by NIH/NHLBI grants to RCB (UH3HL123645, P01HL110873, R01HL136961, and P01HL108808) and the NIH/National Institute of Diabetes and Digestive and Kidney Diseases (P30DK065988). SPIROMICS was supported by contracts from the NIH/NHLBI (HHSN268200900013C, HHSN268200900014C, HHSN268200900015C, HHSN268200900016C, HHSN268200900017C, HHSN268200900018C, HHSN268200900019C, HHSN268200900020C), grants from the NIH/NHLBI (U01 HL137880 and U24 HL141762), and supplemented by contributions made through the Foundation for the NIH and the COPD Foundation from AstraZeneca/MedImmune; Bayer; Bellerophon Therapeutics; Boehringer Ingelheim; Chiesi Farmaceutici; Forest Research Institute; GlaxoSmithKline; Grifols Therapeutics; Ikaria; Novartis; Nycomed; ProterixBio; Regeneron; Sanofi; Sunovion; Takeda; Theravance Biopharma; and Mylan.
Funding National Institutes of Health; National Heart, Lung, and Blood Institute.
Appendix
Declaration of interests
RGB reports grants from the National Institutes of Health (NIH), Foundation for the NIH (FNIH), and the COPD Foundation, during the study, and grants from NIH outside the submitted work. ERB has undertaken clinical trials through his employer, Wake Forest School of Medicine and University of Arizona, for AstraZeneca, MedImmune, Boehringer Ingelheim, Genentech, Johnson & Johnson (Janssen), Novartis, Regeneron, and Sanofi Genzyme. ERB has also served as a paid consultant for AstraZeneca, MedImmune, Boehringer Ingelheim, GlaxoSmithKline, Novartis, Regeneron, and Sanofi Genzyme, outside the submitted work. SAC reports personal fees from AstraZeneca, GlaxoSmithKline, Amgen, Glenmark, Sunovion, Genentech, and UpToDate, outside the submitted work. CBC reports grants from NIH/National Heart, Lung, and Blood Institute (NHLBI), FNIH, and COPD Foundation, during the conduct of the study. CBC reports personal fees from PulmonX, Nuvaira, and MGC Diagnostics, and is a Global Medical Expert for GlaxoSmithKline, outside the submitted work. MKH reports grants from NHLBI during the conduct of the study, personal fees from GlaxoSmithKline, Boehringer Ingelheim, AstraZeneca, Merck, Mylan, Teva, and Verona, and research support from Sanofi, Sunovion, and Novartis, outside the submitted work. NNH reports grants from NIH and COPD Foundation, grants and personal fees from AstraZeneca, GlaxoSmithKline, and Boehringer Ingelheim, and personal fees from Mylan, outside the submitted work. ATH reports grants from NHLBI and FNIH during the conduct of the study. EAH reports grants from NIH during the conduct of the study. EAH is a founder and shareholder of VIDA Diagnostics, outside the submitted work. FJM reports personal fees from GlaxoSmithKline, AstraZeneca, Boehringer Ingelheim, and Raziel, during the conduct of the study. FJM reports personal fees and non-financial support from AstraZeneca, Boehringer Ingelheim, GlaxoSmithKline, Miller Communications, National Society for Continuing Education, PeerView Communications, Chiesi, Sunovion, Physicians Education Resource, Canadian Respiratory Network, Teva, CSL Behring, and Sanofi/Regeneron; non-financial support from ProterixBio, Gilead, Nitto, Zambon, and twoXAR; personal fees, non-financial support, and non-personnel travel support from Genentech; personal fees from MD Magazine, Methodist Hospital Brooklyn, New York University, UpToDate, WebMD/MedScape, Patara/Respivant, Bayer, American Thoracic Society, Rockpointe, CME Outfitters, Dartmouth University, DevPro, Gala, Integritas, IQVIA, Projects in Knowledge, Vindico, and Academy for Continuing Healthcare Learning; IPF Study Steering Committee for Afferent/Merck, Biogen, Veracyte, Prometic, and Bayer; IPF Advisor for Bridge Biotherapeutics; IPF teleconference with AbbVie; and grants from NIH, Rare Disease Healthcare Communications, and Promedior/Roche, outside the submitted work. RP reports grants from NHLBI and COPD Foundation, during the conduct of the study. RP reports grants from the Department of Veterans Affairs, and personal fees from Partner Therapeutics, outside the submitted work. PGW reports personal fees from Sanofi, Regeneron, Glenmark Pharmaceuticals, Theravance, GlaxoSmithKline, and NGM Pharma, outside the submitted work. WKO’N reports grants from NIH/NHLBI, during the conduct of the study. RCB reports grants from NIH, during the conduct of the study; and personal fees from Parion Sciences, outside the submitted work. MK reports grants from NIH, during the conduct of the study; contracts from Genentech, Gala Therapeutics, AstraZeneca, Ionis Pharmaceuticals, and personal fees from Boehringer Ingelheim and Amgen, outside the submitted work. In addition, MK has a patent (methods for diagnosing or predicting chronic bronchitis) pending. All other authors declare no competing interests.
Footnotes
For more on SPIROMICS see https://www.spiromics.org/spiromics/
For forms and protocols see https://www2.cscc.unc.edu/spiromics/forms-current?field_form_visit_tid%5B%5D=9041
See Online for appendix
Data sharing
The clinical and mucin data reported here and data dictionary are currently available in the main SPIROMICS core databases and can be obtained through the Genomics and Informatics Coordinating Center by submitting a Data Materials and Distribution Agreement prior to receiving any data and/or biospecimens.
Contributor Information
Giorgia Radicioni, Marsico Lung Institute/Cystic Fibrosis and Pulmonary Research Center, University of North Carolina at Chapel Hill, Chapel Hill, NC, USA.
Agathe Ceppe, Marsico Lung Institute/Cystic Fibrosis and Pulmonary Research Center, University of North Carolina at Chapel Hill, Chapel Hill, NC, USA.
Amina A Ford, Marsico Lung Institute/Cystic Fibrosis and Pulmonary Research Center, University of North Carolina at Chapel Hill, Chapel Hill, NC, USA.
Neil E Alexis, Center for Environmental Medicine, Asthma, and Lung Biology, Division of Allergy and Immunology, University of North Carolina at Chapel Hill, Chapel Hill, NC, USA.
R Graham Barr, Department of Medicine, Columbia University Medical Center, New York, NY, USA; Department of Epidemiology, Mailman School of Public Health at Columbia University, New York, NY, USA.
Eugene R Bleecker, Center for Genetics and Genomic Medicine, University of Arizona Health Sciences, Tucson, AZ, USA.
Stephanie A Christenson, Division of Pulmonary, Critical Care, Allergy, and Sleep Medicine, Department of Medicine, University of San Francisco Medical Center, University of California San Francisco, San Francisco, CA, USA.
Christopher B Cooper, Department of Medicine and Physiology, David Geffen School of Medicine, University of California, Los Angeles, CA, USA.
MeiLan K Han, Division of Pulmonary and Critical Care Medicine, University of Michigan Health System, Ann Arbor, MI, USA.
Nadia N Hansel, Division of Pulmonary and Critical Care Medicine, Johns Hopkins University School of Medicine, Baltimore, MD, USA.
Annette T Hastie, Section on Pulmonary, Critical Care, Allergy and Immunology, Wake Forest School of Medicine, Winston Salem, NC, USA.
Eric A Hoffman, Department of Radiology, Division of Physiologic Imaging, University of Iowa Hospitals and Clinics, Iowa City, IA, USA.
Richard E Kanner, Department of Internal Medicine, Division of Pulmonary and Critical Care Medicine, University of Utah, Department of Veterans Affairs Medical Center, Salt Lake City, UT, USA.
Fernando J Martinez, Department of Medicine, Weill Cornell Medical College, New York, NY, USA.
Esin Ozkan, Marsico Lung Institute/Cystic Fibrosis and Pulmonary Research Center, University of North Carolina at Chapel Hill, Chapel Hill, NC, USA.
Robert Paine, III, Department of Internal Medicine, Division of Pulmonary and Critical Care Medicine, University of Utah, Department of Veterans Affairs Medical Center, Salt Lake City, UT, USA.
Prescott G Woodruff, Division of Pulmonary, Critical Care, Allergy, and Sleep Medicine, Department of Medicine, University of San Francisco Medical Center, University of California San Francisco, San Francisco, CA, USA.
Wanda K O’Neal, Marsico Lung Institute/Cystic Fibrosis and Pulmonary Research Center, University of North Carolina at Chapel Hill, Chapel Hill, NC, USA.
Richard C Boucher, Marsico Lung Institute/Cystic Fibrosis and Pulmonary Research Center, University of North Carolina at Chapel Hill, Chapel Hill, NC, USA.
Mehmet Kesimer, Marsico Lung Institute/Cystic Fibrosis and Pulmonary Research Center, University of North Carolina at Chapel Hill, Chapel Hill, NC, USA.
References
- 1.Hogg JC, Pare PD, Hackett TL. The contribution of small airway obstruction to the pathogenesis of chronic obstructive pulmonary disease. Physiol Rev 2017; 97: 529–52. [DOI] [PMC free article] [PubMed] [Google Scholar]
- 2.Akinbami LJ, Liu X. Chronic obstructive pulmonary disease among adults aged 18 and over in the United States, 1998–2009. NCHS Data Brief 2011; 63: 1–8. [PubMed] [Google Scholar]
- 3.Rodriguez-Roisin R, Han MK, Vestbo J, Wedzicha JA, Woodruff PG, Martinez FJ. Chronic respiratory symptoms with normal spirometry. A reliable clinical entity? Am J Respir Crit Care Med 2017; 195: 17–22. [DOI] [PubMed] [Google Scholar]
- 4.Martinez FJ, Han MK, Allinson JP, et al. At the root: defining and halting progression of early chronic obstructive pulmonary disease. Am J Respir Crit Care Med 2018; 197: 1540–51. [DOI] [PMC free article] [PubMed] [Google Scholar]
- 5.Woodruff PG, Barr RG, Bleecker E, et al. Clinical significance of symptoms in smokers with preserved pulmonary function. N Engl J Med 2016; 374: 1811–21. [DOI] [PMC free article] [PubMed] [Google Scholar]
- 6.Boucher RC. Muco-obstructive lung diseases. N Engl J Med 2019; 380: 1941–53. [DOI] [PubMed] [Google Scholar]
- 7.Kesimer M, Ford AA, Ceppe A, et al. Airway mucin concentration as a marker of chronic bronchitis. N Engl J Med 2017; 377: 911–22. [DOI] [PMC free article] [PubMed] [Google Scholar]
- 8.Button B, Goodell HP, Atieh E, et al. Roles of mucus adhesion and cohesion in cough clearance. Proc Natl Acad Sci USA 2018; 115: 12501–06. [DOI] [PMC free article] [PubMed] [Google Scholar]
- 9.Roy MG, Livraghi-Butrico A, Fletcher AA, et al. Muc5b is required for airway defence. Nature 2014; 505: 412–16. [DOI] [PMC free article] [PubMed] [Google Scholar]
- 10.Bonser LR, Zlock L, Finkbeiner W, Erle DJ. Epithelial tethering of MUC5AC-rich mucus impairs mucociliary transport in asthma. J Clin Invest 2016; 126: 2367–71. [DOI] [PMC free article] [PubMed] [Google Scholar]
- 11.Ramsey KA, Chen ACH, Radicioni G, et al. Airway mucus hyperconcentration in non-cystic fibrosis bronchiectasis. Am J Respir Crit Care Med 2020; 201: 661–70. [DOI] [PMC free article] [PubMed] [Google Scholar]
- 12.Henderson AG, Ehre C, Button B, et al. Cystic fibrosis airway secretions exhibit mucin hyperconcentration and increased osmotic pressure. J Clin Invest 2014; 124: 3047–60. [DOI] [PMC free article] [PubMed] [Google Scholar]
- 13.Couper D, LaVange LM, Han M, et al. Design of the Subpopulations and Intermediate Outcomes in COPD Study (SPIROMICS). Thorax 2014; 69: 491–94. [DOI] [PMC free article] [PubMed] [Google Scholar]
- 14.Hastie AT, Martinez FJ, Curtis JL, et al. Association of sputum and blood eosinophil concentrations with clinical measures of COPD severity: an analysis of the SPIROMICS cohort. Lancet Respir Med 2017; 5: 956–67. [DOI] [PMC free article] [PubMed] [Google Scholar]
- 15.Ferris BG. Epidemiology standardization project (American Thoracic Society). Am Rev Respir Dis 1978; 118: 1–120. [PubMed] [Google Scholar]
- 16.Wisniewski JR, Zougman A, Nagaraj N, Mann M. Universal sample preparation method for proteome analysis. Nat Methods 2009; 6: 359–62. [DOI] [PubMed] [Google Scholar]
- 17.Woodruff PG, Boushey HA, Dolganov GM, et al. Genome-wide profiling identifies epithelial cell genes associated with asthma and with treatment response to corticosteroids. Proc Natl Acad Sci USA 2007; 104: 15858–63. [DOI] [PMC free article] [PubMed] [Google Scholar]
- 18.Cho JL, Ling MF, Adams DC, et al. Allergic asthma is distinguished by sensitivity of allergen-specific CD4+ T cells and airway structural cells to type 2 inflammation. Sci Transl Med 2016; 8: 359ra132. [DOI] [PMC free article] [PubMed] [Google Scholar]
- 19.Jenkins R, Duggan JX, Aubry AF, et al. Recommendations for validation of LC-MS/MS bioanalytical methods for protein biotherapeutics. AAPS J 2015; 17: 1–16. [DOI] [PMC free article] [PubMed] [Google Scholar]
- 20.Kesimer M, Smith BM, Ceppe A, et al. Mucin concentrations and peripheral airway obstruction in chronic obstructive pulmonary disease. Am J Respir Crit Care Med 2018; 198: 1453–56. [DOI] [PMC free article] [PubMed] [Google Scholar]
- 21.Hogg JC, Chu F, Utokaparch S, et al. The nature of small-airway obstruction in chronic obstructive pulmonary disease. N Engl J Med 2004; 350: 2645–53. [DOI] [PubMed] [Google Scholar]
- 22.Kummarapurugu AB, Zheng S, Ledford J, Karandashova S, Voynow JA. High-mobility group box 1 upregulates MUC5AC and MUC5B expression in primary airway epithelial cells. Am J Respir Cell Mol Biol 2018; 58: 126–28. [DOI] [PMC free article] [PubMed] [Google Scholar]
- 23.Kanai K, Koarai A, Shishikura Y, et al. Cigarette smoke augments MUC5AC production via the TLR3-EGFR pathway in airway epithelial cells. Respir Investig 2015; 53: 137–48. [DOI] [PubMed] [Google Scholar]
- 24.Ma J, Rubin BK, Voynow JA. Mucins, mucus, and goblet cells. Chest 2018; 154: 169–76. [DOI] [PubMed] [Google Scholar]
- 25.Fujisawa T, Velichko S, Thai P, Hung LY, Huang F, Wu R. Regulation of airway MUC5AC expression by IL-1beta and IL-17A; the NF-kappaB paradigm. J Immunol 2009; 183: 6236–43. [DOI] [PMC free article] [PubMed] [Google Scholar]
- 26.Chen G, Sun L, Kato T, et al. IL-1beta dominates the promucin secretory cytokine profile in cystic fibrosis. J Clin Invest 2019; 129: 4433–50. [DOI] [PMC free article] [PubMed] [Google Scholar]
- 27.Anderson WH, Coakley RD, Button B, et al. The relationship of mucus concentration (hydration) to mucus osmotic pressure and transport in chronic bronchitis. Am J Respir Crit Care Med 2015; 192: 182–90. [DOI] [PMC free article] [PubMed] [Google Scholar]
- 28.Button B, Cai LH, Ehre C, et al. A periciliary brush promotes the lung health by separating the mucus layer from airway epithelia. Science 2012; 337: 937–41. [DOI] [PMC free article] [PubMed] [Google Scholar]
- 29.Martinez CH, Diaz AA, Meldrum C, et al. Age and small airway imaging abnormalities in subjects with and without airflow obstruction in SPIROMICS. Am J Respir Crit Care Med 2017; 195: 464–72. [DOI] [PMC free article] [PubMed] [Google Scholar]
- 30.Bhatt SP, Soler X, Wang X, et al. Association between functional small airway disease and FEV1 decline in chronic obstructive pulmonary disease. Am J Respir Crit Care Med 2016; 194: 178–84. [DOI] [PMC free article] [PubMed] [Google Scholar]
- 31.McNulty W, Usmani OS. Techniques of assessing small airways dysfunction. Eur Clin Respir J 2014; published online October 17. 10.3402/ecrj.v1.25898. [DOI] [PMC free article] [PubMed]
- 32.Donaldson GC, Seemungal TA, Patel IS, Lloyd-Owen SJ, Wilkinson TM, Wedzicha JA. Longitudinal changes in the nature, severity and frequency of COPD exacerbations. Eur Respir J 2003; 22: 931–36. [DOI] [PubMed] [Google Scholar]
- 33.Vestbo J, Prescott E, Lange P. Association of chronic mucus hypersecretion with FEV1 decline and chronic obstructive pulmonary disease morbidity. Copenhagen City Heart Study Group. Am J Respir Crit Care Med 1996; 153: 1530–35. [DOI] [PubMed] [Google Scholar]
- 34.Abdelwahab SH, Reidel B, Martin JR, et al. Cigarillos compromise the mucosal barrier and protein expression in airway epithelia. Am J Respir Cell Mol Biol 2020; 63: 767–79. [DOI] [PMC free article] [PubMed] [Google Scholar]
- 35.Cao X, Wang Y, Xiong R, et al. Cigarette whole smoke solutions disturb mucin homeostasis in a human in vitro airway tissue model. Toxicology 2018; 409: 119–28. [DOI] [PubMed] [Google Scholar]
- 36.Shao MX, Nakanaga T, Nadel JA. Cigarette smoke induces MUC5AC mucin overproduction via tumor necrosis factor-alpha-converting enzyme in human airway epithelial (NCI-H292) cells. Am J Physiol Lung Cell Mol Physiol 2004; 287: L420–27. [DOI] [PubMed] [Google Scholar]
- 37.Hogg JC. Why does airway inflammation persist after the smoking stops? Thorax 2006; 61: 96–97. [DOI] [PMC free article] [PubMed] [Google Scholar]
- 38.Lapperre TS, Postma DS, Gosman MM, et al. Relation between duration of smoking cessation and bronchial inflammation in COPD. Thorax 2006; 61: 115–21. [DOI] [PMC free article] [PubMed] [Google Scholar]
- 39.Soriano JB, Polverino F, Cosio BG. What is early COPD and why is it important? Eur Respir J 2018; 52: 1801448. [DOI] [PubMed] [Google Scholar]
- 40.Atsou K, Chouaid C, Hejblum G. Variability of the chronic obstructive pulmonary disease key epidemiological data in Europe: systematic review. BMC Med 2011; 9: 7. [DOI] [PMC free article] [PubMed] [Google Scholar]
Associated Data
This section collects any data citations, data availability statements, or supplementary materials included in this article.