

Summary
The etiological role of NSD2 enzymatic activity in solid tumors is unclear. Here we show that NSD2, via H3K36me2 catalysis, cooperates with oncogenic KRAS-signaling to drive lung adenocarcinoma (LUAD) pathogenesis. In vivo expression of NSD2E1099K, a hyperactive variant detected in LUAD patients, rapidly accelerates malignant tumor progression while decreasing survival in KRAS-driven LUAD mouse models. Pathologic H3K36me2 generation by NSD2 amplifies transcriptional output of KRAS and several complementary oncogenic gene expression programs. We establish a versatile in vivo CRISPRi-based system to test gene functions in LUAD and find that NSD2 loss strongly attenuates tumor progression. NSD2 knockdown also blocks neoplastic growth of patient-derived xenografts from primary LUAD. Finally, a treatment regimen combining NSD2 depletion with MEK1/2 inhibition causes nearly complete regression of LUAD tumors. Together, our work identifies NSD2 as a bona fide LUAD therapeutic target and suggests a pivotal epigenetic role for the NSD2-H3K36me2 axis in sustaining oncogenic signaling.
Keywords: NSD2, histone methylation, epigenetics, lung cancer, lung adenocarcinoma, H3K36, chromatin, KRAS, MEK inhibition, lysine methylation
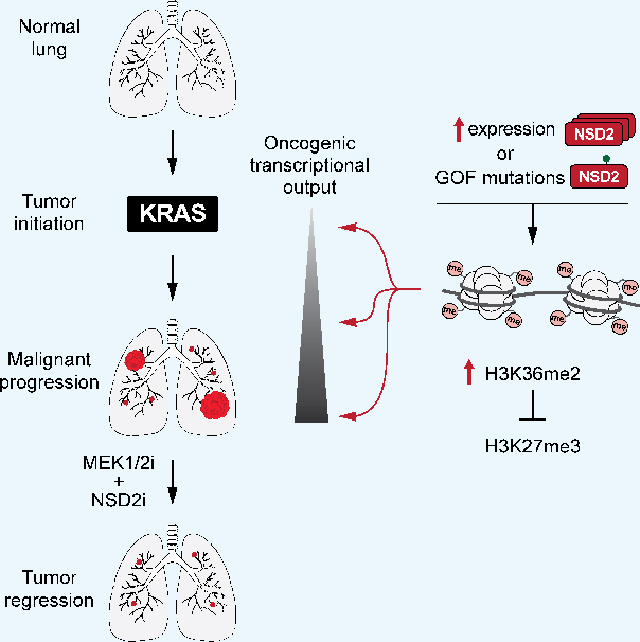
Graphical Abstract
eTOC:
NSD2 is a key epigenetic enzyme that generates the canonical histone modification H3K36me2. Sengupta et. al. show that NSD2 hyperactivity promotes aggressive malignant lung tumor pathogenesis in vivo and uncover a mechanism by which lung cancers become dependent on an NSD2-H3K36me2 axis to sustain transcriptional programs driving tumorigenesis.
Introduction
NSD2 physiologically generates the bulk of H3K36me2 in most cultured cell types and its deregulation due to chromosomal translocation and gain-of-function mutations are etiologically linked to different hematologic malignancies (Bennett et al., 2017; Husmann and Gozani, 2019; Jaffe et al., 2013; Kuo et al., 2011; Li et al., 2019). NSD2 is also implicated in the pathogenesis of diverse solid tumors (Bennett et al., 2017; Garcia-Carpizo et al., 2016; Hudlebusch et al., 2011; Husmann and Gozani, 2019; Li et al., 2019). For example, NSD2 plays an important role in promoting the metastatic behavior of prostate cancers (Aytes et al., 2018; Li et al., 2017), consistent with the H3K36me2 modification being generally associated with the epithelial-mesenchymal transition and cancer cell metastasis (Yuan et al., 2020). In addition, the gain-of-function NSD2E1099K variant that is commonly found in blood cancers is also detected in several solid tumors, including lung adenocarcinoma (Cancer Genome Atlas Research, 2014; Jaffe et al., 2013; Oyer et al., 2014). Indeed, NSD2 was previously shown to contribute to the proliferation of KRAS-mutant lung cancer cell lines (Garcia-Carpizo et al., 2016). However, despite the many links between NSD2 expression and different solid tumors, the role of NSD2’s histone methylation activity in promoting tumorigenesis of a solid tumor is unclear. Furthermore, the therapeutic potential of targeting NSD2 in progressing malignant disease is yet to be evaluated.
LUAD, a leading cause of cancer-related mortality worldwide (Sung et al., 2021), is frequently driven by oncogenic activating mutations, including several in the KRAS-signaling pathway and different receptor tyrosine kinases such as EGFR, ALK and MET (Konig et al., 2021). Target therapies against the different cancer-driving genetic alterations have shown varying degree of promise in the clinic as precision medicines (Konig et al., 2021). For example, clinical trials suggest that LUAD patients harboring a specific KRAS mutation, G12C, will benefit from recently developed KRASG12C-specific inhibitors (Canon et al., 2019). Unfortunately, as with other targeted therapies, cancer cells develop resistance to these drugs via multiple mechanisms, including through upregulating KRASG12C expression (Xue et al., 2020). Moreover, besides the successful targeting of KRASG12C, inhibitors against other KRAS mutations are yet to be developed. Pharmacologic blockade of downstream KRAS effector pathways has served as an alternative approach, but issues with resistance emerging and toxicity have limited the efficacy of these medicine. Thus, a key to improving LUAD patient outcomes is finding clinically actionable pathways that can complement current treatment modalities in the context of combination therapies (Hirsch et al., 2016; Ruiz-Cordero and Devine, 2020).
Here we show that upregulation of NSD2 expression is common in LUAD and increased levels of NSD2 protein and H3K36me2 correlate with a negative clinical prognosis. NSD2, via selective generation of H3K36me2, accelerates aggressive malignant tumor progression in vivo in LUAD mouse models, whereas NSD2 depletion inhibits LUAD tumor growth in human and mouse models. NSD2 activity at chromatin amplifies KRAS output and promotes several additional oncogenic gene expression programs. Finally, we find that blocking NSD2 via in vivo CRISPRi in combination with inhibition of MEK1/2 causes near complete regression of actively growing malignant tumors, suggesting that future application of an NSD2 inhibitor in cooperation with current targeted therapies may significantly improve the treatment outcome for lung cancer.
Results
The expression of NSD2 is elevated in a wide range of cancers relative to normal tissue (Hudlebusch et al., 2011), suggesting broad roles for NSD2 in oncogenesis. In this context, NSD2 mRNA levels are elevated across diverse non-small cell lung cancer gene expression datasets relative to normal lung tissue (Figure S1A). Moreover, high NSD2 protein level significantly correlates with poor LUAD patient survival (Figure 1A) and levels of H3K36me2 increase significantly from normal tissue through advancing grades of LUAD malignancy (Figure 1B). These data suggest a clinically relevant role for the NSD2-H3K36me2 axis in LUAD.
Figure 1. Increased NSD2 and H3K36me2 levels associated with poor LUAD prognosis.
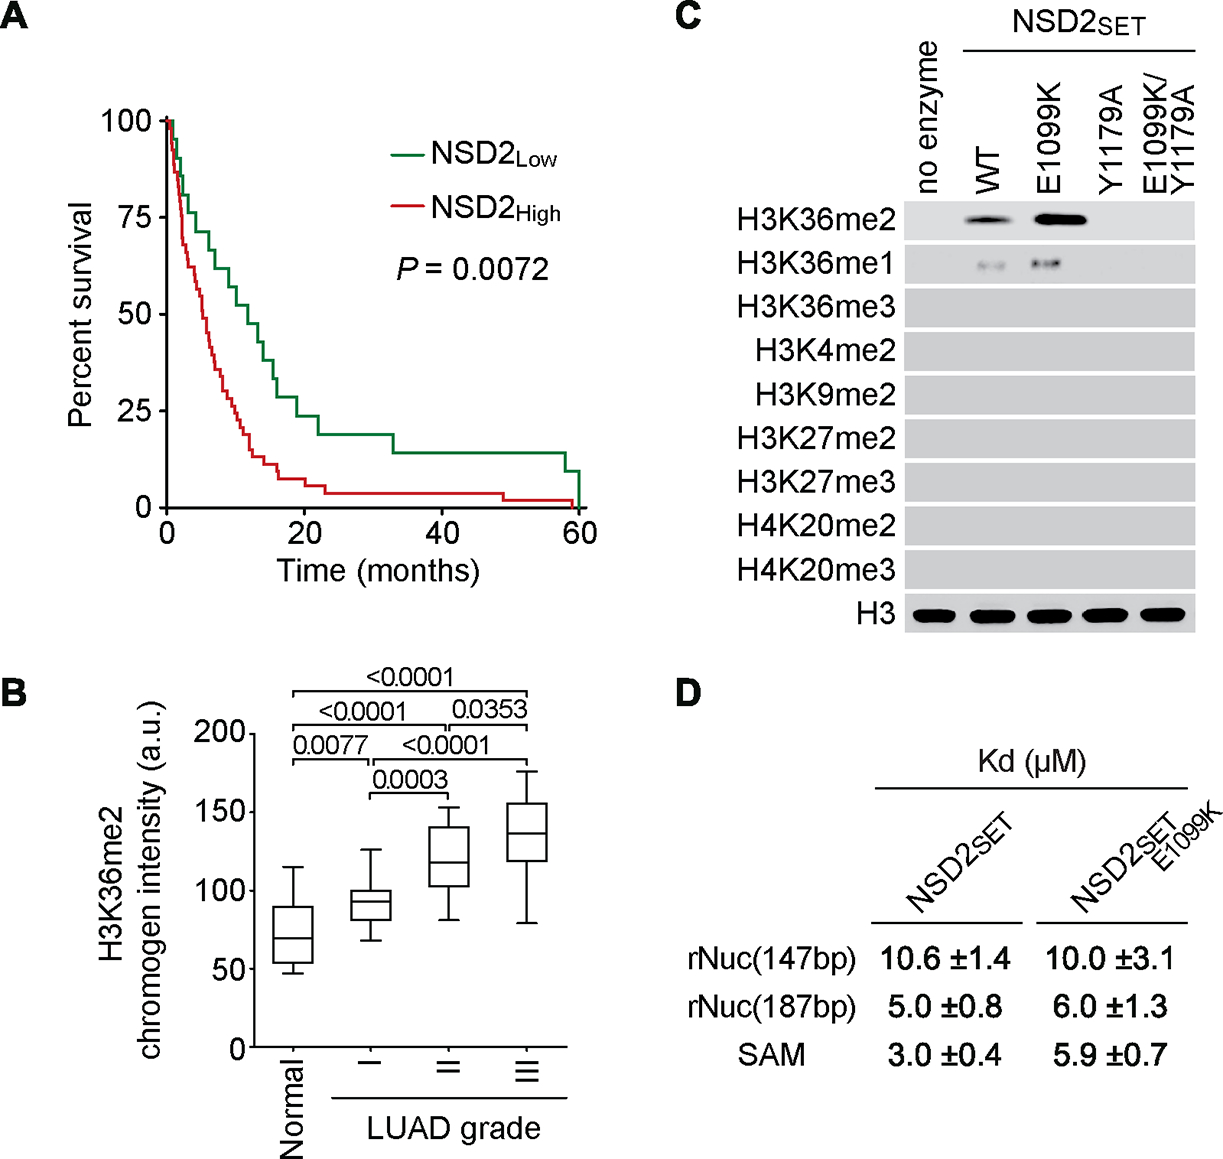
(A) NSD2 protein expression levels in LUAD biopsy samples negatively correlate with LUAD patient survival. Analysis of correlation between NSD2 staining signal in tumor and LUAD patient survival assessed by immunohistochemistry (IHC). P values determined by log-rank test, 72 LUAD samples were stained in total. (B) Increased H3K36me2 levels in advancing grades of LUAD. Quantification of IHC chromogen stain intensity shows increasing levels of H3K36me2 from normal human lung (n = 24) to increasing histological grades of LUAD (n = 72). P values were determined by two-way ANOVA with Tukey’s testing for multiple comparisons. Box plots, the line indicates the median, the box marks the 75th and 25th percentiles and the whiskers indicate the minimum and maximum values. (C) NSD2E1099K hyperactive variant retains wild-type selectivity for H3K36me2. In vitro methylation reactions with wild-type (WT) NSD2 catalytic domain (NSD2SET), or NSD2SET harboring E1099K or E1099K combined with a catalytic inactivating mutation (E1099K/Y1179A) as indicated on recombinant nucleosome substrate. Western blots of the reaction products with the indicated antibodies. H3 is shown as a loading control. (d) The E1099K substitution decreases binding affinity for SAM but does not alter binding affinity for nucleosomes. Biochemical characterization of E1099K substitution on the NSD2SET domain. Kd values with corresponding s.d. errors (three independent experiments) are shown for binding studies of NSD2SET and NSD2SET-E1099K to recombinant nucleosomes (rNuc) reconstituted on 147bp and 187bp 601 Widom DNA as indicated (determined by microscale thermophoresis, MST) and the cofactor SAM (determined by ITC) (see Figures S1F–G).
E1099K substitution increases NSD2’s H3K36 di-methylation activity without altering substrate specificity
NSD2E1099K, an NSD2 gain-of-function variant commonly found in blood cancers (Jaffe et al., 2013), is also found in LUAD (The Cancer Genome Atlas (Cancer Genome Atlas Research, 2014; Oyer et al., 2014)). The E1099K substitution increases NSD2 H3K36 methylation activity (Jaffe et al., 2013; Li et al., 2021). However, whether NSD2E1099K retains the catalytic selectivity of wild-type enzyme is unclear. Consistent with previous work (Jaffe et al., 2013), recombinant NSD2’s catalytic domain (NSD2SET-E1099K) harboring E1099K was more efficient in generating H3K36me2 on nucleosomes than wild-type (NSD2SET) enzyme in in vitro methylation assays (Figures 1C and S1B–C). This increased activity was abrogated when paired with a catalytic mutant (Kuo et al., 2011) (Figures 1C and S1C). Recombinant full-length NSD2E1099K, like the isolated catalytic domain, is also hyperactive relative to NSD2WT (Figure S1D–E). E1099K, despite increasing NSD2’s methylation activity, did not alter (i) the requirement for nucleosomal versus free H3 as substrate (Figures S1B–C), (ii) methylation state specificity (generation of H3K36me1/2 but not H3K36me3) (Figure 1C), and (iii) site-specific selectivity (K36 is a substrate but other H3 lysine residues are not) (Figure 1C). Notably, while the E1099K substitution did not alter the binding affinity of NSD2SET for nucleosomes, the affinity for the cofactor methyl donor S-adenosyl-L-methionine (SAM) decreased by two-fold (Figures 1D and S1F–G), suggesting that the E1099K substitution increases NSD2’s catalytic activity by increasing the rate of SAM turnover.
Beyond H3K36, NSD2 was recently reported to methylate and activate the tumor suppressor PTEN (Zhang et al., 2019), a finding that is at odds with NSD2’s reputed role in promoting oncogenesis. In this context, we failed to reproduce any evidence of PTEN methylation by NSD2 or NSD2E1099K in vitro or in cells, even when using the same experimental conditions described in (Zhang et al., 2019) (Figures S2A–C). Furthermore, both NSD2 and NSD2E1099K did not directly methylate any previously proposed substrates (Figures S2A–D) and methylated only H3, and not any other protein, in cellular extracts (Figures S2E). These data are consistent with structural analyses showing that NSD2 engagement with nucleosomal DNA is required for transitioning from an auto-inhibitory state to an enzymatically active one (Li et al., 2021). Thus, E1099K increases NSD2’s H3K36 methylation activity, but does not alter selectively for H3K36me2, and NSD2 – irrespective of E1099K – is unlikely to have a physiologically relevant non-histone substrate.
NSD2 catalytic activity regulates LUAD cell phenotypes
NSD2 knockdown by two independent sgRNAs in A549 cells, a KRAS-mutant harboring LUAD cell line (Imai et al., 1994), caused depletion of H3K36me2 (with a corresponding increase in H3K27me3) and inhibited cellular proliferation (Figures 2A–B). The NSD2 knockdown-associated changes were reversed by complementing NSD2-depleted cells with CRISPR-resistant NSD2 and NSD2E1099K, but not with the catalytically dead variant (Figures 2C–D and S2F). We note that ectopic expression of NSD2 and NSD2E1099K caused an increase in A549 cell proliferation beyond the rate of these already fast-growing control cells, with cells expressing the E1099K variant proliferating most rapidly (Figure 2D). In addition to regulating proliferation, NSD2 depletion also inhibits A549 xenograft growth (Figure S2G) and renders A549 cells more sensitive to treatment with Trametinib, an FDA-approved MEK1/2 inhibitor (MEKi) (Odogwu et al., 2018; Wright and McCormack, 2013) (Figures 2E–F). This drug sensitivity is reversed by complementing cells with wild-type and E1099K NSD2, but not with the catalytic mutant (Figures 2E–F). Moreover, ectopic expression of NSD2 and NSD2E1099K rendered cells more resistant to MEKi than control cells, and in a manner independent of ERK1/2 phosphorylation (Figures 2E–F). These data raise the possibility that NSD2 catalytic activity may enhance KRAS-signaling at the level of chromatin.
Figure 2. NSD2 enzymatic activity promotes LUAD cell proliferation and resistance to MEKi.
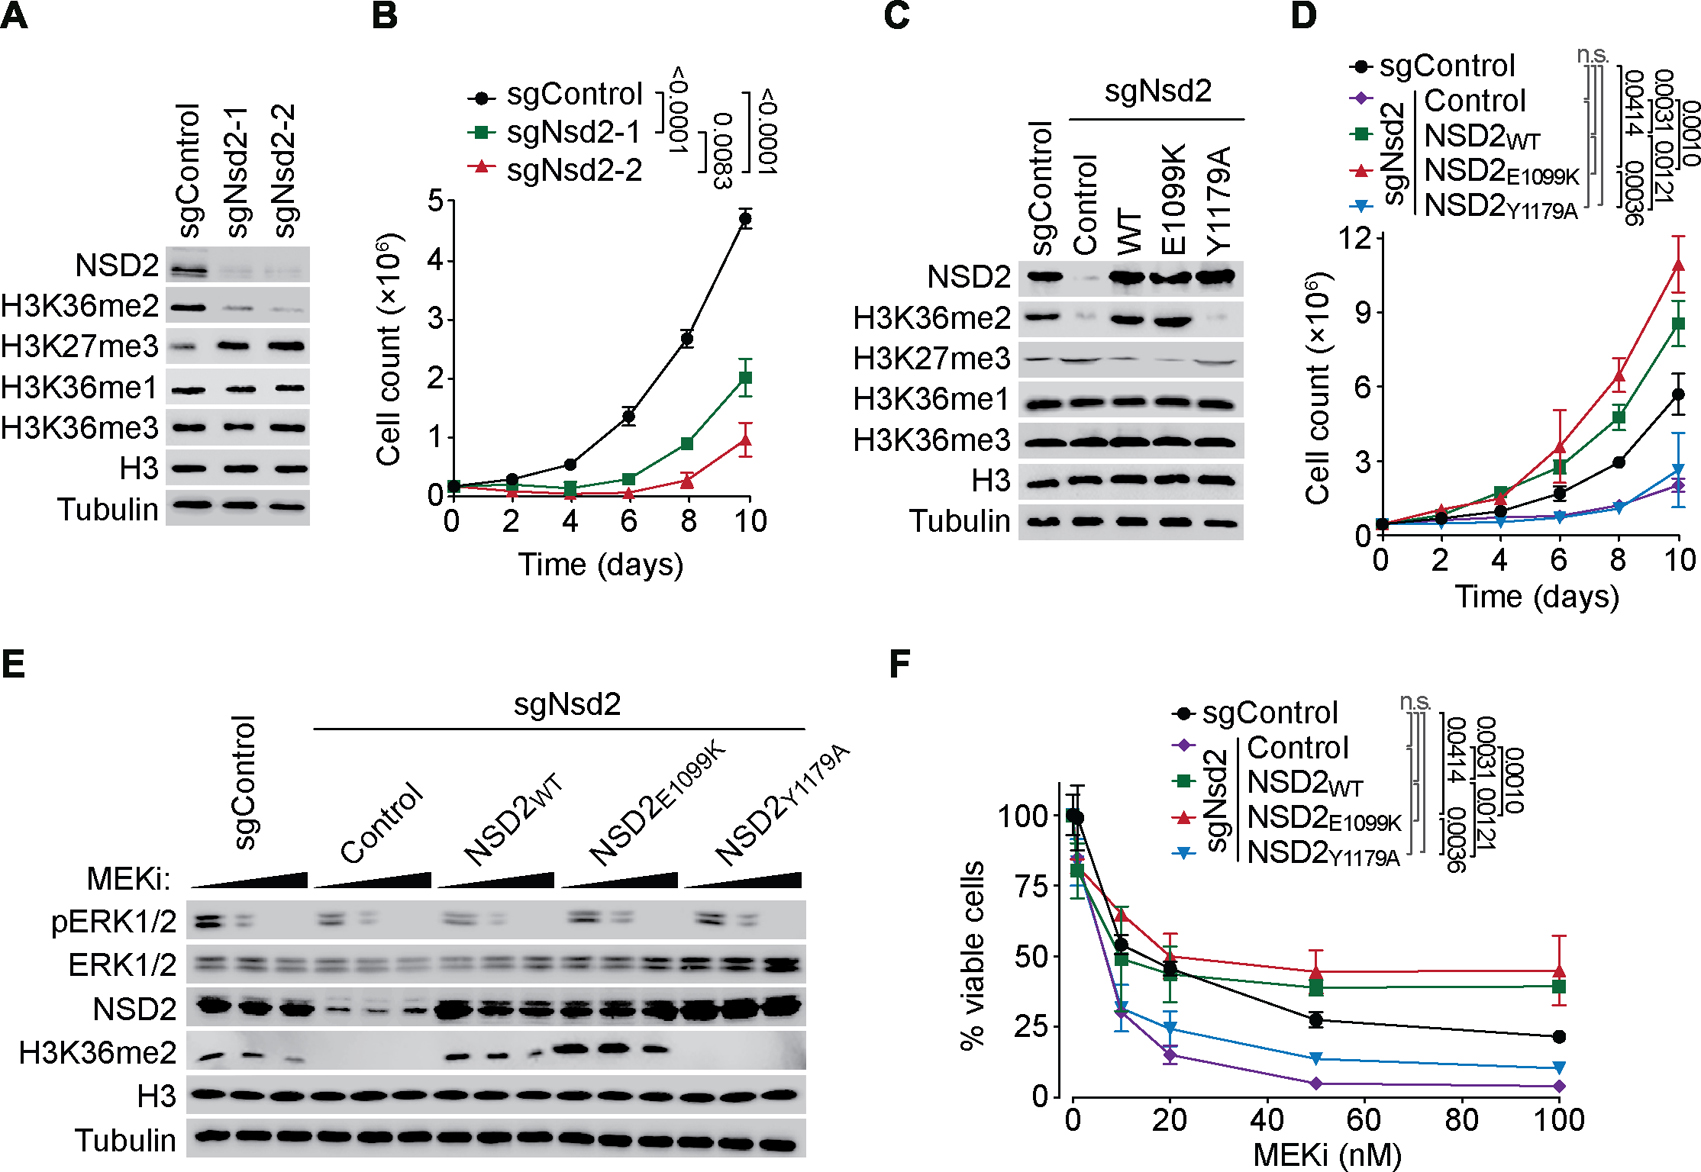
(A-B) NSD2 depletion inhibits proliferation of A549 cells. Western blot analysis with the indicated antibodies (A) and proliferation rates (B) of A549 cells depleted of NSD2 using two independent sgRNAs (sgNsd2-1 and -2) or control (sgControl). Error bars represent mean ± s.e.m. from three independent experiments. P values were determined by two-tailed unpaired t-test. (C-D) NSD2 catalytic activity is required for NSD2-dependent proliferation of A549 LUAD cells. Western blot analysis with the indicated antibodies (C) and proliferation rate (D) of NSD2 depleted cells complemented with CRISPR-resistant wild-type or the indicated NSD2 variants, or control vector. Error bars represent mean ± s.e.m. from three independent experiments. P values were determined by two-tailed unpaired t-test. (E-F) NSD2 depletion renders A549 cells more sensitive to MEKi (Trametinib) treatment. Western blot analysis with the indicated antibodies (E) and percent cell viability (F) of A549 cells ± NSD2 complemented with CRISPR-resistant NSD2 as in (C), treated with DMSO (control) or 25 nM and 50 nM MEKi (E) or the indicated concentrations of MEKi (f) for 48 hours. Data represent mean ± s.e.m. of three technical replicates in two independent experiments. P values were determined by two-way ANOVA with Tukey’s testing for multiple comparisons.
NSD2-H3K36me2 axis promotes LUAD tumorigenesis
Expression of the NSD2E1099K variant was next used to model consequences of elevated NSD2 catalytic activity due to NSD2 overexpression on LUAD tumorigenesis in vivo. We generated Cre-inducible NSD2E1099K mice (Rosa26LSL-Nsd2(E1099K)) and verified transgene expression in fibroblast cells transduced with Cre recombinase-expressing adenovirus (Ad-Cre) ex vivo using an NSD2E1099K-specific antibody (Figures S3A–E). Intratracheal injection of Ad-Cre in adult KrasLSL-G12D/+ (Kras) and KrasLSL-G12D/+; Rosa26LSL-Nsd2(E1099K) (Kras;Nsd2) mice was used to evaluate the impact of NSD2E1099K on KRAS-driven LUAD (Jackson et al., 2001; Johnson et al., 2001) (we note that NSD2E1099K expression alone did not result in tumor formation by 24 weeks (data not shown)). Kras mice are typically analyzed at 16 to 20 weeks after tumor induction when signs of disease develop (Jackson et al., 2001; Johnson et al., 2001; Liu et al., 2019; Mazur et al., 2015). However, a majority of Kras;Nsd2 mice die by 16 weeks, thus tumor analysis was performed at 14 weeks (Figure 3A). Relative to Kras alone, co-expression of NSD2E1099K had little impact on the number of tumor nodules, but did cause a dramatic (>ten-fold) increase in tumor burden due to large individual tumor masses that are clearly visible in the lung (Figures 3A–C). Accordingly, NSD2E1099K expression strongly accelerated malignant progression of the tumors, which also showed increased cell proliferation and decreased apoptosis (Figures 3A, D–F). For example, at 14 weeks, ~67% of Kras;Nsd2 tumors progressed to grade III compared to ~10% in Kras control mice (Figure 3D) and 60% of Kras;Nsd2 mice had liver micrometastases, a feature of advanced malignant disease, whereas no metastases where seen in Kras control mice (data not shown). Consistent with these data, expression of NSD2E1099K reduced lifespan of Kras mice by ~30% (Figure 3G). In biopsy samples, NSD2E1099K expression correlated with higher levels of H3K36me2 relative to Kras control tumor biopsies and normal lung tissue (Figure 3H). Together, these data suggest that NSD2 catalytic activity significantly accelerates the clinical course of KRAS-driven LUAD in vivo.
Figure 3. NSD2E1099K-mediated H3K36me2 synthesis promotes KRAS-driven LUAD tumorigenesis in vivo.
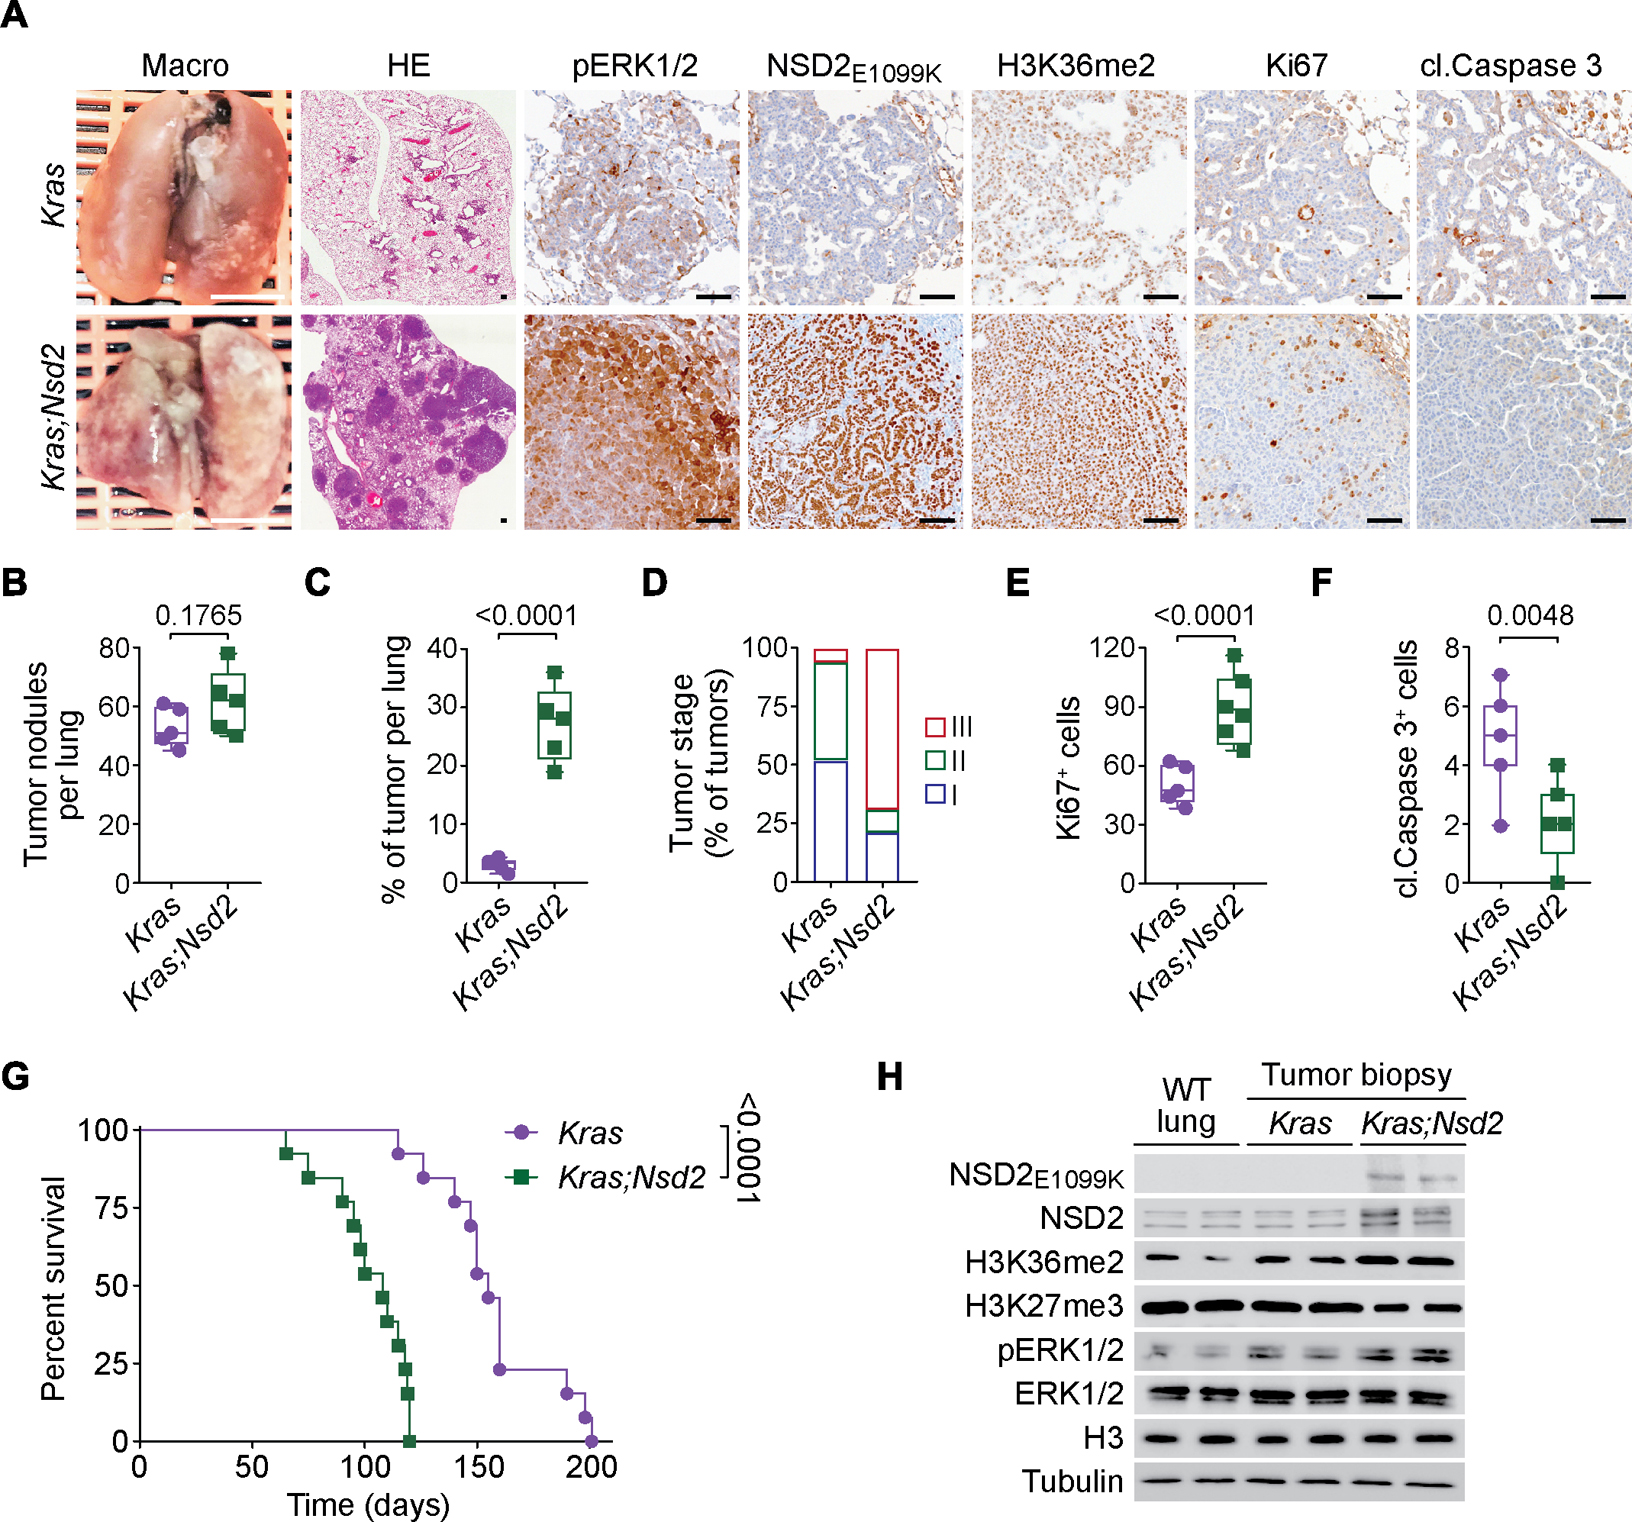
(a) Representative macroscopic lung images, HE and IHC staining with indicated antibodies of lung tissue sections from KrasLSL-G12D/+ (Kras) and KrasLSL-G12D/+;Rosa26LSL-Nsd2(E1099K) (Kras;Nsd2) mutant mice at 14 weeks after tumor induction (representative of n = 6 mice for each group). Scale bars: 100 μm. (B-F) Quantification of total number of tumor nodules (B), tumor burden (tumor area per lung) (C), tumor grade (D), proliferation (Ki67 positive cells per tumor area) (E) and apoptotic cells (cleaved Caspase 3 positive cells per tumor area) (F) in samples as in (A). Data are represented as mean ± s.e.m. P values were determined by two-tailed unpaired t-test. Box plots, the line indicates the median, the box marks the 75th and 25th percentiles and the whiskers indicate the minimum and maximum values. (G) NSD2E1099K expression accelerates KRAS-driven LUAD lethality. Kaplan-Meier survival curves of Kras (n = 13, median survival = 155 days) and Kras;Nsd2 (n = 13, median survival = 108 days) mutant mice. P values were determined by log-rank test. (H) Western blots with the indicated antibodies of normal or tumor lung biopsy lysate as indicated from wild type, Kras and Kras;Nsd2 mutant mice. Two independent samples are shown for each genotype. H3 and Tubulin are shown as a loading control.
Comparison of the transcriptomes of lungs from Kras and Kras;Nsd2 mutant mice to normal lungs identified significant overlap in upregulated differentially expressed genes (uDEGs) (Figures S3F–G). Further, gene set enrichment analysis (GSEA) profiles showed that the tumor datasets strongly overlapped with KRAS oncogenic signatures, anti-apoptotic pathways, and pro-inflammatory programs that can contribute to LUAD pathogenesis (Figures S3H–I). Thus, the combined activities of oncogenic mutant forms of KRAS and NSD2 drive rapidly growing malignant LUAD tumors in vivo and are associated with induction of several oncogenic-promoting gene expression programs.
Oncogenic reprogramming by NSD2
To further explore the role of NSD2 in shaping the transcriptomes of LUAD, cell lines were derived from Kras and Kras;Nsd2 tumors; hereto referred to as Kras and KN cells, respectively. Relative to Kras cells, KN cells proliferate more rapidly, and as expected, have higher levels of NSD2 and H3K36me2, and lower levels of H3K27me3 (Figures S4A–B). Knockdown of NSD2E1099K in KN cells results in H3K36me2 loss, H3K27me3 gain, and inhibition of cell proliferation (Figures 4A–B; S4C). These alterations are rescued by complementing cells with catalytically active NSD2, but not with a catalytic-dead variant (Figures 4A–B). Comparison of the transcriptomes of KN cells ±NSD2 showed that NSD2 is associated with transcriptional activation, as upon knockdown, the expression of over twice as many genes decreased versus increased (657 versus 285, respectively) (Figure 4C). Further, NSD2 regulated KRAS-driven transcriptional signatures (MAPK, PI3K-mTOR, AMPK) as well as other key cancer hallmark gene signatures regulated by MYC, E2F, WNT, and signatures associated with invasiveness, poor survival, and inflammation (Cancer Genome Atlas Research, 2014; Sweet-Cordero et al., 2005) (Figures 4D; S4D). Notably, in myeloma cells, NSD2, via regulation of super enhancers, is implicated in inducing KRAS expression and hence enrichment in KRAS-driven gene expression pathways (Lhoumaud et al., 2019); though in our system we did not observe NSD2-dependent KRAS mRNA or protein level changes (Figures S4E–F). Regulation of several LUAD-associated gene targets (e.g. Jun, Fosl1) was observed in independent NSD2-depleted KN cell lines and dependent on NSD2’s catalytic activity (Figure S4G). Together, these data suggest that in LUAD cells, NSD2 activity at chromatin promotes transcriptional outputs associated with the KRAS-signaling node as well as other canonical oncogenic pathways.
Figure 4. NSD2-H3K36me2 axis regulates oncogenic gene expression programming.

(A-B) NSD2 catalytic activity is required for NSD2-dependent proliferation of KN cells. (A) Western blot analysis with the indicated antibodies of whole cell lysates after reconstitution of NSD2 knockdown (sgNsd2) in KN cells with the indicated CRISPR-resistant NSD2 variants. Control knockdown (sgControl) KN cells are included as controls. H3 and tubulin are used as loading controls. (B) Proliferation assays of cells as in (a). Error bars represent mean ± s.e.m. from three independent experiments. P values were determined by two-tailed unpaired t-test. (C) NSD2 expression correlates with gene activation. Volcano plot of RNA-seq comparison between KN cells ± sgNsd2 (two independent biological replicates for each condition). NSD2 depletion results in decreased expression of 657 genes shown in blue (fold change log2 ≤ −0.8, false discovery rate (FDR) < 0.1 from DESeq2) and increased expression of 285 genes shown in red (fold change log2 ≥ 0.8, FDR < 0.1 from DESeq2). FDR values are provided. (D) NSD2 regulates multiple oncogenic programs. Examples of top gene sets enrichment analysis (GSEA) signatures associated with NSD2-dependent DEGs in KN cells. P values are provided (see Figure S4D for complete set; detailed statistics description in Methods). (E) CUT&RUN profiles of NSD2, H3K36me2 or H3K27me3 over averaged gene body for all genes in KN cells ± sgNsd2 as indicated. (F) Quantification of NSD2, H3K36me2 and H3K27me3 normalized read densities in KN cells ± sgNsd2 on the gene bodies of dDEGs as indicated. P values are provided (see detailed statistics description in the Methods section). (G) Quantification of the change in H3K27me3 normalized read density signal in KN cells upon NSD2 depletion within the indicated gene sets (all genes, dDEGs, and uDEGs), and the significance in the difference in change between the three gene sets as indicated. P values were calculated by Wilcoxon rank sum test. (H) Normalized gene expression levels of all genes, dDEGs, and uDEGs in KN cells. P values were determined by Wilcoxon rank sum test. The expression is shown as log2 of transcripts per kilobase of million mapped reads (TPM) values. In (G, H) box plots, the line indicates the median, the box marks the 75th and 25th percentiles and the whiskers indicate the minimum and maximum values.
Next, Cleavage Under Targets and Release Using Nuclease (CUT&RUN) (Skene and Henikoff, 2017) was used to profile the genomic distribution of NSD2, H3K36me2, and H3K27me3 (which is antagonized by H3K36me2 (Fang et al., 2016; Huang and Zhu, 2018; Jaffe et al., 2013; Lu et al., 2016; Popovic et al., 2014; Schmitges et al., 2011; Streubel et al., 2018; Yuan et al., 2021)) in KN cells ±NSD2 depletion. An averaged genome-wide distribution of NSD2 and H3K36me2 in KN cells across all gene bodies shows that the two profiles are similar, with the signals peaking 5’ proximal of the transcription start site (TSS) followed by a slow decay that tilts upwards towards the 3’ end of genes (Figure 4E). Upon NSD2 knockdown, NSD2 and H3K36me2 signals are proportionally diminished across the averaged gene body unit with little change in the overall pattern (Figure 4E). Quantitation of total signal intensity upon NSD2 depletion shows decreased occupancy of NSD2 and H3K36me2 across all regions of the genome, including the gene bodies and promoters of the DEGs, and intergenic domains (Figures 4F; S5A–C). For H3K27me3, NSD2 depletion is associated with a modest elevation in total signal across all gene bodies and intergenic regions, consistent with the observed increase in global H3K27me3 by Western blot analysis (Figures 4E–F; S5A–E). Notably, the largest and most significant changes in H3K27me3 signal elicited by NSD2 depletion occur at the downregulated differentially expressed genes (dDEGs) group compared to uDEGs and all genes groups (Figure 4G). These data are consistent with the high mRNA transcript levels of dDEGs (Figure 4H), which may render these gene targets particularly susceptible to an increase in H3K27me3. The pattern of diminished H3K36me2 and NSD2 and increased H3K27me3 in response to NSD2 knockdown is also observed at the level of individual, LUAD-relevant dDEG (Jun and Fos1l) tracks (Figure S5F; tracks of uDEGs and control genes are shown for comparison). Finally, using chromatin immunoprecipitation (ChIP) assays, we observe a reduction in occupancy of H3K36me2 (and an increase in H3K27me3) at Jun and Fos1l genes upon NSD2 depletion, which was reconstituted to control levels by complementation with wild-type NSD2, but not with catalytic deficient NSD2 (Figure S5G).
NSD2 depletion inhibits Ras-driven LUAD
To evaluate the role of NSD2 in LUAD progression, an in vivo CRISPRi-based system was developed to deplete endogenous NSD2 in an inducible and selective manner in actively growing tumors (Figure 5A; S6A–D). CRISPRi (Ci) mice with Cre-dependent and doxycycline-inducible expression of endonuclease-deficient Cas9 fused to two repressor domains (dCas9-KRAB-MeCP2) were crossed with KrasLSL-G12D/+;p53LoxP/LoxP (KP) mice to generate CiKP mice (Figure 5A). Intratracheal injection of lentivirus expressing Cre and an Nsd2 promoter-targeting sgRNA in adult CiKP mice led to aggressive LUAD within 8 weeks (Figures 5A–B), as expected in this KP mouse model (Feldser et al., 2010). Mice were then treated with vehicle (Ci-Control) or doxycycline to repress Nsd2 transcription (Ci-Nsd2), and tumors monitored for an additional 4 weeks (Figures 5A–B). In tumor biopsies from doxycycline-treated mice, dCas9-KRAB-MeCP2 was induced, and accordingly, levels of NSD2 and H3K36me2 were reduced compared to tumor samples from vehicle-treated mice (Figure 5C). Furthermore, relative to control, NSD2 depletion in growing tumors reduced the number of detectable nodules and caused tumor burden to decrease by ~35% (Figures 5D–E). These changes were accompanied by a reduction in cancer cell proliferation and increased apoptosis (Figures 5F–G; see S6F). Thus, acute depletion of NSD2 in vivo in established LUAD significantly attenuates cancer growth.
Figure 5. CRISPRi mediated suppression of NSD2 attenuates LUAD in vivo.
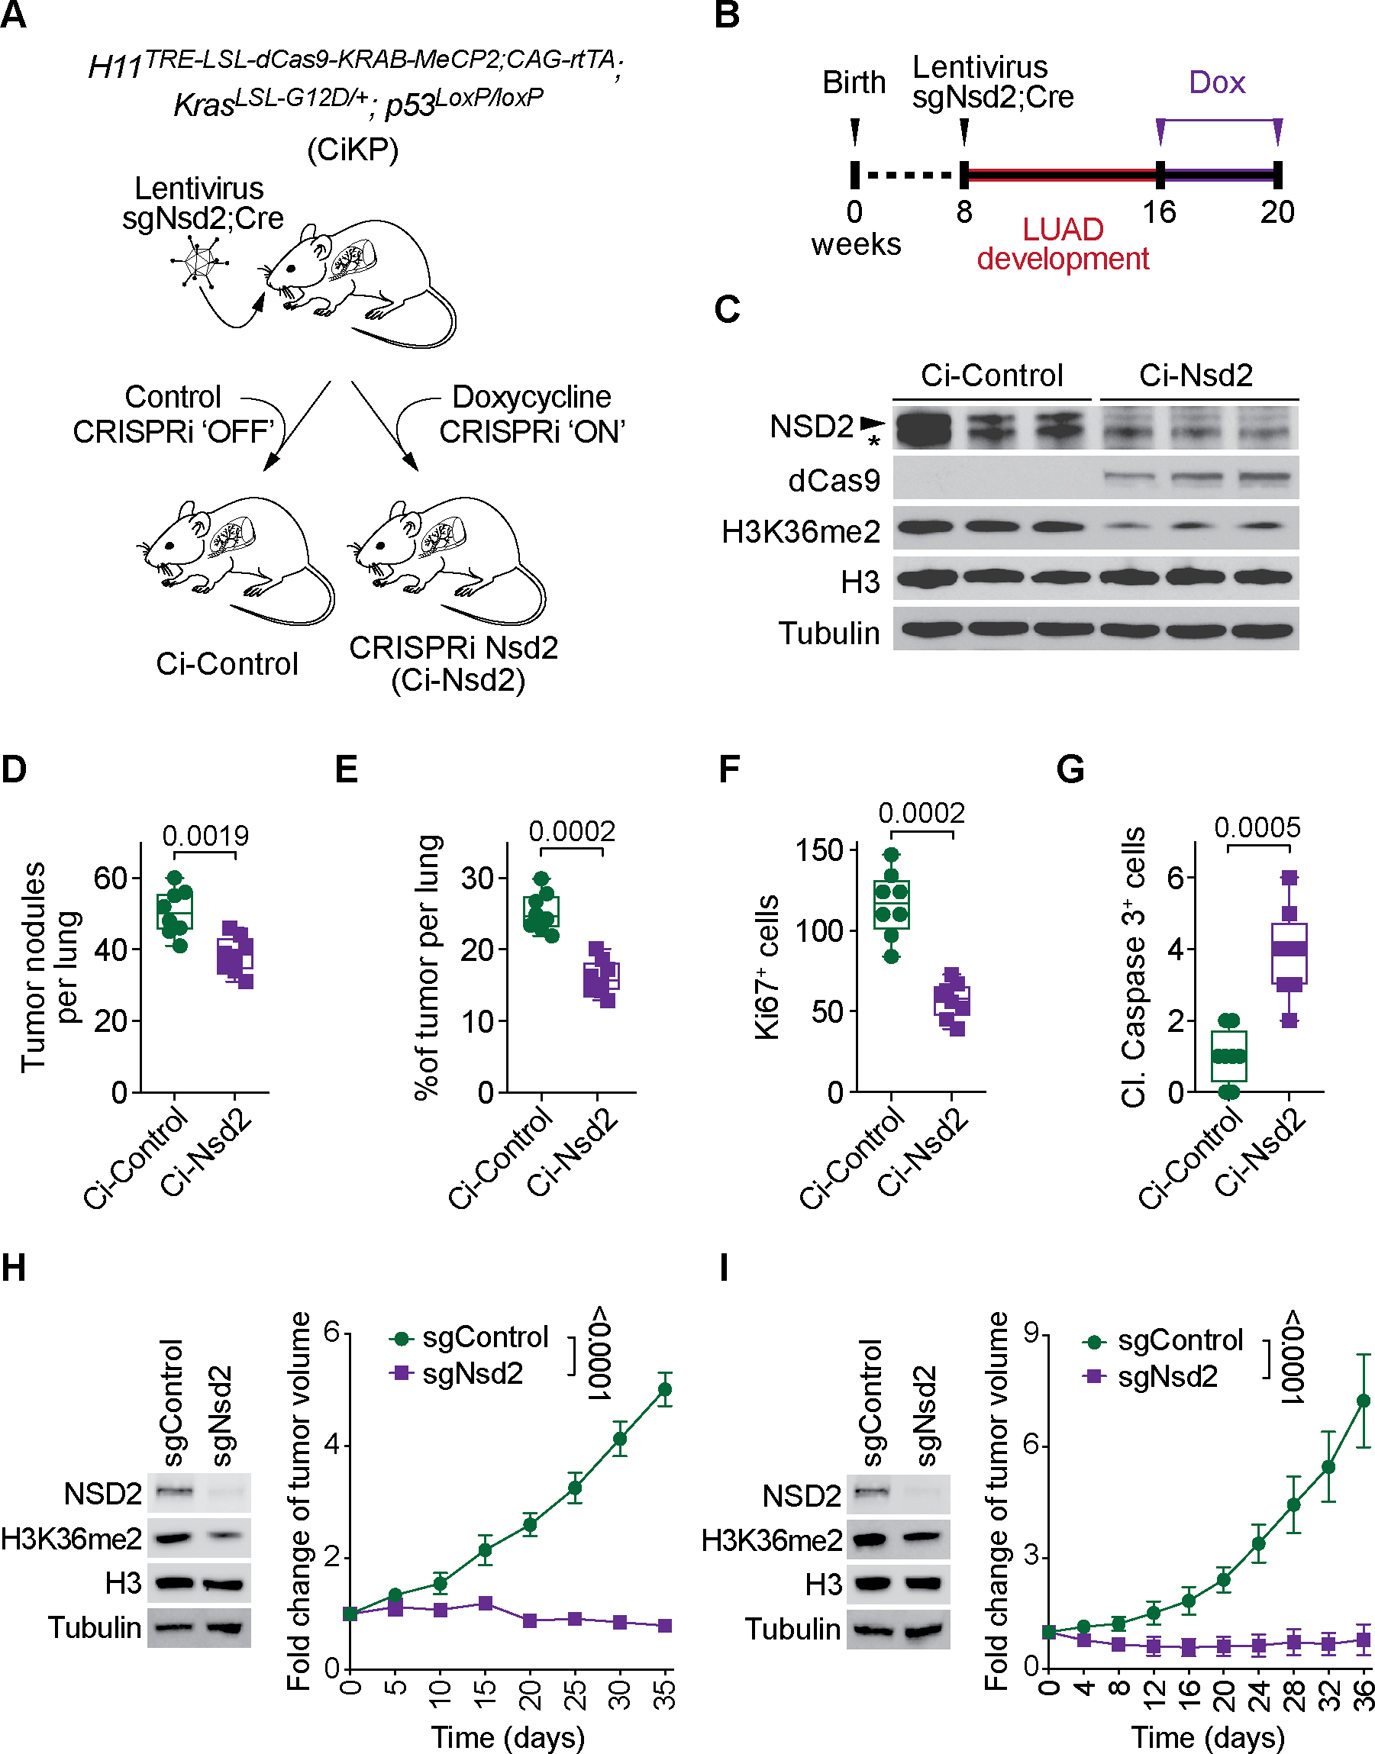
(A) Schematic of generation of a Cre-dependent doxycycline-inducible H11dCas9-KRAB-MeCP2 (Ci) transgenic mouse for CRISPRi mediated suppression of NSD2 in KrasG12D; p53LoxP/LoxP (KP) driven LUAD model. In this model, Cre and sgNsd2 present in lentivirus are introduced by tracheal lavage. Subsequently, treatment of CiKP mice with doxycycline leads to expression of dCas9-KRAB-MeCP2 and NSD2 suppression (Ci-Nsd2). CiKP mice treated with vehicle are designated Ci-Control. (B) Treatment schedule for CiKP model of LUAD including induction via lentiviral intratracheal lavage and CRISPRi activation by doxycycline containing regular mouse chow (200 mg/kg). (C) Western blots with the indicated antibodies of lung biopsy lysates from Ci-Control and Ci-Nsd2 mutant mice. Three independent and representative samples are shown for each genotype. H3 and tubulin are shown as loading controls. Asterisk indicates a non-specific band detected in mouse tissue. (D-G) Quantification of total number of tumor nodules (D), tumor burden (tumor area per lung) (E), proliferation (Ki67 positive cells per tumor area) (F) and apoptotic cells (cleaved Caspase 3 positive cells per tumor area) (G) in Ci-Control and Ci-Nsd2 mutant mice. Data are represented as mean ± s.e.m. of n= 8 mice for each group. P values were determined by two-tailed unpaired t-test. Box plots, the line indicates the median, the box marks the 75th and 25th percentiles and the whiskers indicate the minimum and maximum values. (H-I) NSD2 depletion attenuates PDX LUAD growth. Genotype of PDXs used are KRASG13D, p53P128S (H) and KRASG12C, p53R273C (I); Full genotype description in Methods. (Left panels) Western blots of lysates from the indicated LUAD PDX samples ±sgNsd2 and using the indicated antibodies. H3 and Tubulin are loading controls. (Right panels) PDX tumor volume quantification. The statistical analysis of the tumor growth (n = 5 mice for each group) at the final time point was determined by a two-tailed t-test. Data are represented as mean ± s.e.m.
NSD2 depletion combined with MEKi causes LUAD tumor regression
Knockdown of NSD2 in three LUAD PDX samples harboring similar genetic profiles as the LUAD mouse model (oncogenic Kras mutation and p53 loss of function) resulted in a global reduction in H3K36me2 levels and sustained inhibition of xenograft tumor growth (Figures 5H–I; S6E). Based on our observations that NSD2 cooperates with oncogenic KRAS to promote LUAD pathogenesis we next investigated the efficacy of a combination therapy comprising NSD2 depletion and MEKi as a treatment strategy for LUAD. In actively growing LUAD formed in CiKP mice (see Figure 5), co-administration of MEKi with doxycycline (to deplete NSD2; Figures 6A–B) caused roughly a ten-fold regression in tumor burden, whereas each condition alone decreased tumor burden by a more modest ~35–40% (Figures 6B–C). In addition to the reduction in tumor size with the combination treatment, there was also a decrease in the number of tumors, significant cell cycle inhibition and marked induction of apoptosis (Figures 6D–F; S6F). Thus, combined suppression of NSD2 and KRAS-MAPK signaling causes regression of lung tumors through a combination of cytostatic and cytotoxic effects.
Figure 6. NSD2 depletion sensitizes LUAD to MEKi toxicity in vivo.
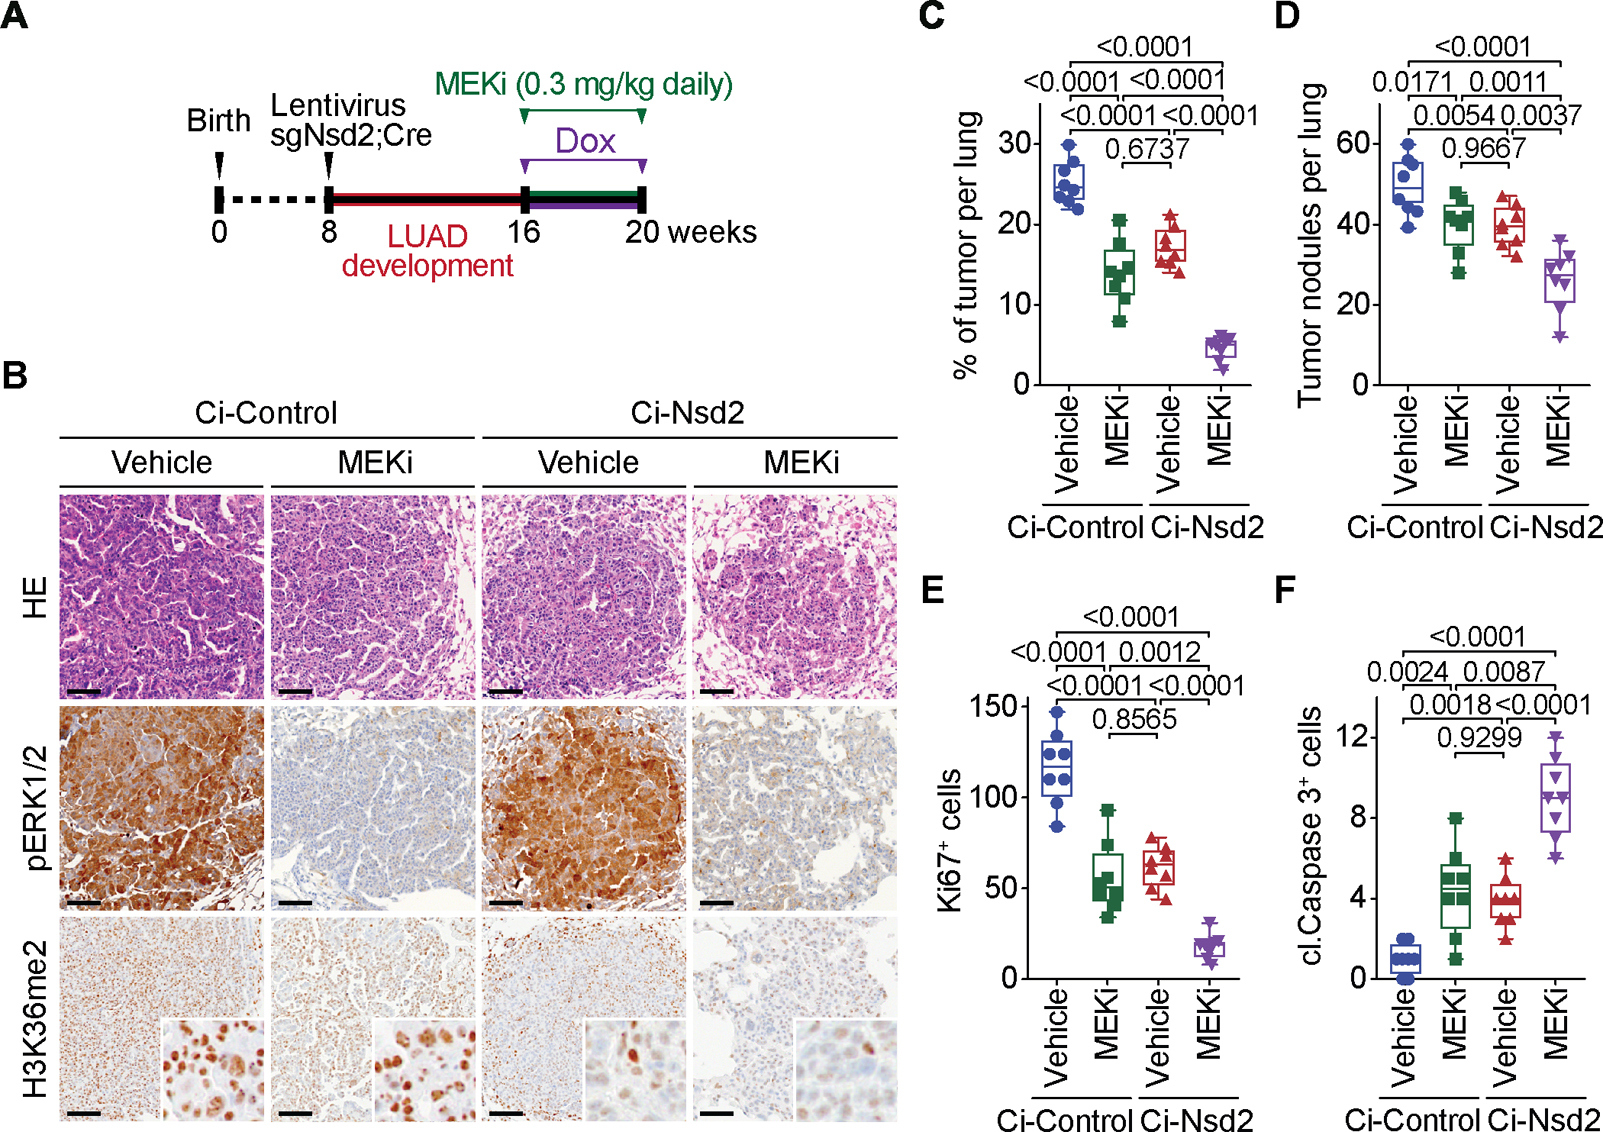
(a) Treatment schedule ± doxycycline to generate Ci-Control and Ci-Nsd2 mutant mice as described in (Figure 5A) and co-treatment with MEKi or placebo (vehicle). (B) Representative HE and IHC staining for phospho ERK1/2 (pERK1/2), a marker of MEK1/2 activity, and H3K36me2 a marker of NSD2 activity in Ci-Control and Ci-Nsd2 mutant mice ± MEKi. Scale bars, 50 μm. (C-F) Quantification of total number of tumor nodules (C), tumor burden (tumor area per lung) (D), proliferation (Ki67 positive cells per tumor area) (E) and apoptotic cells (cleaved Caspase 3 positive cells per tumor area) (F) in Ci-Control and Ci-Nsd2 mutant mice ± MEKi. Data are represented as mean ± s.e.m. of n= 8 mice for each group. Data for Ci-Control+Vehicle and Ci-NSD2+Vehicle are the same data presented in (Figure 5). P values were determined by two-way ANOVA with Tukey’s testing for multiple comparisons. Box plots, the line indicates the median, the box marks the 75th and 25th percentiles and the whiskers indicate the minimum and maximum values.
Discussion
NSD2 is implicated in the pathogenesis of multiple myeloma and several other cancers (Aytes et al., 2018; Bennett et al., 2017; Bhat et al., 2021; Husmann and Gozani, 2019; Jaffe et al., 2013; Kuo et al., 2011; Li et al., 2019; Oyer et al., 2014), and its over-expression is pervasive in human LUAD. Here we show that the NSD2 gain-of-function E1099K variant, which is found at low frequency in LUAD, increases NSD2 catalytic activity without altering substrate specificity. We use the ability of NSD2E1099K to selectively generate excessive H3K36me2 to model the consequence of NSD2 upregulation on LUAD tumorigenesis in vivo. In the context of oncogenic KRAS-driven LUAD, NSD2E1099K expression causes rapid disease progression.
This malignant phenotype is likely mediated by NSD2E1099K accelerating progression of a few lesions into large, aggressive LUAD tumor masses rather than driving moderate growth of many nodules. Mechanistically, our data suggest that the NSD2-H3K36me2 axis promotes malignant transformation through the regulation of multiple oncogenic programs, including KRAS signaling. These gene targets are robustly expressed relative to average genes, and we postulate that maintenance of their robust transcription becomes particularly dependent upon NSD2 deposition of H3K36me2 curbing H2K27me3 invasion. Indeed, in addition to NSD2 depletion inhibiting xenograft tumor growth of human LUAD PDX samples, the acute loss of NSD2 in actively growing LUAD in vivo attenuates tumor progression, indicating a sustained requirement of KRAS-driven tumors for NSD2. Notably, this inhibition is not purely epistatic with Ras signaling as combining MEKi with NSD2 depletion is far more effective in causing tumor regression than either treatment alone. We note, however, that MEKi treatment of A549 cells alone causes a modest reduction in the expression of NSD2-target genes (Figure S6G–H), suggesting some epistatic mechanisms may be at play at the level of chromatin. In this regard, a comparison of multiple myeloma cells that express high or low levels of NSD2 found that NSD2, via modulation of super enhancers, induces KRAS expression (Lhoumaud et al., 2019). Thus, considerable crosstalk between NSD2 and KRAS signaling in a cancer context-dependent manner is likely occurring. Overall, the data open up the possibility of developing NSD2 inhibitors to be broadly applied in combination with currently used targeted therapies to treat LUAD and hopefully additional growth signal-driven lethal malignancies (Bhat et al., 2021).
Limitations of study
There are now several examples in cancer epigenetics where non-catalytic functions of chromatin-regulatory proteins play key etiologic roles in disease pathogenesis (Bhat et al., 2021). We have used transgenic and genetic depletion tools with enzymatic gain-of-function and loss-of-function point mutations to implicate NSD2 catalytic activity in LUAD pathogenesis. However, in the absence of a suitably behaving, physiologic and selective NSD2 small molecule inhibitor to test, we cannot rule out NSD2’s role in LUAD may be in part due to a non-catalytic NSD2 function. With respect to the catalytic role of NSD2 in LUAD pathogenesis and our hypothesis that it is mediated via H3K36 dimethyl generation, we cannot rule out the existence of a relevant non-histone substrate of NSD2. However, we note that we failed to reproduce methylation on reported non-histone substrates of NSD2 (see Figure S2), and thus believe these putative substrates are unlikely modified by NSD2 in vitro, physiologically, or pathophysiologically.
STAR★ METHODS
RESOURCE AVAILABILITY
Lead Contact
Please direct any requests for further information or reagents to the lead contact: Or Gozani (ogozani@stanford.edu).
Materials Availability
Plasmids and antibodies generated in this study will be available upon request.
Stable cell lines and mouse lines generated in this study will be shared by the lead contact upon request with a completed material transfer agreement.
Data and Code Availability
All datasets generated during the current study: (1) RNA-seq of wild type lungs, Kras and Kras;Nsd2 mutant mice lung tumors, and primary cells derived from Kras;Nsd2 tumors (sgControl and sgNsd2) and (2) CUT&RUN data for genomic NSD2, H3K36me2 and H3K27me3 chromatin occupancy have been deposited through GEO and are publicly available as of the date of publication. Accession number for the data (GSE171218) is indicated in the resource table. Original western blot images have been deposited at Mendeley and are publicly available as of the date of publication. The DOI is listed in the key resources table.
This paper does not report original code, software, or algorithm. All utilized codes are publicly available as of the date of publication. DOIs are listed in the key resources table.
Any additional information required to reanalyze the data reported in this paper is available from the lead contact upon request.
KEY RESOURCES TABLE.
| REAGENT OR RESOURCE | SOURCE | IDENTIFIER |
|---|---|---|
| Antibodies | ||
| Biotin Micro Beads | Miltenyi Biotec | Cat# 130-042-401 |
| CD45-Biotin | eBiosciences | Cat# 13-0451-81 |
| CD31-Biotin | eBiosciences | Cat# 13-0319-80 |
| Cleaved Caspase 3 | Cell Signaling Technologies | Cat# 9664 |
| Di-methyl lysine motif | Cell Signaling Technologies | Cat# 14117 |
| ERK1/2 | Cell Signaling Technologies | Cat# 4695 |
| Phospho-ERK1/2 | Cell Signaling Technologies | Cat# 4376 |
| FLAG | Sigma-Aldrich | Cat# F1804 |
| Histone H3 | EpiCypher | Cat# 13-0001 |
| H3K36me1 | Abclonal | Cat# A2364 |
| H3K36me2 | ThermoFisher | Cat# MA5-14867 |
| H3K36me3 | ThermoFisher | Cat# MA5-24687 |
| H3K27me2 | Cell Signaling Technologies | Cat# 9728S |
| H3K27me3 | ThermoFisher | Cat# MA5-11198 |
| H4K20me2 | Cell Signaling Technologies | Cat# 9759S |
| H4K20me3 | Cell Signaling Technologies | Cat# 5737S |
| H3K9me2 | ThermoFisher | Cat# 710815 |
| γH2AX | ThermoFisher | Cat# MA5-33062 |
| Ki67 | BD Bioscience | Cat# 550609 |
| KRas Antibody (F234) | Santa Cruz Biotechnology | Cat# sc-30 |
| NSD2 | EpiCypher | Cat# 13-0001 |
| NSD2E1099K | This study | N/A |
| PTEN | Cell Signaling Technologies | Cat# 9188 |
| Ter119-Biotin | eBiosciences | Cat# 13-5921-81 |
| Tubulin | Millipore | Cat# 05-661 |
| Peroxidase AffiniPure Donkey Anti-Mouse IgG (H+L) | Jackson ImmunoResearch | Cat# 715-035-151 |
| Peroxidase AffiniPure Donkey Anti-Rabbit IgG (H+L) | Jackson ImmunoResearch | Cat# 711-035-152 |
| Bacterial and Virus Strains | ||
| DH5 | Thermo Fisher Scientific | Cat# K4520-1 |
| BL21 | Thermo Fisher Scientific | Cat# C6070-03 |
| BL21-RIL | Agilent Technologies | Cat# 230240 |
| Sf9 | Thermo Fisher Scientific | Cat# 12659017 |
| Ad5-CMV-Cre | Baylor College of Medicine, Viral Vector Production Core | Cat# Ad5-CMV-Cre RRID:SCR_015037 |
| Biological Samples | ||
| Human LUAD Tissue Array | MD Anderson Pathology | N/A |
| Chemicals, Peptides, and Recombinant Proteins | ||
| RPMI 1640 Medium | Corning | Cat# MT10040CV |
| DMEM Medium | Corning | Cat# MT10017CV |
| Fetal bovine serum | Thermo Fisher Scientific | Cat# 10500056 |
| PBS | Corning | Cat# MT21031CV |
| HBSS | Thermo Fisher Scientific | Cat# 14025076 |
| Trypsin-EDTA 0.25% | Corning | Cat# MT25053CI |
| Puromycin | Thermo Fisher Scientific | Cat# A1113802 |
| Hygromycin B | Corning | Cat# 30240CR |
| G418 Sulfate | Corning | Cat# MT30234CI |
| Complete Protease Inhibitor Cocktail | Sigma-Aldrich | Cat# 4693159001 |
| Phosphatase Inhibitor Cocktail | Thermo Fisher Scientific | Cat# 78420 |
| TRIzol Reagent | Invitrogen | Cat# 15596018 |
| Bovine Serum Albumin (BSA) | Thermo Fisher Scientific | Cat# BP9703100 |
| Matrigel | Corning | Cat# 354248 |
| L-Reduced glutathione | Sigma-Aldrich | Cat# G4251-25G |
| S-adenosyl-methionine | New England Biolabs | Cat# B9003S |
| S-Adenosyl-l-[methyl-3H] methionine | American Radiolabeled Chemicals | Cat# ART0288 |
| TransIT-293 | Mirus Bio | Cat# MIR-2706 |
| NP-40 | Sigma-Aldrich | Cat# I8896 |
| Phenylmethylsulfonyl fluoride (PMSF) | Sigma-Aldrich | Cat# P7626 |
| cOmplete, EDTA-free protease inhibitor | Sigma-Aldrich | Cat# 5056489001 |
| Trametinib (GSK1120212) | Selleckchem | Cat# S2673 |
| Tamoxifen | Sigma-Aldrich | Cat# T5648 |
| Recombinant nucleosome | Epicypher | Cat# 16-0006 |
| DMSO | Sigma-Aldrich | Cat# D5879 |
| 16% Formaldehyde (w/v) | Sigma-Aldrich | Cat# F8775 |
| PVDF membrane (0.2 μm) | BioRad | Cat# 1620177 |
| PVDF membrane (0.45 μm) | Millipore | Cat# IPVH00010 |
| Glutathione Sepharose 4B | Sigma-Aldrich | Cat# GE17-0756-01 |
| Coomassie Plus Assay | Thermo Fisher Scientific | Cat# 23236 |
| Coomassie GelCode Blue | Thermo Fisher Scientific | Cat# 24590 |
| Polybrene | Sigma-Aldrich | Cat# TR-1003-G |
| Hydroxypropyl methylcellulose | Sigma-Aldrich | Cat# 09963 |
| Doxycycline hyclate diet | Envigo Teklad | Cat# TD.01306 |
| Recombinant STAT3 protein | Active Motif | Cat# NC1851469 |
| Critical Commercial Assays | ||
| RNeasy Mini Kit | Qiagen | Cat# 74106 |
| ZymoPURE Plasmid Miniprep Kit | Zymo | Cat# D4211 |
| ZymoPURE II Plasmid Maxiprep Kit | Zymo | Cat# D4203 |
| DNA PCR Purification Kit | Qiagen | Cat# 28106 |
| DAB Substrate Kit | Abcam | Cat# ab64238 |
| Vectastain ABC kit | Vector Laboratories | Cat# PK-6100 |
| BCA Protein Assay Kit | Pierce | Cat# 23227 |
| ECL Substrate | Amersham | Cat# RPN2106 |
| PCR Mycoplasma Test Kit I/C | PromoKine | Cat# PK-CA91-1096 |
| Site-directed mutagenesis kit | Agilent | Cat# 200523 |
| Superscript First-strand Synthesis kit | Invitrogen | Cat# 18091050 |
| Bac-to-Bac Baculovirus Expression System | Thermo Fisher Scientific | Cat# 10359016 |
| PowerUP SYBR Green | Thermo Fisher Scientific | Cat# A25742 |
| Qiagen MinElute PCR purification kit | Qiagen | Cat# 28004 |
| NEBNext Ultra II DNA Library Prep Kit | Illumina | Cat# NEB E7645L |
| Deposited Data | ||
| RNA-seq and CUT&RUN | This study | GEO accession # GSE171218 |
| Original Blot Images Data | This study | Mendeley Data DOI: DOI: 10.17632/4ns5ffk8fg.1 |
| Experimental Models: Cell Lines | ||
| Human: A549 | ATCC | Cat# CRL- CCL-185 |
| Human: U2OS | ATCC | Cat# CRL- HTB-96 |
| Human: HT1080 | ATCC | Cat# CCL-121 |
| Human: 293T | ATCC | Cat# CRL-3216 |
| Mouse: Kras (KrasG12D) | This study | N/A |
| Mouse: KN (Kras;NSD2E1099K) | This study | N/A |
| Experimental Models: Organisms/Strains | ||
| Mouse: KrasLSL-G12D | (Hingorani et al., 2003) | Strain# JAX 008179 |
| Mouse: p53LoxP/LoxP | (Jonkers et al., 2001) | Strain# JAX 008462 |
| Mouse: Rosa26LSL-Nsd2(E1099K) | This study | N/A |
| Mouse: H11LSL-dCas9-KRAB-MeCP2; CAG-rtTA | This study | N/A |
| Mouse: NOD.SCID-IL2Rg−/− (NSG) | The Jackson Laboratories | Strain# 005557 |
| Oligonucleotides | ||
| sgRNA non-targeting (control) 5’-CTTCGAAATGTCCGTTCGGT-3’ | This study | N/A |
| sgRNA Nsd2 human 5’- ACTCGTTAACAAATTCTCCCTGG 3’ | This study | N/A |
| sgRNA dCas9-KM Ci-Nsd2 5’- CGTTGCAGCGTAGGTCACTG-3’ | This study | N/A |
| sgRNA dCas9-KM Ci-Control 5’-GCGAGGTATTCGGCTCCGCG-3’ | This study | N/A |
| RT-qPCR Fosl1 forward 5’-CTAAGTGCAGAAACCGAAGAAAG 3’ | This study | N/A |
| RT-qPCR Fosl1 reverse 5’- CTTCTGCAGCTCTTCAATCTCTC-3’ | This study | N/A |
| RT-qPCR Jun forward 5’- TGGGCACATCA CCACTACAC-3’ | This study | N/A |
| RT-qPCR Jun reverse 5’- TCTGGCTATGCAGTTCAGCC -3’ | This study | N/A |
| RT-qPCR Actb forward 5’-TCGTACCACAGGCATTGTGATGG-3’ | This study | N/A |
| RT-qPCR Actb reverse 5’- GCAATGCCTGGGTACATGGTGG-3’ | This study | N/A |
| RT-qPCR Kras forward 5’- GGAGTACAGTGCAATGAGGGAC-3’ | This study | N/A |
| RT-qPCR Kras reverse 5’- CCAGGACCATAGGCACATCTTC-3’ | This study | N/A |
| ChIP-qPCR Fosl1 forward 5’- CCCCCGTGGTGCAAGTGGTT-3’ | This study | N/A |
| ChIP-qPCR Fosl1 reverse 5’- CGCGCCTCTCGGAGTCTGGT -3’ | This study | N/A |
| ChIP-qPCR Jun forward 5’- GCCATCCACAAATCCTCCCTGA -3’ | This study | N/A |
| ChIP-qPCR Jun reverse 5’- GCACAAGTGGGAAGTAACCCTA -3’ | This study | N/A |
| ChIP-qPCR GAPDH forward 5’- TAAGTCCCACAGCACCACAT -3’ | This study | N/A |
| ChIP-qPCR GAPDH reverse 5’- AGCATCTTTGTGACTGGGGA -3’ | This study | N/A |
| Recombinant DNA | ||
| Plasmid: pLentiCRISPRv2 | Feng Zhang Lab | Cat# Addgene #52961 |
| Plasmid: pCMV-dR8.2 dvpr | Bob Weinberg Lab | Cat# Addgene #8455 |
| Plasmid: pCMV-VSV-G | Bob Weinberg Lab | Cat# Addgene #8454 |
| Plasmid: pBABE-neo | Bob Weinberg Lab | Cat# Addgene #1767 |
| Plasmid: pGEX-6P-1 | GE Healthcare | Cat# 28-9546-48 |
| Plasmid: pENTR3C | Thermo Fisher Scientific | Cat# A10465 |
| Plasmid: pLenti CMV Hygro DEST (w117-1) | Campeau and Kaufman lab | Cat# Addgene 17454 |
| Software and Algorithms | ||
| Prism 7 | GraphPad | https://www.graphpad.com/; RRID:SCR_002798 |
| Excel for Mac 2016 | Microsoft | https://www.microsoft.com/en-us/; RRID:SCR_016137 |
| PreciPoint M8 ViewPoint | PreciPoint | http://www.precipoint.com/microscopy-software/viewpoint/ |
| ImageJ – Fiji package | Freeware | http://fiji.sc; RRID:SCR_002285 |
| Origin Pro 8 | Microcal | https://www.originlab.com/ RRID:SCR_002815 |
| DeepTools (3.5.0) | (Ramirez et al., 2016) | https://deeptools.readthedocs.io/en/latest/content/list_of_tools.html |
| Samtools (1.9) | (Li et al., 2009) | http://www.htslib.org/doc/samtools.html |
| Bamtools (2.3.0) | (Barnett et al., 2011) | https://github.com/pezmaster31/bamtools |
| Picard (1.96) | Picard Toolkit, 2019. Broad Institute, GitHub Repository | https://broadinstitute.github.io/picard/ |
| FeatureCounts | (Liao et al., 2014) | http://subread.sourceforge.net |
| Gene Set Enrichment Analysis (GSEA) (4.1.0) | (Subramanian et al., 2005) | https://www.gsea-msigdb.org/gsea/index.jsp |
| Bowtie2 (2.2.7) | (Langmead and Salzberg, 2012) | http://bowtie-bio.sourceforge.net/bowtie2/index.shtml |
| HTSeq | (Anders et al., 2015) | https://htseq.readthedocs.io/en/release_0.11.1/count.html |
| HISAT2 (2.2.1) | (Kim et al., 2015) | https://daehwankimlab.github.io/hisat2 |
| DESeq2 | (Love et al., 2014) | (https://bioconductor.org/packages/release/bioc/html/DESeq2.html |
| Trim_galore (0.6.5) | Babraham Bioinformatics | http://www.bioinformatics.babraham.ac.uk/projects/trim_galore |
EXPERIMENTAL MODEL AND SUBJECT DETAILS
Animal models
KrasLSL-G12D/+;p53LoxP/LoxP mice have been described before (Hingorani et al., 2003; Jonkers et al., 2001). Mice were in C57BL/6 background, and we systematically used littermates as controls in all the experiments. H11LSL-dCas9-KRAB-MeCP2; CAG-rtTA model was generated by knockin of the LoxP-Stop-LoxP-dCas9-KRAB-MeCP2; CAG-rtTA cDNA-polyA cassette into Hipp11 (H11) locus using methods previously described(Tasic et al., 2011). Rosa26LSL-Nsd2(E1099K) model was generated by knockin of the CAG-LoxP-Stop-LoxP-Nsd2E1099K cDNA-polyA cassette into intron 1 of ROSA26 using methods previously described (Yang et al., 2013). Founder animals were identified by PCR followed by sequence analysis and germline transmission confirmed by crossbreeding with C57BL/6N wild-type animals. Immunocompromised NSG mice (NOD.SCID-IL2Rg−/−) or nude mice were utilized for transplantation studies. All experiments were performed on 6 to 10-week-old animals with balanced cohorts of male and female mice as our initial data did not indicate significant differences in disease progression or response to treatment between females or males. All animals were numbered and experiments were conducted in a blinded fashion. After data collection, genotypes were revealed and animals assigned to groups for analysis. For treatment experiments mice were randomized. None of the mice with the appropriate genotype were excluded from this study or used in any other experiments. Mice had not undergone prior treatment or procedures. All mice were fed a standard chow diet ad libitum and housed in pathogen-free facility with standard controlled temperature, humidity, and light-dark cycle (12h) conditions with no more than 5 mice per cage under the supervision of veterinarians, in an AALAC-accredited animal facility at Stanford University and the University of Texas M.D. Anderson Cancer Center. All animal procedures for animals housed in Stanford were reviewed and approved by Stanford Institutional Animal Care and Use Committee (IACUC 33118, PI: Gozani) and animals housed in the M.D. Anderson Cancer Center were reviewed and approved by the MDACC Institutional Animal Care and Use Committee (IACUC 00001636, PI: Mazur). For therapy studies mice were treated as indicated with Trametinib (0.3 mg/kg daily, IP), or vehicle (0.5% hydroxypropyl methylcellulose).
Cell lines and primary cell cultures
293T, A549, U2OS, HT1080 cells were grown in Dulbecco’s modified Eagle’s medium (DMEM) supplemented with 10% fetal calf serum, 2 mM L-glutamine-penicillin–streptomycin. Primary mouse cancer cell lines were prepared from tumor biopsies isolated from the indicated mouse models according to methods previously described (Chen et al., 2015). Primary mouse cancer cell lines were cultured in DMEM supplemented with 10% fetal calf serum, 2 mM L-glutamine–penicillin–streptomycin. Primary cultures of mouse lung fibroblast were prepared from the indicated mice using standard methods (Mazur et al., 2015). In brief, mice were euthanized by CO2 asphyxiation and perfused with 5 ml normal saline. Lungs were sterilely removed and cut into small 2-mm slices and allowed to adhere on a tissue culture plate. Lung tissue explants were cultured in DMEM supplemented with 10% fetal calf serum, 2 mM L-glutamine–penicillin–streptomycin. Lung fibroblasts were purified by repeat trypsinization and passaging to achieve a homogenous population. Lung fibroblasts were treated with adenovirus-Cre or vehicle (PBS). Lysates were obtained for western blot analyses 72 h after transduction. All cells were cultured at 37°C in a humidified incubator with 5% CO2. Cell lines were authenticated by short tandem repeat profiling and tested negative for mycoplasma.
Cancer cell-derived mouse xenograft
A549-derived xenograft tumors were generated by transplanting cells that were transduced with lentivirus expressing sgRNA/Cas9 and selected with puromycin for 72 hours, to immunocompromised nude mice (6 to 10-week-old). The transplantation was performed by subcutaneous injection of A549 cells ± sgNSD2, mixed with matrigel (1:1) to the flanks of the nude mice. When tumors became palpable, they were calipered every 2 days to monitor growth kinetics. Tumor volume was calculated using the formula: Volume = (width)2 x length / 2 where length represents the largest tumor diameter and width represents the perpendicular tumor diameter.
Patient-derived cancer xenografts
PDXs were obtained from the NCI Patient-Derived Models Repository (PDMR), NCI-Frederick, Frederick National Laboratory for Cancer Research. The following know mutations were detected in PDX #1: KRASG13D, p53P128S, BRCA1X1495_splice treatment naïve female, age 55; PDX #2: KRASG12C, p53R273C, MSH6K1358Dfs*2, KMT2CM3463_Q3464delinsI*, TET1E1640*, MUTYHX298_splice treatment naïve male, age 57; PDX #3: KRASG12C, p53T155I, POT1Q16* treatment naïve male, age 82. Briefly, surgically resected tumor specimens were obtained from deidentified patients with histologically confirmed LUADs. All tumor specimens were collected after written patient consent and in accordance with the institutional review board-approved protocols of the University of Texas M.D. Anderson Cancer Center (PA19–0435, PI: Mazur). Patient-derived xenograft tumors were generated and propagated by transplanting small tumor fragments isolated directly from surgical specimens subcutaneously into NSG mice (6 to 10-week-old) as we established previously (Liu et al., 2019). For analysis of NSD2 knockdown growth, collected PDX tumors were minced using a razor blade and digested in collagenase digestion buffer at 37°C for 1 hour. Cells were passed through 100 μm and 40 μm cell strainers and centrifuged for 1200 rpm for 5 min. Cells were incubated in RBC lysis buffer for 2 min and then resuspended in 6 mL of media and spun through 0.5 mL of serum layered on the bottom of the tube to remove cellular debris. Contaminating human or mouse hematopoietic and endothelial cells (CD45, Ter119, CD31) are depleted using biotin conjugated anti-mouse CD45, CD31 and Ter119 antibodies and separated on a MACS LS column using anti biotin microbeads. Next, the cells were transduced with lentivirus expressing sgRNA/Cas9 and selected with puromycin for 72 hours. Next, the cells were collected, mixed with Matrigel (1:1) at a density of 2 ×10⁷ cells per ml and transplanted subcutaneously to the hind flanks of NSG mice. When tumors became palpable, they were calipered to monitor growth kinetics. Tumor volume was calculated using the formula: Volume = (width)2 × length / 2 where length represents the largest tumor diameter and width represents the perpendicular tumor diameter.
METHOD DETAILS
Plasmids
Stable cells were generated using pLenti CMV Hygro DEST (w117–1). pLentiCRISPRv2 was used for CRISPR/Cas9 knockouts in cell lines. For bacterial expression, human G9a (aa 913–1193) (NP_006700.3), NSD2 (aa 942–1240) (NP_579877.1), PTEN (NP_000305.2) and AURORA kinase A (NP_003591.2) were cloned into pGEX-6P-1.
Preparation of recombinant proteins, nucleosomes and DNA
GST fusion proteins were expressed in BL21 E.coli by overnight culture at 20°C in LB medium (10 g/L tryptone, 5 g/L yeast extract, and 10 g/L NaCl) supplemented with 0.1 mM IPTG, purified using Glutathione Sepharose 4B and eluted in 10 mM reduced glutathione. Purified proteins were snap frozen and stored in −80°C or used in in vitro reaction assays directly. Protein concentrations were measured using Coomassie assay. For recombinant NSD2 SET domain-containing proteins in pGEX-6P expression vectors were transformed into BL21-RIL E.coli strain. Expression was carried out in 2xYT or M9 media at 20°C, 16–20 h. The cells were lysed by the Canadian press. The lysate was cleared by centrifugation at 10,000 g for 20 min, and subsequently injected into HiTrap SP FF 5ml column and eluted by the salt gradient. Fractions containing NSD2SET from pGEX-6P were collected and injected into GSTrap HP 5ml column, and then eluted with glutathione gradient. Fractions containing NSD2SET were collected and mixed with GST-PreScission protease in 100:1 ratio and dialyzed overnight at 4°C against storage buffer (50 mM Tris-HCl pH 7.5, 150 mM NaCl, 1 mM TCEP). The final purification was achieved with GSTrap HP 5 ml column, and the flow-through is collected and concentrated with Amicon 3000 MWCO to the desired concentration of 75–250 μM. For the NMR structural and dynamics studies the U-[15N], U-[13C,15N] and perdeuterated U-[2H,13C,15N] NSD2SET or NSD2SET-E1099K domains (residues 984–1205) were prepared in M9 media, whereas a sole source of nitrogen 1 g/L of 15NH4Cl was used, and as a sole source of carbon, U-[13C,15N] for U-13C glucose of 3 g/L and for U-[2H,13C,15N] labelling scheme the 3 g/L U-2H,13C glucose and 99.9% D2O were used. For the nucleosome assemblage, the 601 Widom sequence of DNA was used (Lowary and Widom, 1998). 601DNA with 20bp overhang (187bp) and without (147bp) were prepared by PCR and purified by phenol/chloroform, isopropanol precipitation. The Cy5-labeled dsDNA (147bp or 187bp) was prepared by annealing oligonucleotides: 187-F Cy5-CGAGGCTGTTCAATACATGC, 187-R GGACCCTATACGCGGCC, 147-F Cy5-CTGGAGAATCCCGGTGCCGAGGC, 147-R ACAGGATGTATATATCTGACACGTGCCTG in equimolar ratio at 10 M concentration, then heated to 95°C and cooled down slowly by 0.1°C/5 s by using PCR machine. Human H2A and H2B histones were prepared according to previously described protocol (Cheema and Ausio, 2017). Octamer and nucleosomes were assembled according (Luger et al., 1999).
Preparation of full-length NSD2 proteins
Different versions of Flag-tagged NSD2 (WT, E1099K, E1099K/Y1179A) were cloned into pFastBac vector, then generation of the corresponding baculovirus and subsequent expression in Sf9 cells were done according to manufacturer’s protocol (Bac-to-Bac Baculovirus Expression System). Next, the cell lysates were incubated with anti-FLAG(M2)-conjugated agarose, after washing, the bound proteins were eluted with 0.5 mg/ml FLAG peptides for in vitro methylation assays as previously described (Yuan et al., 2021). The results were determined by liquid scintillation counting.
Generation of NSD2E1099K specific antibody
Peptide corresponding to human NSD2 (NP_001073986.1) amino acids 1094–1106 and harboring the E1099K substitution was synthesized and HPLC purified (99% purity). This peptide was conjugated to KLH and used as antigen to immunize rabbits. Rabbit protocols, peptide conjugation, immunization, and antiserum production were performed by 21st Century Biochemicals. Antiserum was negatively selected against the wild-type sequence (amino acids 1094–1106). Final purification was performed with immobilized antigenic peptide to select for NSD2E1099K specific antibodies.
Cell assays
To analyze cell proliferation, cancer cells were seeded at 2 × 10⁵ cells/mL in triplicate in 6-well plates. Cell counts were acquired by Countess II FL automated cell counter at indicated days. After each counting, the cells were splitted and replated at a density between 2–4 × 10⁵ cells/mL. Trypan blue was used to stain non-viable cells. To analyze pERK1/2 levels upon MEKi treatment, A549 cells were treated with different concentration of MEK1/2 inhibitor (Trametinib). After inhibitor treatment total protein were isolated from the cells and analyzed by western blot.
Transfection and viral transduction
Transient expression was performed using TransIT-293 following the manufacturer’s protocol. For CRISPR/Cas9 knockouts, virus particles were produced by co-transfection of 293T cells with the pLentiCRISPR v2 (with puromycin selection) vector expressing indicated sgRNAs (sgRNA non-targeting control and sgRNA NSD2), pCMV-dR8.2 dvpr and pCMV-VSV-G in a ratio of 5:4:1 by mass. 48 hours after transfection, target cells were transduced with 0.45 μm filtered viral supernatant and 8 μg/mL polybrene. Cells were selected 24h after media replacement with 2 μg/mL puromycin or 250 μg/mL hygromycin B. For NSD2 reconstitution, virus particles were produced by co-transfection of 293T cells with the pLenti CMV Hygro DEST (w117–1) expressing human NSD2, pCMV-dR8.2 dvpr and pCMV-VSV-G in a ratio of 5:4:1 by mass. 48 hours after transfection, target cells were transduced with 0.45 μm filtered viral supernatant and 8 μg/mL polybrene. Cells were selected 24 hours after media replacement with 250 μg/mL hygromycin B for one week. Next, the cells expressing human NSD2 (with synonymous mutation preventing sgNsd2 targeting) were transduced with sgControl and sgNsd2 virus. Cells were selected 24 hours after media replacement with 2 μg/mL puromycin. After 5 days selection, cells were harvested for western blot analysis.
Immunoblot analysis and immunoprecipitation
For western blot analysis, cells were lysed in RIPA buffer with 1 mM PMSF and protease inhibitor cocktail. Protein concentration was determined using the Coomassie plus assay. Protein samples were resolved by SDS-PAGE and transferred to a PVDF membrane (0.45 μm). The following antibodies were used (at the indicated dilutions): ERK1/2 (1:2000), phospho-ERK1/2 (1:5000), NSD2 (Kuo et al., 2011), NSD2E1099K (1:1000), FLAG (1:1000), Tubulin (1:2000), H3 (1:5000), H3K36me1 (1:5000), H3K36me2 (1:2000), H3K36me3 (1:2000), H3K27me3 (1:5000), γH2AX (1:2000), PTEN (1:2000), Di-methyl lysine motif (1:1000), KRAS (1:250). Secondary antibodies were used at 1:5000 or 1:10000 dilution. Protein bands were visualized using ECL detection reagent. For immunoprecipitation, lysates were incubated with specific antibody overnight at 4°C, antibodies for immunoprecipitation were used at the indicated amount: 5 μg PTEN. Extracts were then incubated with protein A Sepharose beads for 4 hours at 4°C. Proteins were resolved by SDS–PAGE, transferred to PVDF membrane and analyzed by western blot. Immunoblots signal intensity was measured using ImageJ software.
Methylation assays
In vitro methylation assays were performed similar to as described in39 by combining 2 μg recombinant NSD2 mutants and 1 μg substrates (recombinant nucleosomes, PTEN, AURKA, STAT3) in a methyltransferase buffer (50 mM Tris pH 8.0, 20 mM KCl, 5 mM MgCl2, and 10% glycerol) supplemented with 0.1 mM S-adenosylmethionine (SAM) or S-Adenosyl-L-[methyl-3H]-methionine. The reaction mixtures were incubated for 2 hours at 30°C. Reactions were analyzed by SDS-PAGE, followed by autoradiography, Coomassie stain or western blot.
Microscale thermophoresis (MST)
The binding affinities (Kd) were determined using 100 nM Cy5 labelled dsDNA (147bp or 187bp)/nucleosome mixed in 1:1 volume ratios with NSD2SET or NSD2SET-E1009K proteins at 16 different concentrations. Buffer conditions were kept identical to other studies and were as follows: 50 mM Tris-HCl pH 7.5, 150 mM NaCl, 1 mM TCEP. The binding event was measured with the Microscale Thermophoresis on Monolith NT.115 Pico instrument. All measurements were performed at room temperature.
ITC measurements
All H3 N-terminal peptides were dialyzed overnight into the final buffer of 50 mM Tris-HCl pH 7.5, 150 mM NaCl, 1 mM TCEP, and used at 700 μM. The NSD2SET or NSD2SET-E1009K proteins were used at 20–50 μM concentrations. The S-adenosy-L-methionine (SAM) was dissolved in the same buffer, pH checked and used in 150–300 μM concentrations. The ITC measurements were performed on ITC PEAQ instrument at 20°C with 19 injections of 2 μL SAM or peptide solution. Data were analyzed using ITC software to obtain Kd values and stoichiometry.
Lung adenocarcinoma mouse models
To generate tumors in the lungs of KrasLSL-G12D/+ and ROSA26LSL-Nsd2(E1099K) (Kras;Nsd2) mutant mice and KrasLSL-G12D/+;p53LoxP/LoxP; H11LSL-dCas9-KRAB-MeCP2; CAG-rtTA (CiKP) we used replication-deficient adenoviruses expressing Cre-recombinase (Ad-Cre) and Lentivirus expressing Cre and sgNsd2 as previously described (Chu et al., 2016). Briefly, 8-week old mice were anesthetized by continuous gaseous infusion of 2% isoflurane for at least 10 min using a veterinary anesthesia system. Virus was delivered to the lungs by intratracheal intubation. Prior to administration, virus was precipitated with calcium phosphate to improve the delivery of Cre by increasing the efficiency of viral infection of the lung epithelium. Mice were treated with one dose of 5 × 10⁶ PFU of Ad-Cre and 5 × 10⁵ PFU of Lentivirus-sgNsd2;Cre. Mice were analyzed for tumor formation and progression at indicated timepoints after viral infection. Mice were fed a standard or 625 mg/kg Doxycycline hyclate diet starting at 8 weeks after Lentivirus infection and were maintained on this diet for the remainder of the experiment.
Histology and immunohistochemistry
Tissue specimens were fixed in 4% buffered formalin for 24 hours and stored in 70% ethanol until paraffin embedding. 3 μm sections were stained with hematoxylin and eosin (HE) or used for immunohistochemical studies. Human tissue sections were collected in accordance with the institutional review board-approved protocols of the University of Texas M.D. Anderson Cancer Center (PA19–0435, PI: Mazur). Immunohistochemistry (IHC) was performed on formalin-fixed, paraffin embedded mouse and human tissue sections using a biotin-avidin HRP conjugate (Vectastain ABC kit) method as described before (Mazur et al., 2014). The following antibodies were used (at the indicated dilutions): cleaved Caspase 3 (1:100), H3K36me2 (1:2000), Ki67 (1:1,000), pERK1/2 (1:500), NSD2 (described below, 1:100). Sections were developed with DAB substrate and counterstained with hematoxylin. Pictures were taken using a PreciPoint M8 microscope equipped with the PointView software. Analysis of the tumor area and IHC analysis was done using ImageJ software. Quantification of NSD2 and H3K36me2 IHC chromogen intensity was performed by measuring the reciprocal intensity of the chromogen stain as previously described (Wang et al., 2020). Briefly, standard RGB color images acquired from bright field microscopy have a maximum intensity of value 250 (represented by white, unstained areas) as measured by the standard intensity function in the open source ImageJ Fiji software. We subtracted the intensity of a stained tissue sample from 250, thereby deriving a reciprocal intensity that is directly proportional to the amount of chromogen present.
Meta-analysis of gene expression
Meta-analysis of public human lung cancer gene expression analysis was performed using indicated datasets from the NCBI GEO and EBI ArrayExpress. After re-annotating the probes, each data set was normalized separately using gcRMA. We applied meta-analysis approaches to the normalized data as previously described (Liu et al., 2019).
RNA-sequencing and gene set enrichment analysis
Total RNA was extracted from wild type lungs, Kras and Kras;Nsd2 mutant mice lung tumors, and primary cells derived from Kras;Nsd2 tumors (sgControl or sgNsd2) using Trizol reagent. RNA-seq libraries were constructed and sequenced in BGI. For validation experiments the RNA samples were reverse transcribed into cDNA using the SuperScript IV First Strand Synthesis System. Quantitative real-time PCR analysis was performed on a Roche LightCycler 480 using SYBR Green Master Mix following the manufacturer’s manual and specific primers (Key Resource Table). The expression of each gene was normalized to actin (Actb). The RNA-seq libraries were sequenced using Illumina HiSeq3000 platform (pair end 150bp analysis). Low-quality and adapter-containing reads were trimmed using trim-galore package under paired-end mode, any reads shorter than 50 bp were removed. The remaining trimmed sequences were mapped to the reference genome (mm10) with hisat2 under default settings. We used htseq-count to count the mapped reads number on every mm10 Refseq transcript. Differential gene expression analysis was performed with the DESeq2 package. Genes with FDR < 0.1 and Log2 fold change ≥ 0.8 were defined as up-regulated genes, and genes with FDR < 0.1 and Log2 fold change ≤ −0.8 were defined as down-regulated genes. The read count for all genes was calculated using featureCounts and then normalized by DESeq2 to obtain normalized counts (Liao et al., 2014; Love et al., 2014). The normalized count matrix was served as input for gene set enrichment analysis (GSEA) using previously described software (Subramanian et al., 2005) and the Molecular Signatures Database (MSigDB).
CUT&RUN sequencing data analysis
This assay was performed as described previously with some modifications (Hainer and Fazzio, 2019; Yuan et al., 2021). Buffer exchange was performed by centrifugation at 4°C, 600 g for 5 minutes. After the addition of concanavalin A beads, the buffer exchange was performed with a magnetic stand, allowing at least 5 minutes for the beads to completely bind to the magnet. Cells were harvested into a single cell suspension, counted, washed once with ice-cold PBS and resuspended with ice-cold Nuclear Extraction (NE) buffer to a final concentration of 10 × 106 cells/mL. After 10 minutes on ice, cells were washed with Wash Buffer (WB) and resuspended in WB at a final concentration of 5 × 10⁶ cells/mL. Efficient nuclear extraction was confirmed by Trypan Blue staining. In case of presence of nuclear aggregates, suspension was filtered through a 40mm strainer before proceeding to next step. Concanavalin A beads were equilibrated in ice-cold binding buffer and mixed with the isolated nuclei (10ml bead slurry per 5 × 10⁵ cells). The nuclei-beads mixture was incubated for 10 minutes rotating at 4°C. Successful nuclei-bead binding was confirmed with Trypan Blue staining. Beads-coated nuclei were resuspended in WB at a final concentration of 5 × 10⁶ cells/mL and 100 μL were aliquoted into each sample tube. While gently vortexing, 100 μL of 2× primary antibody mix was added to the corresponding sample tube. Tube samples were mixed and incubated in rotation overnight at 4°C. Next day, nuclei were washed twice with 1 mL of ice-cold WB and resuspended in 25 μL of ice-cold WB. While gently vortexing, 25 μL of 2× pAG-MNase mix was added to each tube and samples were incubated for 1 hour at 4°C. Nuclei were washed twice with WB and resuspended in 150 μL of ice-cold WB. While gently vortexing, 3 μL of pre-chilled 100 μM CaCl2 were added and after briefly flicking to mix, tubes were incubated for 30 minutes in a 0°C water bath. After 30 minutes, the MNase was inactivated by adding 150 μL of 2× STOP buffer. To isolate the digested DNA though diffusion, samples were incubated 20 minutes at 37°C with no shaking. Samples were centrifuged at 16,000g for 5 minutes at 4°C and the resulting supernatant was treated with 3 μL of 10% SDS and 2.5 μL of 20 mg/mL proteinase K at 65 °C for 1 hour to overnight without shaking. DNA was purified with Qiagen MinElute PCR purification kit. Sequencing libraries were constructed using NEBNext Ultra II DNA Library Prep Kit for Illumina following the manufacturer’s manual. The libraries were sequenced at BGI. The raw sequencing reads were trimmed to remove sequencing adapters and low-quality bases in read ends using trim_galore. Then the reads were mapped to both mouse (mm10) and drosophila (dm6) genome using Bowtie2 (Version 2.2.7, --mm --no-unal --no-mixed --no-discordant -X 1000) (Langmead and Salzberg, 2012). Mapped reads were filtered to only keep proper-paired and high mapping quality reads. Next, the PCR duplicates were removed using Picard MarkDuplicates tool.Then the mouse read density was normalized to the number of Drosophila reads. The spike-in normalized reads density of mouse was used for the subsequent analysis. The aggregate lines and boxplots of the read density for different genomic regions were plotted using deepTools (Ramirez et al., 2016). The genomic regions were extracted based on mm10 refSeq genes.
Chromatin immunoprecipitation (ChIP)
Cells were fixed with 1% formaldehyde for 10 min at room temperature before termination with 0.125 M glycine. Cells were then lysed in ChIP buffer (0.3% SDS, 300 mM NaCl,1 mM EDTA, and 50 mM Tris-HCl pH 8.0), and cross-linked chromatin was sonicated to obtain DNA fragments around 250 bp. After sonication, 0.3% SDS was diluted to 0.1% SDS with ChIP dilution buffer (300 mM NaCl,1 mM EDTA, and 50 mM Tris-HCl pH 8.0). Immunoprecipitations were performed using the diluted samples that were incubated at 4°C for 4 hours with following antibodies: NSD2 (5 μg), H3K27me3 (3 μg), H3K36me2 (3 μg). Next, 10–15 μl protein A/G beads were added and incubated at 4°C overnight. Then beads were treated with binding buffer (0.1% SDS, 300 mM NaCl,10 mM EDTA, and 50 mM Tris-HCl pH 8.0) 4 times, wash buffer (1 mM EDTA, 50 mM Tris-HCl pH 8.0) twice, LiCl buffer (20 mM Tris, pH 7.4, 1 mM EDTA, 250 mM LiCl, 0.5% NP-40 (Sigma-Aldrich), 0.5% Na-deoxycholate) once and TE buffer (10 mM Tris pH 8.0, 1 mM EDTA) once. DNA was eluted from beads using elution buffer (50 mM Tris pH 8.0, 10 mM EDTA, 1% SDS) and un-crosslinked at 65°C overnight. DNA was recovered by phenol-chloroform extraction. RT-qPCR analyses were performed on immunoprecipitated DNA using specific primers (Key Resource Table). The results were presented as relative fold enrichment over the input.
QUANTIFICATION AND STATISTICAL ANALYSIS
Please refer to the Figure Legends for description of sample size (n) and statistical details. All values for n are for individual mice or individual sample. Sample sizes were chosen based on previous experience with given experiments. Cell culture assays have been performed in triplicates and in two independent experiments, unless stated otherwise. Differences were analyzed by log-rank, two-tailed unpaired Student’s t test, two-way ANOVA with Tukey’s testing for multiple comparisons using Prism 8 (GraphPad).
Supplementary Material
Highlights:
High NSD2 and H3K36me2 levels common to lung cancer and correlate with poor prognosis
NSD2 selective H3K36me2 catalysis promotes rapid malignant tumor progression in vivo
A versatile CRISPRi-based in vivo system developed to test gene functions in LUAD
NSD2 knockdown combined with MEK1/2 inhibitor results in sustained tumor regression
Acknowledgements
We thank members of the Gozani and Mazur labs for critical reading of the manuscript. This work was supported in part by grants from the NIH to O.G. (R35 GM139569), O.G. and P.K.M. (R01 CA236118), S.H. (K99 CA255936), W.L. (R01HG007538, R01CA193466, R01CA228140), intramural funds from KAUST to W.F., L.J. and M.J. AACR, NETRF, DOD PRCRP Career Development Award (CA181486), Career Enhancement Grant - The University of Texas NIH SPORE in Lung Cancer (P50CA070907), the Andrew Sabin Family Foundation Scientist and CPRIT Scholar in Cancer Research (RR160078) to P.K.M. D.S. was supported by a grant from Stanford Maternal and Child Health Research Institute. This work was also supported in part by the Stanford Cancer Institute, a NCI-designated Comprehensive Cancer Center.
Footnotes
Declaration of Interests
Or Gozani is a co-scientific founder, consultant, and stockholder of EpiCypher, Inc. and K36 Therapeutics, Inc. Pawel K. Mazur is a scientific co-founder, consultant and stockholder of Amplified Medicines, Inc. and Ikena Oncology, Inc.
Publisher's Disclaimer: This is a PDF file of an unedited manuscript that has been accepted for publication. As a service to our customers we are providing this early version of the manuscript. The manuscript will undergo copyediting, typesetting, and review of the resulting proof before it is published in its final form. Please note that during the production process errors may be discovered which could affect the content, and all legal disclaimers that apply to the journal pertain.
References:
- Anders S, Pyl PT, and Huber W (2015). HTSeq--a Python framework to work with high-throughput sequencing data. Bioinformatics 31, 166–169. [DOI] [PMC free article] [PubMed] [Google Scholar]
- Aytes A, Giacobbe A, Mitrofanova A, Ruggero K, Cyrta J, Arriaga J, Palomero L, Farran-Matas S, Rubin MA, Shen MM, et al. (2018). NSD2 is a conserved driver of metastatic prostate cancer progression. Nat Commun 9, 5201. [DOI] [PMC free article] [PubMed] [Google Scholar]
- Barnett DW, Garrison EK, Quinlan AR, Stromberg MP, and Marth GT (2011). BamTools: a C++ API and toolkit for analyzing and managing BAM files. Bioinformatics 27, 1691–1692. [DOI] [PMC free article] [PubMed] [Google Scholar]
- Bennett RL, Swaroop A, Troche C, and Licht JD (2017). The Role of Nuclear Receptor-Binding SET Domain Family Histone Lysine Methyltransferases in Cancer. Cold Spring Harb Perspect Med 7. [DOI] [PMC free article] [PubMed] [Google Scholar]
- Bhat KP, Umit Kaniskan H, Jin J, and Gozani O (2021). Epigenetics and beyond: targeting writers of protein lysine methylation to treat disease. Nat Rev Drug Discov. [DOI] [PMC free article] [PubMed] [Google Scholar]
- Cancer Genome Atlas Research, N. (2014). Comprehensive molecular profiling of lung adenocarcinoma. Nature 511, 543–550. [DOI] [PMC free article] [PubMed] [Google Scholar]
- Canon J, Rex K, Saiki AY, Mohr C, Cooke K, Bagal D, Gaida K, Holt T, Knutson CG, Koppada N, et al. (2019). The clinical KRAS(G12C) inhibitor AMG 510 drives anti-tumour immunity. Nature 575, 217–223. [DOI] [PubMed] [Google Scholar]
- Cheema MS, and Ausio J (2017). Analytical Ultracentrifuge Analysis of Nucleosomes Assembled from Recombinant, Acid-Extracted, HPLC-Purified Histones. Methods Mol Biol 1528, 75–95. [DOI] [PubMed] [Google Scholar]
- Chen S, Yang Z, Wilkinson AW, Deshpande AJ, Sidoli S, Krajewski K, Strahl BD, Garcia BA, Armstrong SA, Patel DJ, et al. (2015). The PZP Domain of AF10 Senses Unmodified H3K27 to Regulate DOT1L-Mediated Methylation of H3K79. Mol Cell 60, 319–327. [DOI] [PMC free article] [PubMed] [Google Scholar]
- Chu VT, Weber T, Graf R, Sommermann T, Petsch K, Sack U, Volchkov P, Rajewsky K, and Kuhn R (2016). Efficient generation of Rosa26 knock-in mice using CRISPR/Cas9 in C57BL/6 zygotes. BMC Biotechnol 16, 4. [DOI] [PMC free article] [PubMed] [Google Scholar]
- Fang D, Gan H, Lee JH, Han J, Wang Z, Riester SM, Jin L, Chen J, Zhou H, Wang J, et al. (2016). The histone H3.3K36M mutation reprograms the epigenome of chondroblastomas. Science 352, 1344–1348. [DOI] [PMC free article] [PubMed] [Google Scholar]
- Feldser DM, Kostova KK, Winslow MM, Taylor SE, Cashman C, Whittaker CA, Sanchez-Rivera FJ, Resnick R, Bronson R, Hemann MT, et al. (2010). Stage-specific sensitivity to p53 restoration during lung cancer progression. Nature 468, 572–575. [DOI] [PMC free article] [PubMed] [Google Scholar]
- Garcia-Carpizo V, Sarmentero J, Han B, Grana O, Ruiz-Llorente S, Pisano DG, Serrano M, Brooks HB, Campbell RM, and Barrero MJ (2016). NSD2 contributes to oncogenic RAS-driven transcription in lung cancer cells through long-range epigenetic activation. Sci Rep 6, 32952. [DOI] [PMC free article] [PubMed] [Google Scholar]
- Hainer SJ, and Fazzio TG (2019). High-Resolution Chromatin Profiling Using CUT&RUN. Curr Protoc Mol Biol 126, e85. [DOI] [PMC free article] [PubMed] [Google Scholar]
- Hingorani SR, Petricoin EF, Maitra A, Rajapakse V, King C, Jacobetz MA, Ross S, Conrads TP, Veenstra TD, Hitt BA, et al. (2003). Preinvasive and invasive ductal pancreatic cancer and its early detection in the mouse. Cancer Cell 4, 437–450. [DOI] [PubMed] [Google Scholar]
- Hirsch FR, Suda K, Wiens J, and Bunn PA Jr. (2016). New and emerging targeted treatments in advanced non-small-cell lung cancer. Lancet 388, 1012–1024. [DOI] [PubMed] [Google Scholar]
- Huang C, and Zhu B (2018). Roles of H3K36-specific histone methyltransferases in transcription: antagonizing silencing and safeguarding transcription fidelity. Biophys Rep 4, 170–177. [DOI] [PMC free article] [PubMed] [Google Scholar]
- Hudlebusch HR, Santoni-Rugiu E, Simon R, Ralfkiaer E, Rossing HH, Johansen JV, Jorgensen M, Sauter G, and Helin K (2011). The histone methyltransferase and putative oncoprotein MMSET is overexpressed in a large variety of human tumors. Clin Cancer Res 17, 2919–2933. [DOI] [PubMed] [Google Scholar]
- Husmann D, and Gozani O (2019). Histone lysine methyltransferases in biology and disease. Nat Struct Mol Biol 26, 880–889. [DOI] [PMC free article] [PubMed] [Google Scholar]
- Imai M, Hoshi T, and Ogawa K (1994). K-ras codon 12 mutations in biliary tract tumors detected by polymerase chain reaction denaturing gradient gel electrophoresis. Cancer 73, 2727–2733. [DOI] [PubMed] [Google Scholar]
- Jackson EL, Willis N, Mercer K, Bronson RT, Crowley D, Montoya R, Jacks T, and Tuveson DA (2001). Analysis of lung tumor initiation and progression using conditional expression of oncogenic K-ras. Genes Dev 15, 3243–3248. [DOI] [PMC free article] [PubMed] [Google Scholar]
- Jaffe JD, Wang Y, Chan HM, Zhang J, Huether R, Kryukov GV, Bhang HE, Taylor JE, Hu M, Englund NP, et al. (2013). Global chromatin profiling reveals NSD2 mutations in pediatric acute lymphoblastic leukemia. Nat Genet 45, 1386–1391. [DOI] [PMC free article] [PubMed] [Google Scholar]
- Johnson L, Mercer K, Greenbaum D, Bronson RT, Crowley D, Tuveson DA, and Jacks T (2001). Somatic activation of the K-ras oncogene causes early onset lung cancer in mice. Nature 410, 1111–1116. [DOI] [PubMed] [Google Scholar]
- Jonkers J, Meuwissen R, van der Gulden H, Peterse H, van der Valk M, and Berns A (2001). Synergistic tumor suppressor activity of BRCA2 and p53 in a conditional mouse model for breast cancer. Nat Genet 29, 418–425. [DOI] [PubMed] [Google Scholar]
- Kim D, Langmead B, and Salzberg SL (2015). HISAT: a fast spliced aligner with low memory requirements. Nat Methods 12, 357–360. [DOI] [PMC free article] [PubMed] [Google Scholar]
- Konig D, Savic Prince S, and Rothschild SI (2021). Targeted Therapy in Advanced and Metastatic Non-Small Cell Lung Cancer. An Update on Treatment of the Most Important Actionable Oncogenic Driver Alterations. Cancers (Basel) 13. [DOI] [PMC free article] [PubMed] [Google Scholar]
- Kuo AJ, Cheung P, Chen K, Zee BM, Kioi M, Lauring J, Xi Y, Park BH, Shi X, Garcia BA, et al. (2011). NSD2 Links Dimethylation of Histone H3 at Lysine 36 to Oncogenic Programming. Mol Cell 44, 609–620. [DOI] [PMC free article] [PubMed] [Google Scholar]
- Langmead B, and Salzberg SL (2012). Fast gapped-read alignment with Bowtie 2. Nat Methods 9, 357–359. [DOI] [PMC free article] [PubMed] [Google Scholar]
- Lhoumaud P, Badri S, Rodriguez-Hernaez J, Sakellaropoulos T, Sethia G, Kloetgen A, Cornwell M, Bhattacharyya S, Ay F, Bonneau R, et al. (2019). NSD2 overexpression drives clustered chromatin and transcriptional changes in a subset of insulated domains. Nat Commun 10, 4843. [DOI] [PMC free article] [PubMed] [Google Scholar]
- Li H, Handsaker B, Wysoker A, Fennell T, Ruan J, Homer N, Marth G, Abecasis G, Durbin R, and Genome Project Data Processing, S. (2009). The Sequence Alignment/Map format and SAMtools. Bioinformatics 25, 2078–2079. [DOI] [PMC free article] [PubMed] [Google Scholar]
- Li J, Ahn JH, and Wang GG (2019). Understanding histone H3 lysine 36 methylation and its deregulation in disease. Cell Mol Life Sci 76, 2899–2916. [DOI] [PMC free article] [PubMed] [Google Scholar]
- Li N, Xue W, Yuan H, Dong B, Ding Y, Liu Y, Jiang M, Kan S, Sun T, Ren J, et al. (2017). AKT-mediated stabilization of histone methyltransferase WHSC1 promotes prostate cancer metastasis. J Clin Invest 127, 1284–1302. [DOI] [PMC free article] [PubMed] [Google Scholar]
- Li W, Tian W, Yuan G, Deng P, Sengupta D, Cheng Z, Cao Y, Ren J, Qin Y, Zhou Y, et al. (2021). Molecular basis of nucleosomal H3K36 methylation by NSD methyltransferases. Nature 590, 498–503. [DOI] [PMC free article] [PubMed] [Google Scholar]
- Liao Y, Smyth GK, and Shi W (2014). featureCounts: an efficient general purpose program for assigning sequence reads to genomic features. Bioinformatics 30, 923–930. [DOI] [PubMed] [Google Scholar]
- Liu S, Hausmann S, Carlson SM, Fuentes ME, Francis JW, Pillai R, Lofgren SM, Hulea L, Tandoc K, Lu J, et al. (2019). METTL13 Methylation of eEF1A Increases Translational Output to Promote Tumorigenesis. Cell 176, 491–504 e421. [DOI] [PMC free article] [PubMed] [Google Scholar]
- Love MI, Huber W, and Anders S (2014). Moderated estimation of fold change and dispersion for RNA-seq data with DESeq2. Genome Biol 15, 550. [DOI] [PMC free article] [PubMed] [Google Scholar]
- Lowary PT, and Widom J (1998). New DNA sequence rules for high affinity binding to histone octamer and sequence-directed nucleosome positioning. J Mol Biol 276, 19–42. [DOI] [PubMed] [Google Scholar]
- Lu C, Jain SU, Hoelper D, Bechet D, Molden RC, Ran L, Murphy D, Venneti S, Hameed M, Pawel BR, et al. (2016). Histone H3K36 mutations promote sarcomagenesis through altered histone methylation landscape. Science 352, 844–849. [DOI] [PMC free article] [PubMed] [Google Scholar]
- Luger K, Rechsteiner TJ, and Richmond TJ (1999). Expression and purification of recombinant histones and nucleosome reconstitution. Methods Mol Biol 119, 1–16. [DOI] [PubMed] [Google Scholar]
- Mazur PK, Herner A, Mello SS, Wirth M, Hausmann S, Sanchez-Rivera FJ, Lofgren SM, Kuschma T, Hahn SA, Vangala D, et al. (2015). Combined inhibition of BET family proteins and histone deacetylases as a potential epigenetics-based therapy for pancreatic ductal adenocarcinoma. Nat Med 21, 1163–1171. [DOI] [PMC free article] [PubMed] [Google Scholar]
- Mazur PK, Reynoird N, Khatri P, Jansen PW, Wilkinson AW, Liu S, Barbash O, Van Aller GS, Huddleston M, Dhanak D, et al. (2014). SMYD3 links lysine methylation of MAP3K2 to Ras-driven cancer. Nature 510, 283–287. [DOI] [PMC free article] [PubMed] [Google Scholar]
- Odogwu L, Mathieu L, Blumenthal G, Larkins E, Goldberg KB, Griffin N, Bijwaard K, Lee EY, Philip R, Jiang X, et al. (2018). FDA Approval Summary: Dabrafenib and Trametinib for the Treatment of Metastatic Non-Small Cell Lung Cancers Harboring BRAF V600E Mutations. Oncologist 23, 740–745. [DOI] [PMC free article] [PubMed] [Google Scholar]
- Oyer JA, Huang X, Zheng Y, Shim J, Ezponda T, Carpenter Z, Allegretta M, Okot-Kotber CI, Patel JP, Melnick A, et al. (2014). Point mutation E1099K in MMSET/NSD2 enhances its methyltranferase activity and leads to altered global chromatin methylation in lymphoid malignancies. Leukemia 28, 198–201. [DOI] [PMC free article] [PubMed] [Google Scholar]
- Popovic R, Martinez-Garcia E, Giannopoulou EG, Zhang Q, Zhang Q, Ezponda T, Shah MY, Zheng Y, Will CM, Small EC, et al. (2014). Histone methyltransferase MMSET/NSD2 alters EZH2 binding and reprograms the myeloma epigenome through global and focal changes in H3K36 and H3K27 methylation. PLoS Genet 10, e1004566. [DOI] [PMC free article] [PubMed] [Google Scholar]
- Ramirez F, Ryan DP, Gruning B, Bhardwaj V, Kilpert F, Richter AS, Heyne S, Dundar F, and Manke T (2016). deepTools2: a next generation web server for deep-sequencing data analysis. Nucleic Acids Res 44, W160–165. [DOI] [PMC free article] [PubMed] [Google Scholar]
- Ruiz-Cordero R, and Devine WP (2020). Targeted Therapy and Checkpoint Immunotherapy in Lung Cancer. Surg Pathol Clin 13, 17–33. [DOI] [PubMed] [Google Scholar]
- Schmitges FW, Prusty AB, Faty M, Stutzer A, Lingaraju GM, Aiwazian J, Sack R, Hess D, Li L, Zhou S, et al. (2011). Histone methylation by PRC2 is inhibited by active chromatin marks. Mol Cell 42, 330–341. [DOI] [PubMed] [Google Scholar]
- Skene PJ, and Henikoff S (2017). An efficient targeted nuclease strategy for high-resolution mapping of DNA binding sites. Elife 6. [DOI] [PMC free article] [PubMed] [Google Scholar]
- Streubel G, Watson A, Jammula SG, Scelfo A, Fitzpatrick DJ, Oliviero G, McCole R, Conway E, Glancy E, Negri GL, et al. (2018). The H3K36me2 Methyltransferase Nsd1 Demarcates PRC2-Mediated H3K27me2 and H3K27me3 Domains in Embryonic Stem Cells. Mol Cell 70, 371–379 e375. [DOI] [PubMed] [Google Scholar]
- Subramanian A, Tamayo P, Mootha VK, Mukherjee S, Ebert BL, Gillette MA, Paulovich A, Pomeroy SL, Golub TR, Lander ES, et al. (2005). Gene set enrichment analysis: a knowledge-based approach for interpreting genome-wide expression profiles. Proc Natl Acad Sci U S A 102, 15545–15550. [DOI] [PMC free article] [PubMed] [Google Scholar]
- Sung H, Ferlay J, Siegel RL, Laversanne M, Soerjomataram I, Jemal A, and Bray F (2021). Global cancer statistics 2020: GLOBOCAN estimates of incidence and mortality worldwide for 36 cancers in 185 countries. CA Cancer J Clin. [DOI] [PubMed] [Google Scholar]
- Sweet-Cordero A, Mukherjee S, Subramanian A, You H, Roix JJ, Ladd-Acosta C, Mesirov J, Golub TR, and Jacks T (2005). An oncogenic KRAS2 expression signature identified by cross-species gene-expression analysis. Nat Genet 37, 48–55. [DOI] [PubMed] [Google Scholar]
- Tasic B, Hippenmeyer S, Wang C, Gamboa M, Zong H, Chen-Tsai Y, and Luo L (2011). Site-specific integrase-mediated transgenesis in mice via pronuclear injection. Proc Natl Acad Sci U S A 108, 7902–7907. [DOI] [PMC free article] [PubMed] [Google Scholar]
- Wang Z, Hausmann S, Lyu R, Li TM, Lofgren SM, Flores NM, Fuentes ME, Caporicci M, Yang Z, Meiners MJ, et al. (2020). SETD5-Coordinated Chromatin Reprogramming Regulates Adaptive Resistance to Targeted Pancreatic Cancer Therapy. Cancer Cell 37, 834–849 e813. [DOI] [PMC free article] [PubMed] [Google Scholar]
- Wright CJ, and McCormack PL (2013). Trametinib: first global approval. Drugs 73, 1245–1254. [DOI] [PubMed] [Google Scholar]
- Xue JY, Zhao Y, Aronowitz J, Mai TT, Vides A, Qeriqi B, Kim D, Li C, de Stanchina E, Mazutis L, et al. (2020). Rapid non-uniform adaptation to conformation-specific KRAS(G12C) inhibition. Nature 577, 421–425. [DOI] [PMC free article] [PubMed] [Google Scholar]
- Yang H, Wang H, Shivalila CS, Cheng AW, Shi L, and Jaenisch R (2013). One-step generation of mice carrying reporter and conditional alleles by CRISPR/Cas-mediated genome engineering. Cell 154, 1370–1379. [DOI] [PMC free article] [PubMed] [Google Scholar]
- Yuan G, Flores NM, Hausmann S, Lofgren SM, Kharchenko V, Angulo-Ibanez M, Sengupta D, Lu X, Czaban I, Azhibek D, et al. (2021). Elevated NSD3 histone methylation activity drives squamous cell lung cancer. Nature 590, 504–508. [DOI] [PMC free article] [PubMed] [Google Scholar]
- Yuan S, Natesan R, Sanchez-Rivera FJ, Li J, Bhanu NV, Yamazoe T, Lin JH, Merrell AJ, Sela Y, Thomas SK, et al. (2020). Global Regulation of the Histone Mark H3K36me2 Underlies Epithelial Plasticity and Metastatic Progression. Cancer Discov 10, 854–871. [DOI] [PMC free article] [PubMed] [Google Scholar]
- Zhang J, Lee YR, Dang F, Gan W, Menon AV, Katon JM, Hsu CH, Asara JM, Tibarewal P, Leslie NR, et al. (2019). PTEN Methylation by NSD2 Controls Cellular Sensitivity to DNA Damage. Cancer Discov 9, 1306–1323. [DOI] [PMC free article] [PubMed] [Google Scholar]
Associated Data
This section collects any data citations, data availability statements, or supplementary materials included in this article.
Supplementary Materials
Data Availability Statement
All datasets generated during the current study: (1) RNA-seq of wild type lungs, Kras and Kras;Nsd2 mutant mice lung tumors, and primary cells derived from Kras;Nsd2 tumors (sgControl and sgNsd2) and (2) CUT&RUN data for genomic NSD2, H3K36me2 and H3K27me3 chromatin occupancy have been deposited through GEO and are publicly available as of the date of publication. Accession number for the data (GSE171218) is indicated in the resource table. Original western blot images have been deposited at Mendeley and are publicly available as of the date of publication. The DOI is listed in the key resources table.
This paper does not report original code, software, or algorithm. All utilized codes are publicly available as of the date of publication. DOIs are listed in the key resources table.
Any additional information required to reanalyze the data reported in this paper is available from the lead contact upon request.
KEY RESOURCES TABLE.
| REAGENT OR RESOURCE | SOURCE | IDENTIFIER |
|---|---|---|
| Antibodies | ||
| Biotin Micro Beads | Miltenyi Biotec | Cat# 130-042-401 |
| CD45-Biotin | eBiosciences | Cat# 13-0451-81 |
| CD31-Biotin | eBiosciences | Cat# 13-0319-80 |
| Cleaved Caspase 3 | Cell Signaling Technologies | Cat# 9664 |
| Di-methyl lysine motif | Cell Signaling Technologies | Cat# 14117 |
| ERK1/2 | Cell Signaling Technologies | Cat# 4695 |
| Phospho-ERK1/2 | Cell Signaling Technologies | Cat# 4376 |
| FLAG | Sigma-Aldrich | Cat# F1804 |
| Histone H3 | EpiCypher | Cat# 13-0001 |
| H3K36me1 | Abclonal | Cat# A2364 |
| H3K36me2 | ThermoFisher | Cat# MA5-14867 |
| H3K36me3 | ThermoFisher | Cat# MA5-24687 |
| H3K27me2 | Cell Signaling Technologies | Cat# 9728S |
| H3K27me3 | ThermoFisher | Cat# MA5-11198 |
| H4K20me2 | Cell Signaling Technologies | Cat# 9759S |
| H4K20me3 | Cell Signaling Technologies | Cat# 5737S |
| H3K9me2 | ThermoFisher | Cat# 710815 |
| γH2AX | ThermoFisher | Cat# MA5-33062 |
| Ki67 | BD Bioscience | Cat# 550609 |
| KRas Antibody (F234) | Santa Cruz Biotechnology | Cat# sc-30 |
| NSD2 | EpiCypher | Cat# 13-0001 |
| NSD2E1099K | This study | N/A |
| PTEN | Cell Signaling Technologies | Cat# 9188 |
| Ter119-Biotin | eBiosciences | Cat# 13-5921-81 |
| Tubulin | Millipore | Cat# 05-661 |
| Peroxidase AffiniPure Donkey Anti-Mouse IgG (H+L) | Jackson ImmunoResearch | Cat# 715-035-151 |
| Peroxidase AffiniPure Donkey Anti-Rabbit IgG (H+L) | Jackson ImmunoResearch | Cat# 711-035-152 |
| Bacterial and Virus Strains | ||
| DH5 | Thermo Fisher Scientific | Cat# K4520-1 |
| BL21 | Thermo Fisher Scientific | Cat# C6070-03 |
| BL21-RIL | Agilent Technologies | Cat# 230240 |
| Sf9 | Thermo Fisher Scientific | Cat# 12659017 |
| Ad5-CMV-Cre | Baylor College of Medicine, Viral Vector Production Core | Cat# Ad5-CMV-Cre RRID:SCR_015037 |
| Biological Samples | ||
| Human LUAD Tissue Array | MD Anderson Pathology | N/A |
| Chemicals, Peptides, and Recombinant Proteins | ||
| RPMI 1640 Medium | Corning | Cat# MT10040CV |
| DMEM Medium | Corning | Cat# MT10017CV |
| Fetal bovine serum | Thermo Fisher Scientific | Cat# 10500056 |
| PBS | Corning | Cat# MT21031CV |
| HBSS | Thermo Fisher Scientific | Cat# 14025076 |
| Trypsin-EDTA 0.25% | Corning | Cat# MT25053CI |
| Puromycin | Thermo Fisher Scientific | Cat# A1113802 |
| Hygromycin B | Corning | Cat# 30240CR |
| G418 Sulfate | Corning | Cat# MT30234CI |
| Complete Protease Inhibitor Cocktail | Sigma-Aldrich | Cat# 4693159001 |
| Phosphatase Inhibitor Cocktail | Thermo Fisher Scientific | Cat# 78420 |
| TRIzol Reagent | Invitrogen | Cat# 15596018 |
| Bovine Serum Albumin (BSA) | Thermo Fisher Scientific | Cat# BP9703100 |
| Matrigel | Corning | Cat# 354248 |
| L-Reduced glutathione | Sigma-Aldrich | Cat# G4251-25G |
| S-adenosyl-methionine | New England Biolabs | Cat# B9003S |
| S-Adenosyl-l-[methyl-3H] methionine | American Radiolabeled Chemicals | Cat# ART0288 |
| TransIT-293 | Mirus Bio | Cat# MIR-2706 |
| NP-40 | Sigma-Aldrich | Cat# I8896 |
| Phenylmethylsulfonyl fluoride (PMSF) | Sigma-Aldrich | Cat# P7626 |
| cOmplete, EDTA-free protease inhibitor | Sigma-Aldrich | Cat# 5056489001 |
| Trametinib (GSK1120212) | Selleckchem | Cat# S2673 |
| Tamoxifen | Sigma-Aldrich | Cat# T5648 |
| Recombinant nucleosome | Epicypher | Cat# 16-0006 |
| DMSO | Sigma-Aldrich | Cat# D5879 |
| 16% Formaldehyde (w/v) | Sigma-Aldrich | Cat# F8775 |
| PVDF membrane (0.2 μm) | BioRad | Cat# 1620177 |
| PVDF membrane (0.45 μm) | Millipore | Cat# IPVH00010 |
| Glutathione Sepharose 4B | Sigma-Aldrich | Cat# GE17-0756-01 |
| Coomassie Plus Assay | Thermo Fisher Scientific | Cat# 23236 |
| Coomassie GelCode Blue | Thermo Fisher Scientific | Cat# 24590 |
| Polybrene | Sigma-Aldrich | Cat# TR-1003-G |
| Hydroxypropyl methylcellulose | Sigma-Aldrich | Cat# 09963 |
| Doxycycline hyclate diet | Envigo Teklad | Cat# TD.01306 |
| Recombinant STAT3 protein | Active Motif | Cat# NC1851469 |
| Critical Commercial Assays | ||
| RNeasy Mini Kit | Qiagen | Cat# 74106 |
| ZymoPURE Plasmid Miniprep Kit | Zymo | Cat# D4211 |
| ZymoPURE II Plasmid Maxiprep Kit | Zymo | Cat# D4203 |
| DNA PCR Purification Kit | Qiagen | Cat# 28106 |
| DAB Substrate Kit | Abcam | Cat# ab64238 |
| Vectastain ABC kit | Vector Laboratories | Cat# PK-6100 |
| BCA Protein Assay Kit | Pierce | Cat# 23227 |
| ECL Substrate | Amersham | Cat# RPN2106 |
| PCR Mycoplasma Test Kit I/C | PromoKine | Cat# PK-CA91-1096 |
| Site-directed mutagenesis kit | Agilent | Cat# 200523 |
| Superscript First-strand Synthesis kit | Invitrogen | Cat# 18091050 |
| Bac-to-Bac Baculovirus Expression System | Thermo Fisher Scientific | Cat# 10359016 |
| PowerUP SYBR Green | Thermo Fisher Scientific | Cat# A25742 |
| Qiagen MinElute PCR purification kit | Qiagen | Cat# 28004 |
| NEBNext Ultra II DNA Library Prep Kit | Illumina | Cat# NEB E7645L |
| Deposited Data | ||
| RNA-seq and CUT&RUN | This study | GEO accession # GSE171218 |
| Original Blot Images Data | This study | Mendeley Data DOI: DOI: 10.17632/4ns5ffk8fg.1 |
| Experimental Models: Cell Lines | ||
| Human: A549 | ATCC | Cat# CRL- CCL-185 |
| Human: U2OS | ATCC | Cat# CRL- HTB-96 |
| Human: HT1080 | ATCC | Cat# CCL-121 |
| Human: 293T | ATCC | Cat# CRL-3216 |
| Mouse: Kras (KrasG12D) | This study | N/A |
| Mouse: KN (Kras;NSD2E1099K) | This study | N/A |
| Experimental Models: Organisms/Strains | ||
| Mouse: KrasLSL-G12D | (Hingorani et al., 2003) | Strain# JAX 008179 |
| Mouse: p53LoxP/LoxP | (Jonkers et al., 2001) | Strain# JAX 008462 |
| Mouse: Rosa26LSL-Nsd2(E1099K) | This study | N/A |
| Mouse: H11LSL-dCas9-KRAB-MeCP2; CAG-rtTA | This study | N/A |
| Mouse: NOD.SCID-IL2Rg−/− (NSG) | The Jackson Laboratories | Strain# 005557 |
| Oligonucleotides | ||
| sgRNA non-targeting (control) 5’-CTTCGAAATGTCCGTTCGGT-3’ | This study | N/A |
| sgRNA Nsd2 human 5’- ACTCGTTAACAAATTCTCCCTGG 3’ | This study | N/A |
| sgRNA dCas9-KM Ci-Nsd2 5’- CGTTGCAGCGTAGGTCACTG-3’ | This study | N/A |
| sgRNA dCas9-KM Ci-Control 5’-GCGAGGTATTCGGCTCCGCG-3’ | This study | N/A |
| RT-qPCR Fosl1 forward 5’-CTAAGTGCAGAAACCGAAGAAAG 3’ | This study | N/A |
| RT-qPCR Fosl1 reverse 5’- CTTCTGCAGCTCTTCAATCTCTC-3’ | This study | N/A |
| RT-qPCR Jun forward 5’- TGGGCACATCA CCACTACAC-3’ | This study | N/A |
| RT-qPCR Jun reverse 5’- TCTGGCTATGCAGTTCAGCC -3’ | This study | N/A |
| RT-qPCR Actb forward 5’-TCGTACCACAGGCATTGTGATGG-3’ | This study | N/A |
| RT-qPCR Actb reverse 5’- GCAATGCCTGGGTACATGGTGG-3’ | This study | N/A |
| RT-qPCR Kras forward 5’- GGAGTACAGTGCAATGAGGGAC-3’ | This study | N/A |
| RT-qPCR Kras reverse 5’- CCAGGACCATAGGCACATCTTC-3’ | This study | N/A |
| ChIP-qPCR Fosl1 forward 5’- CCCCCGTGGTGCAAGTGGTT-3’ | This study | N/A |
| ChIP-qPCR Fosl1 reverse 5’- CGCGCCTCTCGGAGTCTGGT -3’ | This study | N/A |
| ChIP-qPCR Jun forward 5’- GCCATCCACAAATCCTCCCTGA -3’ | This study | N/A |
| ChIP-qPCR Jun reverse 5’- GCACAAGTGGGAAGTAACCCTA -3’ | This study | N/A |
| ChIP-qPCR GAPDH forward 5’- TAAGTCCCACAGCACCACAT -3’ | This study | N/A |
| ChIP-qPCR GAPDH reverse 5’- AGCATCTTTGTGACTGGGGA -3’ | This study | N/A |
| Recombinant DNA | ||
| Plasmid: pLentiCRISPRv2 | Feng Zhang Lab | Cat# Addgene #52961 |
| Plasmid: pCMV-dR8.2 dvpr | Bob Weinberg Lab | Cat# Addgene #8455 |
| Plasmid: pCMV-VSV-G | Bob Weinberg Lab | Cat# Addgene #8454 |
| Plasmid: pBABE-neo | Bob Weinberg Lab | Cat# Addgene #1767 |
| Plasmid: pGEX-6P-1 | GE Healthcare | Cat# 28-9546-48 |
| Plasmid: pENTR3C | Thermo Fisher Scientific | Cat# A10465 |
| Plasmid: pLenti CMV Hygro DEST (w117-1) | Campeau and Kaufman lab | Cat# Addgene 17454 |
| Software and Algorithms | ||
| Prism 7 | GraphPad | https://www.graphpad.com/; RRID:SCR_002798 |
| Excel for Mac 2016 | Microsoft | https://www.microsoft.com/en-us/; RRID:SCR_016137 |
| PreciPoint M8 ViewPoint | PreciPoint | http://www.precipoint.com/microscopy-software/viewpoint/ |
| ImageJ – Fiji package | Freeware | http://fiji.sc; RRID:SCR_002285 |
| Origin Pro 8 | Microcal | https://www.originlab.com/ RRID:SCR_002815 |
| DeepTools (3.5.0) | (Ramirez et al., 2016) | https://deeptools.readthedocs.io/en/latest/content/list_of_tools.html |
| Samtools (1.9) | (Li et al., 2009) | http://www.htslib.org/doc/samtools.html |
| Bamtools (2.3.0) | (Barnett et al., 2011) | https://github.com/pezmaster31/bamtools |
| Picard (1.96) | Picard Toolkit, 2019. Broad Institute, GitHub Repository | https://broadinstitute.github.io/picard/ |
| FeatureCounts | (Liao et al., 2014) | http://subread.sourceforge.net |
| Gene Set Enrichment Analysis (GSEA) (4.1.0) | (Subramanian et al., 2005) | https://www.gsea-msigdb.org/gsea/index.jsp |
| Bowtie2 (2.2.7) | (Langmead and Salzberg, 2012) | http://bowtie-bio.sourceforge.net/bowtie2/index.shtml |
| HTSeq | (Anders et al., 2015) | https://htseq.readthedocs.io/en/release_0.11.1/count.html |
| HISAT2 (2.2.1) | (Kim et al., 2015) | https://daehwankimlab.github.io/hisat2 |
| DESeq2 | (Love et al., 2014) | (https://bioconductor.org/packages/release/bioc/html/DESeq2.html |
| Trim_galore (0.6.5) | Babraham Bioinformatics | http://www.bioinformatics.babraham.ac.uk/projects/trim_galore |