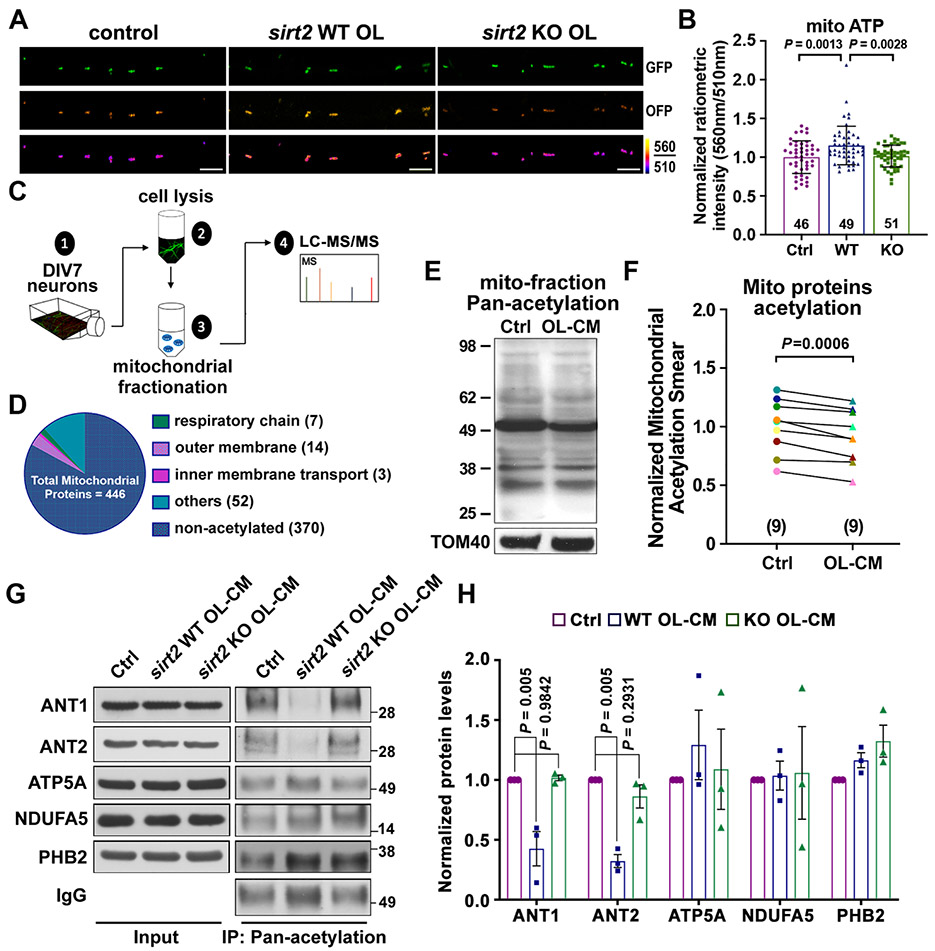
Figure 6. SIRT2 Regulates Axonal Energetics by Deacetylation of Mitochondrial Proteins.
(A, B) Images (A) and quantification (B) of the mitochondrial-targeted ATP sensor GO-ATeam2-Mito, reflecting ATP levels in the inner mitochondrial matrix, in DIV8 neuronal axons cultured alone (Ctrl), co-cultured with WT or sirt2 KO OLs.
(C) Experimental workflow depicting mitochondrial fractionation from DIV7 cortical neurons for detection of acetylated peptides via mass spectrometry (MS).
(D) Graphical depiction of MS revealing the categorization of a total of 446 mitochondrial proteins detected.
(E, F) Immunoblot (E) and normalized ratios of acetylation signal (F) showing a reduced acetylation of mitochondrial proteins in neurons treated with OL-CM for 24 hours. Mitochondria were prepared by fractionation and acetylated proteins were detected with an anti-Pan-acetylation antibody. Acetylated signal was calibrated with TOM40 levels and normalized to neurons treated with control media (n = 9).
(G, H) Immunoblots (G) and quantification (H) of acetylation assay of 5 mitochondrial proteins as indicated. Neurons at DIV8 were treated with control media (Ctrl), or OL-CM derived from WT or sirt2 KO mice for 24 hours, then lysed and incubated with Acetyl-Lysine affinity beads and analyzed by immunoblots with the indicated antibodies. The protein of interest was normalized to IgG level and subsequently normalized to control group (n = 3). Note that acetylation levels of ANT1 and ANT2 are largely reduced by OL-derived SIRT2.
Data were quantified from the total number of axons (B) indicated in bars and statistical analysis was performed on data collected from three or nine biological replicates using paired Student’s t-test (F) or one-way ANOVA test with Tukey’s multiple comparisons test (B, H). Scale bars: 5 μm.

