

Summary
Molecular switch proteins whose cycling between states is controlled by opposing regulators1,2 are central to biological signal transduction. As switch proteins function within highly connected interaction networks3, the fundamental question arises how functional specificity is achieved when different processes share common regulators. Here we show that functional specificity of the small GTPase switch protein Ran/Gsp14 is linked to differential sensitivity of biological processes to different kinetics of the Ran/Gsp1 switch cycle. We make 55 targeted point mutations to individual protein interaction interfaces of Ran/Gsp1 and show through quantitative genetic5 and physical interaction mapping that Ran/Gsp1 interface perturbations have widespread cellular consequences. Unexpectedly, the cellular effects of the interface mutations group by their biophysical effects on kinetic parameters of the GTPase switch cycle and not by the targeted interfaces. Instead, we show that interface mutations allosterically tune the GTPase cycle kinetics. These results suggest a model where protein partner binding, or posttranslational modifications at distal sites, could act as allosteric regulators of GTPase switching. Similar mechanisms may underlie regulation by other GTPases, and other biological switches. Furthermore, our integrative platform to determine the quantitative consequences of molecular perturbations may help explain the effects of disease mutations targeting central molecular switches.
Proteins perform their cellular functions within networks of interactions with many partners3. The interconnectivity of these networks raises the fundamental question of how different individual functions can be controlled with the required specificity, especially when distinct cellular processes share common regulators. Moreover, in highly interconnected networks even small perturbations could have widespread cellular effects6,7.
To determine the mechanism and extent by which molecular perturbations affect interconnected biological processes, we targeted a central molecular switch, a GTPase. GTPases are two-state switches controlled by regulators with opposing functions2. The two states of GTPase switches are defined by the conformation of their GTP- or GDP-bound forms, and the interconversion between states is catalyzed by guanine nucleotide exchange factors (GEFs) and GTPase-activating proteins (GAPs) (Fig. 1a). Other, similar biological switch motifs involve covalent modifications controlled by opposing kinase/phosphatase or acetylase/deacetylase regulators. One striking feature of such motifs is their potential for ultrasensitive response to regulation, where small changes in the activity of the regulators can lead to sharp changes in the state of the switch1,2. Moreover, switch motifs such as GTPases are often multi-specific, defined here as regulating several distinct processes8.
Figure 1. Genetic interaction (GI) profiles of Gsp1 interface point mutants cluster by biological processes but not by targeted interfaces.

a, Interface point mutations enable probing of biological functions of the multi-specific GTPase switch Gsp1. b, Mutated residue positions shown as Cα atom spheres on the structure of GTP-bound Gsp1. Bold: positions of mutations with strong genetic interaction profiles; italic: positions not conserved in sequence between S. cerevisiae and human; coloured dots: interaction partners for which the residue is in the interface core; blue and pink: switch I and II regions. c, GI profiles of 23 Gsp1 mutants with nine or more significant GIs, hierarchically clustered by Pearson correlation. Negative S-score (blue): synthetic sick/lethal GIs; positive S-score (yellow): suppressive/epistatic GIs. d, Distributions of significant GIs of Gsp1 point mutants compared to GIs of mutant alleles of essential and non-essential genes. e, Distributions of Pearson correlations between the GI profiles of Gsp1 interaction partners and Gsp1 mutants if mutation is (right, black) or is not (left, gray) in the interface with that partner. Point size: false discovery rate adjusted one-sided (positive) p-value of the Pearson correlation; pink bars (d,e): mean.
Here we focus on the multi-specific small GTPase Gsp1 (the S. cerevisiae homolog of human Ran) as a model system. Gsp1/Ran is a highly conserved molecular switch with one main GEF and one main GAP9 that regulates nucleocytoplasmic transport of proteins10 and RNA11, cell cycle progression12, and RNA processing13. Crystal structures of Gsp1/Ran in complex with 16 different binding partners are known (Extended Data Fig. 1, Supplementary Fig. 1, and Table 1). We reasoned that by placing point mutations in Gsp1 interfaces with these partners, we would differentially perturb subsets of biological processes regulated by Gsp1. We then determined the functional consequences of these Gsp1 interface mutations on cellular processes in S. cerevisiae using quantitative genetic interaction mapping (Fig. 1a), measured changes to the physical interaction network using affinity purification mass spectrometry (AP-MS), and quantified molecular effects on the Gsp1 switch using biophysical studies in vitro.
Genetic interactions of Gsp1 mutants.
We designed 55 genomically integrated point mutant alleles of S. cerevisiae Gsp1 to target each of its 16 known interactions (Fig. 1b, Extended Data Fig. 1, Supplementary Tables 2, 3), avoiding mutations in the Gsp1 nucleotide binding site and the switch I and II regions. We confirmed by Western blot that the mutant Gsp1 protein levels were close to the endogenous wild-type levels (Extended Data Fig. 2).
To determine the cellular effects of the Gsp1 interface mutations, we performed a genetic interaction (GI) screen in S. cerevisiae using the epistatic mini-array profile (E-MAP) approach5,7. We measured growth of each GSP1 point mutant in the context of an array of 1444 single gene knockouts, resulting in a quantitative functional profile of up to 1444 GI values for each GSP1 point mutant (Supplementary Data 1). The 55 GSP1 point mutants fell into two clusters, 23 ‘strong’ mutants with rich GI profiles containing 9-373 significant interactions (Fig. 1c), and 32 ‘weak’ mutants with 0-8 significant interactions (Extended Data Fig. 3, Methods and Supplementary Fig. 2). The strong mutants covered eleven Gsp1 sequence positions and all 16 structurally characterized Gsp1 protein interaction interfaces (Extended Data Fig. 4a). Twelve of the GSP1 interface point mutants had a greater number of significant GIs than an average deletion of a non-essential S. cerevisiae gene, and six GSP1 point mutants had more GIs than an average temperature sensitive mutant of an essential gene in a published S. cerevisiae GI map14 (Fig. 1d). Hierarchical clustering of S. cerevisiae genes based on their GIs with the Gsp1 interface mutations grouped genes by their cellular functions, including mRNA transport, tRNA modification, and spindle assembly regulation (Fig. 1c, Extended Data Fig. 4b). Taken together, the GI analysis reveals expansive functional consequences of Gsp1 interface point mutations - similar in magnitude to effects typically observed for deleting entire genes - that illuminated many of the biological functions of GSP1.
In contrast to their clustering of biological processes, the GI profiles of the Gsp1 point mutants did not group based on their location in the Gsp1 partner interfaces. For example, strains with GSP1 mutations at residues T34 (T34E/Q) and D79 (D79S/A) have similar GI profiles (Fig. 1c) but these mutations are in different interfaces (Extended Data Fig. 4a) on opposite sides of the Gsp1 structure (Fig. 1b). This observation was contrary to our initial expectation that Gsp1 achieves its functional specificity by interacting with different partners. To analyze this finding further, we compared the GSP1 mutant GI profiles to profiles from 3370 S. cerevisiae alleles14 using Pearson correlations. Significant positive correlations of GI profiles indicate functional relationships5 (Supplementary Data 2, Supplementary Table 4, Extended Data Fig. 4c). Strikingly, GI profiles of GSP1 mutants and of Gsp1 physical interaction partners were on average no more similar to each other in instances where the Gsp1 mutation was located in the partner interface than when the mutation was not (Fig. 1e, Extended Data Fig. 4d). This result suggests that the rich functional profiles of GSP1 mutants cannot simply be explained by considering only the partner interaction targeted by the interface point mutation.
Physical interactions of Gsp1 mutants.
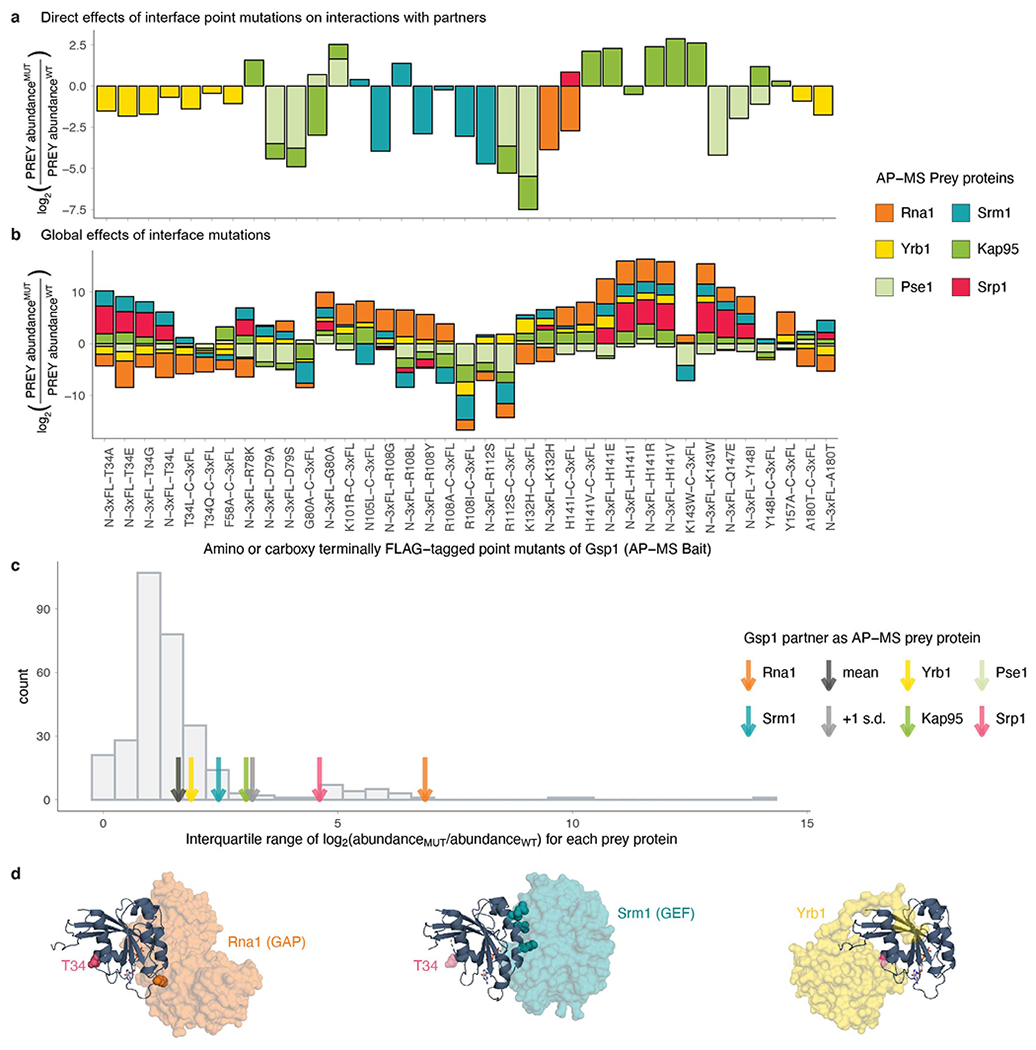
To investigate further why the GI profiles of Gsp1 mutations did not group based on targeted physical interactions of Gsp1, we sought to determine how interface point mutations affected the physical protein interaction network of Gsp1. We tagged wild-type Gsp1 and 28 mutants covering all interface residues shown in Extended Data Fig. 4a with an amino- or carboxy-terminal 3xFLAG tag and quantified the abundance of 316 high-confidence ‘prey’ partner proteins in complex with Gsp1 by AP-MS (Fig. 2, Extended Data Fig. 5, Supplementary Data 3). We refer to the prey partner protein abundance in the pulled-down Gsp1 complexes simply as “abundance” below. Six of the 16 Gsp1 binding partners for which we had structural information were robustly observable in the AP-MS data for both Gsp1 wild type and mutants: the two core regulators Rna1 (GAP) and Srm1 (GEF), as well as four effectors Yrb1, Kap95, Pse1 and Srp1. As expected, the abundance of the prey partner was decreased on average (although not always) when the Gsp1 mutation was in the interface core with the prey partner (Fig. 2a, left distribution). However, instead of expected minimal effects, we also found notable changes in prey abundance in cases where the mutation was not directly in the interface (Fig. 2a right distribution). A wide spread of abundance changes was apparent for the two main GTPase regulators, GAP (Rna1) and GEF (Srm1), even for mutations at positions that are outside either of the interfaces such as T34 (Fig. 2b, Extended Data Fig. 6, Supplementary Table 5). In summary, the AP-MS experiments show that the point mutations, in addition to affecting the targeted interactions, also introduce extensive changes to the physical interaction network of Gsp1 that cannot simply be explained by the interface location of the mutations.
Figure 2. Gsp1 interface point mutations rewire the physical interaction network of Gsp1, including interactions with the switch regulators GEF (Srm1) and GAP (Rna1).

Shown is the log2-transformed fold change (FC) between abundance of partner proteins pulled-down with a Gsp1 mutant versus pulled-down with wild-type Gsp1. a, Change in abundance of partner proteins with crystal structures in complex with Gsp1 (Rna1, Srm1, Yrb1, Kap95, Pse1, Srp1) where the mutation is (left) or is not (right) in the interface core with the partner, n: number of partner abundance changes in each category. Mean(log2FC) values (pink bars) are −1 and 0.73, respectively (t-test p-value = 1.6x10⁻⁵). Point size: p-value of abundance fold change. b, Change in abundance of pulled-down Rna1 and Srm1. Point size as in b; points coloured by interface location.
Effect of mutants on Gsp1 switch kinetics.
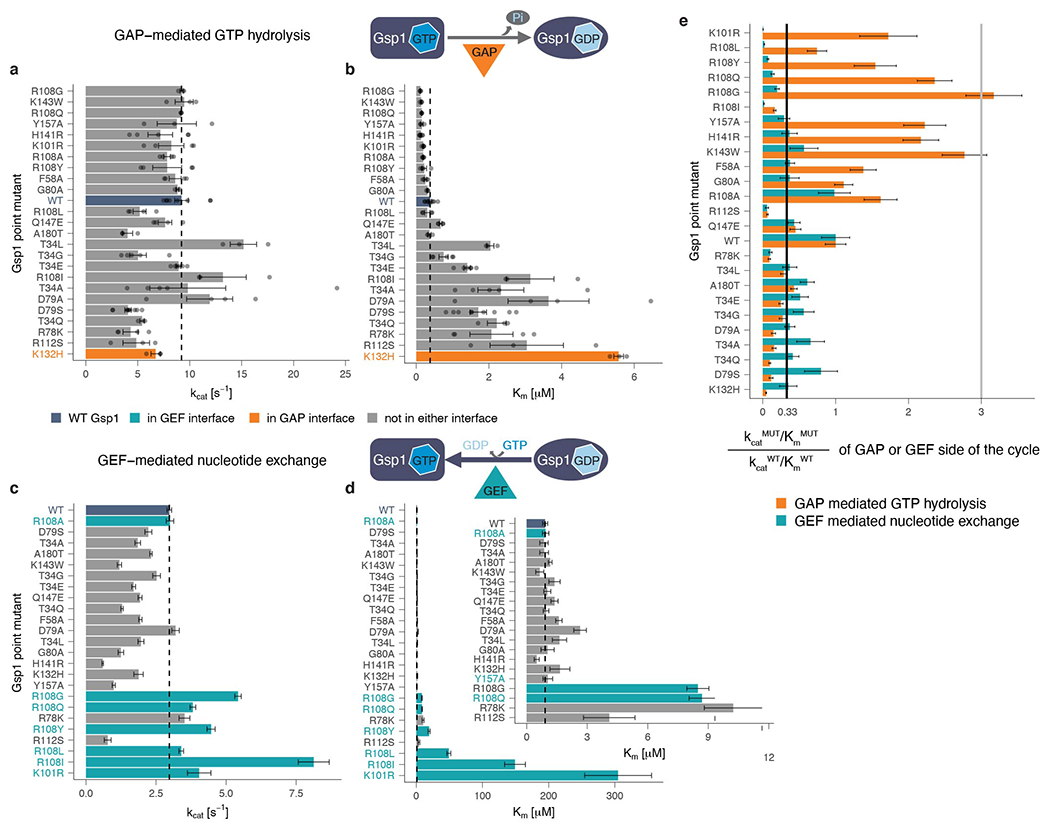
The AP-MS experiments showed that most Gsp1 interface mutations significantly altered physical interactions with the two principal GTPase regulators, GAP and GEF. This observation prompted the question whether the mutations, rather than acting indirectly in the cellular context (i.e. by altering the competition between physical interaction partners in the cell), affected the molecular function of the switch directly. To assess the molecular effects of mutation on switch function, we recombinantly expressed and purified wild-type and 24 Gsp1 mutants and measured their effects on GAP-mediated GTP hydrolysis and GEF-mediated nucleotide exchange in vitro (Fig. 3a, b, Extended Data Fig. 7, Supplementary Figures 3, 4, and Tables 6, 7). Of the 24 Gsp1 point mutants, 17 (of which all except K132H had strong GI profiles) showed 3- to >200-fold change in kcat/Km on either or both of the GAP- or GEF-mediated reactions (Extended Data Fig. 7e). These results show that Gsp1 interface mutations can modulate the GTPase cycle by affecting GTP hydrolysis and nucleotide exchange catalyzed by the GAP and GEF. Moreover, since nine out of the 17 mutations with larger than 3-fold effects are located outside of the interface cores with either the GAP (Fig. 3a) or the GEF (Fig. 3b) as well as outside the known switch regions, our data suggest considerable, previously unappreciated, allostery in the GTPase switch.
Figure 3. Point mutations in Gsp1 interfaces allosterically modulate GTPase cycle parameters by tuning active site conformational distributions.

Catalytic efficiency (kcat/Km) of GAP-mediated GTP hydrolysis (a) or GEF-mediated nucleotide exchange (b) of Gsp1 mutants. Dotted lines: wild-type efficiency. In a, points represent kcat/Km from an individual experiment fit to an integrated Michaelis-Menten equation. Error bars: standard error of the mean from n ≥ 3 replicates. In b, error bars represent the standard error of the mean of the Michaelis-Menten fit to data from n ≥ 17 measurements at different substrate concentrations. c, 31P NMR of GTP-bound Gsp1 point mutants. NMR peak heights are normalized to the β peak of bound GTP (βGTPb). The two peaks of the γ phosphate of bound GTP are highlighted in yellow. d, Natural log-transformed ratios MUT/WT of the exchange equilibrium constants Kex = population in γ2 / population in γ1 (assuming a detection limit of 3% for the γ peak estimation by 31P NMR) plotted against the natural log-transformed ratios MUT/WT of the relative catalytic efficiency (kcat/Km) of GAP-mediated GTP hydrolysis. Error bars: standard error of the mean for n ≥ 3 replicates. Pink line: least-squares linear fit, excluding K132H, R78K and D79S (gray box).
Allosteric effects of mutations.
To probe the mechanism of these allosteric effects, we examined the impact of Gsp1 point mutations on the conformational distribution in the active site of GTP-bound Gsp1 using 1D 31P nuclear magnetic resonance (NMR) spectroscopy. Prior 31P NMR data on human Ran15 showed two distinct peaks for the γ-phosphate of bound GTP arising from differences in the local chemical environment of the γ-phosphate in each of two distinct conformations (termed γ1 and γ2). Our 31P NMR spectra of S. cerevisiae wild-type Gsp1:GTP showed two distinct peaks for the γ-phosphate of bound GTP with 87% of wild-type Gsp1:GTP in the γ2 state conformation (Fig. 3c, Extended Data Fig. 8a). Strikingly, the relative populations of the γ1 and γ2 states were modulated by our Gsp1 interface mutations and ranged from close to 0% in the γ2 state for T34E and T34Q, to close to 100% for H141R, Y157A, and K132H (Fig. 3c).
Furthermore, we observed a linear relationship between the effect of the mutation on the equilibrium between the γ1 and γ2 conformations (plotted as the natural log-transformed ratio of the equilibrium constant) and the natural log-transformed ratio of the relative catalytic efficiencies of GAP-mediated GTP hydrolysis (Fig. 3d) and intrinsic GTP hydrolysis (Extended Data Fig. 8b, c, Supplementary Table 8). This relationship suggests that the γ2 state represents the active site conformation of Gsp1:GTP competent for GTP hydrolysis. Exceptions to the linear relationship are K132H, which is in the core of the GAP interface and hence expected to directly affect the interaction with the GAP, and D79S and R78K, which are adjacent to the GTPase switch II region and could lead to different perturbations of the nucleotide binding site.
Remarkably, the mutated residues that tune the population of the γ2 state (positions T34, H141, Q147, and Y157) are all distal, affecting the chemical environment of the Gsp1-bound GTP γ phosphate from at least 18 Å away (Extended Data Fig. 8d, e). Taken together, our in vitro data support an allosteric mechanism where distal mutations at different surface interaction sites of Gsp1 modulate the GTPase switch by differentially affecting GEF-catalyzed nucleotide exchange and GAP-catalyzed GTP hydrolysis. Moreover, comparison between the in vitro kinetic and our AP-MS data showed that the direction of the GTPase cycle perturbation is a good predictor of altered physical interactions with the two main cycle regulators (Extended Data Fig. 9), even in the context of other potentially competing partner proteins.
Encoding of Gsp1 multi-specificity.
Finally, we asked whether the allosteric effects of the mutations on the GTPase cycle kinetics explained the functional effects observed in the cellular GI profiles. This analysis also provided insights into the ability of Gsp1 to distinctly regulate different biological processes (functional multi-specificity). We clustered the GI profiles of the Gsp1 mutants based on correlation with the GI profiles of 3358 S. cerevisiae alleles14; 276 alleles had significant correlations to Gsp1 mutants (Fig. 4a). We then compared clustering of these GI profile correlations with the biophysical effects of the Gsp1 mutations. Remarkably, the Gsp1 mutant GI profile clustering mirrored an approximate ordering by the in vitro mutant effects on the GTPase cycle: relative GAP efficiency systematically increased with increasing column number and relative GEF efficiency decreased (Fig. 4a). (The clear outlier, K101R, could be explained by acetylation of this residue16. The K101R mutation could affect a critical mechanism by which the cell reduces GEF activity17, phenocopying mutants with reduced GTP hydrolysis activity.) Overall, genes in Fig. 4a fall into one of three categories: (i) genes in cluster 1, but also cluster 2, that correlate with mutants primarily perturbed in GTP hydrolysis (Fig. 4a, orange bars), (ii) genes in cluster 7 that correlate with mutants primarily perturbed in nucleotide exchange (teal bars), and (iii) genes that correlate strongly with all or most of the Gsp1 point mutants (cluster 5, but also clusters 3, 4, and 6).
Figure 4. Cellular effects of interface mutations group by their effect on GTPase cycle kinetics.

a, Clustering of 276 S. cerevisiae alleles and 22 strong Gsp1 point mutants by the p-value of Pearson correlations of their GI profiles compared to the relative efficiencies of GAP-mediated GTP hydrolysis and GEF-mediated nucleotide exchange (asterisks: not measured). Gray scale: False discovery rate adjusted one-sided (positive) p-value of the Pearson correlations. Parentheses: number of genes in cluster. b, Distributions of Pearson correlations, separated by Gsp1 point mutant groups from column hierarchical clustering in a. Green, red, or blue points: individual correlations with S. cerevisiae genes in three gene sets; gray violin plots: distributions of correlations with all other genes; point size: false discovery rate adjusted one-sided (positive) p-value of the Pearson correlation. Only significant correlations (p-value < 0.05) are included. c, Kinetic characteristics of Gsp1 mutant groups I to III. Outliers are shown as empty circles and dashed lines. The log ratio of relative catalytic efficiencies is capped at −3. d, Heatmaps of false discovery rate adjusted one-sided (positive) p-value of the Pearson correlation for the three representative gene sets. S. cerevisiae genes for each gene set are clustered by p-value. The GTPase cycle schemes on the right represent three modes of Gsp1 function. In c,d only Gsp1 mutants with kinetics data are shown, grouped as in a.
Importantly, genes with shared biological functions (gene sets, Supplementary Data 4) all predominantly fall into one of the three categories defined above. For example, genes involved in spindle assembly regulation have significant GI profile correlations primarily with Gsp1 mutant group I (Fig. 4b, red points), genes involved in tRNA modification primarily with Gsp1 mutant group III (blue points), and genes important for nucleocytoplasmic transport with Gsp1 mutants from all three groups (green points). The three groups of Gsp1 mutants show distinct kinetic characteristics: Group I has decreased efficiency of GTP hydrolysis, group III decreased nucleotide exchange, and group II shows intermediate behavior (Fig. 4c). Therefore, our analysis suggests that distinct cellular processes regulated by Gsp1, such as spindle assembly regulation, tRNA modification, and nuclear transport (Fig. 4b, d), as well as 5’ mRNA capping, transcriptional regulation, cytoplasm-to-vacuole targeting, and actin, tubulin and cell polarity (Extended Data Fig. 10) are differentially sensitive to perturbations of GTPase cycle kinetics. Taken together, our findings lead to a model where Ran/Gsp1 acts by three different modes defined by the sensitivity of different biological processes to perturbations of different characteristics of the Gsp1 GTPase cycle, i.e. the ability to (i) cycle, (ii) turn off by hydrolyzing to Gsp1:GDP, and (iii) turn on by producing Gsp1:GTP (Fig. 4d). While other effects such as changes in interaction affinities or expression levels undoubtedly also play a role in modulating the functional effects of our Gsp1 mutations, our model explains to a remarkable degree how a single molecular switch motif can differentially control subsets of biological processes by using one of the three functional modes.
Discussion
The discovery of several new allosteric sites (positions 34, 141, 147, and 157) in Gsp1 has implications for GTPase regulation. Our finding that mutations in Gsp1 interfaces allosterically modulate the switch cycle identifies thermodynamic coupling between distal interfaces and the active site; partner binding or posttranslational modifications at these distal sites could also regulate the switch.
Our observation of widespread functional effects of point mutations inducing relatively small perturbations in the GTPase switch kinetics is reminiscent of the zero-order ultrasensitivity achievable in biological motifs with opposing regulators2. While switch-like ultrasensitivity is typically described for systems controlled by covalent modifications (such as phosphorylation), our results, as well as the observations that cellular levels of small GTPase regulators require tight control18,19, corroborate a model of ultrasensitivity for GTPase conformational switches20.
Given the prevalence of biological two-state switch motifs with opposing regulators (kinase/phosphatase, acetylase/deacetylase), we envision our approach to engineer defined molecular perturbations and characterize them with systems-level functional genetics integrated with molecular biophysics to be informative for other studies of cellular regulation. The approach could be extended to mammalian systems using CRISPR-based approaches to yield mechanistic insights into the consequences of disease mutations targeting central molecular switches.
Methods
Detailed Methods are provided in Supplementary Methods and additional analysis can be found in Supplementary Discussion.
Point mutations in genomic Gsp1 sequence
We identified all residues in Gsp1 that comprised the interfaces with Gsp1 binding partners for which co-complex crystal structures with Gsp1 were available (Supplementary Fig. 1, Extended Data Fig. 1, Supplementary Table 1). Residues comprising the interface core, the surface exposed rim around the core, and more buried support residues were defined based on per-residue relative solvent accessible surface area (rASA), as previously described21. Avoiding canonical P-loop, or in the switch I or II regions22, we mutated residues that are located in interface cores (Supplementary Table 2, Extended Data Fig. 1g) into amino acid residues with a range of properties (differing in size, charge and polarity) and attempted to make stable and viable S. cerevisiae strains carrying a genomic Gsp1 point mutation (Supplementary Fig. 5). The list of attempted mutants is provided in Supplementary Table 3.
S. cerevisiae genetics and genetic interaction mapping
Epistatic mini-array profiling (E-MAP) of Gsp1 point mutants
Genetic interactions of all viable GSP1 point mutant (PM-Gsp1-clonNAT) strains were identified by epistatic miniarray profile (E-MAP) screens23,24 using a previously constructed array library of 1,536 KAN-marked (kanamycin) mutant strains assembled from the S. cerevisiae deletion collection25 and the DAmP (decreased abundance by mRNA perturbation ) strain collection26, covering genes involved in a wide variety of cellular processes7. The E-MAP screen was conducted as previously described in Collins et al23. Genetic interaction scores represent the average of 3-5 independent replicate screens. Reproducibility was assessed as previously described5 by comparing individual scores to the average score for each mutant:gene pair, with the two values showing strong correlation across the dataset (Pearson correlation coefficient = 0.83, Supplementary Fig. 6).
Hierarchical clustering of E-MAP genetic interaction data
All E-MAP library DAmP strains as well as library strains showing poor reproducibility were discarded, leaving 1444 out of the original 1536 library genes. Averaged S-scores of genetic interactions between wild-type and point mutant Gsp1 and the 1444 S. cerevisiae genes are provided in Supplementary Data 1. Hierarchical clustering on the GI profiles was performed using the average linkage method and the pairwise Pearson correlation coefficient as a distance metric. To identify clusters of functionally related library genes, the hierarchical clustering tree was cut to produce 1200 clusters, resulting in 43 clusters with 3 or more members. Biological function descriptions for genes in these clusters were extracted from the Saccharomyces Genome Database (SGD)27. Clusters of genes representing common functions (complexes, pathways or biological functions) were selected by manual inspection and represented in the main text Fig. 1c and Extended Data Fig. 4b.
GI profile correlation measurements
Of the 1444 library genes in the GSP1 point mutant GI profile map, 1129 were present in the SGA dataset14. Pairwise Pearson correlation coefficients were computed between all GSP1 point mutants and SGA gene profiles, and all profiles trimmed to include only genetic interaction measurements with the 1129 shared library genes. Due to the relative sparsity of GI profiles, pairwise comparisons are dominated by high numbers of non-significant interactions. Accordingly, we did not consider correlations with GSP1 point mutants or SGA gene profiles that did not have significant genetic interactions (absolute scaled S-score greater than 3, see above) with at least 10 of the 1129 library genes. This requirement removed all weak Gsp1 point mutants and one strong mutant (R108A) from the correlation analysis (as they had at most nine genetic interactions with absolute score greater than 3), leaving 22 strong mutants and 3370 S. cerevisiae SGA alleles to be included in the correlation analysis. All Pearson correlations and their p-values between Gsp1 mutants and S. cerevisiae genes, including all correlations that did not pass our significance filtering procedures, are provided in Supplementary Data 2. The subset of Pearson correlations between Gsp1 point mutants and Gsp1 partners with available co-complex X-ray crystal structures, used to make the point plots in Fig. 1e and Extended Data Fig. 4c, d are also available in Supplementary Table 4.
Statistical significance of correlations was computed using both two-sided and one-sided (positive) t-tests adjusted for multiple hypothesis testing using both the Bonferroni method and the FDR method, which controls the false discovery rate28. All p-values reported in the text and figures are one-sided (positive) and corrected by the FDR method, unless otherwise stated. The FDR method of p-value correction has been shown to account for the positive dependency between test statistics29, such as those arising from the underlying functional similarities between S. cerevisiae alleles.
Significance testing was used to filter out S. cerevisiae gene SGA profiles that did not show a significant correlation (one-sided positive, Bonferroni-adjusted) with the GI profiles of at least two GSP1 point mutants. In total, 276 S. cerevisiae alleles from the SGA had a significant GI profile correlation (one-sided positive, Bonferroni-adjusted) with at least two GSP1 point mutants and were therefore included in the correlation analysis shown in Fig. 4a. We required alleles to correlate with at least two mutants because the goal of this analysis was to group mutants by similarity, and an allele that only significantly correlated with one mutant is uninformative for this task. After this filtering step, the one-sided p-values were used to populate a matrix of 22 mutants vs. 276 alleles, and hierarchical clustering was performed using Ward’s method. We used Ward’s method rather than the average linkage criterion as we found the latter resulted in a wide variety of group sizes due to a few sparsely populated outliers. Using Ward’s methods resulted in rounder clusters, allowing us to identify meaningful functional groups of mutants and alleles. Pearson correlation between correlation vectors was used as a distance metric for the mutant (row) clustering, while Euclidean distance was selected for the gene (column) clustering, due to the column vectors being relatively short (22 mutants per column vs. 276 alleles per row) and thus sensitive to outliers when clustered using Pearson correlations as the distance metric (for additional analysis of E-MAP statistics and clustering see Supplementary Discussion).
For the gene set analysis, we decreased the stringency of inclusion of S. cerevisiae SGA genes to include all alleles with a significant GI profile correlation (one-sided positive, Bonferroni-adjusted) with one or more Gsp1 mutants, which added another 201 alleles, resulting in 477 alleles. We made the gene sets larger to increase our confidence in connecting the patterns of correlations between S. cerevisiae genes and Gsp1 mutants, and GTPase cycle parameters represented in Fig. 4b, d. Indeed, while S. cerevisiae genes that only correlate significantly with one mutant are not informative for grouping mutants, they are informative for annotating the functional effects of individual mutants. Manually curated gene sets of S. cerevisiae genes with significant correlations with Gsp1 mutants are provided in Supplementary Data 4.
Physical interaction mapping using affinity purification mass spectrometry (AP-MS)
S. cerevisiae cell lysate preparation
S. cerevisiae strains for AP-MS were grown in YAPD medium (120 mg adenine hemisulfate salt (CAT # A9126, SIGMA), 10 g Bacto yeast extract (CAT # BD 212720), 20 g Bacto peptone (CAT # BD 211820), 20 g dextrose (D-glucose D16-3 Fisher Chemicals) per 1 L of medium). Each strain was grown at 30°C for 12 to 24 h to OD600 of 1-1.5. The cells were harvested by centrifugation at 3000 RCF for 3 minutes and the pellet was washed in 50 ml of ice-cold ddH2O, followed by a wash in 50 ml of 2x lysis buffer (200 mM HEPES pH 7.5, 200 mM KCl, 2 mM MgCl2, 30 μM GTP (Guanosine 5′-triphosphate sodium salt hydrate, CAT #G8877, Sigma-Aldrich), 1 mM Dithiothreitol (Promega V3151), 0.1% IGEPAL CA-630 (CAT # I8896, Sigma-Aldrich), and 10% glycerol). Each pellet of approximately 500 μl was then resuspended in 500 μl of 2X lysis buffer supplemented with protease inhibitors without EDTA (cOmplete, Mini, EDTA-free Protease Inhibitor Cocktail, CAT # 11836170001, Roche) and dripped through a syringe into liquid nitrogen. The frozen S. cerevisiae cell pellets were lysed in liquid nitrogen with a SPEX™ SamplePrep 6870 Freezer/Mill™.
FLAG immunoprecipitations were performed as previously described30,31.
Liquid chromatography with tandem mass spectrometry (LC-MS/MS) analysis
To prepare samples for LC-MS/MS analysis, immunoprecipitated protein (10 μl) was denatured and reduced in 2 M urea, 10 mM NH4HCO3, and 2 mM Dithiothreitol for 30 minutes at 60°C with constant shaking, alkylated in the dark with 2 mM iodoacetamide for 45 minutes at room temperature and digested overnight at 37°C with 80 ng trypsin (Promega). Following digestion, peptides were acidified with formic acid and desalted using C18 ZipTips (Millipore) according to the manufacturer’s specifications. Samples were re-suspended in 4% formic acid, 2% acetonitrile solution, and separated by a 75-minute reversed-phase gradient over a nanoflow C18 column (Dr. Maisch). Peptides were directly injected into a Q-Exactive Plus mass spectrometer (Thermo), with all MS1 and MS2 spectra collected in the orbitrap. Raw MS data were searched against the S. cerevisiae proteome (SGD sequences downloaded January 13, 2015) using the default settings in MaxQuant (version 1.5.7.4), with a match-between-runs enabled32,33. Peptides and proteins were filtered to 1% false discovery rate in MaxQuant, and identified proteins were then subjected to protein-protein interaction scoring using SAINTexpress34. Protein were filtered to only those representing high confidence protein-protein interactions (Bayesian false discovery rate from SAINT (SAINT BFDR) < 0.05). Protein abundance values for this filtered list were then subjected to equalized median normalization, label free quantification and statistical analysis were performed using MSstats35, separately for data from amino- or carboxy-terminally tagged baits. Fold change in abundance of preys for 3xFLAG-tagged Gsp1 point mutants was always calculated compared to the wild-type Gsp1 with the corresponding tag. All AP-MS data are available from the PRIDE repository under the PXD016338 identifier. Fold change values between prey abundance between the mutant and wild-type Gsp1 and the corresponding FDR adjusted p-values are provided in Supplementary Data 3. The intersection of all prey proteins identified at least once with both the amino- or carboxy-terminal 3xFLAG tag, and their interquartile ranges (IQR) of log2-transformed fold change values across all the Gsp1 mutants, are provided in Supplementary Table 5. Quality of data and reproducibility between replicates was assessed based on correlations of protein abundance between replicates (Supplementary Figs. 7, 8).
Biochemical and biophysical assays
Protein purifications
All proteins were expressed from a pET-28 a (+) vector with a N-terminal 6xHis tag in E. coli strain BL21 (DE3) in the presence of 50 mg/L Kanamycin for 2xYT medium, and 100 mg/L of Kanamycin for autoinduction EZ medium. GEF (Srm1 from S. cerevisiae, (Uniprot P21827)) was purified as Δ1-27Srm1 and GAP (Rna1 from S. pombe, Uniprot P41391) as a full-length protein (for use of S. pombe Rna1 see Supplementary Discussion). ScΔ1-27Srm1 and SpRna1 were expressed in 2xYT medium (10 g NaCl, 10 g yeast extract (BD Bacto™ Yeast Extract #212720), 16 g tryptone (Fisher, BP1421) per 1 L of medium) overnight at 25 °C upon addition of 300 μmol/L Isopropyl-β-D-thiogalactoside (IPTG). Gsp1 variants were expressed by autoinduction for 60 hours at 20°C in autoinduction medium, as described before36.
Cells were lysed in 50 mM Tris pH 7.5, 500 mM NaCl, 10 mM imidazole, and 2 mM β-mercaptoethanol using a microfluidizer from Microfluidics. For Gsp1 purifications, the lysis buffer was also supplemented with 10 mM MgCl2. The His-tagged proteins were purified on Ni-NTA resin (Thermo Scientific #88222) and washed into a buffer containing 50 mM Tris (pH 7.5) and 100 mM NaCl, with 5 mM MgCl2 for Gsp1 proteins. The N-terminal His-tag was digested at room temperature overnight using up to 12 NIH Units per mL of bovine thrombin (Sigma-Aldrich T4648-10KU). Proteins were then purified using size exclusion chromatography (HiLoad 26/600 Superdex 200 pg column from GE Healthcare), and purity was confirmed to be at least 90% by SDS polyacrylamide gel electrophoresis. Samples were concentrated on 10 kDa spin filter columns (Amicon Catalog # UFC901024) into storage buffer (50 mM Tris pH 7.5, 150 mM NaCl, 1 mM Dithiothreitol). Storage buffer for Gsp1 proteins was supplemented with 5 mM MgCl2.
GTP loading of Gsp1
Gsp1 variants for GTPase assays as well as for 31P NMR spectroscopy were first loaded with GTP by incubation in the presence of 20-fold excess GTP (Guanosine 5′-Triphosphate, Disodium Salt, CAT # 371701, Calbiochem) in 50 mM Tris HCl pH 7.5, 100 mM NaCl, 5 mM MgCl2. Exchange of GDP for GTP was initiated by the addition of 10 mM EDTA. Reactions were incubated for 3 hours at 4°C and stopped by addition of 1 M MgCl2 to a final concentration of 20 mM MgCl2 to quench the EDTA. GTP-loaded protein was buffer exchanged into either NMR buffer or the GTPase assay buffer using NAP-5 Sephadex G-25 DNA Grade columns (GE Healthcare # 17085301).
NMR Spectroscopy
Gsp1 samples for 31P NMR spectroscopy were first loaded with GTP as described above, and buffer exchanged into NMR Buffer (D2O with 50 mM Tris-HCl pH 7.4, 5 mM MgCl2, 2 mM Dithiothreitol). Final sample concentrations were between 250 μM and 2 mM, and 400 μl of sample were loaded into 5 mm Shigemi advanced microtubes matched to D2O (BMS-005TB; Shigemi Co. Ltd, Tokyo, Japan.). 31P NMR experiments were performed on a Bruker Avance III 600 MHz NMR spectrometer with a 5 mm BBFO Z-gradient Probe. Spectra were acquired and processed with the Bruker TopSpin software (version 4.0.3). Indirect chemical shift referencing for 31P to DSS (2 mM Sucrose, 0.5 mM DSS, 2 mM NaN3 in 90% H2O + 10% D2O; water-suppression standard) was done using the IUPAC-IUB recommended ratios37. Spectra were recorded at 25°C using the pulse and acquire program zg (TopSpin 3.6.0), with an acquisition time of 280 milliseconds, a recycle delay of 3.84 seconds, and a 65° hard pulse. *4,096 complex points were acquired over the course of 4,096 scans and a total acquisition time of 4.75 hours. Spectra were zero-filled once and multiplied with an exponential window function (EM) with a line-broadening of 6 Hz (LB = 6) prior to Fourier transformation. Peaks were integrated using the auto-integrate function in TopSpin 4.0.7, and peak areas were referenced to the bound GTP-β peak of each spectrum. The peak at approximately −7 ppm is defined as γ1 and the peak at approximately −8 ppm is defined as γ2. The percent of γ phosphate in γ2 is defined as a ratio of areas under the curve between the γ2 and the sum of the γ1 and γ2 peaks.
Kinetic measurements of GTP hydrolysis.
Kinetic parameters of the GTP hydrolysis reaction were determined using a protocol similar to one previously described38. Gsp1 samples for GTP hydrolysis kinetic assays were first loaded with GTP as described above. GTP hydrolysis was monitored by measuring fluorescence of the E. coli phosphate-binding protein labeled with 7-Diethylamino-3-[N-(2-maleimidoethyl)carbamoyl]coumarin (MDCC) (phosphate sensor, CAT # PV4406, Thermo Fisher) upon binding of the free phosphate GTP hydrolysis product (excitation at 425 nm, emission at 457 nm). All experiments were performed in GTPase assay buffer (40 mM HEPES pH 7.5, 100 mM NaCl, 4 mM MgCl2, 1 mM Dithiothreitol) at 30°C in 100 μl reaction volume on a Synergy H1 plate reader from BioTek, using Corning 3881 96-well half-area clear-bottom non-binding surface plates. For each individual GAP-mediated GTP hydrolysis experiment, a control experiment with the same concentration of GTP-loaded Gsp1 and the same concentration of sensor, but without added GAP, was run in parallel. The first 100 s of these data were used to determine the baseline fluorescence, and the rest of the data were linearly fit to estimate intrinsic GTP hydrolysis rate (Supplementary Table 8).
Estimating the kcat and Km parameters of GAP-mediated hydrolysis using an accurate solution to the integrated Michaelis-Menten equation.
We used an analytical solution of the integrated Michaelis-Menten equation based on the Lambert ω function, as described before by Goudar et al39, to estimate the kcat and Km of GAP-mediated GTP hydrolysis. The curves were fit with the custom-made software DELA40. Examples of full reaction progress curves and their integrated Michaelis-Menten fits are shown in Supplementary Fig. 3.
For most mutants a concentration of 1 nM GAP (SpRna1, Rna1 from S. pombe) was used. In order to run the time courses to completion, for mutants with low kcat/Km enzyme concentrations of 2-5 nM were used. Initially we collected time course data for all Gsp1 variants at approximately 8 μM concentration of loaded Gsp1:GTP with 1 nM GAP and 20 μM phosphate sensor. If the estimated Km was higher than 1 μM, we repeated the time course kinetic experiments with higher concentration of Gsp1:GTP of approximately tenfold above the Km.
The Michaelis Menten kcat and Km parameters and their standard deviations were calculated from at least three technical replicates from two or more independently GTP-loaded Gsp1 samples (Supplementary Table 6). For more details on the kinetic analysis see Supplementary Discussion and Supplementary Methods.
Kinetic measurements of Srm1 mediated nucleotide exchange.
Kinetic parameters of GEF mediated nucleotide exchange were determined using a fluorescence resonance energy transfer (FRET) based protocol41. Nucleotide exchange from GDP to mant-GTP (2′-(or-3′)-O-(N-Methylanthraniloyl) Guanosine 5′-Triphosphate, CAT # NU-206L, Jena Biosciences) was monitored by measuring a decrease in intrinsic Gsp1 tryptophan fluorescence (295 nm excitation, 335 nm detection) due to FRET upon binding of the mant group. Each time course was measured in GEF assay buffer (40 mM HEPES pH 7.5, 100 mM NaCl, 4 mM MgCl2, 1 mM Dithiothreitol) with excess of mant-GTP.
All kinetic measurements were done at 30°C in 100 μl reaction volume using 5 nM GEF (Δ1-27Srm1), except for higher concentrations of the mutants with high Km values that were measured at 20 nM GEF. Data were collected in a Synergy H1 plate reader from BioTek, using Corning 3686 96-well half-area non-binding surface plates. For low concentrations of Gsp1:GDP the time course data were fit to a combination of two exponential decays. The kinetic parameters of the nucleotide exchange were determined by fitting a Michaelis-Menten equation to an average of 38 data points (ranging from 17 to 91) per Gsp1 point mutant for a range of substrate concentrations from [Gsp1:GDP] = 0.25 μM to [Gsp1:GDP] ≫ Km. Michaelis-Menten fits are shown in Supplementary Fig. 4. Michaelis-Menten kcat and Km parameters for GEF-mediated nucleotide exchange are provided in Supplementary Table 7. For more details on the kinetic analysis see Supplementary Discussion and Supplementary Methods.
Extended Data
Extended Data Figure 1. Design of interface point mutations in S. cerevisiae Gsp1.

Interface residues are categorized as interface core, rim, and support positions (see Supplementary Methods) and provided in Supplementary Table 2. a-f, Structures of Ran/Gsp1 in partner-bound conformations with interface residues coloured by partner protein. All mutated Gsp1 residues are shown as spheres.: a, Srm1 (GEF) interface core (dark teal) and interface rim and support (light teal) PDB 1I2M; b, Rna1 (GAP) interface core (dark orange) and interface rim and support (light orange) PDB 1K5D; c, Ntf2 interface core (dark purple) and interface rim and support (light purple) PDB 1A2K; d, Residues that are in both the core of the Yrb1 and Yrb2 interfaces (dark yellow), and in only one of the two interfaces (light yellow) PDB 1K5D; e, Srp1 interface core (dark pink) and interface rim and support (light pink) PDB 1WA5; f, Residues that are in the core of four or more (dark green), two to three (green) and one (light green) karyopherin interface. Karyopherins are: Kap95, Crm1, Los1, Kap104, Msn5, Cse1, Mtr10. PDB 2BKU. g, Location of Gsp1 residues in partner interfaces. Residues within 5 Å of the nucleotide, in the canonical P-loop, or in the switch I or II regions22 were not mutated. Residues belonging to the switch I, switch II, and C-terminal α helix are indicated by dark navy bars. Chosen Gsp1 point mutation substitutions are provided in Supplementary Table 3.
Extended Data Figure 2. Endogenous expression levels of Gsp1 point mutations in S. cerevisiae strains with genomically integrated Gsp1 point mutations profiled by Western Blot.

a, Expression data for strong mutants, defined as mutants with nine or more significant GIs. b, Expression data for weak mutants, defined as mutants with fewer than nine significant GIs. In a, and b, bar heights indicate averages over two or more biological replicates (n) grown on separate days (except for T34D which has only one biological replicate), with error bars indicating one standard deviation for n >= 3. Overlaid points indicate individual biological replicates (each an average over at least 12 technical replicates per biological replicate for wild-type and MAT:α strains, and between one and six technical replicates per biological replicate for mutant strains). Expression levels are relative to the expression levels of wild-type Gsp1 protein with clonNAT resistance marker (WT) shown as red dashed lines (relative expression of 1). MAT:α is the starting S. cerevisiae strain (see Supplementary Methods). c, Distributions of average relative expression levels for strong and weak mutants. Each point is as in a and b. Horizontal pink bars indicate the mean of the point distributions.
Extended Data Figure 3. Genetic interaction (GI) profiles of the 56 Gsp1 strains (wild-type Gsp1 with clonNAT cassette and 55 point mutants).

Negative S-score (blue) represents synthetic sick/lethal GIs, positive S-score (yellow) represents suppressive/epistatic GIs; neutral S-scores (no significant GI) are shown in black. Gsp1 point mutants and S. cerevisiae genes are hierarchically clustered by Pearson correlation. Gsp1 mutants fall into two clusters: a cluster of 23 strong mutants with nine or more significant GIs and 32 weak mutants with fewer than nine significant GIs.
Extended Data Figure 4. Functional profiles of GSP1 mutants cannot be explained solely by the positions of mutations in interfaces.

a, Locations of mutated residues in structurally characterized interfaces. ΔrASA is the difference in accessible surface area of a residue upon binding, relative to an empirical maximum for the solvent accessible surface area of each amino acid residue type (see Supplementary Methods). b, GI profiles of Gsp1 mutants group S. cerevisiae genes by biological processes and complexes, such as the dynein/dynactin pathway, SWR1 complex, the Hog1 signaling pathway, mRNA splicing, mitochondrial proteins, and the Rpd3L histone deacetylase complex. c, Distributions of Pearson correlations between the GI profiles of strong Gsp1 mutants and alleles of Gsp1 direct interaction partners with available co-complex crystal structures (left) and strong Gsp1 mutants and alleles of all other S. cerevisiae genes (right).d, Distributions of Pearson correlations between the GI profiles of Gsp1 interaction partners and strong and weak Gsp1 mutants if mutation is (black and light purple) or is not (gray and dark purple) in the interface with that partner. Teal violin plot on the right represents the distribution of all other Pearson correlations between Gsp1 mutants and S. cerevisiae genes. In c and d, point size indicates the false discovery rate adjusted one-sided (positive) p-value of Pearson correlation, and pink bars indicate the mean of the point distributions; n denotes the number of Gsp1 point mutant-gene GI profile correlations in each category. Data for strong mutants are also shown in Fig. 1e and included here for comparison.
Extended Data Figure 5. Interface point mutations in Gsp1 rewire its physical interaction network.

a, Schematic representation of the affinity purification mass spectrometry (AP-MS) experiment to determine the abundance of pulled-down protein interaction partners of wild type and mutant Gsp1. The change in abundance of partner proteins pulled down with Gsp1 mutants in b, c, and d is represented as log2-transformed fold change (FC) between abundance of a partner pulled-down with a Gsp1 mutant versus pulled-down with wild-type Gsp1 (log2(abundance(PREY)MUT/abundance(PREY)WT). To account for possible tag effects, the fold change in prey abundance was always computed relative to the wild-type protein with the corresponding tag. Decreased abundance compared to pull-down with wild-type Gsp1 is annotated in red and increased abundance in blue. The log2-transformed fold change values are capped at +/− 4. b, Amino- and c, - carboxy terminally 3xFLAG-tagged Gsp1 point mutants (rows) and prey proteins identified by AP-MS (columns) hierarchically clustered by the log2-transformed fold change in prey abundance. d, Prey proteins pulled down by both amino- and carboxy-terminal tagged constructs. Left semi-circle represents an amino-terminal 3xFLAG-tagged Gsp1 point mutant, and right semi-circle represents carboxy-terminal 3xFLAG-tagged Gsp1 point mutant. Semi-circle size is proportional to the significance of the log2-transformed fold change (false discovery rate adjusted p-value) of the prey abundance in pulled-down complexes with a Gsp1 mutant compared to complexes with the wild-type Gsp1. Overall we identified 316 high-confidence prey partner proteins, with the amino- and carboxy-terminally tagged Gsp1 mutants pulling down 264 and 103 preys, respectively, including 51 overlapping preys. The difference in preys identified by experiments with N- or C-terminal tags illustrates the sensitivity of the interaction network to perturbation of Gsp1.
Extended Data Figure 6. Gsp1 interface mutations rewire interactions with the core regulators Srm1 and Rna1.
a, b, Protein-protein interactions between interface mutants of Gsp1 and Gsp1 partners for which there are co-complex X-ray crystal structures (core regulators Srm1 and Rna1, and effectors Yrb1, Kap95, Pse1, and Srp1). Change in pulled-down prey partner abundance is expressed as log2(PREY abundanceMUT/PREY abundanceWT)). N-3xFL and C-3xFL labelled mutants are tagged with an amino- or carboxy-terminal triple FLAG tag, respectively, and partners are coloured as indicated. a, Bar plot depicting changes in pulled-down prey partner abundance when the point mutation is in the core of the Gsp1 interface with the prey partner. b, Bar plot depicting all changes in pulled-down prey partner abundance for core regulators Srm1 and Rna1, and effectors Yrb1, Kap95, Pse1, and Srp1, regardless whether the mutation is directly in the interface core with the partner or not. c, Distribution showing the variation in log2-transformed fold change in abundance of all prey proteins pulled down with the Gsp1 mutants, as defined by interquartile range (IQR) across mutants. Values for core partners shown as arrows (Rna1 orange, Srm1 teal, Yrb1 yellow, Kap95 green, Pse1 light green, Srp1 pink). Mean and +1 standard deviation of IQR values are highlighted with a dark gray and a light gray arrow, respectively. The extent to which the abundance of the two cycle regulators Rna1 and Srm1 changed across the Gsp1 point mutants is larger than the change for an average prey protein. All IQR values are provided in Supplementary Table 5. d, Position of T34 with respect to the interfaces with Rna1 (GAP, orange surface, PDB 1K5D), Srm1 (GEF, teal surface, PDB 2I1M), and Yrb1 (yellow surface, PDB 1K5D). As the coordinates for T34 are not resolved in the 2I1M structure, in all three structures the pink spheres show the residue location in the aligned 1K5D structure. Gsp1: navy cartoon; GTP nucleotide: stick representation. Residues that were mutated in the Rna1 and Srm1 interfaces are shown in sphere representation and are coloured in orange (Rna1, left) or teal (Srm1, middle).
Extended Data Figure 7. Effect of Gsp1 point mutations on the in vitro efficiency of GAP-mediated GTP hydrolysis and GEF-mediated nucleotide exchange.
a, kcat and b, Km values of GAP-mediated GTP hydrolysis of wild-type and point mutant Gsp1. Error bars represent the standard deviation of the kcat and the Km parameters from the integrated Michaelis-Menten fit for n ≥ 3 replicates. c, kcat and d, Km of GEF-mediated nucleotide exchange of wild-type and point mutant Gsp1. Inset shows the Km barplot for all but the four mutants with the highest Km (K101R, R108L, R108I, and R108Y). Error bars represent the value plus/minus the standard error of the Michaelis-Menten fit to data from n ≥ 17 measurements at different substrate concentrations. a, b, c, d, Dotted lines indicate the wild-type values. Dark blue bar denotes the wild-type Gsp1, and orange and teal bars highlight the residues that are in the core of the interface with the GAP and GEF, respectively. e, Comparison of relative change in catalytic efficiencies of GAP-mediated GTP hydrolysis (orange bars) and GEF-mediated nucleotide exchange (teal bars) defined as kcatMUT/KmMUT / kcatWT/KmWT. Gray line indicates a three-fold increase compared to wild type and black line indicates a three-fold decrease compared to wild type. Error bars represent the added standard error of the mean (for GAP) or standard error of the fit (for GEF) values of the mutant and the wild-type efficiency (kcat/Km) values. Mutations not in the interface core with the GAP both increased (3-fold, R108G mutant) and decreased (3 to 10-fold, T34E/Q/A/G, R78K, D79S/A, R108I, and R112S mutants) the catalytic efficiency kcat/Km of GAP-mediated GTP hydrolysis, compared to wild-type Gsp1. As expected, mutations in the interface core with the GEF (K101, and R108) decreased the catalytic efficiency of GEF-mediated nucleotide exchange >40-fold. However, other mutations not in the GEF interface core (R78K, R112S, Y157A) also decreased the efficiency notably (3- to 10-fold).
Extended Data Figure 8. Gsp1 interface mutations act allosterically to modulate the rate of GTP hydrolysis.

a, Annotated 1D 31P NMR spectrum of wild-type Gsp1 loaded with GTP. Peak areas are computed over intervals shown and normalized to the GTPβ bound peak. The peaks from left to right correspond to: free phosphate (Pi), β phosphate of GDP bound to Gsp1 (GDPβbound), β phosphate of free (unbound) GDP (GDPβfree), γ phosphate of GTP bound to Gsp1 in conformation 1 (γ1), γ phosphate of GTP bound to Gsp1 in conformation 2 (γ2), α phosphate of bound or unbound GDP or GTP, β phosphate of GTP bound to Gsp1 (GTPβbound), β phosphate of free (unbound) GTP (GTPβfree). b, Rate of intrinsic GTP hydrolysis of wild-type Gsp1 and mutants. Dotted line indicates wild-type value. Error bars represent the standard deviations from n ≥ 3 replicates (dots). c, Natural log-transformed exchange equilibrium constant between the γ2 and γ1 conformations plotted against the relative rate of intrinsic GTP hydrolysis represented as a natural logarithm of the ratio of the rate for the mutant over the rate of the wild type. The pink line is a linear fit. Error bars represent the standard deviation from n ≥ 3 replicates of intrinsic GTP hydrolysis measurements. d, Location of Y157, H141, and Q147 (pink spheres) in the Crm1 interface (gray surface, PDB 3M1I). Gsp1: navy cartoon; GTP nucleotide: yellow stick representation, e, Location of T34 (pink spheres) in the interface with Yrb1 (gray surface, PDB 1K5D). Distances from the γ phosphate of GTP to the residue α-carbon are indicated below the residue numbers in d and e.
Extended Data Figure 9. Relative prey protein abundance compared to the wild type with corresponding 3xFLAG tag from the AP-MS proteomics experiment overlaid onto the effects of each mutation on relative in vitro efficiencies of GAP-mediated GTP hydrolysis and GEF-mediated nucleotide exchange.

Relative GAP-mediated hydrolysis and GEF-mediated exchange efficiencies are plotted as ln(kcatMUT/KmMUT/kcatWT/KmWT). Mutants that affect the efficiency (kcat/Km) of GEF-catalyzed nucleotide exchange more than the efficiency of GAP-catalyzed GTP hydrolysis are above the diagonal, and the mutants that affect the GAP-catalyzed hydrolysis are below the diagonal. Left semi-circle represents an amino-terminal 3xFLAG-tagged Gsp1 point mutant, and right semi-circle represents a carboxy-terminal 3xFLAG-tagged Gsp1 point mutant, relative to wild-type Gsp1 with the corresponding tag. a, Color represents log2-transformed ratio of GAP and GEF abundance fold change for each Gsp1 point mutant compared to wild type defined as log2((abundance(Rna1)MUT/abundance(Rna1)WT)/(abundance(Srm1)MUT/abundance(Srm1)WT)). Orange coloured mutants pull-down relatively less Rna1 (GAP) and teal mutants less Srm1 (GEF). b-f, Colour represents the log-transformed ratio of mutant and wild type pulled-down prey protein represented as log2(PREY abundanceMUT/PREY abundanceWT). Log-transformed relative abundance values are capped at +/− 4. Decreased prey abundance from AP-MS in pulled-down complexes with a mutant Gsp1 compared to complexes with the wild-type Gsp1 is represented in red and increased abundance in blue. Prey proteins: b, Rna1 (GAP); c, Srm1 (GEF); d, Yrb1; e, Kap95, and f, Vps71. Yrb1 follows a pattern similar to that of Rna1 (GAP), while Kap95 and Vps71 are similar to Srm1 (GEF).
Extended Data Figure 10. Sets of S. cerevisiae genes grouped by biological functions.

Heatmaps of the false discovery rate adjusted one-sided (positive) p-values of the Pearson correlations between the GI profiles of 22 strong Gsp1 point mutants and GI profiles of knock-outs or knock-downs of S. cerevisiae genes from Ref.14. The p-value is represented as a white to gray range as in Fig. 4a. Genes are organized in gene sets based on their biological function (Methods). The line plots above the heatmaps are the same as in Fig. 4c. a, Gsp1 point mutants and alleles of Gsp1 binding partners with available co-complex X-ray crystal structures, and S. cerevisiae genes involved in nuclear transport of RNA and proteins. b, Gsp1 point mutants and S. cerevisiae genes involved in transcription regulation or 5′ mRNA capping. c, Gsp1 point mutants and S. cerevisiae genes involved in the cytoplasm-to-vacuole targeting (CYT) pathway, and actin, tubulin, and cell polarity.
Supplementary Material
Acknowledgements.
We thank Roxana Ordonez for contributions to the design of mutations; Cristina Melero, Deborah Jeon, Shivani Mathur, Raina Danbi Kim, and Kale Kundert for technical help; Maru Jaime Garza for contributions to the conformational analysis by NMR; Colm Ryan for advice on E-MAP analysis; and Dave Agard, Geeta Narlikar, James Fraser, and Janet M. Thornton for discussions. This work was supported by a grant from the National Institutes of Health (R01-GM117189) to T.K., and a Sir Henry Wellcome Postdoctoral Fellowship (101614/Z/13/Z) to T.P. C.J.P.M. is a UCSF Discovery Fellow. T.K. is a Chan Zuckerberg Biohub investigator.
Footnotes
Competing Interest. The authors declare no competing interests.
Supplementary Information is available for this paper.
Code Availability.
Custom written R and Python scripts are available without restrictions at https://github.com/tinaperica/Gsp1_manuscript.
Data Availability.
The mass spectrometry proteomics data have been deposited to the PRIDE proteomics data repository with the dataset identifier PXD016338 and are available as Supplementary Tables. Raw biophysics data (cycle kinetics, CD, and NMR), and E-MAP S-scores, scaled SGA scores, and their correlations are available from https://github.com/tinaperica/Gsp1_manuscript/tree/master/Data. All other data that support the findings of this study are available within the paper, the Supplementary File, and Supplementary Data.
Main Text References
- 1.Ferrell JE & Ha SH Ultrasensitivity part I: Michaelian responses and zero-order ultrasensitivity. Trends in Biochemical Sciences 39, 496–503, doi: 10.1016/j.tibs.2014.08.003 (2014). [DOI] [PMC free article] [PubMed] [Google Scholar]
- 2.Goldbeter A & Koshland DE An amplified sensitivity arising from covalent modification in biological systems. Proceedings of the National Academy of Sciences 78, 6840–6844, doi: 10.1073/pnas.78.11.6840 (1981). [DOI] [PMC free article] [PubMed] [Google Scholar]
- 3.Eisenberg D, Marcotte EM, Xenarios I & Yeates TO Protein function in the post-genomic era. Nature 405, 823–826, doi: 10.1038/35015694 (2000). [DOI] [PubMed] [Google Scholar]
- 4.Rush MG, Drivas G & D’Eustachio P The small nuclear GTPase Ran: how much does it run? BioEssays 18, 103–112, doi: 10.1002/bies.950180206 (1996). [DOI] [PubMed] [Google Scholar]
- 5.Collins SR, Schuldiner M, Krogan NJ & Weissman JS A strategy for extracting and analyzing large-scale quantitative epistatic interaction data. Genome Biology 7, R63, doi: 10.1186/gb-2006-7-7-r63 (2006). [DOI] [PMC free article] [PubMed] [Google Scholar]
- 6.Braberg H et al. Genetic interaction mapping informs integrative structure determination of protein complexes. Science 370, doi: 10.1126/science.aaz4910 (2020). [DOI] [PMC free article] [PubMed] [Google Scholar]
- 7.Braberg H et al. From structure to systems: high-resolution, quantitative genetic analysis of RNA polymerase II. Cell 154, 775–788, doi: 10.1016/j.cell.2013.07.033 (2013). [DOI] [PMC free article] [PubMed] [Google Scholar]
- 8.Dasso M The Ran GTPase: theme and variations. Current Biology 12, R502–508, doi: 10.1016/s0960-9822(02)00970-3 (2002). [DOI] [PubMed] [Google Scholar]
- 9.Bischoff FR & Ponstingl H Vol. 1 (eds Rush MG & D’Eustachio P) 163–176 (Springer, Boston, MA, 2001). [Google Scholar]
- 10.Moore MS & Blobel G The GTP-binding protein Ran/TC4 is required for protein import into the nucleus. Nature 365, 661–663, doi: 10.1038/365661a0 (1993). [DOI] [PubMed] [Google Scholar]
- 11.Köhler A & Hurt E Exporting RNA from the nucleus to the cytoplasm. Nature Reviews Molecular Cell Biology 8, 761–773, doi: 10.1038/nrm2255 (2007). [DOI] [PubMed] [Google Scholar]
- 12.Arnaoutov A & Dasso M The Ran GTPase regulates kinetochore function. Developmental Cell 5, 99–111 (2003). [DOI] [PubMed] [Google Scholar]
- 13.Ren M et al. Separate domains of the Ran GTPase interact with different factors to regulate nuclear protein import and RNA processing. Molecular and Cellular Biology 15, 2117–2124, doi: 10.1128/mcb.15.4.2117 (1995). [DOI] [PMC free article] [PubMed] [Google Scholar]
- 14.Costanzo M et al. A global genetic interaction network maps a wiring diagram of cellular function. Science 353, aaf1420–aaf1420, doi: 10.1093/nar/gkt1076 (2016). [DOI] [PMC free article] [PubMed] [Google Scholar]
- 15.Geyer M et al. Conformational States of the Nuclear GTP-Binding Protein Ran and Its Complexes with the Exchange Factor RCC1 and the Effector Protein RanBP1. Biochemistry 38, 11250–11260, doi: 10.1021/bi9904306 (1999). [DOI] [PubMed] [Google Scholar]
- 16.Henriksen P et al. Proteome-wide Analysis of Lysine Acetylation Suggests its Broad Regulatory Scope in Saccharomyces cerevisiae. Molecular & Cellular Proteomics 11, 1510–1522, doi: 10.1074/mcp.M112.017251 (2012). [DOI] [PMC free article] [PubMed] [Google Scholar]
- 17.de Boor S et al. Small GTP-binding protein Ran is regulated by posttranslational lysine acetylation. Proceedings of the National Academy of Sciences 112, E3679–3688, doi: 10.1073/pnas.1505995112 (2015). [DOI] [PMC free article] [PubMed] [Google Scholar]
- 18.Besray Unal E et al. Systems level expression correlation of Ras GTPase regulators. Cell Communication and Signaling 16, 46, doi: 10.1186/s12964-018-0256-8 (2018). [DOI] [PMC free article] [PubMed] [Google Scholar]
- 19.Görlich D, Seewald MJ & Ribbeck K Characterization of Ran-driven cargo transport and the RanGTPase system by kinetic measurements and computer simulation. The EMBO Journal 22, 1088–1100, doi: 10.1093/emboj/cdg113 (2003). [DOI] [PMC free article] [PubMed] [Google Scholar]
- 20.Barr FA Review series: Rab GTPases and membrane identity: causal or inconsequential? The Journal of Cell Biology 202, 191–199, doi: 10.1083/jcb.201306010 (2013). [DOI] [PMC free article] [PubMed] [Google Scholar]
Additional References Cited in Main Methods
- 21.Levy ED A simple definition of structural regions in proteins and its use in analyzing interface evolution. Journal of Molecular Biology 403, 660–670, doi: 10.1016/j.jmb.2010.09.028 (2010). [DOI] [PubMed] [Google Scholar]
- 22.Rojas AM, Fuentes G, Rausell A & Valencia A The Ras protein superfamily: evolutionary tree and role of conserved amino acids. The Journal of Cell Biology 196, 189–201, doi: 10.1083/jcb.201103008 (2012). [DOI] [PMC free article] [PubMed] [Google Scholar]
- 23.Collins SR, Roguev A & Krogan NJ Quantitative genetic interaction mapping using the E-MAP approach. Methods in Enzymology 470, 205–231, doi: 10.1016/S0076-6879(10)70009-4 (2010). [DOI] [PMC free article] [PubMed] [Google Scholar]
- 24.Schuldiner M et al. Exploration of the function and organization of the yeast early secretory pathway through an epistatic miniarray profile. Cell 123, 507–519, doi: 10.1016/j.cell.2005.08.031 (2005). [DOI] [PubMed] [Google Scholar]
- 25.Giaever G et al. Functional profiling of the Saccharomyces cerevisiae genome. Nature 418, 387–391, doi: 10.1038/nature00935 (2002). [DOI] [PubMed] [Google Scholar]
- 26.Collins SR et al. Functional dissection of protein complexes involved in yeast chromosome biology using a genetic interaction map. Nature 446, 806–810, doi: 10.1038/nature05649 (2007). [DOI] [PubMed] [Google Scholar]
- 27.Cherry JM et al. SGD: Saccharomyces Genome Database. Nucleic Acids Research 26, 73–79, doi: 10.1093/nar/26.1.73 (1998). [DOI] [PMC free article] [PubMed] [Google Scholar]
- 28.Benjamini Y & Hochberg Y Controlling the False Discovery Rate - a Practical and Powerful Approach to Multiple Testing. Journal of the Royal Statistical Society Series B-Statistical Methodology 57, 289–300 (1995). [Google Scholar]
- 29.Benjamini Y & Yekutieli D The control of the false discovery rate in multiple testing under dependency. The Annals of Statistics 29, 1165–1188, 1124 (2001). [Google Scholar]
- 30.Jäger S et al. Global landscape of HIV-human protein complexes. Nature 481, 365–370, doi: 10.1038/nature10719 (2011). [DOI] [PMC free article] [PubMed] [Google Scholar]
- 31.Jäger S et al. Purification and characterization of HIV-human protein complexes. Methods 53, 13–19, doi: 10.1016/j.ymeth.2010.08.007 (2011). [DOI] [PMC free article] [PubMed] [Google Scholar]
- 32.Cox J & Mann M MaxQuant enables high peptide identification rates, individualized p.p.b.-range mass accuracies and proteome-wide protein quantification. Nature Biotechnology 26, 1367–1372, doi: 10.1038/nbt.1511 (2008). [DOI] [PubMed] [Google Scholar]
- 33.Cox J et al. Accurate proteome-wide label-free quantification by delayed normalization and maximal peptide ratio extraction, termed MaxLFQ. Molecular & Cellular Proteomics 13, 2513–2526, doi: 10.1074/mcp.M113.031591 (2014). [DOI] [PMC free article] [PubMed] [Google Scholar]
- 34.Teo G et al. SAINTexpress: improvements and additional features in Significance Analysis of INTeractome software. Journal of Proteomics 100, 37–43, doi: 10.1016/j.jprot.2013.10.023 (2014). [DOI] [PMC free article] [PubMed] [Google Scholar]
- 35.Choi M et al. MSstats: an R package for statistical analysis of quantitative mass spectrometry-based proteomic experiments. Bioinformatics 30, 2524–2526, doi: 10.1093/bioinformatics/btu305 (2014). [DOI] [PubMed] [Google Scholar]
- 36.Studier FW Protein production by auto-induction in high density shaking cultures. Protein Expression and Purification 41, 207–234 (2005). [DOI] [PubMed] [Google Scholar]
- 37.Markley JL et al. Recommendations for the presentation of NMR structures of proteins and nucleic acids – IUPAC-IUBMB-IUPAB Inter-Union Task Group on the Standardization of Data Bases of Protein and Nucleic Acid Structures Determined by NMR Spectroscopy. Journal of Biomolecular NMR 12, 1–23, doi: 10.1023/A:1008290618449 (1998). [DOI] [PubMed] [Google Scholar]
- 38.Mishra AK & Lambright DG High-throughput assay for profiling the substrate specificity of Rab GTPase-activating proteins. Methods in Molecular Biology 1298, 47–60, doi: 10.1007/978-1-4939-2569-8_4 (2015). [DOI] [PubMed] [Google Scholar]
- 39.Goudar CT, Sonnad JR & Duggleby RG Parameter estimation using a direct solution of the integrated Michaelis-Menten equation. Biochimica et Biophysica Acta 1429, 377–383 (1999). [DOI] [PubMed] [Google Scholar]
- 40.Malaby AW et al. Methods for analysis of size-exclusion chromatography–small-angle X-ray scattering and reconstruction of protein scattering. Journal of applied crystallography 48, 1102–1113, doi: 10.1107/S1600576715010420 (2015). [DOI] [PMC free article] [PubMed] [Google Scholar]
- 41.Klebe C, Bischoff FR, Ponstingl H & Wittinghofer A Interaction of the nuclear GTP-binding protein Ran with its regulatory proteins RCC1 and RanGAP1. Biochemistry 34, 639–647 (1995). [DOI] [PubMed] [Google Scholar]
Associated Data
This section collects any data citations, data availability statements, or supplementary materials included in this article.
Supplementary Materials
Data Availability Statement
The mass spectrometry proteomics data have been deposited to the PRIDE proteomics data repository with the dataset identifier PXD016338 and are available as Supplementary Tables. Raw biophysics data (cycle kinetics, CD, and NMR), and E-MAP S-scores, scaled SGA scores, and their correlations are available from https://github.com/tinaperica/Gsp1_manuscript/tree/master/Data. All other data that support the findings of this study are available within the paper, the Supplementary File, and Supplementary Data.