Abstract
Introduction
Stroke remains a leading cause of death and disability worldwide. Effective and prompt prognostic evaluation is vital for determining the appropriate management strategy. Radiomics is an emerging noninvasive method used to identify the quantitative imaging indicators for predicting important clinical outcomes. This study was conducted to investigate and validate a radiomics nomogram for predicting ischemic stroke prognosis using the modified Rankin scale (mRS).
Methods
A total of 598 consecutive patients with subacute infarction confirmed by diffusion-weighted imaging (DWI), from January 2018 to December 2019, were retrospectively assessed. They were assigned to the good (mRS ≤ 2) and poor (mRS > 2) functional outcome groups, respectively. Then, 399 patients examined by MR scanner 1 and 199 patients scanned by MR scanner 2 were assigned to the training and validation cohorts, respectively. Infarction lesions underwent manual segmentation on DWI, extracting 402 radiomic features. A radiomics nomogram encompassing patient characteristics and the radiomics signature was built using a multivariate logistic regression model. The performance of the nomogram was evaluated in the training and validation cohorts. Ultimately, decision curve analysis was implemented to assess the clinical value of the nomogram. The performance of infarction lesion volume was also evaluated using univariate analysis.
Results
Stroke lesion volume showed moderate performance, with an area under the curve (AUC) of 0.678. The radiomics signature, including 11 radiomics features, exhibited good prediction performance. The radiomics nomogram, encompassing clinical characteristics (age, hemorrhage, and 24 h National Institutes of Health Stroke Scale score) and the radiomics signature, presented good discriminatory potential in the training cohort [AUC = 0.80; 95% confidence interval (CI) 0.75–0.86], which was validated in the validation cohort (AUC = 0.73; 95% CI 0.63–0.82). In addition, it demonstrated good calibration in the training (p = 0.55) and validation (p = 0.21) cohorts. Decision curve analysis confirmed the clinical value of this nomogram.
Conclusion
This novel noninvasive clinical-radiomics nomogram shows good performance in predicting ischemic stroke prognosis.
Supplementary Information
The online version contains supplementary material available at 10.1007/s40120-021-00263-2.
Keywords: Stroke, Radiomics, Nomogram, Magnetic resonance imaging, Diffusion-weighted imaging
Key Summary Points
| Computed tomography (CT) and magnetic resonance imaging (MRI) play an important role in the early identification of ischemic stroke; however, the capability in predicting functional outcome is limited. |
| Converting medical images into high-throughput quantitative features, radiomics, has been applied in the prediction of clinical outcomes. |
| The novel noninvasive clinical-radiomics nomogram encompassing patient characteristics and the radiomics signature shows good performance in predicting ischemic stroke prognosis. |
Digital Features
This article is published with digital features, including a summary slide, to facilitate understanding of the article. To view digital features for this article go to https://doi.org/10.6084/m9.figshare.14749182.
Introduction
Stroke is a leading cause of mortality and disability worldwide, accounting for almost 5.5 million deaths and 116.4 million disability-adjusted life-years in 2016 according to the global burden of disease statistics, and now almost 6.5 million deaths per year [1–3]. In East Asia (e.g., Japan and China), the mortality rates for stroke are higher than those reported in Western nations such as the United Kingdom and the United States, representing the top cause of death in China [4]. Approximately 80% of stroke cases are attributed to ischemic stroke [5, 6], which is characterized by sudden ischemia to some brain regions, leading to irreversible cerebral injury occurring within a few minutes after the loss of blood circulation [7]. It is desirable to improve the prediction of clinical prognosis for information management strategies in ischemic stroke.
Conventionally, early identification of ischemic stroke is carried out by computed tomography (CT) and magnetic resonance imaging (MRI). CT has the advantage of detecting mass lesions and acute hemorrhage, while MRI provides superior soft tissue contrast for lesion identification as well as additional tissue information such as cellularity, vascularity, and microstructure complexity, with specific MRI sequences [8–10]. For instance, the apparent diffusion coefficient (ADC) yielded by diffusion-weighted imaging (DWI) can accurately describe the diffusion characteristics of the tissue. A recent study revealed that the ADC of the infarct lesion is significantly associated with patient prognosis in early subacute ischemic stroke [11]. In the latter study, the investigators only evaluated infarct lesions in the middle cerebral artery. Additionally, the ADC represents the mean value of the region of interest instead of reflecting the heterogeneity of infarcts. The CT perfusion–DWI mismatch has been used as a simple metric that offers the potential of a timely intervention, although penumbral patterns inaccurately predict the clinical outcome [12].
Radiomics can convert medical images into high-throughput quantitative features, and has been applied in the prediction of clinical outcomes [13–15]. A previous study [8] focusing on radiomics feature selection demonstrated that radiomics signatures show better efficacy than models without image feature selection. However, the study’s sample size was small, with only 70 patients. Another recent study [16] including 146 patients proposed a penumbra-based radiomics signature, which was helpful for predicting patient prognosis in acute ischemic stroke. Each patient underwent DWI and perfusion-weighted imaging (PWI) in the latter study. However, most ischemic stroke patients underwent only DWI instead of PWI. Thus, the objective of this study was to investigate the value of DWI-based radiomics for prognosis prediction in ischemic stroke, and to create an approach that could be used in management strategies for ischemic stroke. Meanwhile, an external cohort (data from MR scanner 2) was assessed to validate the performance of the novel nomogram.
Methods
Study Population
The current diagnostic study had approval from the Institutional Ethics Committee of our hospital (approval number: 2021-008-01 K). Each patient provided written informed consent before MRI examinations. The study was performed in accordance with the 1964 Declaration of Helsinki and its later amendments. From January 2018 to December 2019, a cohort of 598 patients diagnosed with ischemic stroke in our institution were included in this study. The participants had no previous infarction, and could live independently before the infarction. DWI scans were acquired within 24 h following stroke onset. Cases with previous cerebral hemorrhage, brain trauma, previous neurological disorder, and severe MRI artifacts were excluded.
We recorded the demographic and clinical data of all participants, i.e., age, sex, blood pressure, blood sugar, hemorrhage, baseline National Institutes of Health Stroke Scale (NIHSS) score (NIHSSbaseline), NIHSS score at 24 h post-admission (NIHSS24h), and the modified Rankin scale (mRS) score at 90 days. Regarding functional outcomes, the individuals were assigned to the good (mRS score ≤ 2) and poor (mRS score > 2) outcome groups [17, 18].
MRI Acquisition
A total of 399 cases were acquired on scanner 1 (EXCITE HD 1.5 T MRI; GE Healthcare, Milwaukee, WI, USA) comprising a 16-channel head/neck coil; the remaining 199 patients were acquired on scanner 2 (uMR780 3.0 T MRI; United Imaging Healthcare, Shanghai, China) equipped with a 24-channel head/neck coil.
Scan parameters for scanner 1 were as follows: (1) axial fast spin-echo (FSE) T1-weighted imaging (T1WI), with repetition time/echo time (TR/TE) = 2259 ms/25.4 ms, slice thickness/gap = 5 mm/1.5 mm, a field of view (FOV) of 240 × 240 mm2, and a matrix of 256 × 192; (2) axial FSE T2WI, with TR/TE = 5582 ms/111 ms, slice thickness/gap = 5 mm/1.5 mm, a FOV of 240 × 240 mm2, and a matrix of 256 × 192; (3) axial T2-fluid-attenuated inversion recovery (FLAIR) sequence, with TR/TE = 8589 ms/88.8 ms, slice thickness/gap = 5 mm/1.5 mm, a FOV of 240 × 240 mm2, and a matrix of 256 × 192; (4) axial DWI based on single-shot echo planar imaging (SSEPI) sequence, with TR/TE = 3203 ms/83.9 ms, slice thickness/gap = 5 mm/1.5 mm, a FOV of 240 × 240 mm2, b values of 0 and 1000 s/mm2, and a matrix of 96 × 96.
The scan parameters for scanner 2 were as follows: (1) axial FSE T1WI, with TR/TE = 2048 ms/11.96 ms, slice thickness/gap = 5 mm/1.5 mm, a FOV of 230 × 200 mm2, and a matrix of 288 × 192; (2) axial FSE T2WI, with TR/TE = 4107 ms/88.2 ms, slice thickness/gap = 5 mm/1.5 mm, a FOV of 230 × 200 mm2, and a matrix of 288 × 192; (3) axial T2- FLAIR sequence, with TR/TE = 7500 ms/96.66 ms, slice thickness/gap = 5 mm/1.5 mm, a FOV of 230 × 190 mm2, and a matrix of 288 × 192; (4) axial DWI based on SSEPI sequence, with TR/TE = 2800 ms/75.4 ms, slice thickness/gap = 5 mm/1.5 mm, a FOV of 230 × 220 mm2, b values of 0 and 1000 s/mm2, and a matrix of 128 × 128.
Segmentation of Infarction Lesions
Infarction lesions were manually segmented with ITK-SNAP (http://www.itk-snap.org). The 3D volume of interest (VOI) of each infarct lesion was delineated by slice-by-slice stacking of DWI images by two neuroradiologists (Y. S. and H. W.) with 6 and 12 years of experience, respectively. In case of disagreement, both neuroradiologists reached a consensus after an additional reading session.
The intra-observer and interobserver reproducibility of lesion segmentation were evaluated by determining the intraclass correlation coefficients (ICCs) of the extracted radiomic features in 30 randomly selected cases. Neuroradiologist S manually sketched the VOIs twice within 2 months, and intra-observer ICCs were evaluated for the extracted radiomics features. Neuroradiologist W sketched the VOIs once, and the extracted radiomics features were further used to assess interobserver ICCs. ICCs > 0.75 indicated good consistency, and radiologist S completed the remaining segmentation.
Feature Extraction
Using the noncommercial Analysis-Kit software (GE Healthcare, China), images from scanners 1 and 2 were normalized by z-score transformation to transform the data into a standard intensity range with mean and standard deviation of 0 and 1, respectively. Then, 402 features were extracted, including 42 histogram features, 11 Gy-level size zone matrix (GLSZM) parameters, 15 form factor indexes, 154 Gy-level co-occurrence matrix (GLCM) parameters, and 180 run length matrix (RLM) indexes.
Oversampling of the Minority Group
The synthetic minority oversampling technique (SMOTE) was utilized for minority sample generation from joint weighting of optimal features to address the adverse impact of the unbalanced training cohort [19]. Finally, the synthetic samples improved the unbalanced training cohort by offering values that were comparable to current cases instead of simple replications.
Feature Selection and Development of the Radiomics Nomogram
First, minimum redundancy and maximum (mRMR) correlation analysis was implemented for feature selection. Then, the least absolute shrinkage and selection operator algorithm (LASSO) was utilized for selecting optimal feature subsets based on ten-fold cross-validation. Features with nonzero coefficients were retained, and a radiomics signature was constructed using the training data set. Radiomics score calculation used a linear combination of select parameters weighted by the associated LASSO coefficients. The area under the receiver operating characteristic (ROC) curve (AUC) was determined for evaluating the predictive performance of the radiomics signature in both the training and validation cohorts.
Discriminative features between the two groups were selected by univariate logistic regression analysis (p < 0.05); then, a clinical model was constructed with these discriminative features by multivariate logistic regression, using backward stepwise selection. In the process of multivariate logistic regression, the likelihood ratio test with Akaike’s information criterion was utilized as the stopping rule. Collinearity was assessed via the variance inflation factor (VIF), and features with VIF values > 10 were excluded. Finally, the clinical model and radiomics score were combined to establish a radiomics nomogram.
Radiomics Nomogram Validation
ROC analysis was carried out for evaluating the nomogram’s performance in the training and validation cohorts. A calibration curve was implemented to assess the calibration of the radiomics nomogram. Finally, the net benefit (difference between the true-positive and weighted false-positive rates) for multiple threshold probabilities obtained by decision curve analysis (DCA) was utilized for assessing the radiomics nomogram for its clinical value in the validation cohort. In the decision curve, the net benefit was plotted against the threshold probability.
Statistical Analysis
R v3.5.1 (http://www.Rproject.org) was employed for data analysis. For the comparison of clinical features, the chi-square or Fisher’s exact test was applied. The Wilcoxon test was carried out for between-group comparisons of radiomics scores. The mRMR algorithm in the “mRMRe” package was used to filter the radiomic features with high relevance and no redundancy. LASSO logistic regression in the “Glmnet” package was carried out to select the most optimal feature subsets and construct the radiomics model. ROC curves were plotted by using the “pROC” package. DCA curve generation utilized the “dca.R” package. Calibration curves were plotted with the “ModeGood” package. The Hosmer–Lemeshow test was used for assessing nomogram calibration. The Delong test was carried out for assessing differences in AUCs in various models. All tests with p < 0.05 were deemed statistically significant.
Results
Clinicodemographic Features
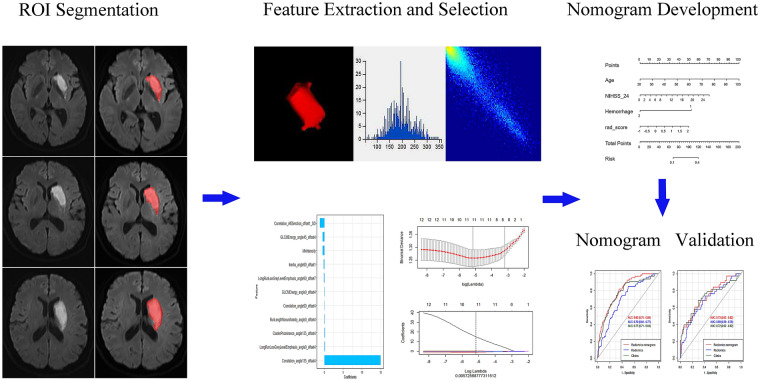
Figure 1 depicts the study flowchart. The baseline data of the enrolled cases in both training and validation cohorts are summarized in Table 1. We also investigated the differences in baseline features between the good and poor functional outcome groups in both training and validation cohorts. Marked differences were found in age, infarct volume, NIHSSbaseline, NIHSS24h, and hemorrhage (all p < 0.05).
Fig. 1.
Pipeline of radiomics analysis of ischemic stroke on diffusion-weighted imaging
Table 1.
Patient features in the training and validation cohorts
| Variable | Training cohort | Validation cohort | ||||||||
|---|---|---|---|---|---|---|---|---|---|---|
| Sample | mRSa ≤ 2 | mRS > 2 | Statistics | p value | Sample | mRS ≤ 2 | mRS > 2 | Statistics | p value | |
| Sex | ||||||||||
| Male | 255 | 223 (66.97%) | 32 (48.48%) | 8.158 | 0.004 | 139 | 117 (72.67%) | 22 (57.89%) | 3.187 | 0.074 |
| Female | 144 | 110 (33.03%) | 34 (51.52%) | 60 | 44 (27.33%) | 16 (42.11%) | ||||
| Age | 399 | 67.00 (59.00, 75.00) | −4.941 | < 0.001 | 199 | 65.00 (55.00, 73.30) | 75.50 (63.90, 84.05) | −3.481 | < 0.001 | |
| Volume | 399 | 248.00 (108.00, 886.90) | 651.50 (247.00, 3879.60) | −4.569 | < 0.001 | 199 | 1088.22 (322.74, 4928.78) | 7588.60 (975.06, 25,636.15) | −4.008 | < 0.001 |
| NIHSSbaseline | ||||||||||
| 399 | 2.74 ± 2.500 | 4.04 ± 0.309 | 3.662 | < 0.001 | 199 | 3.093 ± 2.353 | 4.034 ± 3.450 | 2.011 | 0.046 | |
| NIHSS24h | ||||||||||
| 399 | 2.97 ± 3.014 | 5.72 ± 5.619 | 5.914 | < 0.001 | 199 | 3.298 ± 2.605 | 5.474 ± 4.898 | 3.812 | < 0.001 | |
| Hypertension | ||||||||||
| Yes | 248 | 201 (60.36%) | 47 (71.21%) | 2.758 | 0.097 | 125 | 96 (59.63%) | 29 (76.32%) | 3.666 | 0.056 |
| No | 151 | 132 (39.64%) | 19 (28.79%) | 74 | 65 (40.37%) | 9 (23.68%) | ||||
| Diabetes | ||||||||||
| Yes | 107 | 85 (25.53%) | 22 (33.33%) | 1.711 | 0.191 | 48 | 35 (21.74%) | 13 (34.21%) | 2.613 | 0.106 |
| No | 292 | 248 (74.47%) | 44 (66.67%) | 151 | 126 (78.26%) | 25 (65.79%) | ||||
| Hemorrhage | ||||||||||
| Yes | 6 | 2 (0.60%) | 4 (6.06%) | 0.094 | 0.008 | 4 | 1 (0.62%) | 3 (7.89%) | 0.073 | 0.023 |
| No | 393 | 331 (99.40%) | 62 (93.94%) | 195 | 160 (99.38%) | 35 (92.11%) | ||||
amRS modified Rankin scale
Logistic Regression Findings
Variables including age, sex, infarct volume, NIHSSbaseline, NIHSS24h, and hemorrhage presented significant differences (p < 0.05) in univariate logistic regression analysis (Table 2). In multivariate logistic regression, variables such as age, NIHSS24h, hemorrhage, and radiomics score showed significant differences.
Table 2.
Univariate and multivariate regression findings
| Variable | Univariate logistic regression | Multivariate logistic regression | ||
|---|---|---|---|---|
| OR (95% CI) | p | OR (95% CI) | p | |
| Age | 1.05 (1.02–1.08) | < 0.001 | 1.05 (1.02–1.08) | < 0.001 |
| Sex | 2.08 (1.22–3.54) | 0.007 | – | – |
| Infarct volume | 1.01 (1.005–1.018) | 0.0004 | – | – |
| NIHSSbaseline | 1.16 (1.06–1.27) | 0.001 | – | – |
| NIHSS24h | 1.18 (1.1–1.27) | < 0.001 | 0.15 (0.23–0.82) | 0.03 |
| Hemorrhage | 0.14 (0.28–0.67) | 0.012 | 3.66 (2.34–6.36) | < 0.001 |
CI confidence interval
Performance of the Radiomics Signature in Predicting Clinical Functional Outcomes in Ischemic Stroke
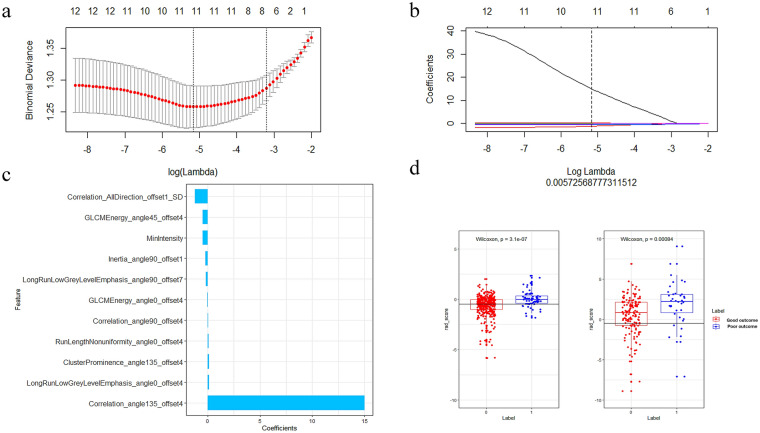
Infarct volume showed average performance with an AUC of 0.678 in distinguishing good and poor clinical functional outcomes in ischemic stroke (Fig. 2). Eleven radiomics parameters (supplementary material lists the implication of the 11 radiomics features) showing nonzero coefficients were finally obtained in the training cohort (Fig. 3a–c). Figure 3d shows the comparisons of radiomics scores between these two groups in both training and validation sets. Patients with poor outcome generally had higher radiomics scores than those with good outcomes. The Wilcoxon test showed that radiomics scores differed significantly between the good and poor outcome groups [−0.65 (−1.25, −0.03) vs. 0.10 (−0.42, 0.52); p < 0.005] in the validation set. The novel radiomics signature also performed well in distinguishing good and poor clinical functional outcomes with an AUC of 0.69 (0.59–0.78) in the validation set.
Fig. 2.
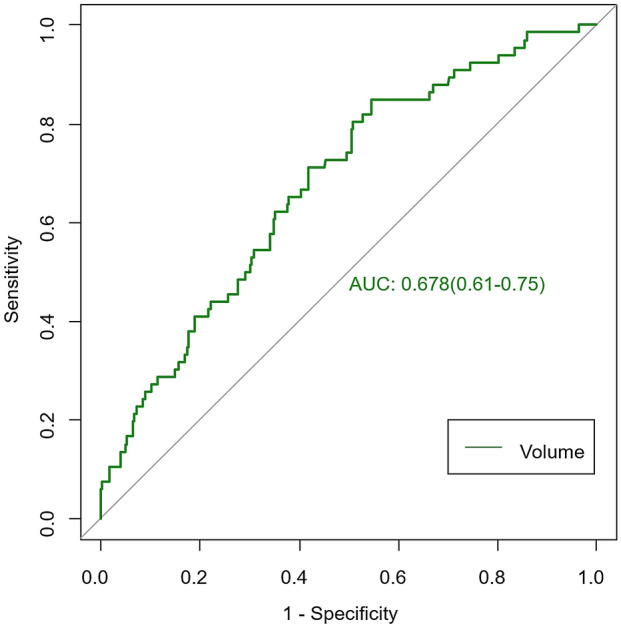
Performance of infarct volume in predicting clinical functional outcomes of ischemic stroke
Fig. 3.
Selection of radiomics features using LASSO logistic regression and the predictive accuracy of the radiomics signature. a Selection of the tuning parameter (λ) in the LASSO model via tenfold cross-validation based on minimum criteria. b The coefficients have been plotted vs. log(λ). c The final retained features with nonzero coefficients. d Radiomics score distribution in the training and validation cohorts; the optimum cutoff value was −0.41
Clinical Predictive Model and Radiomics Nomogram Building
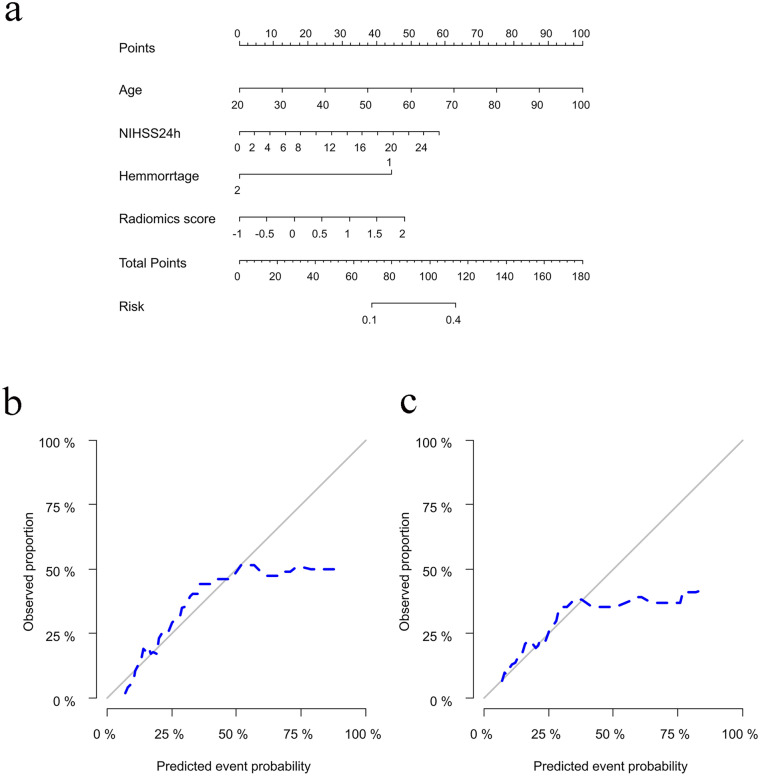
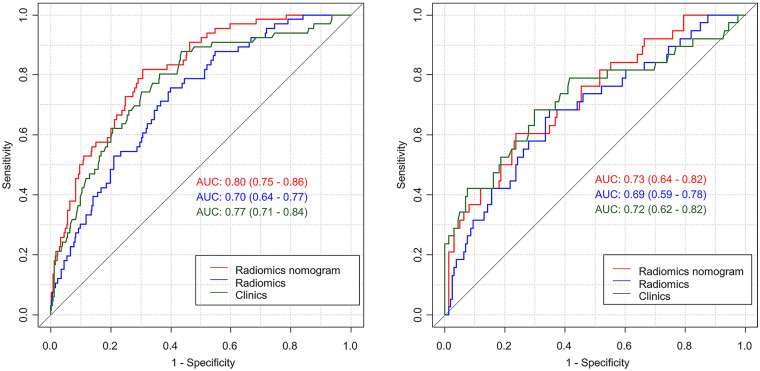
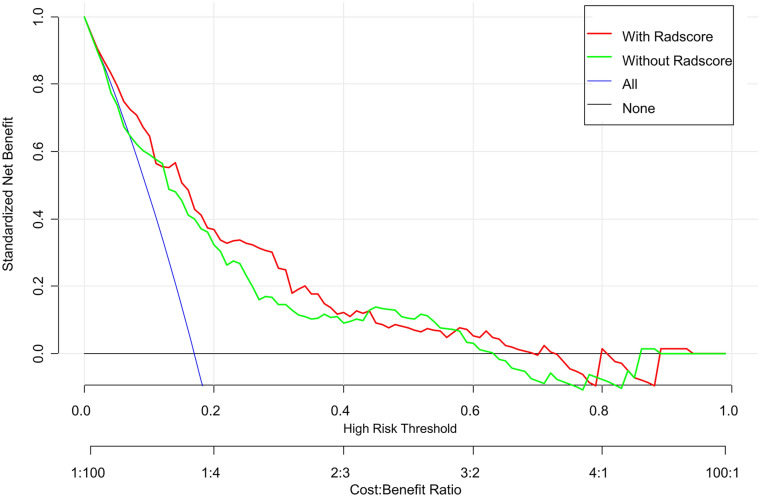
According to the above multivariate logistic regression results, a clinical model was constructed. The radiomics signature and clinical characteristics were independent risk factors for clinical functional outcome. The radiomics signature and patient characteristics, including age, hemorrhage, and NIHSS24h, were utilized for radiomics nomogram construction (Fig. 4a). Figure 4b and c shows calibration curves for the nomogram in the training and validation sets, respectively. A nonsignificant Hosmer–Lemeshow test (p = 0.55) indicated favorable calibration in the training data set. ROC analysis showed that the nomogram performed well in distinctly predicting good and poor clinical functional outcomes [Fig. 5a; AUC = 0.80, 95% confidence interval (CI) 0.75–0.86]. The good calibration and discrimination properties of the radiomics nomogram were confirmed in the validation cohort, also with a nonsignificant Hosmer–Lemeshow test (Fig. 4c; p = 0.21) and an AUC of 0.73 (Fig. 5b; 0.73, 95% CI 0.63–0.82). Table 3 lists the accuracies, sensitivities, specificities, and positive (PPV) and negative (NPV) predictive values of the radiomics signature, clinical model, and radiomics nomogram. The combined model showed a higher prediction value than the radiomics signature and clinical model. The DCA for the radiomics nomogram is shown in Fig. 6. This shows that the radiomics nomogram is superior to the clinical model regarding “treat all” vs. “treat one” strategies when the threshold probability is within the 0.05–0.65 range.
Fig. 4.
Radiomics nomogram for predicting the clinical functional outcome of ischemic stroke. a Calibration curve of the nomogram b training cohort, c validation cohort
Fig. 5.
Receiver operating characteristic curves based on the clinical characteristics, radiomics signature, or radiomics nomogram
Table 3.
Performance of the predicative model
| Cohort | Accuracy (95% CI) | Sensitivity | Specificity | Pos. pred. valuea | Neg. pred. valueb | |
|---|---|---|---|---|---|---|
| Radiomics signature | Training | 0.63 (0.58–0.67) | 0.30 | 0.95 | 0.84 | 0.61 |
| Testing | 0.74 (0.68–0.80) | 0.42 | 0.90 | 0.61 | 0.80 | |
| Clinical model | Training | 0.68 (0.64–0.73) | 0.32 | 0.94 | 0.78 | 0.67 |
| Testing | 0.68 (0.61–0.75) | 0.33 | 0.90 | 0.66 | 0.69 | |
| Radiomics nomogram | Training | 0.65 (0.60–0.70) | 0.60 | 0.78 | 0.93 | 0.68 |
| Testing | 0.76 (0.70–0.82) | 0.78 | 0.61 | 0.89 | 0.79 |
aPositive predictive value
bNegative predictive value
Fig. 6.
Decision curve analysis for the radiomics nomogram
Discussion
Following ischemic stroke, patients show multiple neurological complications and physical symptoms. Effective and prompt diagnosis would help not only in the subacute management of ischemic stroke but also in prognostic evaluation. This study demonstrated that the novel radiomics nomogram including the radiomics signature and patient features had good performance in predicting clinical functional outcome in ischemic stroke patients. These results are promising for a noninvasive method for assessing the prognosis of ischemic stroke individuals. This is one of the few radiomics-based studies focusing on clinical functional outcome in ischemic stroke cases. In addition, the sample size was moderate, and 598 ischemic stroke patients were included in the final study, with 399 and 199 patients in the training and validation cohorts, respectively. Furthermore, we used data from the first MRI scanner (1.5 T, GE Healthcare) to train the predictive model and data from another MRI scanner in the same stroke center (3.0 T, United Imaging Healthcare) to validate the predictive model’s performance. Therefore, the reproducibility and applicability of this study indicate the feasibility of DWI-based radiomics in predicting the clinical functional prognosis of ischemic stroke patients.
Changes in ADC derived from DWI related to functional outcome in ischemic stroke have been reported in several studies [20, 21]. Pereira et al. reported that the ADC value was negatively correlated with the mRS score in basilar artery occlusion [22]. A measurement of the freedom of water diffusion, ADC is decreased in cerebral ischemia due to the shift in water from external to internal compartments of the cell [23]. Furthermore, Budde et al. proposed that focal enlargement and constriction in axons/dendrites result in markedly reduced ADC [24]. However, the precise pathological mechanism of ADC alterations remains unclear. Moreover, a study showed that core infarct volume is correlated with clinical functional outcome [25]. We also investigated the predictive performance of infarct volume but obtained moderate performance, with an AUC of 0.678. In a recent study using MRI fluid-attenuated inversion recovery (FLAIR) vascular hyperintensity (FVH) in predicting clinical outcome, the good functional outcome group had a higher FVH [26]. In another study that explored resting-state functional connectivity MRI and outcome after acute stroke, patients with good outcome had greater functional connectivity than patients with poor outcome [27]. The two studies evaluated the performance in predicting clinical functional outcome using new methods. However, the two small sample studies only included 37 cases; our study showed higher diagnostic efficiency including 598 participants.
Radiomics transforms medical images into quantitative indexes through high-throughput extraction by data-assessment algorithms for predicting important clinical outcomes [13, 28]. However, there are few published reports applying radiomics to explore the functional outcomes of ischemic stroke cases, leaving a gap in knowledge. A previous study reported that DWI could identify lesions with a probability of 90% within the first 3 h of symptom onset [29]. Therefore, VOIs were delineated on DWI images in this study. The current work revealed that DWI–based radiomics had AUCs of 0.70 and 0.69 in the training and validation cohorts, respectively.
It is difficult to estimate clinical outcomes only by considering the radiomics features of the lesions. Multiple factors could be correlated with clinical prognosis besides the characteristics of the lesion itself. Macciocchi et al. assessed ischemic stroke systematically over 3 months, and concluded that characteristics such as age, prior stroke, initial neurological deficit, and lesion location are highly correlated with functional outcome [30]. Additionally, a recent study demonstrated that enhanced genetic imbalance after ischemic stroke is correlated with worse functional outcomes [31]. The current results were consistent with these previous studies, demonstrating that radiomics score, hemorrhage, age, and NIHSS24h were independent indicators of clinical outcome in ischemic stroke patients. Combining these independent risk factors, a novel radiomics nomogram was generated, as shown above. The developed nomogram had good predictive value, with AUCs of 0.80 and 0.73 in the training and validation sets, respectively.
There were several limitations in this study. First, potential selection bias was inevitable in this retrospective analysis. Secondly, the enrolled patients came from a single stroke center. Nevertheless, data from one scanner were utilized to train the predictive model, and another scanner provided data for model validation, reducing overfitting of the predictive model. Thirdly, we did not consider infarct location (anterior and posterior circulation, lacunar, cortical, and massive cerebral) or size. However, the infarct volume was evaluated in this study, which showed average performance. Fourthly, we found that the radiomics signature and clinical variables had high specificity and low sensitivity, which may be attributed to the fact that most patients had good functional outcome (mRS ≤ 2, 494/598, 82.6%). However, the radiomics nomogram showed better performance. These encouraging results warrant further multicenter trials applying noninvasive imaging features for predicting clinical functional outcomes in ischemic stroke.
Conclusions
In conclusion, this study provides new insights into prognosis prediction in ischemic stroke. The above results indicate that a radiomics nomogram incorporating the radiomics signature and clinical characteristics can accurately predict clinical functional outcomes in ischemic stroke patients.
Supplementary Information
Below is the link to the electronic supplementary material.
Acknowledgements
We thank all members of the Department of Radiology and Neurology for helpful discussions and invaluable help in manuscript preparation.
Funding
This study was funded by National Natural Science Foundation of China (81973157). The journal’s Rapid Service Fee was funded by the authors.
Authorship
All named authors meet the International Committee of Medical Journal Editors (ICMJE) criteria for authorship for this article, take responsibility for the integrity of the work as a whole, and have given their approval for this version to be published.
Authors' Contributions
WH performed the manuscript writing. Yaq G performed the statistical analysis. YS and Jix L acquired the data. WH, YaqG and PuyW contributed to data analysis and interpretation. BS and JZ contributed to the experimental design and manuscript revision, and handled funding and supervision. BS and JZ were the co-corresponding authors.
Disclosures
Hao Wang, Yi Sun, Yaqiong Ge, Pu-Yeh Wu, Jixian Lin, Jing Zhao and Bin Song have nothing to disclose. Yaqiong Ge and Pu-Yeh Wu are employees of GE Healthcare. They support us to do some statistics work and build predicting model. We declare we have no financial involvement of GE Healthcare.
Compliance with Ethics Guidelines
The current diagnostic study had approval from the Institutional Ethics Committee of Minhang Hospital, Fudan University (approval number: 2021-008-01K). Each patient provided written informed consent before MRI examinations. The study was performed in accordance with the 1964 Declaration of Helsinki and its later amendments.
Data Availability
The data and materials are available upon request.
Footnotes
Hao Wang and Yi Sun contributed equally to this work and share first authorship. Corresponding author: Jing Zhao & Bin Song.
Contributor Information
Jing Zhao, Email: zhao_jing@fudan.edu.cn.
Bin Song, Email: songbin@fudan.edu.cn.
References
- 1.Meschia JF, Brott T. Ischaemic stroke. Eur J Neurol. 2018;25:35–40. doi: 10.1111/ene.13409. [DOI] [PubMed] [Google Scholar]
- 2.Feigin VL, Krishnamurthi RV, Parmar P, et al. Update on the global burden of ischemic and hemorrhagic stroke in 1990–2013: the GBD 2013 study. Neuroepidemiology. 2015;45:161–176. doi: 10.1159/000441085. [DOI] [PMC free article] [PubMed] [Google Scholar]
- 3.Collaborators GBDS. Global, regional, and national burden of stroke, 1990–2016: a systematic analysis for the Global Burden of Disease Study 2016. Lancet Neurol. 2019;18:439–458. doi: 10.1016/S1474-4422(19)30034-1. [DOI] [PMC free article] [PubMed] [Google Scholar]
- 4.Cao J, Eshak ES, Liu K, Gero K, Liu Z, Yu C. Age-period-cohort analysis of stroke mortality attributable to high sodium intake in China and Japan. Stroke. 2019;50:1648–1654. doi: 10.1161/STROKEAHA.118.024617. [DOI] [PMC free article] [PubMed] [Google Scholar]
- 5.Kumar A, Nambiar V, Gireesh Kumar K, Sreekrishnan T, Ajith V, Mohan N. Stroke progression. Univ J Med Sci. 2015;3:60–64. doi: 10.13189/ujmsj.2015.030302. [DOI] [Google Scholar]
- 6.Tan R, Koo XY, Kaur P, et al. microRNAs in stroke pathogenesis. Curr Mol Med. 2011;11:76–92. doi: 10.2174/156652411794859232. [DOI] [PubMed] [Google Scholar]
- 7.Lakhan SE, Kirchgessner A, Hofer M. Inflammatory mechanisms in ischemic stroke: therapeutic approaches. J Transl Med. 2009;7:97. doi: 10.1186/1479-5876-7-97. [DOI] [PMC free article] [PubMed] [Google Scholar]
- 8.Cui H, Wang X, Bian Y, Song S, Feng DD. Ischemic stroke clinical outcome prediction based on image signature selection from multimodality data. Conf Proc IEEE Eng Med Biol Soc. 2018;2018:722–725. doi: 10.1109/EMBC.2018.8512291. [DOI] [PubMed] [Google Scholar]
- 9.Groeschel S, Hagberg GE, Schultz T, et al. Assessing white matter microstructure in brain regions with different myelin architecture using MRI. PLoS ONE. 2016;11:e0167274. doi: 10.1371/journal.pone.0167274. [DOI] [PMC free article] [PubMed] [Google Scholar]
- 10.Sugahara T, Korogi Y, Kochi M, et al. Usefulness of diffusion-weighted MRI with echo-planar technique in the evaluation of cellularity in gliomas. J Magn Reson Imaging. 1999;9:53–60. doi: 10.1002/(SICI)1522-2586(199901)9:1<53::AID-JMRI7>3.0.CO;2-2. [DOI] [PubMed] [Google Scholar]
- 11.Liu C, Zhang S, Yao Y, et al. Associations between diffusion dynamics and functional outcome in acute and early subacute ischemic stroke. Clin Neuroradiol. 2019;30:517–524. doi: 10.1007/s00062-019-00812-1. [DOI] [PubMed] [Google Scholar]
- 12.Feng R, Badgeley M, Mocco J, Oermann EK. Deep learning guided stroke management: a review of clinical applications. J Neurointerv Surg. 2018;10:358–362. doi: 10.1136/neurintsurg-2017-013355. [DOI] [PubMed] [Google Scholar]
- 13.Wang H, Song B, Ye N, et al. Machine learning-based multiparametric MRI radiomics for predicting the aggressiveness of papillary thyroid carcinoma. Eur J Radiol. 2020;122:108755. doi: 10.1016/j.ejrad.2019.108755. [DOI] [PubMed] [Google Scholar]
- 14.Zhou M, Scott J, Chaudhury B, et al. Radiomics in brain tumor: image assessment, quantitative feature descriptors, and machine-learning approaches. AJNR Am J Neuroradiol. 2018;39:208–216. doi: 10.3174/ajnr.A5391. [DOI] [PMC free article] [PubMed] [Google Scholar]
- 15.Pinker K, Chin J, Melsaether AN, Morris EA, Moy L. Precision medicine and radiogenomics in breast cancer: new approaches toward diagnosis and treatment. Radiology. 2018;287:732–747. doi: 10.1148/radiol.2018172171. [DOI] [PubMed] [Google Scholar]
- 16.Tang TY, Jiao Y, Cui Y, et al. Penumbra-based radiomics signature as prognostic biomarkers for thrombolysis of acute ischemic stroke patients: a multicenter cohort study. J Neurol. 2020;267:1454–1463. doi: 10.1007/s00415-020-09713-7. [DOI] [PubMed] [Google Scholar]
- 17.Ducroquet A, Leys D, Al Saabi A, et al. Influence of chronic ethanol consumption on the neurological severity in patients with acute cerebral ischemia. Stroke. 2013;44:2324–2326. doi: 10.1161/STROKEAHA.113.001355. [DOI] [PubMed] [Google Scholar]
- 18.Powers WJ, Rabinstein AA, Ackerson T, et al. 2018 Guidelines for the early management of patients with acute ischemic stroke: a guideline for healthcare professionals from the American Heart Association/American Stroke Association. Stroke. 2018;49:e46–e110. doi: 10.1161/STR.0000000000000158. [DOI] [PubMed] [Google Scholar]
- 19.Nakamura M, Kajiwara Y, Otsuka A, Kimura H. LVQ-SMOTE: learning vector quantization based synthetic minority over-sampling technique for biomedical data. BioData Min. 2013;6:16. doi: 10.1186/1756-0381-6-16. [DOI] [PMC free article] [PubMed] [Google Scholar]
- 20.Tong D, Yenari M, Albers G, Obrien M, Marks M, Moseley M. Correlation of perfusion-and diffusion-weighted MRI with NIHSS score in acute (< 6.5 hour) ischemic stroke. Neurology. 1998;50:864–869. doi: 10.1212/WNL.50.4.864. [DOI] [PubMed] [Google Scholar]
- 21.Ortiz GA, Sacco RL. National Institutes of Health Stroke Scale (NIHSS). Wiley StatsRef: Statistics Reference Online. 2014. 10.1002/9781118445112.stat06823.
- 22.Pereira D, Fragata I, Amorim J, Reis J. ADC quantification in basilar artery occlusion as an indicator of clinical outcome after endovascular treatment. Neuroradiol J. 2017;30:586–592. doi: 10.1177/1971400917706197. [DOI] [PMC free article] [PubMed] [Google Scholar]
- 23.Alegiani AC, MacLean S, Braass H, et al. Dynamics of water diffusion changes in different tissue compartments from acute to chronic stroke: a serial diffusion tensor imaging study. Front Neurol. 2019 doi: 10.3389/fneur.2019.00158. [DOI] [PMC free article] [PubMed] [Google Scholar]
- 24.Budde MD, Frank JA. Neurite beading is sufficient to decrease the apparent diffusion coefficient after ischemic stroke. Proc Natl Acad Sci. 2010;107:14472–14477. doi: 10.1073/pnas.1004841107. [DOI] [PMC free article] [PubMed] [Google Scholar]
- 25.Shi F, Gong X, Liu C, et al. Acute stroke: prognostic value of quantitative collateral assessment at perfusion CT. Radiology. 2019;290:760–768. doi: 10.1148/radiol.2019181510. [DOI] [PubMed] [Google Scholar]
- 26.Jiang L, Chen YC, Zhang H, et al. FLAIR vascular hyperintensity in acute stroke is associated with collateralization and functional outcome. Eur Radiol. 2019;29:4879–4888. doi: 10.1007/s00330-019-06022-0. [DOI] [PubMed] [Google Scholar]
- 27.Puig J, Blasco G, Alberich-Bayarri A, et al. Resting-state functional connectivity magnetic resonance imaging and outcome after acute stroke. Stroke. 2018;49:2353–2360. doi: 10.1161/STROKEAHA.118.021319. [DOI] [PMC free article] [PubMed] [Google Scholar]
- 28.Ren J, Tian J, Yuan Y, et al. Magnetic resonance imaging based radiomics signature for the preoperative discrimination of stage I–II and III–IV head and neck squamous cell carcinoma. Eur J Radiol. 2018;106:1–6. doi: 10.1016/j.ejrad.2018.07.002. [DOI] [PubMed] [Google Scholar]
- 29.Huisa BN, Liebeskind DS, Raman R, et al. Diffusion-weighted imaging-fluid attenuated inversion recovery mismatch in nocturnal stroke patients with unknown time of onset. J Stroke Cerebrovasc Dis. 2013;22:972–977. doi: 10.1016/j.jstrokecerebrovasdis.2012.01.004. [DOI] [PMC free article] [PubMed] [Google Scholar]
- 30.Macciocchi SN, Diamond PT, Alves WM, Mertz T. Ischemic stroke: relation of age, lesion location, and initial neurologic deficit to functional outcome. Arch Phys Med Rehabil. 1998;79:1255–1257. doi: 10.1016/S0003-9993(98)90271-4. [DOI] [PubMed] [Google Scholar]
- 31.Pfeiffer D, Chen B, Schlicht K, et al. Genetic imbalance is associated with functional outcome after ischemic stroke. Stroke. 2019;50:298–304. doi: 10.1161/STROKEAHA.118.021856. [DOI] [PMC free article] [PubMed] [Google Scholar]
Associated Data
This section collects any data citations, data availability statements, or supplementary materials included in this article.
Supplementary Materials
Data Availability Statement
The data and materials are available upon request.


