Dear Editor,
The evaluation of tumor differentiation is an urgent clinical issue that would facilitate the establishment of individualized therapeutic strategies. 1 , 2 , 3 Our team developed a deep learning radiomics model based on computed tomography (CT) data for preoperative evaluation of hepatocellular carcinoma (HCC) differentiation (low vs. high grade) and preliminarily explored the biological basis of the radiomics model.
We included 1047 patients from the First Affiliated Hospital, College of Medicine, Zhejiang University (Institution 1) and 187 patients from the Ningbo Medical Center Lihuili Hospital (Institution 2). Data from Institution 1 were divided into training and internal validation cohorts by stratified sampling at a 3:1 ratio, while data from Institution 2 constituted the independent test cohort (Figure S1). Patient characteristics are shown in Table 1; there were no significant differences in the distribution of clinical characteristics among the three cohorts.
TABLE 1.
Patient characteristics of three cohorts
| Characteristics | Training cohort | Internal validation cohort | p value (training vs. validation) | Independent test cohort | p value (training vs. test) |
|---|---|---|---|---|---|
| Age (year) | 56.56 ± 11.47 | 56.79 ± 10.62 | 0.4726 | 60.32 ± 38.30 | 0.0867 |
| Sex | 0.6997 | 0.6296 | |||
| Female | 125 | 42 | 26 | ||
| Male | 674 | 206 | 161 | ||
| Maximum tumor diameter (cm) | 4.73 ± 2.92 | 4.78 ± 2.82 | 0.2342 | 4.59 ± 3.12 | 0.1150 |
| Multiple tumors | 0.1575 | 0.4914 | |||
| No | 678 | 220 | 163 | ||
| Yes | 121 | 28 | 24 | ||
| Serum AFP level | 0.9889 | 0.3647 | |||
| Normal | 227 | 71 | 60 | ||
| Abnormal | 572 | 177 | 127 | ||
| Clinical stage | 0.9275 | 0.6359 | |||
| I/II | 692 | 216 | 165 | ||
| III/IV | 107 | 32 | 22 | ||
| Hepatitis B | 0.2578 | 0.7733 | |||
| Yes | 116 | 44 | 25 | ||
| No | 683 | 204 | 162 | ||
| Cirrhosis | 0.3310 | 0.0005 | |||
| Yes | 349 | 99 | 55 | ||
| No | 450 | 149 | 132 | ||
| Symptoms | 0.8340 | 0.0037 | |||
| Yes | 597 | 183 | 159 | ||
| No | 202 | 65 | 28 |
Abbreviation: AFP, alpha‐fetoprotein.
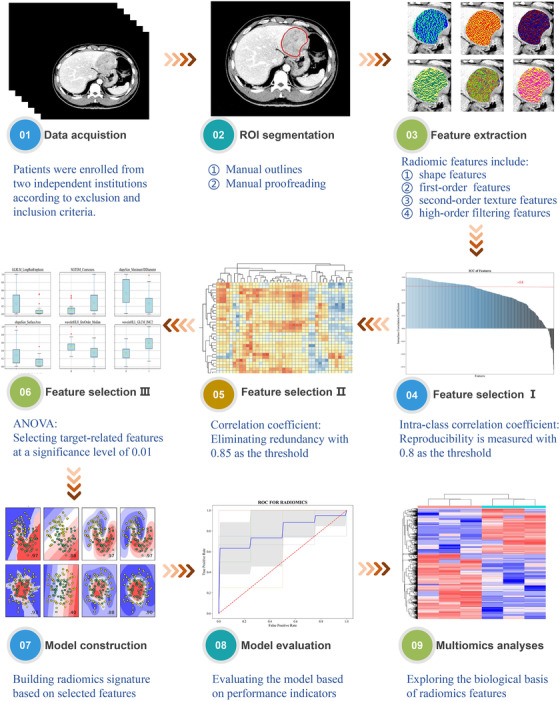
The radiomics pipeline (Figure 1) mainly involved data acquisition from CT images (Method S1), segmentation of regions of interest, feature extraction (Table S1) and selection, model construction and evaluation and multiomics analysis (Method S2). In total, 707 radiomics features were extracted from CT image data; 614 were filtered out because of low reproducibility or high redundancy, and 25 features with a significant impact on the target were ultimately selected (Table S2). A radiomics signature was established using the random forest (RF) method (Table S3, Figure S2). The AUCs in the training, internal validation and external test cohorts were 0.82, 0.76 and 0.75, respectively (Figure S3). Violin plots of selected features are shown in Figure 4A. The accuracy of the radiomics signature in the training, validation and test cohorts were 0.75, 0.72, and 0.66, respectively; the sensitivity was 0.76, 0.70, and 0.74, respectively; and the specificity was 0.72, 0.75, and 0.54, respectively.
FIGURE 1.

Radiomics module pipeline
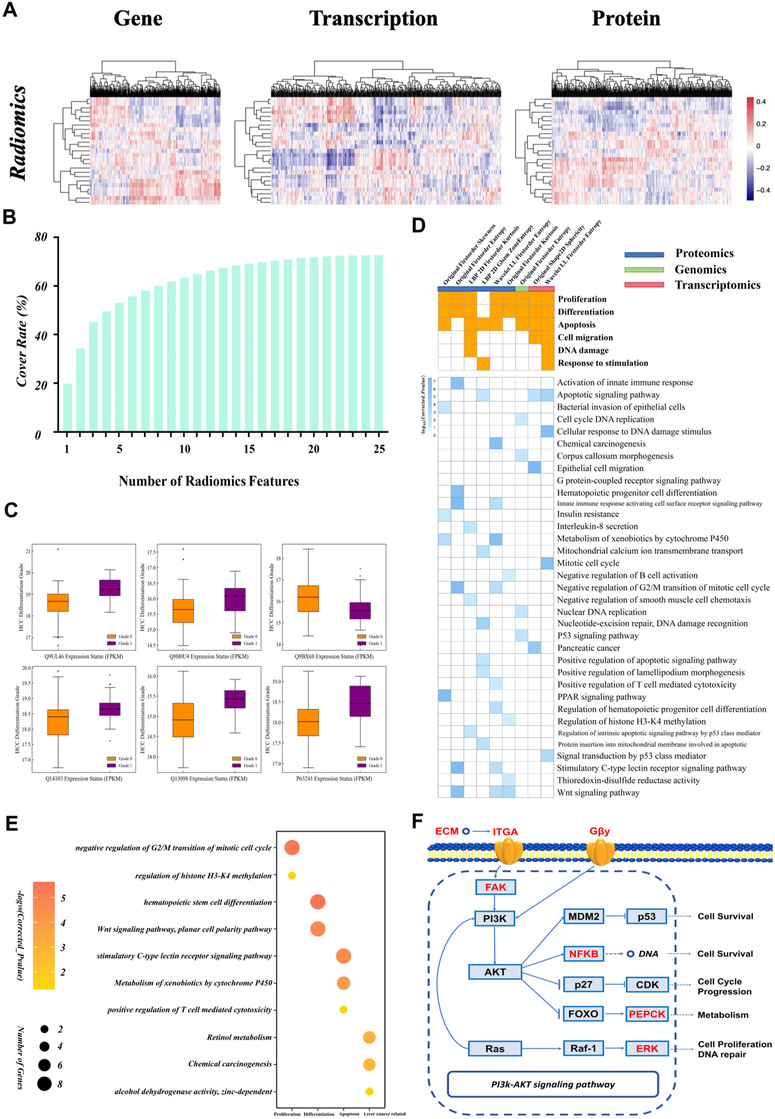
FIGURE 4.

Results of the multiomics analysis. (A) Heat map of correlations between radiomics features and multiomics (genomics, transcriptomics and proteomics) variables. (B) Histogram of the relationship between the number of radiomics features and coverage of biological variables identified from multiomics analyses. (C) Box plots of specific proteins related to selected radiomics features showing significant differences in expression between high‐ and low‐grade groups. (D) Matrices of cancer‐related biological processes covered by radiomics features at specific ‐omics levels (upper); and details of GO terms and pathways (lower). (E) Bubble chart of 10 important GO terms and pathways correlated with wavelet_LL_firstorder_entropy used to establish the radiomics signature. The biological process of each GO term or pathway is shown on the x‐axis. (F) Key genes (red) in the phosphatidylinositol 3‐kinase (PI3K)/protein kinase B (AKT) signaling pathway were reconstructed with original_shape2D_sphericity, which was used to establish the radiomics signature
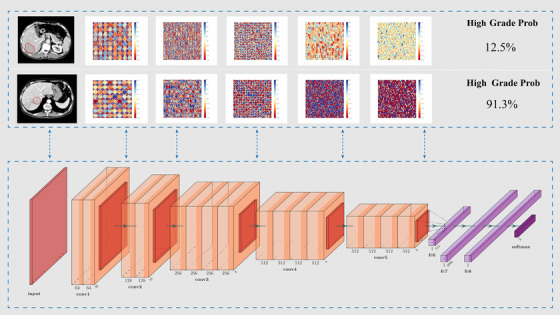
The deep learning model in this study was modified from VGG19 4 (Table S4). A illustration of deep learning model structure is shown in Figure 2. The AUCs of the deep learning model in the training, internal validation and test cohorts were 0.85, 0.81, and 0.75, respectively (Figure S4). The model had an accuracy of 0.77, 0.75, and 0.66, respectively; sensitivity of 0.76, 0.81, and 0.62, respectively; and specificity of 0.66, 0.66, and 0.72, respectively in the three cohorts. In the comparison of the deep learning model with the radiomics signature, p values from the DeLong test 5 were 0.09, 0.17, and 0.62 in the training, validation, and test cohorts, respectively. There were no significant differences between the deep learning model and radiomics signature, although the former had a slightly higher AUC. To see how much value radiomics or deep learning can bring to some risk factors about tumor morphology and size, the features (original_shape2D_Sphericity, original_shape2D_Elongation, original_shape2D_MajorAxisLength) were used to construct a morphological model (Figure S5).
FIGURE 2.

Schematic of deep learning architecture and illustrations of middle layer output splicing of moderately differentiated (upper) and poorly differentiated (lower) cases
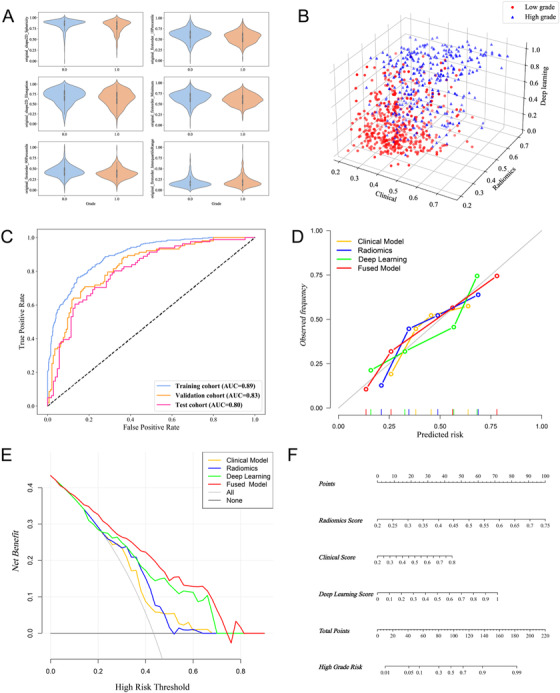
Predictions based on clinical characteristics were determined from the clinical model established from RF of clinical characteristics. After visualizing the predicted probabilities of the clinical model, radiomics signature, and deep learning model, we found that the three predictors showed good discriminatory power for groups with different pathologic grades (Figure 3B). The performance of the clinical model is unsatisfactory (Figure S6). Next, the clinical model, radiomics signature, and deep learning model served as the base models for inputting predicted probabilities into the logistic regression model for multi‐model predictions fusion. ROC curves of the fused model applied to the three cohorts are shown in Figure 3C. The results of the DeLong test showed that AUCs of the fused model were significantly improved over those of the base models.
FIGURE 3.

Construction and evaluation of the deep learning radiomics model for preoperative hepatocellular carcinoma (HCC) pathological grading. (A) Violin plots of six selected radiomics features, including ‘original_shape2D_Sphericity’, ‘original_firstorder_10Percentile’, ‘original_shape2D_Elongation’,‘original_firstorder_Minimum’,‘original_glcm_Correlation’ and ‘original_glcm_DifferenceEntropy’. (B) 3D scatterplot of predicted probabilities for the clinical model, radiomics signature, deep learning model and fused model. (C) ROCs and AUCs of the deep learning radiomics model in the three cohorts. (D) Calibration curves of the different models. (E) Decision curves of the different models. (F) Nomogram for preoperative prediction of HCC pathologic grade
Quantitative indices in the comparisons between the clinical model, radiomics signature, deep learning model, and fused model and the results of the DeLong test are summarized in Table 2. The fused model showed the best performance in the training, validation, and test cohorts, with an AUC of 0.89, 0.83, and 0.80, respectively; accuracy of 0.82, 0.77, and 0.73, respectively; sensitivity of 0.85, 0.81, and 0.71, respectively; specificity of 0.76, 0.71, and 0.75, respectively; PPV of 0.84, 0.80, and 0.79, respectively; NPV of 0.78, 0.73, and 0.66, respectively; and F1 score of 0.77, 0.72, and 0.71 respectively. The calibration curves showed that the fused model had better concordance between predicted and actual probabilities than the other models (Figure 3D). Comparison of the decision curves of the four models in the test set indicated that the fused model had greater clinical utility (Figure 3E), and the IDI indicated that the predicted probabilities of the fused model were significantly improved compared to those of the other models (Figure S7). A nomogram for preoperative prediction of HCC pathologic grade was established based on the fused model (Figure 3F).
TABLE 2.
Comparison of quantitative indices of the clinical model, radiomics signature, deep learning model and fused model applied to the three cohorts
| Training cohort | Internal validation cohort | Independent test cohort | ||||||||||
|---|---|---|---|---|---|---|---|---|---|---|---|---|
| Methods | CM | RS | DL | FM | CM | RS | DL | FM | CM | RS | DL | FM |
| AUC | 0.7044 | 0.8223 | 0.8510 | 0.8941 | 0.6264 | 0.7616 | 0.8073 | 0.8301 | 0.6626 | 0.7475 | 0.7513 | 0.8042 |
| ACC | 0.6383 | 0.7459 | 0.7735 | 0.8160 | 0.6264 | 0.7177 | 0.7500 | 0.7702 | 0.6150 | 0.6578 | 0.6631 | 0.7273 |
| SENS | 0.6157 | 0.7622 | 0.8535 | 0.8535 | 0.5724 | 0.6965 | 0.8137 | 0.8137 | 0.6698 | 0.7453 | 0.6226 | 0.7075 |
| SPEC | 0.6707 | 0.7225 | 0.6585 | 0.7622 | 0.5825 | 0.7476 | 0.6601 | 0.7087 | 0.5432 | 0.5432 | 0.7160 | 0.7531 |
| PPV | 0.7286 | 0.7978 | 0.7821 | 0.8375 | 0.6587 | 0.7953 | 0.7712 | 0.7973 | 0.6574 | 0.6810 | 0.7416 | 0.7895 |
| NPV | 0.5486 | 0.6790 | 0.7578 | 0.7837 | 0.4918 | 0.6363 | 0.7157 | 0.7300 | 0.5570 | 0.6197 | 0.5918 | 0.6630 |
| F1 score | 0.6036 | 0.7001 | 0.7047 | 0.7728 | 0.5333 | 0.6875 | 0.6868 | 0.7192 | 0.5499 | 0.5789 | 0.6480 | 0.7052 |
| Significance level of DeLong test for models compared with FM | ||||||||||||
| CM | RS | DL | |
|---|---|---|---|
| Training cohort | <0.0001 | <0.0001 | <0.0001 |
| Internal validation cohort | <0.0001 | 0.0035 | 0.1083 |
| Independent test cohort | 0.0005 | 0.0295 | 0.0132 |
Abbreviations: AUC, area under curve; ACC, accuracy; CM, clinical model; DL, deep learning model; FM, fused model; NPV, negative predictive value; PPV, positive predictive value; RS, radiomics signature; SENS: sensitivity; SPEC, specificity.
A total of 69 patients with CT data were included in the multiomics analysis. After data preprocessing, 19723 genomics, 42807 transcriptomics, and 3658 proteomics variables with differential expression between high‐ and low‐grade HCC (valid data > 80%) were extracted. Pearson's correlation coefficients between radiomics features and multiomics variables are shown as correlation heat maps (Figure 4A). The selected radiomics features reconstructed 65.54%, 64.65%, and 72.69% of the differentially expressed genes, transcripts, and proteins (Figure 4B). The coverage of each type of ‐omics was 60% with just 15 radiomics features. The radiomics‐related multiomics variables showed significant differences between the different pathologic grades (high vs. low grade) (Figure 4C).
The results of the gene enrichment analysis of 25 radiomics features are summarized in Figure 4D. In the enrichment result for wavelet_LL_first‐order_entropy, 21 GO terms and pathways were identified that are potentially related to HCC development. For example, wavelet_LL_first‐order_entropy was associated with abnormal alcohol dehydrogenase activity, which leads to abnormal development and cell apoptosis. Key genes associated with original_shape2D_sphericity were related to the phosphatidylinositol 3‐kinase (PI3K)/protein kinase B (AKT) signaling pathway (Figure 4F), which is involved in apoptosis, cancer cell proliferation, DNA repair, and cancer differentiation, among other biological processes.
In conclusion, we established a deep learning radiomics model that can be used for preoperative pathological grading of HCC and served as a noninvasive prediction tool to guide clinical decision‐making.
CONFLICT OF INTEREST
The authors declare that they have no competing interests.
Supporting information
Supporting information
ACKNOWLEDGEMENTS
We would like to thank the patients who participated in this study. This work was supported by the National Key Research and Development Program of China (grant number: 2018YFE0183900), the Natural Science Foundation of China (NSFC grant number: 81971686) and the Scientific Research Fund of Zhejiang Provincial Education Department (grant number: Y202045565).
Contributor Information
Haibo Dong, Email: donghb18@sina.com.
Tiannan Guo, Email: guotiannan@westlake.edu.cn.
Wenjie Liang, Email: baduen@zju.edu.cn.
Tingbo Liang, Email: liangtingbo@zju.edu.cn.
REFERENCES
- 1. Xu XF, Xing H, Han J, et al. Risk factors, patterns, and outcomes of late recurrence after liver resection for hepatocellular carcinoma: a multicenter study from China. JAMA Surg. 2019;154(3):209‐217. [DOI] [PMC free article] [PubMed] [Google Scholar]
- 2. Berzigotti A, Reig M, Abraldes JG, Bosch J, Bruix J. Portal hypertension and the outcome of surgery for hepatocellular carcinoma in compensated cirrhosis: a systematic review and meta‐analysis. Hepatology. 2015;61(2):526‐536. [DOI] [PubMed] [Google Scholar]
- 3. Xiao GQ, Yang JY, Yan LN. Combined Hangzhou criteria with neutrophil‐lymphocyte ratio is superior to other criteria in selecting liver transplantation candidates with HBV‐related hepatocellular carcinoma. Hepatobiliary Pancreat Dis Int. 2015;14(6):588‐595. [DOI] [PubMed] [Google Scholar]
- 4. Simonyan K, Zisserman A. Very deep convolutional networks for large‐scale image recognition. arXiv e‐prints 2014; arXiv:1409.1556.
- 5. DeLong ER, DeLong DM, Clarke‐Pearson DL. Comparing the areas under two or more correlated receiver operating characteristic curves: a nonparametric approach. Biometrics. 1988;44:837‐845. [PubMed] [Google Scholar]
Associated Data
This section collects any data citations, data availability statements, or supplementary materials included in this article.
Supplementary Materials
Supporting information


