

Abstract
Clear cell renal cell carcinoma (ccRCC) is the most common and lethal subtype of kidney cancer. Intraoperative frozen section (IFS) analysis is used to confirm the diagnosis during partial nephrectomy (PN). However, surgical margin evaluation using IFS analysis is time consuming and unreliable, leading to relatively low utilization. In this study, we demonstrated the use of desorption electrospray ionization mass spectrometry imaging (DESI-MSI) as a molecular diagnostic and prognostic tool for ccRCC. DESI-MSI was conducted on fresh-frozen 23 normal-tumor paired nephrectomy specimens of ccRCC. An independent validation cohort of 17 normal-tumor pairs were analyzed. DESI-MSI provides two-dimensional molecular images of tissues with mass spectra representing small metabolites, fatty acids, and lipids. These tissues were subjected to histopathologic evaluation. A set of metabolites that distinguish ccRCC from normal kidney were identified by performing least absolute shrinkage and selection operator (Lasso) and log-ratio Lasso analysis. Lasso analysis with leave-one-patient-out cross validation selected 57 peaks from over 27,000 metabolic features across 37,608 pixels obtained using DESI-MSI of ccRCC and normal tissues. Baseline Lasso of metabolites predicted the class of each tissue to be normal or cancerous tissue with an accuracy of 94% and 76%, respectively. Combining the baseline Lasso with the ratio of glucose to arachidonic acid could potentially reduce scan time and improve accuracy to identify normal (82%) and ccRCC (88%) tissue. DESI-MSI allows rapid detection of metabolites associated with normal and ccRCC with high accuracy. As this technology advances, it could be used for rapid intraoperative assessment of surgical margin status.
Keywords: Clear cell renal carcinoma, nephrectomy, surgical margins, histopathology, electrospray ionization, metabolome
Introduction
The increased incidence of stage 1 renal cell carcinoma brought about by cross-sectional imaging has resulted in increasing use of nephron-sparing approaches for management, including partial nephrectomy (PN) and ablation procedures.1 In PN, the incidence of positive surgical margins (PSMs) in patients with small renal masses varies from 0.1 to 7% and for advanced RCC patients, from 18 to 32%.2, 3 Although the impact of PSM on long-term survival in RCC is still controversial,4 large observational studies have shown that PSM are significantly associated with higher rates of local recurrence and worse overall survival independent of other predictors.5–7 Despite the importance of surgical margin assessment, only 69% of surgeons performing open and 58% performing laparoscopic PN report using intraoperative frozen sections.8 In ablative procedures, frozen sections of core biopsies are sometimes used intraoperatively to confirm diagnosis at the outset of the procedure.9 Low utilization of intraoperative frozen section (IFS) is caused by both the long processing time (often 30 minutes or more) and relatively low accuracy. In cases with true positive margins detected on final pathology, frozen sections are positive in only 15–30% of cases.10, 11 The intention of this work is to provide a proof of concept that intraoperative frozen section analysis using DESI-MSI can increase substantially the usefulness of this approach.
Desorption electrospray ionization mass spectrometry imaging (DESI-MSI) has emerged as a promising approach for spatial characterization of the metabolome that can detect the presence of cancer rapidly on frozen sections.12, 13 DESI-MS is easy to use, operates under ambient conditions, and can provide high-resolution characterization of metabolites (currently ~200 µm) in scan times of 1 minute. Statistical tools, such as Lasso, have allowed identification of a parsimonious set of metabolites from the large pool of molecules identified by DESI-MS that can distinguish normal from malignant tissues.14–16 Our group has tested DESI-MSI in several malignancies including stomach,17 pancreatic,18 skin,19 and prostatic neoplasms20 and have identified metabolomic signatures that identify cancer with high sensitivity and specificity. In pancreatic cancer, a direct comparison of DESI-MSI detection with frozen sections showed that cases that were positive by DESI-MSI but negative by histology showed higher rates of recurrence, suggesting that DESI-MSI might provide additional information on surgical margins.18 Recently, hand-held mass spectrometry probes that can be used intraoperatively have been developed using DESI and desorption ionization (DI) and are being tested in several malignancies.21, 22
Renal cell carcinoma is not only common, but also potentially lends itself to detection by metabolomic approaches because many initiating mutations affect metabolism.23 To evaluate the feasibility of using DESI-MSI in assessing clear cell renal cell cancer (ccRCC) in core tissues, we analyzed 40 normal-tumor pairs of ccRCC. We built a predictive model using 23-paired samples and validated its performance on an independent test set of 17 pairs. We found DESI-MSI was able to distinguish between ccRCC and normal tissue with an accuracy of 85%, demonstrating promise as a method to improve detection of positive surgical margins intraoperatively.
Material (Patients) and Methods
Ex-vivo specimens were harvested from both benign and cancerous areas in subjects undergoing nephrectomy for kidney cancer under an IRB approved protocol that allowed association of clinical data with specimens (IRB-13828). The samples were exposed to room temperature prior to snap freezing in liquid nitrogen for 30 minutes. Biosamples were stored at −80 °C in sealed freezer boxes until ready to use. Cases were selected based on cancer type (i.e., ccRCC) denoted in the surgical pathology report. Cancerous and normal tissues were harvested based on gross appearance. All samples selected for DESI-MSI underwent frozen sectioning to confirm histology (cancer vs. normal) and exclude necrotic tissues. The diameter size of the coring tool is 8 mm (Stainless steel, autoclavable), purchased from Alabama Research and Development, (Munford, AL). We have used disposable coring tool from Sklar Surgical Instruments (West Chester, PA ) of same diameter. DESI-MSI analysis was performed on a training set of 23-paired, fresh-frozen, normal and ccRCC core specimens with an equal representation of indolent and aggressive cancer. For a test set, we performed DESI-MSI on 17 independent cases (Supporting Information Table S1). A 5-μm frozen section of each frozen tissue core sample was stained with hematoxylin and eosin (H&E), and then a 10-μm section was obtained immediately adjacent to the H&E section using a Leica CM1950 cryostat (Leica Biosystems) for DESI-MSI analysis.
DESI-MSI analysis
DESI-MSI is an ambient ionization imaging technique (i.e., all the measurements were carried out at room temperature and atmospheric pressure). Prior to the data acquisition, tissues were stored at −80 °C in a freezer and dried for 20 minutes using vacuum desiccator. Optimal temperature cutting (OCT) polymeric compound, is used for tissue embedding prior to the frozen sectioning on a microtome-cryostat. OCT is readily ionized in the positive ion mode, and the mass spectrum consists of interference from polymeric peaks separated by 22 mass-to-charge (m/z) units (Supporting Information Fig. S1). However, OCT interference is absent in negative ion mode, which consists mostly of deprotonated species, and chloride adducts unlike positive ion mode DESI-MSI with, protonated sodiated, and potassiated adducts.
Experimental details of tissue imaging by desorption electrospray ionization mass spectrometry imaging (DESI) have been described elsewhere.24, 25 Briefly, DESI-MSI was performed in the negative ion mode (−5 kV) from m/z 50–1000, using LTQ-Orbitrap XL mass spectrometer (Thermo Scientific) coupled to a home-built DESI-source and a two-dimensional (2D) motorized stage. Both normal and ccRCC tissues were raster scanned under impinging charged droplets generated from the electrospray nebulization of a histologically compatible solvent system, 1:1 (vol/vol) dimethylformamide/acetonitrile (DMF/ACN, flow rate 1 µL/min). The electrospray nebulization was assisted by using sheath gas nitrogen (N2, 170 psi) and a high electric field of −5 kV. The spatial resolution of DESI-MSI, defined by the spray spot size, is ~200 µm (Supporting Information Fig. S2). DESI-MSI of all tissue samples were carried out under identical experimental conditions, such as spray tip-to-surface distance ∼2 mm, spray incident angle of 55°, and spray-to-inlet distance ∼5 mm. The MSI data was acquired using XCalibur 2.2 software (Thermo Fisher Scientific Inc.). The tissue samples after DESI-MSI analysis were subjected to histopathologic evaluation using H&E staining (Supporting Information Fig. S4).
DESI-MSI was performed on tissue sections by placing the glass microscope slides onto a custom two-dimensional precision moving stage. Images were collected in a series of rows by coordinating linear motion of the moving stage (134.22 µm s−1) with the MS duty cycle. The MS duty cycle was defined by the scan parameters: m/z 50–1000, injection time of 500 ms with 1 microscan, scan time 1.49 s, and automatic gain control (AGC) was disabled. A lateral spatial resolution (“x”) of 200 µm was defined, upon completion of a row the moving stage resets to the original “x” position while stepping 200 µm in “y”. This process was repeated in order to acquire data from the entire tissue surface. Given tissue surface area 4 mm by 4 mm = 16 mm2, the acquisition time per pixel is about 1.49 s, acquisition time per row is 0.49 minutes (less than a minute for linear scan), and the total acquisition time per tissue is 9.8 minutes. However, it is important to note that we acquired whole slide scans in order to acquire a large data set for model building and testing. Once a model is optimized, we have shown we can acquire linear scan data that distinguish tissue types (normal and cancer) in less than 1 minute20.
Tandem-MS and high mass resolution analyses were performed by using the LTQ-Orbitrap XL (Thermo Scientific). Tandem-MS spectra were analyzed (Supporting Information Figs. S7–S10), and molecular assignments were compared with databases such as LipidMaps (www.lipidmaps.org/), MassBank (www.massbank.jp), and Metlin (https://metlin.scripps.edu/). The detected species were mostly deprotonated small metabolites related to the tricarboxylic acid (TCA) cycle, and deprotonated lipids including free fatty acids (FAs), fatty acid dimers, phosphatidic acids, and glycerophospholipids (Supporting Information Table S2).20 Supporting Information provides details of experimental conditions (Figs. S1–S4) and molecular analysis (Figs. S7–S10). The 2D chemical maps of molecular ions such as glucose, arachidonic acid and glycerophospholipids were plotted using Biomap (Supporting Information Fig. S3). Using MSiReader software (version v1.00), each tissue DESI-MS image was normalized by the total ion current (TIC) and the raw data from each pixel was extracted for statistical analysis.
Statistical analysis
We used the baseline Lasso,26 log-ratio Lasso,27 and a combined ridge regression linear model to select statistically significant molecular ion peaks in MSI profiles, and built a classifier that estimates the probability of an individual pixel in each tissue DESI-MS image to be normal or cancerous (ccRCC).16, 28 Our training and validation set consisted of 23 and 17 pairs of tissue, respectively, where each pair is extracted from a single patient. Within the training set (23 benign and 23 cancer tissues), we applied the Lasso method (binary-logistic regression with L1 penalty) using glmnet package in the CRAN R language library.15 We initially used an unbiased statistical approach to fit both Lasso models, where leave-one-patient-out cross-validation builds an initial pixel-based Lasso binary classifier. Lasso selects only a sparse subset of molecular features for classification.
To account for the random effects influencing MS data, intensity of each metabolite was normalized by the total ion current (TIC) for the corresponding pixel (Supporting information Fig. S11).29, 30 A nearest neighbor clustering method was used to collect all pixel intensities corresponding to the nearest molecular ion peak for feature selection. Leave-one-patient-out cross-validation was employed to obtain the Lasso tuning parameter26 and evaluate its predictive accuracy. Due to the known molecular diversity of ccRCC, the log-ratio Lasso27 was also used to find a sparse subset of features, each representing the ratio of relative intensities of two metabolites (Supporting Information Tables S4–S5). Table S4 reports all the metabolites for which pairwise ratios were considered in selecting a log-ratio lasso model. The log-ratio Lasso maintains the sparsity from Lasso and is unaffected by the multiplicative scaling of each observation in DESI-MSI. The Lasso and log-ratio Lasso models have complementary strengths, as discussed below in Lasso analysis. To harness the strengths of both models, we then fit a combined linear ridge regression model including the selected molecular features from both Lasso, and log-ratio Lasso, and compared the performances of all three models in discriminating the cancer versus normal tissue on a separate test set. Similar to the baseline Lasso model, this model was built using the glmnet package in CRAN R language library. Supporting Information Tables S3, S5, and S6 report the model coefficients for the baseline Lasso, log-ratio Lasso, and combined model, respectively.
Results
Molecular imaging and metabolite identification characteristics of ccRCC
We performed DESI-MSI of 40-paired normal and ccRCC tissues in the negative ionization mode from m/z 50–1,000. In the low mass range (m/z 50–200), we found significant differences in the distribution and abundance of small metabolites related to the tricarboxylic acid (TCA) cycle, reflecting the known altered metabolism of ccRCC (Figure 1). Compared to normal tissue, ccRCC displayed a higher abundance of lactate (m/z 89.0247), glucose (m/z 179.0557), glutamate (m/z 146.0457), N-acetyl glutamate (m/z 187.0415), and 2-hydroxy butyrate (m/z 103.0401) and a lower abundance of creatinine (m/z 112.9856), fumarate (m/z 115.0764), and succinate (m/z 117.0193).
Figure 1:
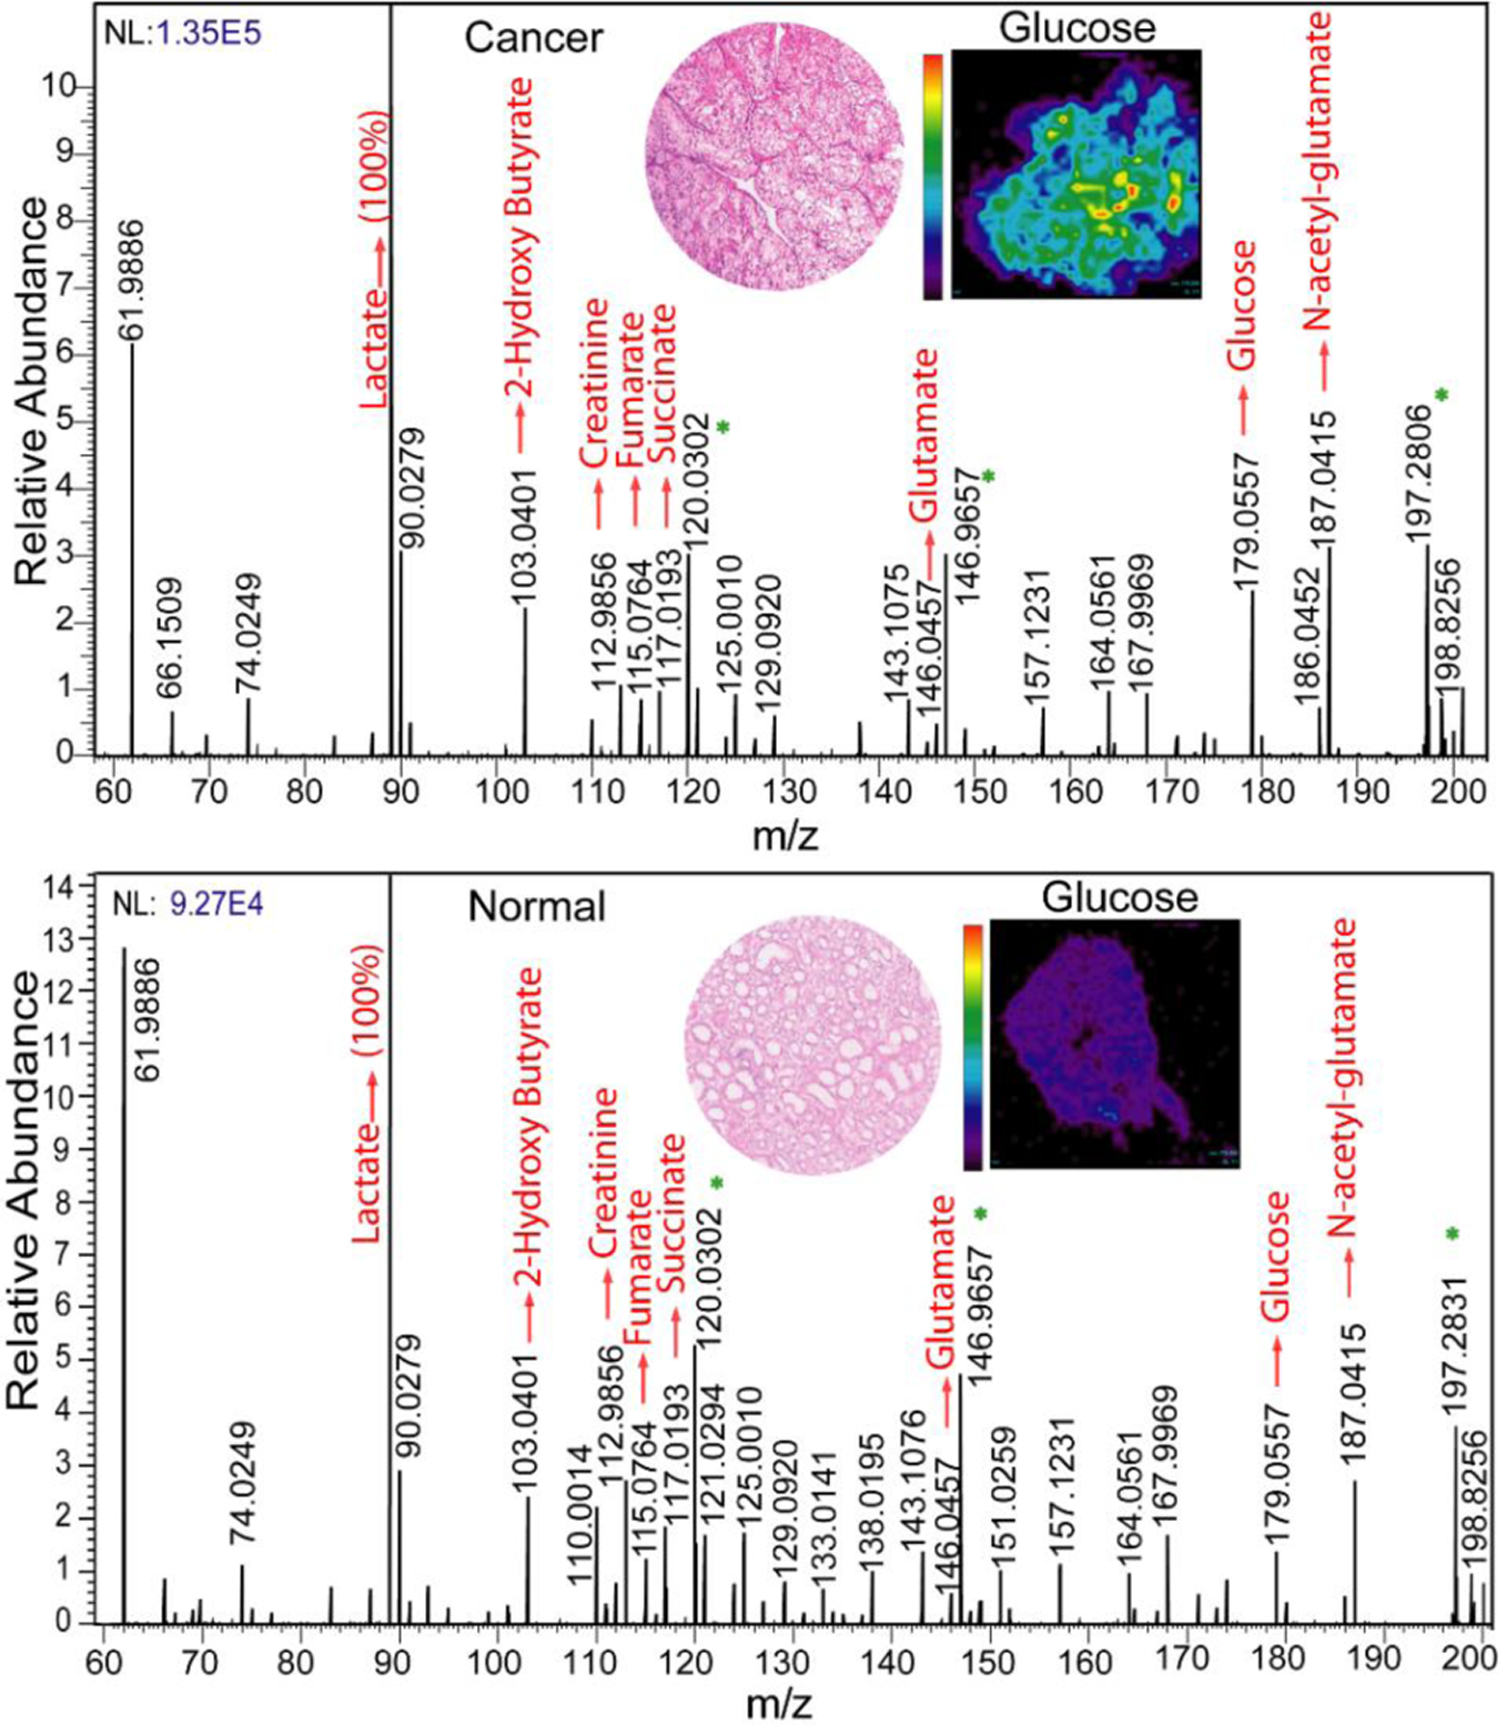
The comparison between MS profiles of normal versus ccRCC tissue imaged at m/z 50–200. Inset shows the hematoxylin and eosin (H&E) images of ccRCC and normal tissue and the respective heatmaps of the tissue plotted with respect to glucose. Peaks marked with an asterisk arise from background.
Differences in peak abundance were also apparent in the mass range m/z 200–1000 (Figure 2). Compared to the normal tissue, ccRCC tissue shows higher abundance of glycerophosphoglycerol 34:1, PG (18:1/ 16:0) (m/z 747.5160), glycerophosphoglycerol 36:3, PG (18:2/ 18:1) (m/z 771.5160), glycerophosphoinositol 38:4, PI (18:0/20:4) (m/z 885.5470), glycerophosphoinositol 36:2, PI (18:2/18:0) (m/z 861.5473), glycerophosphoinositol 34:1, PI (16:1/18:0) (m/z 835.5316), and glycerophosphoserine 36:1, PS (18:1/18:0) (m/z 788.5424). ccRCC tissue shows lower abundance of aminophospholipids such as phosphatidylethanolamine 36:4, PE (16:0/20:4) (m/z 722.5119), phosphatidylethanolamine 40:6, PE (20:4/20:2) (m/z 790.5458), phosphatidylethanolamine 40:4, PE (18:0/22:4) (m/z 794.5034), and glycerophosphoserine 38:4, PS (18:0/20:4), (m/z 810.5387) and glycerophosphoserine 34:1, PS(16:0/18:1).
Figure 2:
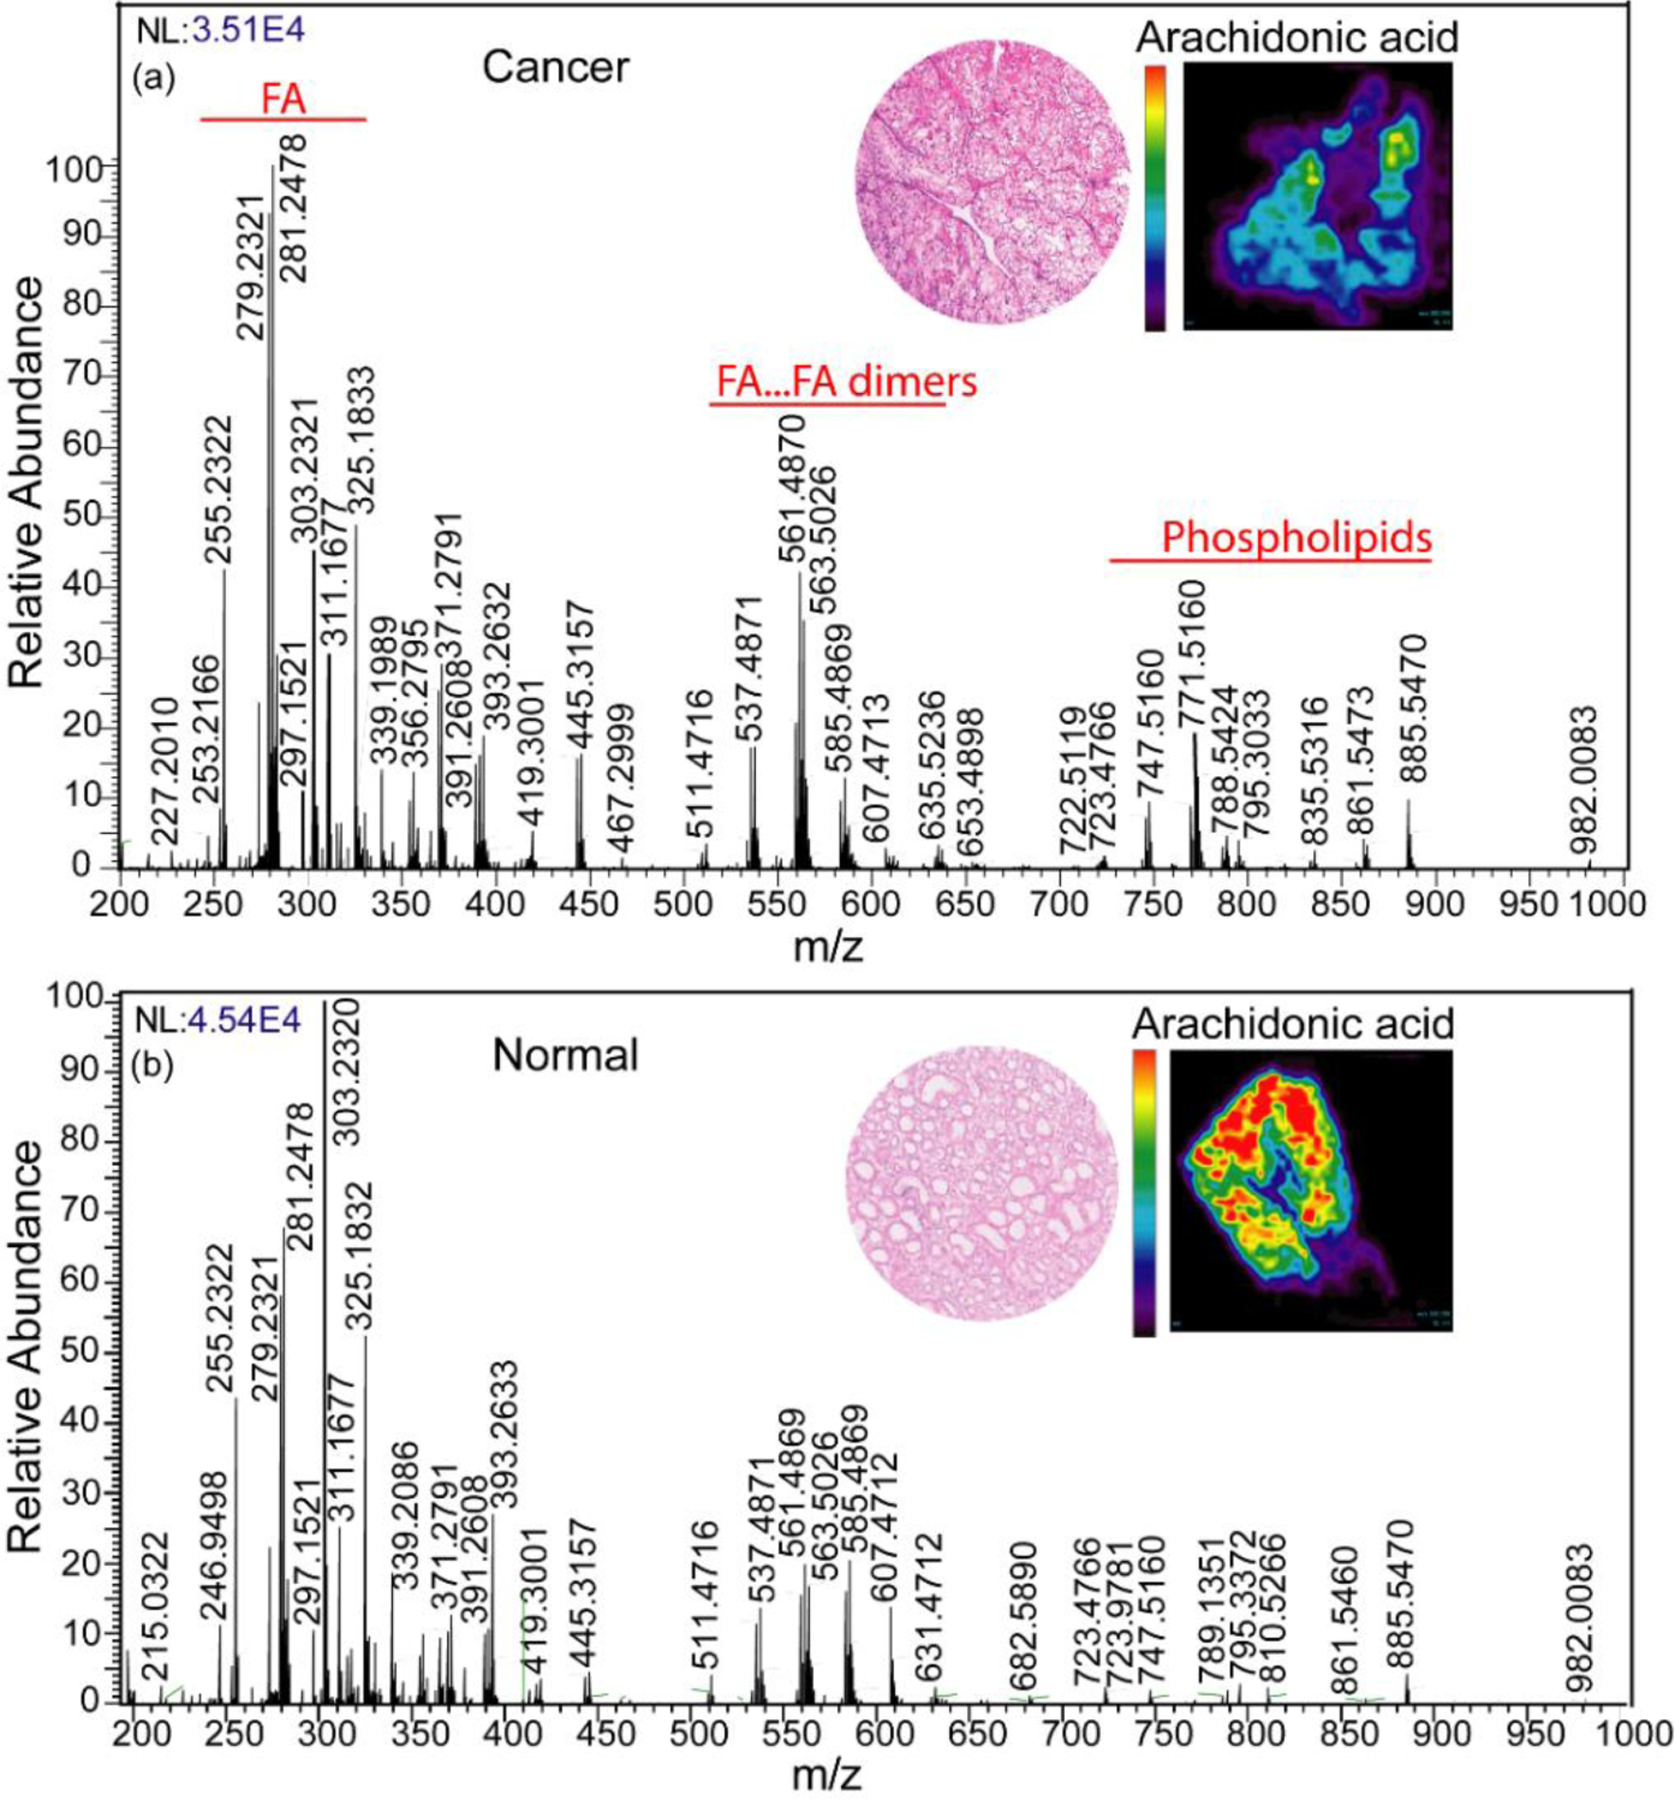
Comparison between MS profiles of normal versus ccRCC tissue imaged at m/z 200–1000. Inset shows the H&E images of ccRCC and normal tissue and the respective heatmaps of the tissue plotted with respect to arachidonic acid.
Compared to normal tissue, ccRCC showed strong ion signals for FA dimers observed at m/z 537.4871 (oleic acid + palmitic acid) and at m/z 563.5026 (oleic acid + oleic acid), but not at m/z 585.4869 (oleic acid + arachidonic acid) and m/z 607.4013 (arachidonic acid + arachidonic acid). A higher abundance of fatty acids such as oleic acid FA (18:1) (m/z 281.2478), linoleic acid FA (18:2) (m/z 279.2321), and lower abundance of arachidonic acid FA (20:4) (m/z 303.2320) was observed in ccRCC tissue. Other molecular ions that were distinctly different between normal and ccRCC tissues included palmitic acid (FA 16:0) (m/z 255.2322), m/z 311.1677, m/z 325.1833, m/z 339.1989, m/z 356.2795, m/z 371.2791, m/z 391.2608, m/z 393.2632, m/z 419.31001, and m/z 445.3157. The relative intensity distribution of each individual metabolite in ccRCC versus normal tissue is shown in 2D chemical heatmaps maps created using Biomap software (Supporting Information Fig. S2).
Lasso analysis
Three models were trained using the glmnet package in the CRAN R language library15, including the lasso, log-ratio lasso, and a combined ridge regression model. The lasso (binary logistic regression with L1 penalty) selects for a sparse set of 57 metabolites from 27,523 total detected molecular species across all 37,608 pixels in the training set. The selected features from lasso are noted in supporting information table S3. Previously, we have also found that a ratio of metabolites could be used to distinguish normal from malignant prostate tissues.20 We therefore tested whether a ratio of metabolites could contribute to identification of ccRCC. To train the log-ratio Lasso model, it is computationally intractable to enumerate all possible ratios of relative intensities of molecular ions from 27,523 features over 378 million ratios. We considered all pairwise ratios of 58 metabolites (total 1653 features) that are known to be differentially expressed in cancer tissues from previous DESI-MSI studies (Supporting Information Table S4). Considering all pair-wise ratios of 58 metabolites, the log-ratio Lasso model used leave-one-patient-out cross-validation to select one ratio (Supporting Information Tables S4–5). We found the best ratio was glucose to arachidonic acid (Supporting Information Table S5). From the pixel-level to tissue-level classification, we employed a simple majority rule; if over 50% of pixels in a tissue were predicted to be cancerous, then the entire tissue was scored as cancerous.
From the cross-validation performance of both baseline Lasso and log-ratio Lasso on the training set, we found the accuracy to be 86.9% and 63.0%, respectively (Table 1). Lasso yielded a specificity (true negative rate) of 91.3% compared to the log-ratio model of 47.8%, while the sensitivity (true positive rate) of both models were comparable (82.6% and 78.3%). Although Lasso selected 57 peaks, spanning small metabolites, fatty acids, and lipids, it did not include either glucose or arachidonic acid. Therefore, it appeared that log-ratio Lasso model imparted unique information useful in distinguishing normal kidney tissue from ccRCC. The glucose/arachidonic acid ratio was a sensitive biomarker, where the ratio is elevated in cancer tissue (Figure 3). However, the low log-ratio observed in some cancers contributed to the low specificity shown in Table 1.
Table 1.
Leave-one-patient-out cross-validation performance of baseline Lasso, log-ratio Lasso on training sets, and performance of all models on test set at tissue level.
| Set | Predicted | ||||
|---|---|---|---|---|---|
| Baseline Lasso | Normal | Cancer | % agreement | ||
| Training (tissue) |
Truth | Normal | 21 | 2 | 91.3% |
| Cancer | 4 | 19 | 82.6% | ||
| Overall agreement 86.9% | |||||
| Log-ratio Lasso | Normal | Cancer | % agreement | ||
| Training (tissue) |
Truth | Normal | 11 | 12 | 47.8% |
| Cancer | 5 | 18 | 78.3% | ||
| Overall agreement 63.04% | |||||
| Baseline Lasso | Normal | Cancer | % agreement | ||
| Test (tissue) |
Truth | Normal | 16 | 1 | 94.1% |
| Cancer | 4 | 13 | 76.5% | ||
| Overall agreement 85.3% | |||||
| Log-ratio Lasso | Normal | Cancer | % agreement | ||
| Test (tissue) |
Truth | Normal | 9 | 8 | 52.9% |
| Cancer | 1 | 16 | 94.1% | ||
| Overall agreement 73.5% | |||||
| Combined model | Normal | Cancer | % agreement | ||
| Test (tissue) |
Truth | Normal | 14 | 3 | 82.4% |
| Cancer | 2 | 15 | 88.2% | ||
| Overall agreement 85.3% | |||||
True negative rate (Specificity) = (TN/ (TN + FP))
True positive rate (Sensitivity) = (TP/ (TP + FN))
Figure 3.
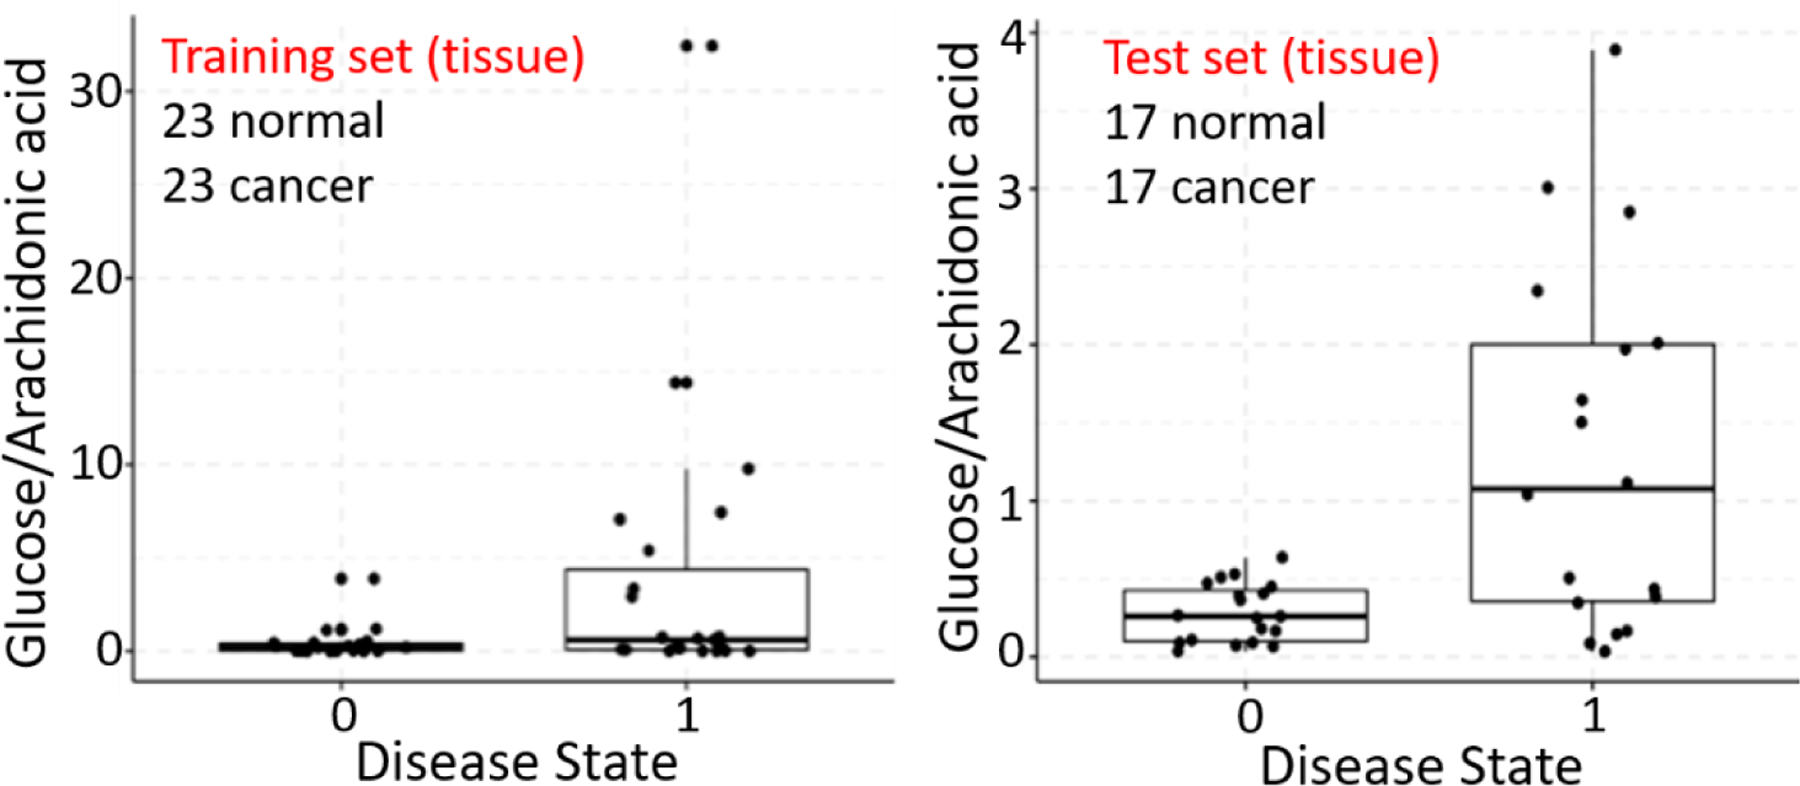
Comparison of relative intensity of ratio of glucose to arachidonic acid in normal tissue (0) and cancerous tissue (1). Each data point represents the average relative intensity of the ratio from all pixels in a tissue.
Finally, we observed that the lasso and log-ratio lasso had different strengths, with the former having higher specificity while the latter has higher sensitivity. Therefore, we included the selected features from both models (57 features from baseline-lasso and glucose/arachidonic acid ratio) in a ridge regression (‘combined’) model, which is optimized on the training set. This combined linear model was fit on all training set pixel data using ridge regression in the glmnet package.15 We evaluated each model’s performance at the pixel level on an independent test set of 17 pairs of tissues, using a majority rule from pixel to tissue-level classification. We also evaluated the sensitivity of all model performances to this pixel to tissue threshold, specifically what percent of pixels need to be cancerous for the overall tissue to be scored cancerous. Our sensitivity analysis (Figure 4) finds that the combined model performance is most robust, since it maintains over 80% accuracy at the tissue level to changes in this threshold varying from 20 to 90%. This suggests our combined model may be clinically useful in predicting the tumor margins for tissues where the majority of pixels are cancer-free. With a 50% pixel to tissue threshold, we obtained an accuracy of 85.3%, 73.5%, and 85.3% at the tissue level for baseline Lasso, log-ratio model, and the combined model, respectively (Table 1).
Figure 4:
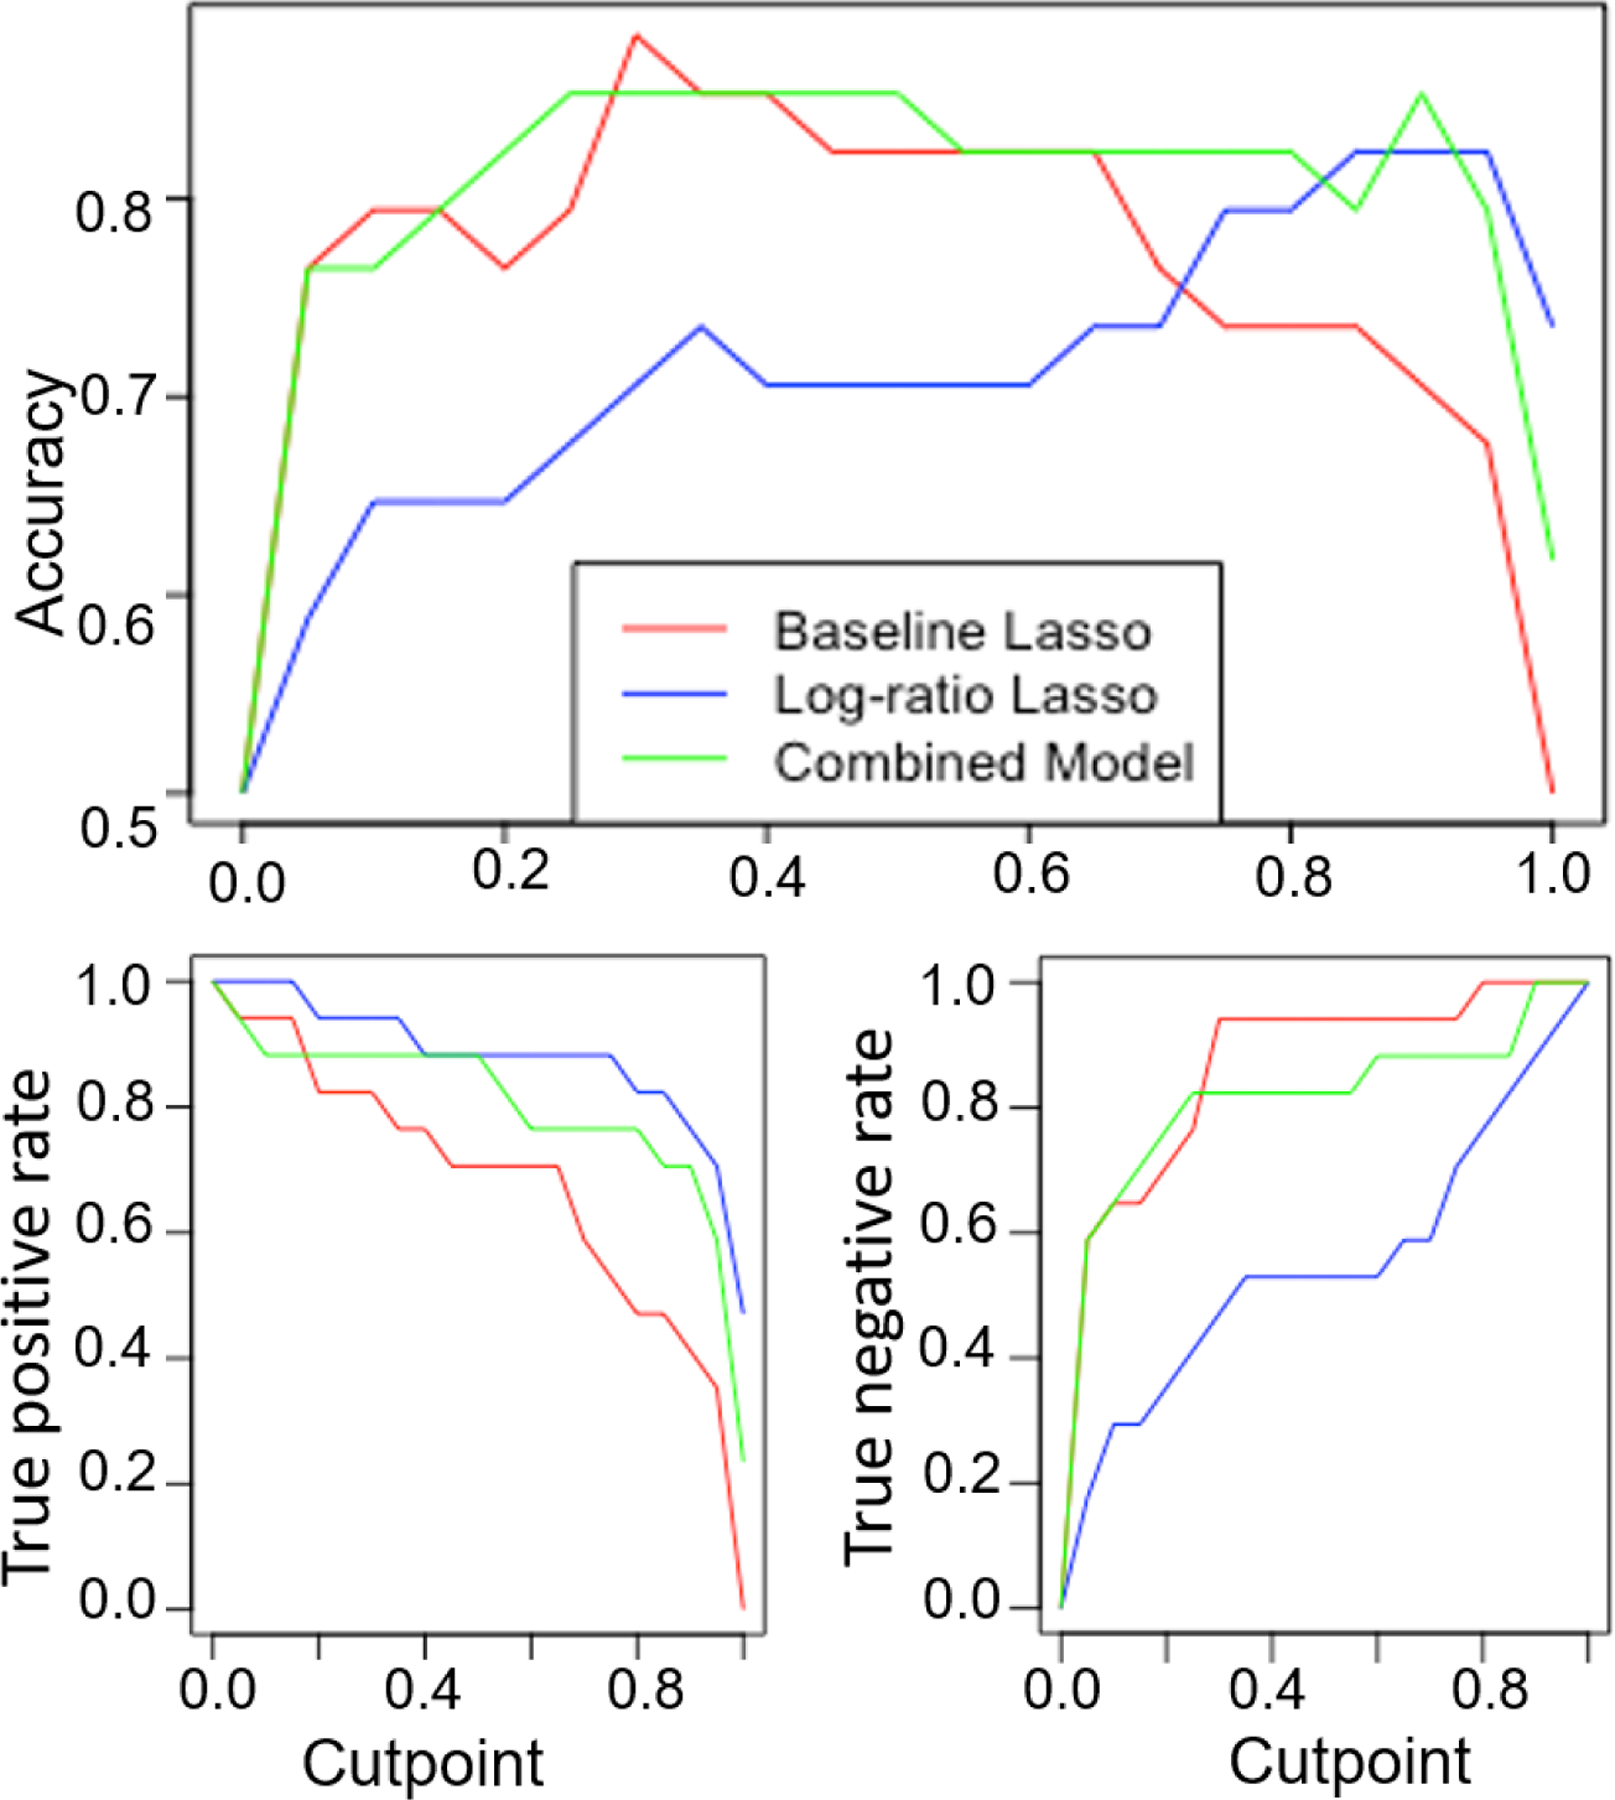
Sensitivity analysis to evaluate model accuracy, true positive, and true negative rates for various pixel to the tissue thresholds. This threshold (cutpoint) refers to the percentage of pixels required to be cancer positive for the overall tissue to be labeled as cancerous.
We further evaluated the performance of these models using the area under the curve (AUC) and receiving operator characteristic (ROC) curve (Figure 5). The AUC metric for the baseline Lasso, log-ratio Lasso, and combined models at the pixel level were 81.4%, 71.4%, and 84.2%, respectively. The AUC analysis demonstrated that the combined model had the best discriminative ability. The pixel level performance of all 3 models was compared on the test set, where the combined model performs the best with 84.2% accuracy (compared to 81.6% and 70.9% accuracy of the baseline lasso and log-ratio models respectively). Our analysis shows that the combined approach harnessed both the sensitivity of the log-ratio Lasso and the specificity of the baseline Lasso to achieve classification accuracy and the highest AUC value.
Figure 5.
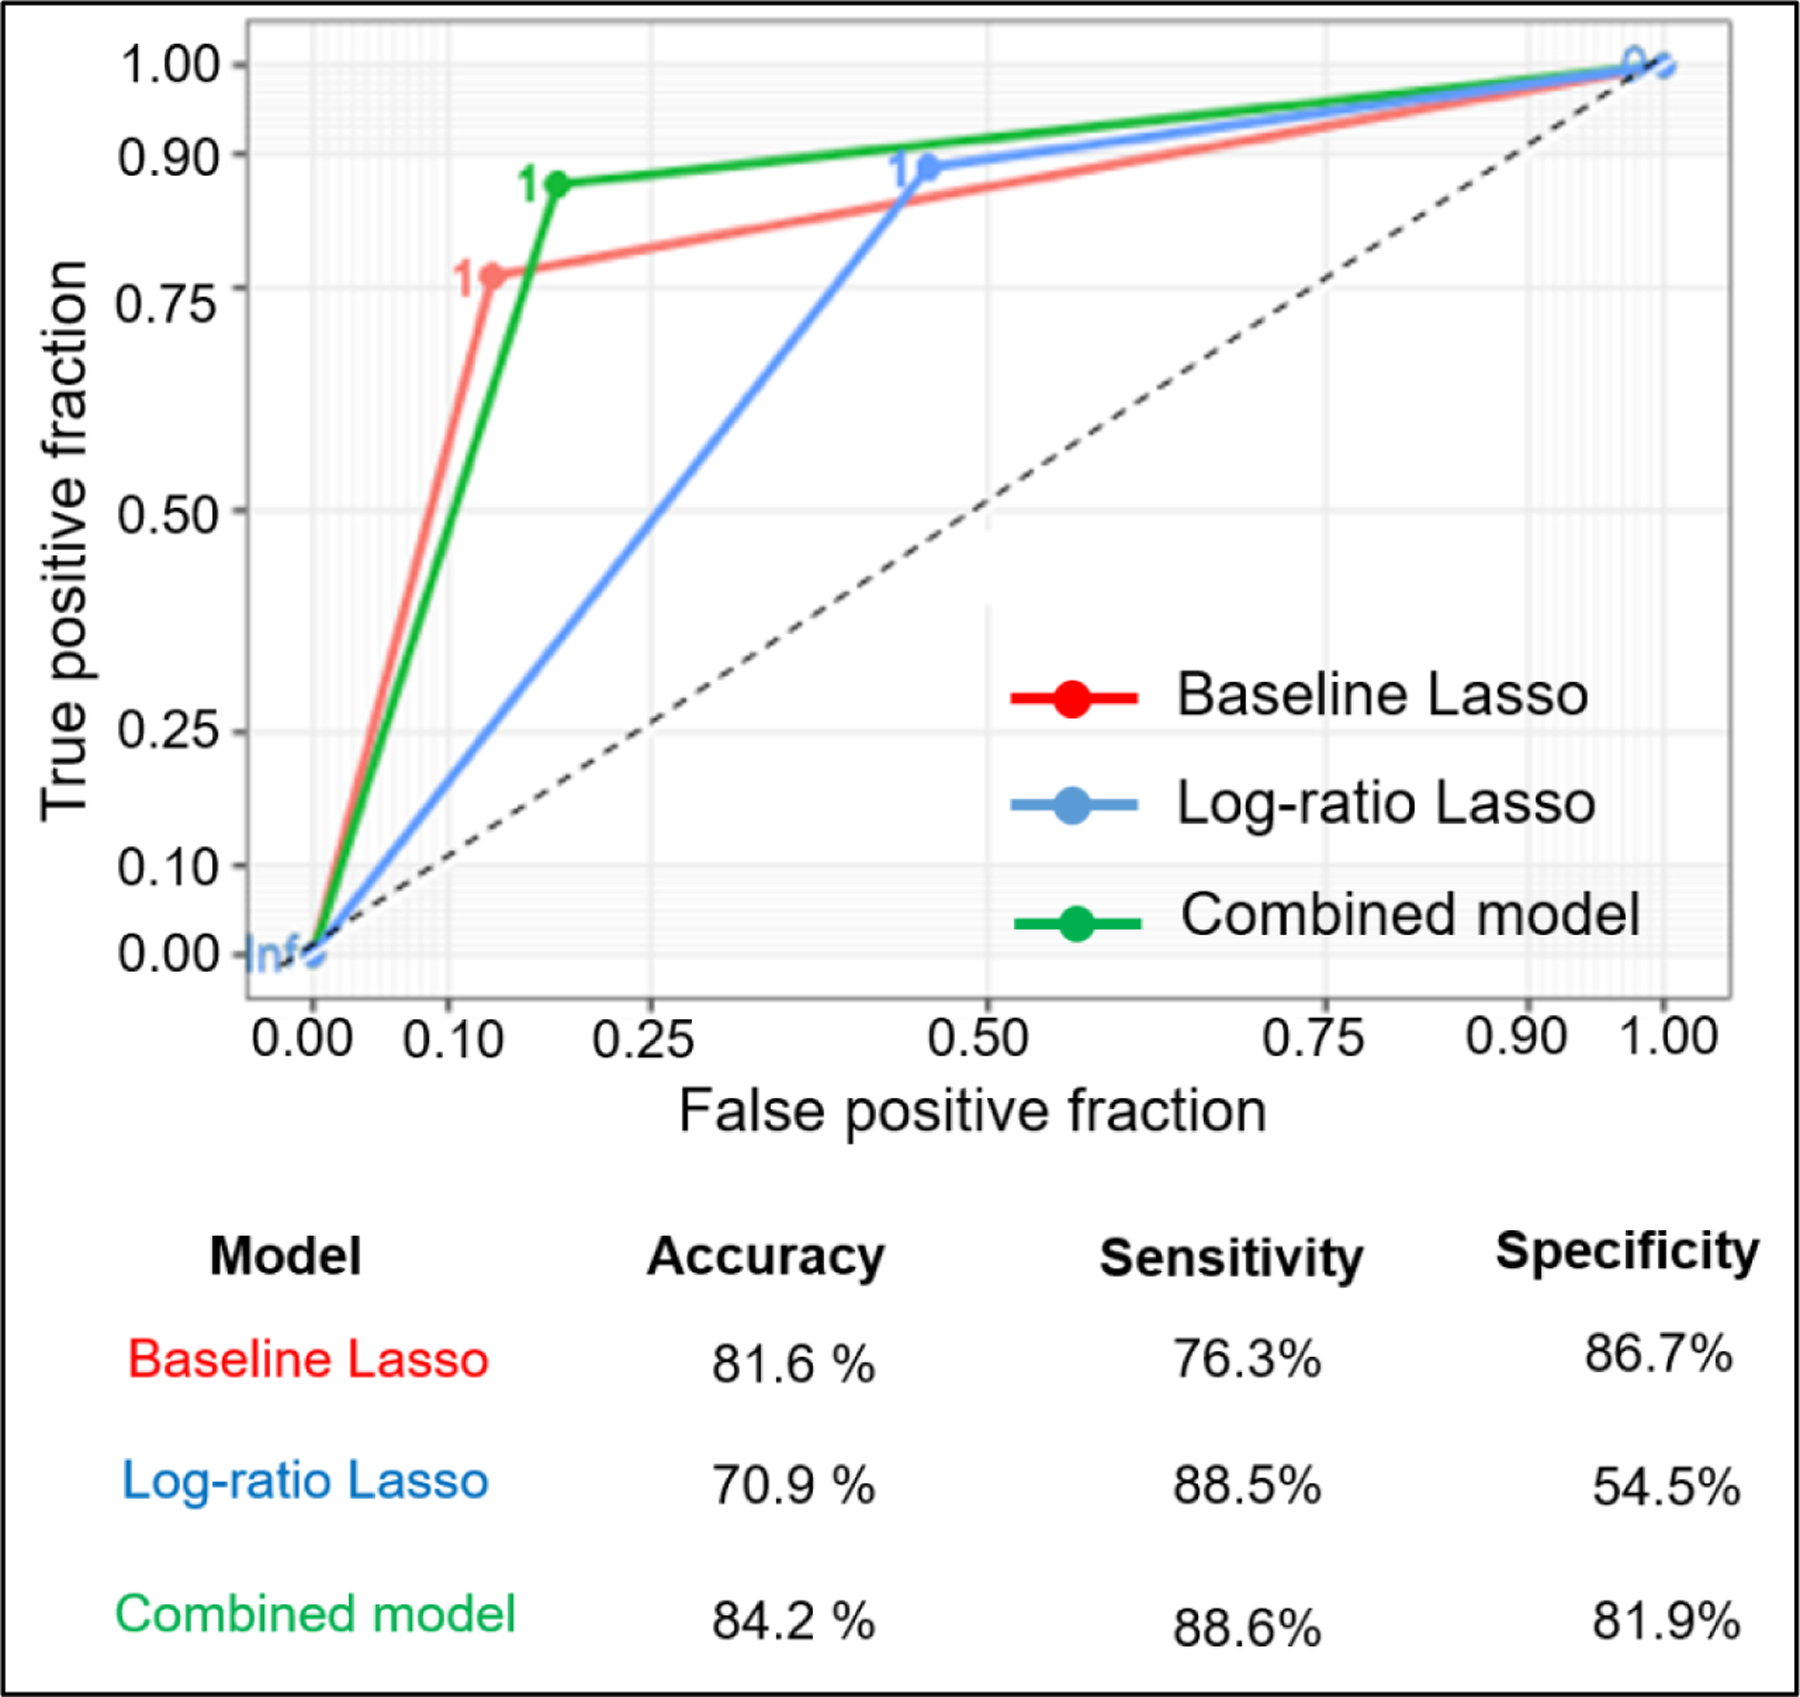
Comparison of three models using area under the curve (AUC) and receiving operator characteristic (ROC) curve at the pixel level. AUC metrics are 0.814, 0.714, and 0.842 for baseline, log-ratio, and combined models, respectively.
Discussion
DESI-MSI is a label-free molecular imaging technique that probes the altered metabolism in cancer tissues. DESI-MS is currently being evaluated for near real-time identification of positive surgical margins in glioblastoma,31 and a hand-held mass spectrometry wand is being developed for intraoperative use.21, 22 We tested the feasibility and accuracy of DESI-MS for distinguishing normal from malignant kidney tissues and found excellent performance characteristics, matching or exceeding those reported for frozen sections. Not only did we observe the expected differences in small metabolites related to the TCA cycle, we identified a number of lipid species that were altered in ccRCC. Our work provides a proof of concept for use of DESI-MSI to determine surgical margin status in ccRCC and reveals key metabolic differences between cancer and normal tissue consistent with the metabolic rewiring in ccRCC.
Achievement of negative surgical margins and preservation of renal function are key goals in PN. PSM rates are one of the key metrics used for evaluating quality in partial nephrectomy surgeries for RCC in both the US and Europe.32 Given that frozen sections are poorly sensitive, finding only 15–30% of PSMs disclosed on final pathology 10, 11 and potentially increase ischemia time, many surgeons advocate against obtaining frozen sections.4, 10 However, performance of frozen sections is associated with lower rates of PSM on final pathology, and contemporary large studies have suggested that PSM influence cancer outcomes.5–7 Furthermore, advances in surgical techniques have increased the number and complexity of cases amenable to PN.33 The high accuracy of predicting cancer based on metabolites, suggests that DESI-MS and mass-spectrometry based tools like a mass spectrometry pen that has been deployed intraoperatively in ovarian cancer with high accuracy for diagnosis.34 DESI-MS can provide a rapid read-out of diagnostic mass spectra that make it compatible with the goal of minimizing ischemia time and identifying PSM in the surgical bed. Such an enabling technology could facilitate safe expansion of indications for PN to more complex cases based on tumor size and location.
The metabolites detected by DESI-MS coincide with known metabolic alterations in ccRCC that arise from alterations in hypoxia-sensing pathways induced by functional inactivation of the von Hippel–Lindau (VHL).35, 36 For example, we observed higher abundance of glucose and lactate, attributable to the upregulation of GLUT-1 37 and lactate dehydrogenase (LDH-A) associated with a shift toward aerobic glycolysis.38, 39 Succinate and fumarate, members of the tricarboxylic acid (TCA) cycle decrease with this metabolism shift, while glutamate increase, coinciding with induction of glutaminolysis.36 Alterations in glutamine and more generally amino acid metabolism are indeed reflected by the statistical models, which select for N-acetyl aspartic acid, and N-acetyl glutamate peaks in the classification.
In addition, we find expected increases in fatty acids, fatty acid dimers, and phospholipids, and are able to identify quantitative increases in particular FAs and their dimers, such as palmitic acid (FA 16:0), linoleic acid (FA 18:2), and oleic acid (FA 18:1) and decreases in arachidonic acid (FA 20:4) and its dimers. Morphologically, ccRCC cells are lipid and glycogen-laden,40 likely reflecting the reprogramming of fatty acid and glucose metabolism known to occur in the development of ccRCC. Upregulation of fatty acid synthesis in ccRCC results in high concentrations of fatty acids, which can lead to the dimer formation in solvent droplets. Desorption electrospray ionization mass spectra (DESI-MS) of fatty acids profiles in the negative ion mode consists of abundant ions of deprotonated molecules, such as monomers [M-H]− and dimers [2M-H]−. Dimers can be regarded as proton bound molecules R-COO−... H+...−OOC-R. The interaction can be due to electrostatic interactions (hydrogen bonds) between carboxylate anions and protons, or the hydrophobic interaction of fatty acids with longer aliphatic chains.41
Enzymes cyclooxygenase (COX) and lipoxygenase (LOX) act on arachidonic acid to yield lipid mediators such as prostaglandins, thromboxane, and leukotrienes. We observed 20-COOH-leukotriene B4 in ccRCC tissue (m/z 365.2454), a signal relay molecule in neutrophil chemotaxis to the inflammation sites (supporting information Fig. S8H).42 In addition, other studies report that free polyunsaturated fatty acids (PUFA) such as FA (20:4) levels in ccRCC are strongly dependent on HIF-2α activity.43 HIF-2α controls the fate of fatty acids either in phospholipid synthesis or in storage to form lipid droplets.44 We observed elevated levels of PGs, and PIs, and suppressed aminophospholipids such as PSs and PEs. PEs are synthesized in mitochondria and is produced from the decarboxylation of PS synthesized in endoplasmic reticulum (ER).45 The reduced levels of PS and PE can have profound effect on membrane trafficking of lipids and the asymmetric membrane structure, which in turn affects the programmed cell death apoptosis and phagocytosis.46, 47 Our DESI-MSI results suggest that ccRCC changes the lipidome, but still more needs to be learned about how different metabolic pathways are triggering tumorigenesis. In order to understand the roles of specific metabolites including specific fatty acids, and phospholipids, we and others are obtaining detailed information on the ccRCC metabolism.
Our study provides a proof of concept demonstrating the potential for using features of the metabolome for accurately distinguishing normal from malignant kidney ccRCC tissues. However, the performance characteristics could differ for other histologic subtypes of RCC including papillary, chromophobe, and rare subtypes, as well as benign entities such as oncocytoma and angiomyolipoma.48 Metabolic profiling and lipid profiling of RCC subtypes and ccRCC-derived metastases have a potential for the classification of subtypes and the identification of therapeutic targets.49, 50 We had a modest number of samples, although the large number of pixels per case provided sufficient power for robust model building. Additional work will also be necessary for optimization of the diagnostic calls for ccRCC to fit the clinical workflow. For example, as intraoperative mass spectrometry is incorporated into the workflow, it is likely that thresholds will need to be adjusted regarding the number of pixels used to make a call of malignancy as well as cut-offs for identifying cancer in our metabolite panel. Regardless, excellent performance of our combined model on data show promise for considerable improvement in sensitivity for detecting cancer compared to present analysis of standard frozen sections. Finally, practical application of metabolic signatures will depend upon further development of technologies for portable and rapid mass spectrometry.
Conclusions
DESI-MSI is a promising technology for rapid analysis of tissue samples that can distinguish cancerous from normal kidney tissues. We have identified a wealth of new metabolites, including the lipidome, which can be used as diagnostic markers. This information can also be used to gain biological insights into ccRCC tumorigenesis. Our combined predictive model consisting of differentially expressed metabolites and the ratio of glucose to arachidonic acid can discriminate cancer versus normal tissue with an accuracy of 85.3%. As rapid mass spectrometry methods become incorporated into the clinical workflow, our data strongly suggest that determination of surgical margins in many diseases, including RCC, will be a fruitful application with potential to improve clinical outcomes.
Supplementary Material
Novelty and Impact:
Clear cell renal cell carcinoma (ccRCC), lethal kidney cancer subtype, represents metabolic heterogeneity. The authors use desorption electrospray ionization mass spectrometry imaging (DESI-MSI) to map the lipids and metabolites in core biopsies of fresh-frozen sections from partial nephrectomy. The molecular analysis of each pixel (200 µm) reveal the ratio of glucose to arachidonic acid as diagnostic marker, allows surgical margins to be identified with higher accuracy over H&E staining, which has a 15–30% misclassification rate.
Acknowledgements
This work was funded by the National Institutes of Health, Grant CA229933.
Abbreviations:
- ccRCC
clear cell renal cell carcinoma
- PN
partial nephrectomy
- PSM
positive surgical margin
- IFS
intraoperative frozen section
- H&E
hematoxylin and eosin
- DESI-MSI
desorption electrospray ionization mass spectrometry imaging
- DI
desorption ionization
- Lasso
least absolute shrinkage and selection operator
- AUC
area under the curve
- ROC
receiving operator characteristic
- TCA
tricarboxylic acid
- FA
fatty acid
- PG
glycerophosphoglycerol
- PS
glycerophosphoserine
- PI
glycerophosphoinositol
- PE
glycerophosphoethanolamine
- GLUT-1
glucose transporter 1
- VHL
von Hippel-Lindau
- HIFα
hypoxia-inducible factor α
- LDH-A
lactate dehydrogenase A
- COX
cyclooxygenase
- LOX
lipoxygenase
- DMF
dimethylformamide
- ACN
acetonitrile
- LTQ
linear trap quadrupole
Footnotes
Conflicts of interest:
The authors declare no potential conflicts of interest.
References
- 1.Leppert JT, Mittakanti HR, Thomas IC, Lamberts RW, Sonn GA, Chung BI, Skinner EC, Wagner TH, Chertow GM, Brooks JD. Contemporary Use of Partial Nephrectomy: Are Older Patients With Impaired Kidney Function Being Left Behind? Urology 2017;100: 65–71. [DOI] [PMC free article] [PubMed] [Google Scholar]
- 2.Laganosky DD, Filson CP, Master VA. Surgical Margins in Nephron-Sparing Surgery for Renal Cell Carcinoma. Current Urology Reports 2017;18: 8. [DOI] [PubMed] [Google Scholar]
- 3.Orosco RK, Tapia VJ, Califano JA, Clary B, Cohen EEW, Kane C, Lippman SM, Messer K, Molinolo A, Murphy JD, Pang J, Sacco A, et al. Positive Surgical Margins in the 10 Most Common Solid Cancers. Scientific Reports 2018;8: 5686. [DOI] [PMC free article] [PubMed] [Google Scholar]
- 4.Julien D, Pascal M, Matthew M, Onder K, Ryan N, Jaya C, H. KJ. Frozen Sections for Margins During Partial Nephrectomy Do Not Influence Recurrence Rates. Journal of Endourology 2018;32: 759–64. [DOI] [PubMed] [Google Scholar]
- 5.Shah PH, Moreira DM, Okhunov Z, Patel VR, Chopra S, Razmaria AA, Alom M, George AK, Yaskiv O, Schwartz MJ, Desai M, Vira MA, et al. Positive Surgical Margins Increase Risk of Recurrence after Partial Nephrectomy for High Risk Renal Tumors. Journal of Urology 2016;196: 327–34. [DOI] [PMC free article] [PubMed] [Google Scholar]
- 6.Khalifeh A, Kaouk JH, Bhayani S, Rogers C, Stifelman M, Tanagho YS, Kumar R, Gorin MA, Sivarajan G, Samarasekera D, Allaf ME. Positive Surgical Margins in Robot-Assisted Partial Nephrectomy: A Multi-Institutional Analysis of Oncologic Outcomes (Leave No Tumor Behind). Journal of Urology 2013;190: 1674–9. [DOI] [PubMed] [Google Scholar]
- 7.MM J, Hui Z, KS P, Robert A. Reexamining the Association Between Positive Surgical Margins and Survival After Partial Nephrectomy in a Large American Cohort. Journal of Endourology 2016;30: 698–703. [DOI] [PubMed] [Google Scholar]
- 8.Sidana A, Donovan JF, Gaitonde K. Surgeons’ preferences and practice patterns regarding intraoperative frozen section during partial nephrectomy. Urologic Oncology: Seminars and Original Investigations 2014;32: 864–8. [DOI] [PubMed] [Google Scholar]
- 9.Ramanathan R, Leveillee RJ. Ablative therapies for renal tumors. Ther Adv Urol 2010;2: 51–68. [DOI] [PMC free article] [PubMed] [Google Scholar]
- 10.Gordetsky J, Gorin MA, Canner J, Ball MW, Pierorazio PM, Allaf ME, Epstein JI. Frozen section during partial nephrectomy: does it predict positive margins? BJU International 2015;116: 868–72. [DOI] [PubMed] [Google Scholar]
- 11.Maruccia S, Seveso M, Casellato S, Provenzano M, Buffi N, Taverna G, Guazzoni G, Bozzini G. 790 - The role for frozen section analysis during partial nephrectomy: Outcomes after ten years of FU. European Urology Supplements 2017;16: e1369. [Google Scholar]
- 12.Ifa DR, Eberlin LS. Ambient Ionization Mass Spectrometry for Cancer Diagnosis and Surgical Margin Evaluation. Clinical chemistry 2016;62: 111–23. [DOI] [PMC free article] [PubMed] [Google Scholar]
- 13.Chughtai K, Heeren RMA. Mass Spectrometric Imaging for Biomedical Tissue Analysis. Chemical Reviews 2010;110: 3237–77. [DOI] [PMC free article] [PubMed] [Google Scholar]
- 14.Tibshirani R Regression Shrinkage and Selection Via the Lasso. Journal of the Royal Statistical Society: Series B (Methodological) 1996;58: 267–88. [Google Scholar]
- 15.Friedman JH, Hastie T, Tibshirani R. Regularization Paths for Generalized Linear Models via Coordinate Descent. 2010 2010;33: 22. [PMC free article] [PubMed] [Google Scholar]
- 16.Bates S, Tibshirani R. Log-ratio lasso: Scalable, sparse estimation for log-ratio models. Biometrics;0. [DOI] [PMC free article] [PubMed] [Google Scholar]
- 17.Eberlin LS, Tibshirani RJ, Zhang J, Longacre TA, Berry GJ, Bingham DB, Norton JA, Zare RN, Poultsides GA. Molecular assessment of surgical-resection margins of gastric cancer by mass-spectrometric imaging. Proceedings of the National Academy of Sciences 2014;111: 2436–41. [DOI] [PMC free article] [PubMed] [Google Scholar]
- 18.Eberlin LS, Margulis K, Planell-Mendez I, Zare RN, Tibshirani R, Longacre TA, Jalali M, Norton JA, Poultsides GA. Pancreatic Cancer Surgical Resection Margins: Molecular Assessment by Mass Spectrometry Imaging. PLOS Medicine 2016;13: e1002108. [DOI] [PMC free article] [PubMed] [Google Scholar]
- 19.Margulis K, Chiou AS, Aasi SZ, Tibshirani RJ, Tang JY, Zare RN. Distinguishing malignant from benign microscopic skin lesions using desorption electrospray ionization mass spectrometry imaging. Proceedings of the National Academy of Sciences 2018;115: 6347–52. [DOI] [PMC free article] [PubMed] [Google Scholar]
- 20.Banerjee S, Zare RN, Tibshirani RJ, Kunder CA, Nolley R, Fan R, Brooks JD, Sonn GA. Diagnosis of prostate cancer by desorption electrospray ionization mass spectrometric imaging of small metabolites and lipids. Proceedings of the National Academy of Sciences 2017;114: 3334–9. [DOI] [PMC free article] [PubMed] [Google Scholar]
- 21.Zhang J, Rector J, Lin JQ, Young JH, Sans M, Katta N, Giese N, Yu W, Nagi C, Suliburk J, Liu J, Bensussan A, et al. Nondestructive tissue analysis for ex vivo and in vivo cancer diagnosis using a handheld mass spectrometry system. Science translational medicine 2017;9: eaan3968. [DOI] [PMC free article] [PubMed] [Google Scholar]
- 22.Balog J, Sasi-Szabó L, Kinross J, Lewis MR, Muirhead LJ, Veselkov K, Mirnezami R, Dezső B, Damjanovich L, Darzi A, Nicholson JK, Takáts Z. Intraoperative Tissue Identification Using Rapid Evaporative Ionization Mass Spectrometry. Science Translational Medicine 2013;5: 194ra93-ra93. [DOI] [PubMed] [Google Scholar]
- 23.Linehan WM, Bratslavsky G, Pinto PA, Schmidt LS, Neckers L, Bottaro DP, Srinivasan R. Molecular diagnosis and therapy of kidney cancer. Annual review of medicine 2010;61: 329–43. [DOI] [PMC free article] [PubMed] [Google Scholar]
- 24.Eberlin LS, Ferreira CR, Dill AL, Ifa DR, Cooks RG. Desorption electrospray ionization mass spectrometry for lipid characterization and biological tissue imaging. Biochimica et Biophysica Acta (BBA) - Molecular and Cell Biology of Lipids 2011;1811: 946–60. [DOI] [PMC free article] [PubMed] [Google Scholar]
- 25.Eberlin LS. DESI-MS Imaging of Lipids and Metabolites from Biological Samples. In: Raftery D. Mass Spectrometry in Metabolomics: Methods and Protocolsed. New York, NY: Springer New York, 2014: 299–311. [DOI] [PubMed] [Google Scholar]
- 26.Tibshirani R Regression shrinkage and selection via the lasso: a retrospective. Journal of the Royal Statistical Society: Series B (Statistical Methodology) 2011;73: 273–82. [Google Scholar]
- 27.Bates S, Tibshirani R. Log-ratio lasso: Scalable, sparse estimation for log-ratio models. Biometrics 2018;0. [DOI] [PMC free article] [PubMed] [Google Scholar]
- 28.Tibshirani R Regression Shrinkage and Selection via the Lasso. Journal of the Royal Statistical Society Series B (Methodological) 1996;58: 267–88. [Google Scholar]
- 29.Deininger S-O, Cornett DS, Paape R, Becker M, Pineau C, Rauser S, Walch A, Wolski E. Normalization in MALDI-TOF imaging datasets of proteins: practical considerations. Analytical and Bioanalytical Chemistry 2011;401: 167–81. [DOI] [PMC free article] [PubMed] [Google Scholar]
- 30.Meuleman W, Engwegen JY, Gast M-CW, Beijnen JH, Reinders MJ, Wessels LF. Comparison of normalisation methods for surface-enhanced laser desorption and ionisation (SELDI) time-of-flight (TOF) mass spectrometry data. BMC Bioinformatics 2008;9: 88. [DOI] [PMC free article] [PubMed] [Google Scholar]
- 31.Pirro V, Alfaro CM, Jarmusch AK, Hattab EM, Cohen-Gadol AA, Cooks RG. Intraoperative assessment of tumor margins during glioma resection by desorption electrospray ionization-mass spectrometry. Proceedings of the National Academy of Sciences 2017;114: 6700–5. [DOI] [PMC free article] [PubMed] [Google Scholar]
- 32.Campbell S, Uzzo RG, Allaf ME, Bass EB, Cadeddu JA, Chang A, Clark PE, Davis BJ, Derweesh IH, Giambarresi L, Gervais DA, Hu SL, et al. Renal Mass and Localized Renal Cancer: AUA Guideline. Journal of Urology 2017;198: 520–9. [DOI] [PubMed] [Google Scholar]
- 33.Marszalek M, Carini M, Chlosta P, Jeschke K, Kirkali Z, Knüchel R, Madersbacher S, Patard J-J, Van Poppel H. Positive Surgical Margins After Nephron-Sparing Surgery. European Urology 2012;61: 757–63. [DOI] [PubMed] [Google Scholar]
- 34.Sans M, Zhang J, Lin JQ, Feider CL, Giese N, Breen MT, Sebastian K, Liu J, Sood AK, Eberlin LS. Performance of the MasSpec Pen for Rapid Diagnosis of Ovarian Cancer. Clinical Chemistry 2019;65: 674–83. [DOI] [PMC free article] [PubMed] [Google Scholar]
- 35.Hakimi AA, Reznik E, Lee C-H, Creighton CJ, Brannon AR, Luna A, Aksoy BA, Liu EM, Shen R, Lee W, Chen Y, Stirdivant SM, et al. An Integrated Metabolic Atlas of Clear Cell Renal Cell Carcinoma. Cancer Cell 2016;29: 104–16. [DOI] [PMC free article] [PubMed] [Google Scholar]
- 36.Wettersten HI, Aboud OA, Lara PN Jr, Weiss RH. Metabolic reprogramming in clear cell renal cell carcinoma. Nature Reviews Nephrology 2017;13: 410. [DOI] [PubMed] [Google Scholar]
- 37.Ambrosetti D, Dufies M, Dadone B, Durand M, Borchiellini D, Amiel J, Pouyssegur J, Rioux-Leclercq N, Pages G, Burel-Vandenbos F, Mazure NM. The two glycolytic markers GLUT1 and MCT1 correlate with tumor grade and survival in clear-cell renal cell carcinoma. PLOS ONE 2018;13: e0193477. [DOI] [PMC free article] [PubMed] [Google Scholar]
- 38.Girgis H, Masui O, White NM, Scorilas A, Rotondo F, Seivwright A, Gabril M, Filter ER, Girgis AH, Bjarnason GA, Jewett MA, Evans A, et al. Lactate dehydrogenase A is a potential prognostic marker in clear cell renal cell carcinoma. Mol Cancer 2014;13: 101-. [DOI] [PMC free article] [PubMed] [Google Scholar]
- 39.Courtney KD, Bezwada D, Mashimo T, Pichumani K, Vemireddy V, Funk AM, Wimberly J, McNeil SS, Kapur P, Lotan Y, Margulis V, Cadeddu JA, et al. Isotope Tracing of Human Clear Cell Renal Cell Carcinomas Demonstrates Suppressed Glucose Oxidation In Vivo. Cell Metabolism 2018;28: 793–800.e2. [DOI] [PMC free article] [PubMed] [Google Scholar]
- 40.Gebhard RL, Clayman RV, Prigge WF, Figenshau R, Staley NA, Reesey C, Bear A. Abnormal cholesterol metabolism in renal clear cell carcinoma. Journal of Lipid Research 1987;28: 1177–84. [PubMed] [Google Scholar]
- 41.Frański R, Gierczyk B, Schroeder G, Frańska M, Wyrwas B. Do hydrophobic interactions exist in the gas phase? Rapid Communications in Mass Spectrometry 2008;22: 1339–43. [DOI] [PubMed] [Google Scholar]
- 42.Afonso PV, Janka-Junttila M, Lee YJ, McCann CP, Oliver CM, Aamer KA, Losert W, Cicerone MT, Parent CA. LTB4 is a signal-relay molecule during neutrophil chemotaxis. Dev Cell 2012;22: 1079–91. [DOI] [PMC free article] [PubMed] [Google Scholar]
- 43.Zou Y, Palte MJ, Deik AA, Li H, Eaton JK, Wang W, Tseng Y-Y, Deasy R, Alimova M, Dančík V, Leshchiner ES, Viswanathan VS, et al. HIF-2α drives an intrinsic vulnerability to ferroptosis in clear cell renal cell carcinoma. bioRxiv 2018: 388041. [Google Scholar]
- 44.Du W, Zhang L, Brett-Morris A, Aguila B, Kerner J, Hoppel CL, Puchowicz M, Serra D, Herrero L, Rini BI, Campbell S, Welford SM. HIF drives lipid deposition and cancer in ccRCC via repression of fatty acid metabolism. Nature Communications 2017;8: 1769. [DOI] [PMC free article] [PubMed] [Google Scholar]
- 45.Tamura Y, Onguka O, Itoh K, Endo T, Iijima M, Claypool SM, Sesaki H. Phosphatidylethanolamine Biosynthesis in Mitochondria: PHOSPHATIDYLSERINE (PS) TRAFFICKING IS INDEPENDENT OF A PS DECARBOXYLASE AND INTERMEMBRANE SPACE PROTEINS UPS1P AND UPS2P. Journal of Biological Chemistry 2012;287: 43961–71. [DOI] [PMC free article] [PubMed] [Google Scholar]
- 46.Emoto K, Toyama-Sorimachi N, Karasuyama H, Inoue K, Umeda M. Exposure of Phosphatidylethanolamine on the Surface of Apoptotic Cells. Experimental Cell Research 1997;232: 430–4. [DOI] [PubMed] [Google Scholar]
- 47.Saito K, Arai E, Maekawa K, Ishikawa M, Fujimoto H, Taguchi R, Matsumoto K, Kanai Y, Saito Y. Lipidomic Signatures and Associated Transcriptomic Profiles of Clear Cell Renal Cell Carcinoma. Scientific Reports 2016;6: 28932. [DOI] [PMC free article] [PubMed] [Google Scholar]
- 48.Dill AL, Eberlin LS, Zheng C, Costa AB, Ifa DR, Cheng L, Masterson TA, Koch MO, Vitek O, Cooks RG. Multivariate statistical differentiation of renal cell carcinomas based on lipidomic analysis by ambient ionization imaging mass spectrometry. Analytical and Bioanalytical Chemistry 2010;398: 2969–78. [DOI] [PMC free article] [PubMed] [Google Scholar]
- 49.Leuthold P, Schaeffeler E, Winter S, Büttner F, Hofmann U, Mürdter TE, Rausch S, Sonntag D, Wahrheit J, Fend F, Hennenlotter J, Bedke J, et al. Comprehensive Metabolomic and Lipidomic Profiling of Human Kidney Tissue: A Platform Comparison. Journal of Proteome Research 2017;16: 933–44. [DOI] [PubMed] [Google Scholar]
- 50.Schaeffeler E, Büttner F, Reustle A, Klumpp V, Winter S, Rausch S, Fisel P, Hennenlotter J, Kruck S, Stenzl A, Wahrheit J, Sonntag D, et al. Metabolic and Lipidomic Reprogramming in Renal Cell Carcinoma Subtypes Reflects Regions of Tumor Origin. European Urology Focus 2019;5: 608–18. [DOI] [PubMed] [Google Scholar]
Associated Data
This section collects any data citations, data availability statements, or supplementary materials included in this article.