

Abstract
During the coronavirus disease 2019 (COVID-19) pandemic, the daily pattern of activities changed dramatically for people across the globe, as they socially distanced and worked remotely. Changes in daily routines created changes in water consumption patterns. Significant changes in water demands can affect the operation of water distribution systems, resulting in new patterns of flow, with implications for water age, pressure, and energy consumption. This research develops a digital twin to couple Advanced Metering Infrastructure (AMI) data with a hydraulic model to assess impacts on infrastructure due to changes in water demands associated with the COVID-19 pandemic for a case study. Using 2019 and COVID-19 modeling scenarios, the hydraulic model was executed to evaluate changes to water quality based on water age, pressure across nodes in the network, and the energy required by the system to distribute potable water. A water supply interruption event was modeled as a water main break to assess network resiliency for 2019 and COVID-19 demands. A digital twin provides the capabilities to explore and visualize emerging consumption patterns and their effects on the functioning of water systems, providing valuable analyses for water utility managers and insight for optimizing infrastructure operations and planning for long-term impacts.
Keywords: COVID-19; Water demand; Water distribution systems; Multi-modal failure; Resilience; Digital twin,
1. introduction
Smart sustainable cities are those that use connected technologies to improve the management of natural resources and infrastructure to better serve communities (Bibri and Krogstie, 2017). Smart cities applications are powered by Information and Communication Technology (ICT) and collect, wrangle, and analyze real-time data to guide urban management and decision-making. In the context of the built environment, smart cities technologies can be applied to improve the operation of infrastructure providing, for example, water, energy, transportation, and construction services (Berglund et al., 2020). Digital water approaches that use Big Data, the Internet of Things (IoT), ICT, and data analytics within the sociotechnical infrastructure of water systems can enable utilities to become more resilient, innovative, and efficient (Krause, Perciavalle, Johnson, Owens, Frodl, & Sarni, Sarni, White, Webb, Cross, & Glotzbach). Digital water meters and Advanced Metering Infrastructure (AMI) have grown in adoption across the water industry (West Monroe, 2017) and provide capabilities to record water consumption data at the account level at medium (hourly) and high (sub-hourly) temporal resolution (Nguyen, Stewart, Zhang, Sahin, Siriwardene, 2018, Pesantez, Berglund, Kaza, 2020a). Analysis of smart water meter data has contributed primarily to demand management, however, as part of conservation programs (Visser et al., 2021), end use modeling (Bethke et al., 2021), and leakage identification approaches (Booysen et al., 2019). Further research is needed to fulfill the promise of digital water in improving the resilience and efficiency of managing infrastructure. New frameworks can apply smart city technologies in a way that provides real-time operational decision-making for water supply and distribution.
The digital twin, as a smart city technology, provides an approach to use real-time data to improve management of water infrastructure. The digital twin is a dynamic digital replica of a system and mimics its real-world behavior (Bolton et al., 2018). A digital twin integrates streaming big data reported at high temporal and spatial resolutions with model-based simulations to represent and predict current and future conditions of a physical counterpart (Lu et al., 2020a). Digital twins can store infrastructure data and provide capabilities to share and visualize information safely and securely among stakeholders (Lu et al., 2020a). The digital twin approach automatically integrates data from diverse sensors with the simulation of physical processes, and users can analyze and manage information for making operational decisions in real-time (Berglund et al., 2020). The digitalization of infrastructure and community behaviors provides new capabilities for sustainable urban management. An important component of sustainable urban management is disaster response, and digital twins have an important application in the context of disasters due to their capabilities to support real-time decision-making across an urban area. Disasters in cities tend to evolve rapidly with emerging complexities, as hazards shock entwined social and technical systems, and consequences cascade across interconnected infrastructure systems. Community disaster management must synthesize the unique characteristics of a community and disaster to anticipate consequences and select mitigating responses (Lindell et al., 2007). The digital twin approach can couple multi-data sensing, data analytics, decision-making, and network analysis to improve emergency management (Fan, Zhang, Yahja, Mostafavi, 2021, Ford, Wolf, 2020). New sociotechnical frameworks that integrate real-time data on the location, decisions, and behaviors of community members with infrastructure simulation modeling can be used to visualize, predict, and guide mitigation of consequences as a disaster unfolds.
The coronavirus disease 2019 (COVID-19) pandemic caused by the severe acute respiratory syndrome coronavirus 2 (SARS-CoV-2) created an unprecedented disaster for urban managers across the globe. The pandemic disrupted daily habits and behaviors: the disease led to a significant loss of life; people who were exposed or infected were quarantined and unable to carry out typical tasks and routines; and communities adopted social distancing practices to reduce transmission. Changes in daily patterns associated with social distancing and working from home led to changes in the use of infrastructure, as people avoided places of business, industries, and institutions (Xie et al., 2021). Impacts of the pandemic on infrastructure and the environment have been reported for transportation systems (Goenaga et al., 2021), the construction industry (Alsharef et al., 2021), air quality (Berman and Ebisu, 2020), natural water systems (Braga et al., 2020), and water utilities (Berglund, Thelemaque, Spearing, Faust, Kaminsky, Sela, Goharian, Abokifa, Lee, Keck, et al., 2021b, Spearing, Thelemaque, Kaminsky, Katz, Kinney, Kirisits, Sela, Faust, 2021). This research focuses on the consequences for drinking water distribution infrastructure due to changes in the timing, types, and magnitude of water demands. New patterns in residential and non-residential demands can create unexpected hydraulic dynamics, which affect the performance and resilience of water systems. While utilities across the globe reported changes in water consumption (Spearing et al., 2021), few were able to report on the real-time effects on water infrastructure hydraulics and operations. As described above, a digital twin can provide the functionality to collect and analyze important real-time information for decision-making during disasters. Digital twins were developed to understand unfolding events and mitigate consequences during the COVID-19 pandemic in the context of supply chain management and suppression of disease transmission (Ivanov, 2020, Pang, Huang, Zie, Li, Cai, 2021). Specifically, digital twins were applied to analyze disruptions in supply chains caused by the closing and re-opening of facilities (Ivanov, 2020) and to predict infection rates in cities based on climate conditions, response policies, and mobility (Pang et al., 2021). Digital twins are needed in the water industry to visualize and analyze the short-term effects of disruptions on water systems and to provide insight and decision-making support for making necessary adjustments to operations, with application for COVID-19 scenarios and other disasters.
One component of a water distribution system digital twin is a hydraulic model. Many water utilities develop and use hydraulic models to analyze hydraulic and quality conditions. Hydraulic models are typically designed using census data and guidelines that are based on daily demand profiles and peaking factors (Gurung et al., 2014). Hydraulic models have been conventionally used for planning purposes to analyze alternative scenarios, rather than for assessing and planning real-time operations (AWWA, 2014). Prior to the availability of smart meters data collected at the account-level, model input about water demands were approximate, highly uncertain, and did not capture variability in realistic demands (Kang, Lansey, 2009, Kun, Tian-Yu, Jun-Hui, Jin-Song, 2015). AMI, on the other hand, provides accurate and precise data about water demands and facilitates the development of a model that can accurately simulate and predict hydraulic conditions at a smaller time step and spatial scale (Shafiee et al., 2020). A digital twin can be developed by coupling water system models with big data collected through AMI and Supervisory Control and Data Acquisition (SCADA) for both operational and planning purposes (Conejos Fuertes, Martínez Alzamora, Hervás Carot, Alonso Campos, 2020, Gurung, Stewart, Beal, Sharma, 2016). Digital twins that are applied for water systems can reduce uncertainty in model parameters, integrate social data, reduce risk and uncertainty during emergency management, and enable advanced modeling of coupled sociotechnical systems (Shafiee et al., 2018).
This research describes the development and application of a digital twin to explore how changes in water demands during the COVID-19 pandemic affected hydraulics and energy consumption. The framework described here links AMI data with a hydraulic model through a wrapper that aggregates individual demands at nodes and writes input for the hydraulic model, based on the framework developed by Shafiee et al. (2020). The approach demonstrated here advances conventional hydraulic modeling by applying AMI data directly for demand assignment in hydraulic models rather than processing SCADA data to calibrate demands. The digital twin is applied for a medium-sized utility that serves a population of approximately 60,000 people, and AMI water consumption data are reported at hourly intervals for approximately 20,000 accounts. Scenarios are created to compare hydraulic performance for pre-pandemic (2019) demands with hydraulic performance during the COVID-19 pandemic. The effect of changing water demand on hydraulic performance is evaluated using metrics that have been developed to assess the impacts of demand management programs (Mazumder, Salman, Li, Yu, 2018, Zhuang, Sela, 2020) and include pressure, energy consumption, and water quality. The digital twin is applied for a multi-modal failure when a water outage concurs with altered demands that are associated with social distancing during the COVID-19 pandemic. This research explores how a digital twin can be used to gain insight into changes in the level of service associated with shifting demands, which can be used within a real-time disaster response decision-making framework for water infrastructure management.
This paper is organized as follows. Section 2 provides background on water demand and infrastructure impacts during the COVID-19 pandemic and the use of digital twins in the drinking water sector. Section 3 describes the methodology and the computational components that constitute the digital twin in this framework, including the water demand data set and the water network model. In Section 3, we also present a description of metrics that are used to compare water demand scenarios representing pre-pandemic periods (denoted as 2019) and a period during the COVID-19 pandemic, which affected water use in the U.S. beginning in the year 2020. Section 4 describes the illustrative case study of this research. Section 5 presents the results and analysis of demand scenarios and explores how the digital twin could be used to visualize emerging data during a multi-modal failure, such as a water outage during times of social distancing caused by a pandemic. Finally, Section 6 provides a discussion of the implications of this research, and Section 7 summarizes the conclusions of the study.
2. background
This section reviews research in four areas: the development of digital twins within the smart city paradigm, applications of digital twins for disaster management, the development of digital twins for the drinking water sector, and reports of changes in water demand due to social distancing practices and policies that were implemented during the COVID-19 pandemic. A mind map (Fig. 1 ) demonstrates the connections among the works described below and identifies a gap in the development and use of digital twins for water distribution systems.
Fig. 1.

Graphical representation of the literature review related to Digital Twins as part of the smart city paradigm, applications for disaster management, and digital twin models for water distribution systems based on real-time demand data reported by smart meters.
2.1. digital twins and smart cities
A major driver in the development of digital twins is for application within the field of manufacturing (Davila Delgado and Oyedele, 2021). For example, Lu et al. (2020b) applied a digital twin to detect anomalies in heating, ventilation, and air conditioning (HVAC) data and identify malfunctioning pumps. Other applications of digital twins assess structural conditions in complex buildings to deploy preventive maintenance. For example, Angjeliu et al. (2020) modeled the structural conditions of a Milan cathedral to predict damage and prescribe preventive maintenance activities. The authors highlight the importance of developing digital twins to facilitate an approach that merges observed data with models of complex systems. Recently, the need to develop models of human-building interactions has grown more salient to capture the effects of growing variability in the patterns of building use during the COVID-19 pandemic, due to social distancing and working remotely. For example, Xie et al. (2021) incorporate occupancy and behavioral parameters in prescribing facility and energy management strategies. Their digital twin captures the effects of changes in behavioral patterns on the decision-making processes of building management.
Cities around the world are retrofitting infrastructure components with ICT equipment to improve infrastructure services and the livability of their population. Sensors deployment and smart technologies, such as IoT, that measure, broadcast, predict, and optimize data at near or real-time have contributed to the development of digital twins for machines and systems (Tao and Qi, 2019). Mohammadi and Taylor (2017) developed a smart city digital twin paradigm, where an analytic platform simulates spatiotemporal fluctuations in the city of Atlanta, GA. The study highlights that transforming cities into smart cities tightens the interactions of humans, infrastructure, and technology. Access to real-world data that describes human-infrastructure interdependencies is still lacking, but is needed to accurately model cities as complex adaptive systems. One example of the digitalization of cities is described by Schrotter and Hürzeler (2020) for the city of Zurich. The 3-D representation of the city’s built environment is accurate at a high resolution and is used for urban planning. Operational conditions of utility components (i.e., pipelines) are not merged into the city’s visual representation, and real-time analyses of municipal services are not readily available at the system level. O’Dwyer et al. (2020) developed a digital twin as a management tool for the energy sector that can be used in an operational context to optimize energy assets across a city. The framework integrates the IoT and machine learning to develop forecasting approaches for energy networks.
2.2. digital twins and disaster management
The digital twin and smart cities paradigm have been applied to explore improvements in disaster management. As extreme events evolve, a dynamically interconnected city or community may respond better and faster than a traditionally static community. For example, Ford and Wolf (2020) presented a Smart City Digital Twin (SCDT) that can be applied for disaster management, where measured, broadcasted, and simulated data are coupled with a community simulation model and digital imaging tools. The procedure’s output can be used for planning, management, and decision-making at the community level. Researchers have addressed the complexity of human-building interactions during extreme events through analyzing data from social networks (e.g., Twitter) and using new insight to respond to and mitigate the effects of disasters on a community (DiCarlo, Berglund, 2021, Fan, Jiang, Mostafavi, 2020). Extreme events or disasters management responses have the potential to be improved with the development of digital twin models (Shahat et al., 2021).
2.3. water demand changes and infrastructure impacts during the COVID-19 pandemic
Social distancing and new practices around working from home during the COVID-19 pandemic changed the timing and spatial distribution of water demands. The City of Melbourne, Australia, for example, reported that weekend diurnal patterns emerged on weekdays as people shifted demands (Melbourne Water, 2020). Research studies that have been conducted to explore and report changes in water consumption during the COVID-19 pandemic. In general, changes in demands vary based on the make-up of a utility’s customer base (Cooley et al., 2020). Residential users tended to increase demands, while non-residential users decreased demands (Kalbusch, Henning, Brikalski, de Luca, Konrath, 2020, Spearing, Thelemaque, Kaminsky, Katz, Kinney, Kirisits, Sela, Faust, 2021). For example, through a survey of 28 water utilities in the U.S., Spearing et al. (2021) found that 43% of utilities surveyed reported an increase in residential water demand, 46% reported a decrease in commercial water demand, and 21% reported a reduction in industrial water demand. For another eight U.S. utilities that were surveyed in a separate research study, residential consumption increased compared to previous years (Eastman et al., 2020). University towns reported drastic reductions in demands due to emigrating populations (American Water Works Association, Balacco, Totaro, Iacobellis, Manni, Spagnoletta, Piccinni, 2020, Spearing, Thelemaque, Kaminsky, Katz, Kinney, Kirisits, Sela, Faust, 2021), and commercialized communities reported significant reductions in water use during lockdown periods (Cooley et al., 2020). Balacco et al. (2020) reported that the total daily volume of demands was not affected by a lockdown for small towns in Italy. For large cities, demands which are typically exerted at businesses shifted to residential supply zones, and in some cases, overall demands decreased due to a lack of incoming commuters (Balacco, Totaro, Iacobellis, Manni, Spagnoletta, Piccinni, 2020, Kalbusch, Henning, Brikalski, de Luca, Konrath, 2020). Larger metropolitan areas reported small changes in consumption overall, due to a diversity of residential, commercial, and industrial demands that were impacted in diverse ways (Cooley et al., 2020).
Other studies demonstrated that the diurnal pattern of demands shifted. Balacco et al. (2020) reported a notable delay in the morning peak demand for five Italian cities, by up to 2.5 hours for some cities. The peak associated with lunchtime disappeared for one city; the volume of water consumed during weekends significantly increased for a small town; and the peak around dinnertime was less pronounced for all cities, compared to patterns in March and April of 2019. A similar trend was observed for a utility in Germany, where morning and evening peak demands were higher, and morning peaks were shifted later (Ludtke et al., 2021).
Demands that changed in response to new social distancing behaviors during the COVID-19 pandemic can have multiple effects on pipe infrastructure systems. Changes in water demands can affect the quality of drinking water. Just as a lack of flow in indoor pipes increases the water age in premise plumbing systems - leading to low disinfectant residuals, formation of disinfection byproducts, intensification of corrosion, nitrification, re-growth of microorganisms, and biofilm formation (Asadi-Ghalhari and Aali, 2020) - low water quality may emerge in pipe networks as demands in some areas decrease. The closing of multiple industries or businesses in a neighborhood can affect circulation in a network and lead to high water age and degraded water quality. Guidelines and recommendations have been developed for reopening buildings after shut-downs related to COVID-19 to avoid or mitigate stagnation issues (Proctor et al., 2020). In their survey of 28 utilities, Spearing et al. (2021) found that only six utilities reported problems with water quality during the COVID-19 pandemic. Changing demands may also affect energy consumption and pressures, with higher non-revenue losses at leaks associated with higher pressures, but these secondary effects of changing demands have not been reported for utilities during the COVID-19 pandemic. This research explores how the changes in demands associated with policies related to coping with the COVID-19 pandemic affected water distribution hydraulics on a short timescale, using metrics measured over hourly, daily, and weekly time steps.
2.4. digital twins and water distribution networks
The digital twin has been explored through a limited number of studies for water infrastructure applications. Shafiee et al. (2018) proposed a framework to integrate big data and water systems models in a data cycle that connects environmental sensors with a data lake and water system model. Their proposed framework collects big data from environmental sensors (e.g., AMI and SCADA data); stores the data in a data lake; automatically runs analytics to clean and process the data; uses middleware and a wrapper to prepare the data for input to a water system model; and saves model results to the data lake. Components of the concept were implemented as a digital twin for a water distribution system through the use of a dynamic demand assignment module that automatically assigns streaming AMI data to nodes for input to a hydraulic model (Shafiee et al., 2020). Conejos Fuertes et al. (2020) further extended the concept of a digital twin for the city of Valencia, Spain. The digital twin automatically updates the status of infrastructure elements using SCADA data and consumption at nodes using AMI data. Additional algorithms are integrated to use GIS data to update the topology of infrastructure networks; filter and correct raw SCADA data; and calculate user demands at accounts without smart meters. The digital twin can be run in real-time and is updated every minute with SCADA data that details demands, pressures, water levels, and the status of elements.
The framework reported by Shafiee et al. (2020) implements a digital twin through components that translate streaming AMI data for input to a hydraulic model in real-time. Model results as reported through the digital twin are compared for normal operating conditions with system measurements. The framework reported in this manuscript uses manually operated middleware to acquire raw data from the data lake and a manual approach to clean data. An automated wrapper aggregates AMI data and passes new input files to the hydraulic model. The contributions of the digital twin reported here are in the application to explore infrastructure changes on an hourly basis during extreme events such as the COVID-19 pandemic. This research demonstrates the use of a digital twin for infrastructure operational decision-making in the context of emergency management. This research conducts further simulations to explore how the digital twin can provide new insight during a multi-modal failure at the intersection of a water outage and changes in water demands related to lockdowns, remote work, and social distancing in response to extreme events such as the COVID-19 pandemic.
3. methods and materials
3.1. digital twin
The digital twin framework that is used in this research is shown in Fig. 2 . This framework uses components of the data cycle described by Shafiee et al. (2018). The framework was developed using three programming languages. R and the stringr package were used to access AMI raw data (R Core Team, Wickham). Python programming language and the scikit-learn package (Pedregosa, Varoquaux, Gramfort, Michel, Thirion, Grisel, Blondel, Prettenhofer, Weiss, Dubourg, Vanderplas, Passos, Cournapeau, Brucher, Perrot, Duchesnay, 2011, Van Rossum, Drake, 2009) were used for data cleaning, building the wrapper, and analyzing changes in water demand. The EPANET-MATLAB toolkit (Eliades, Kyriakou, Vrachimis, Polycarpou, 2016, MATLAB, 2020, Rossman, Woo, Tryby, Shang, Janke, Haxton, 2020) was used for hydraulic simulation and analysis of infrastructure impacts. Each component of the framework is described as follows.
Fig. 2.

Digital twin couples computational modules within a water data cycle (Shafiee et al., 2018).
3.1.1. advanced metering infrastructure data set
Water demand data from a participating water utility was used as a component of the digital twin. AMI measures consumption at the user-level and reports consumed volumes in cubic feet at an hourly time step.
3.1.2. middleware
AMI data were uploaded originally to an Application Programming Interface (API) by the utility's partner. A script in R (v1.4.1717) was developed to request the data. The request includes the start and end times and the temporal resolution of data, ranging from hourly to monthly intervals. While data acquisition equipment such as SCADA reports data at sub-hourly time steps, demand data from AMI projects typically broadcast information at hourly time steps to preserve battery life of equipment (Nguyen, Stewart, Zhang, Sahin, Siriwardene, 2018, Pesantez, Berglund, Kaza, 2020a). For projects that integrate sub-hourly SCADA data and AMI hourly data, modeling procedures need to temporally aggregate data prior to model-based analysis. In this research, SCADA data are not included, and the model time step is set equivalent to the frequency of AMI data reports (one hour). A temporary token is requested to access the API prior to downloading, and the data are downloaded in Extensible Markup Language (XML) format. Finally, the data format is transformed from XML to comma-separated values (CSV).
3.1.3. data cleaning and analytics
The parsed data is cleaned to exclude all incomplete data logs of smart meters or logs that show only zero consumption. Missing, incomplete, zero, or negative records are considered as a malfunction or disconnection of the smart meter, using assumptions applied in similar research (Pesantez et al., 2020a). Preliminary analysis was performed to preserve data continuity. A meter was excluded from the analysis if it reported zero consumption for more than 720 consecutive hours (approximately a month), based on the assumption that those meters correspond to an empty building or a malfunctioning smart meter.
3.1.4. wrapper
The AMI dataset is transformed from a dataframe reporting smart meter consumption data at each time step (one hour) to edit the original demand pattern multipliers of the hydraulic model input file. A hydraulic model is the graphical and operational representation of a water distribution system where production, storage, and consumption points such as reservoirs, tanks, and users are represented by nodes; and pipes, valves, and pumps are represented by links (Rossman et al., 2020). In the vast majority of hydraulic models, nonzero demand nodes represent the consumption of several spatially aggregated users in a model, known as a skeletonized version of the system (Walski et al., 2003). For this application, AMI data is available at smart meters to report specific demand for each consumer (e.g., household, industrial user, commercial unit). A wrapper, or script, is used to aggregate smart meter data into nodal patterns that can be used within a skeletonized model. Aggregated demand patterns serve as input to the hydraulic model. The wrapper inputs are the AMI data, the original hydraulic model, and the coordinates of the smart meters. The geographical coordinates of each smart meter are converted into x and y coordinates, which are consistent with the scale used by the hydraulic model.
The wrapper is implemented in Python 3.7 with the scikit-learn package (Pedregosa et al., 2011). The wrapper uses the k-nearest neighbors algorithm (k-NN) to search for smart meters that are neighbors of each nonzero demand node of the water distribution system (Triguero et al., 2019). Smart meters are represented by data points using the same geographic projection as the network nodes. The Euclidean distance is calculated from meters to network nodes, and the k-NN assigns groups of smart meters to the nearest nonzero demand nodes. The number of meters in each cluster depends on the granularity level (e.g., level of skeletonization) of the water network model and the network topology. In this study, the average number of meters per cluster is assigned as the ratio of the number of smart meters to the number of nonzero demand nodes (15). Hourly demands are summed for each group of smart meters that are associated with a node to update the demand pattern for that node in the input file for the hydraulic model. This process generates a new hydraulic model that includes the original entries (e.g., pipe connections, tanks, pumps, and controls) in addition to updated demand patterns, with a unique demand pattern for each node in the network. The period of the demand patterns (number of hours included) is specified based on the simulation scenario.
3.1.5. hydraulic model
The EPANET v2.2.0 toolkit is used as the hydraulic simulator to analyze the water network (Eliades, Kyriakou, Vrachimis, Polycarpou, 2016, Rossman, Woo, Tryby, Shang, Janke, Haxton, 2020). The model is initiated from an input text file, which lists and specifies pipe layout based on nodes and connections between nodes; pump and valve placement; pipe characteristics, including, length, diameter, and roughness; elevation and demands exerted at nodes; pump curve characteristics; and operational rules for controlling pumps and valves. Through the use of the wrapper (subSection 3.1.4), the patterns of demands are re-written at each nonzero demand node within the input file. The hydraulic solver computes head and flows at nodes and pipes for each time step of an extended period simulation (EPS). This process is executed for a pre-defined duration. Pattern multipliers at each node in the hydraulic model represent the water demand reported by smart meters and depend on the temporal resolution used to report smart meter data (e.g., hourly smart metered data are used to create hourly pattern multipliers). As most water utilities have skeletonized models representing their water systems, aggregating demands from several smart meters into a network node makes it feasible to perform hydraulic and quality analyses (Perelman et al., 2008). For applications that use an all-pipes model, this method would not require the wrapper to aggregate demands. However, the computing resources associated with an all-pipes model may limit the scalability of the approach.
3.2. performance metrics
Zhuang and Sela (2020) modeled alternative demand management strategies to evaluate performance across seven benchmark water networks. They used the following metrics to assess hydraulic performance of networks under changing demand profiles.
3.2.1. total water consumption
The volume of water produced by drinking water treatment plants and delivered to the network is reported for management purposes. The volume of demands, or consumed water, provides a general understanding about how much water the system distributes. Consumption curves are also reported for inspection. The total water consumption is calculated as shown in Eq. (1):
| (1) |
where is the total volume of water consumed by the system (); represents the base demand () of each water network node () and defined based on the demographic and level of service characteristics of the system for nodes with nonzero demand values (Kang and Lansey, 2009); is a multiplier that accounts for the water variability over time at each simulation time step and summed across the total time steps (). A change in the demand nodes will follow a change in the total volume of water consumed by the system.
3.2.2. average system pressure
Pressure is directly associated with demand in water distribution systems, and decreases in demands lead to high pressures in the system, if operations are not adjusted. The average pressure of the system () is calculated as the average of the pressure values for all the nodes of the system at a time step, as shown in Eq. (2).
| (2) |
where is the pressure in of node at time step ; and is the number of nodes of the network.
3.2.3. energy consumption
Distributing water to customers involves the production and consumption of energy, and shifting demands can also lead to changes in energy consumption across water systems (Beal, Gurung, Stewart, 2016, Friedman, Heaney, Morales, Palenchar, 2014). Energy is calculated as the sum of the energy produced by pumps in the system. The energy is calculated in for each pump connecting nodes and of the network as shown in Eq. (3):
| (3) |
where is the specific weight of water expressed in ; is the flow rate of pump at time in ; and is the absolute difference of heads between the nodes and ; is the time step of the hydraulic simulation. As shown in Eq. (3), it follows that a reduction in water demand may produce a reduction in energy consumed by the pumps of the system.
3.2.4. water age
Water age represents the time potable water resides in the network. Water age is calculated based on the time it takes water to move through the pipes of the system and the time water may spend in the storage tanks (Eq. 4) (Cheng et al., 2015). Water age is a proxy for water quality and can reveal stagnation problems and bacterial regrowth due to the decay of residual chlorine. When working with hydraulic analysis of water networks, water age should not be higher than 48 hours at the end of a week of simulation (Marchi et al., 2014). The water age metric indicator that is implemented here reports the median water age in the network at the end of the hydraulic simulation (Zhuang and Sela, 2020). The water age is calculated at each node in the network, based on the number of pipes through which water travels from the source to node :
| (4) |
where represents the water age of node in and is the time water spends on each pipe to move from the source to the point of consumption at node . EPANET calculates water age as a zero-order reactive constituent with a rate constant of 1.0. Therefore, at each simulated second, water becomes a second older (Rossman et al., 2020). As velocity is one of the main factors that affect the residence time of water, low nodal demands produce high water age values.
4. illustrative water system: Lakewood, california
The City of Lakewood, California, is in Los Angeles County, with a population of 80,048 at the 2010 census. The Lakewood water utility serves approximately 60,000 customers, pumping water from groundwater wells. The infrastructure system includes five storage tanks, 15 operational pump stations, and 180 miles of 4 inch and larger water pipes (Fig. 3 ). Lakewood installed smart meters at each of its approximately 20,286 accounts in 2018 (WaterWorld, 2017), which report hourly demand. AMI data reports demands for customer types, as follows: 95% of accounts are residential, and 5% correspond to commercial and institutional users. Residential users exert 88% of the total demand. The AMI system includes a customer portal with an online utility billing platform and advanced analytics. The highest resolution of water data that is available for this study was collected at hourly intervals. Results are presented for different temporal resolutions (e.g., hourly, weekly, and monthly) to assist water managers with a comprehensive analysis of the system’s performance. The details of each modeling scenario are described below.
Fig. 3.

Lakewood water system. (a) Smart meters (b) Infrastructure components, including reservoirs, pipes, pumps, and valves.
Two years of data were downloaded, covering the period of July 1, 2018 - June 30, 2020. Data are downloaded by month in files of two gigabytes. Files were converted from XML to CSV, which reduced the size of the entire dataset from 48 to 2.48 gigabytes. The dataset was cleaned using the approach described in subSection 3.1.3, which reduced the dataset size from 20,286 to 19,985 smart meters.
Data were analyzed to determine demand patterns under normal operating conditions. The average network consumption was 835 m/h (29,476 ft/h) for the 2019 fiscal year (July 2018 - June 2019), with a standard deviation of 337 m/h (11,887 ft/h). The diurnal demand curve has two peaks, at 6:00 am and 8:00 pm with total consumption of 420,943 m (14,865,452 ft) and 379,084 m (13,387,209 ft), respectively. The consumption drops below the average during night time from 11:00 pm to 3:00 am and from 12:00 pm to 4:00 pm.
4.1. modeling scenarios
Water demand scenarios are created using consumption data from two equivalent periods starting in March 2019 and 2020. Eight weeks in 2020 were selected, beginning from the date that a state-wide stay-at-home order was issued for the state of California. The period of analysis for the COVID-19 scenario is Monday, March 23, - Sunday, May 17, 2020. An equivalent period from 2019 was selected to compare water consumption and is based on similar dates and days of the week, corresponding to the period of Monday, March 25, to Sunday, May 19, 2019. The 2019 scenario refers to the weeks in 2019, and COVID-19 scenario refer to the weeks in 2020.
The water network is simulated using an extended period of simulation of 1344 hours (eight weeks), using a 1-hr hydraulic time step. The network controls and pump curves remain unchanged for both scenarios to evaluate the effects of water demand variation. The utility did not adjust infrastructure controls during the COVID-19 pandemic. The hydraulic model of the Lakewood water system is a skeletonized version, where a nonzero network node represents an average of 15 accounts (see subSection 3.1.4). The skeletonized version of the network may create some barriers to in digital twin approach, as the pipe flows and hydraulic performance cannot be simulated at finer resolution with the existing model. Further research can develop an all-pipes model for this application and explore the necessary level of simulation required to best support a digital twin approach.
5. results
5.1. water demand
One week of water demand data for the 2019 and COVID-19 scenarios are shown in Fig. 4 . For the 2019 scenario, water demand demonstrates a typical diurnal curve with two peaks, one in the morning and one in the evening. The two-peak curve is characteristic of residential water consumption (Blokker, Vreeburg, Van Dijk, 2010, Omaghomi, Buchberger, Cole, Hewitt, Wolfe, 2020). During the stay-at-home order corresponding to COVID-19 conditions beginning in March 2020, the morning peak nearly vanished and fell to 67% of the peak in 2019. The daily evening peak varies in magnitude and remains lower than the evening peak under 2019 conditions. For the COVID-19 scenario, the evening peak is not impacted as dramatically as the morning peak, especially during the weekends where water demand under COVID-19 represents 90% of the demand under 2019 conditions on Saturday and 78% on Sunday.
Fig. 4.

Total hourly water demand for one week over the two-month period starting at Monday March 25, 2019 for the 2019 scenario and Monday March 23, 2020 for the COVID-19 scenario.
The average hourly water demands for the eight weeks of the COVID-19 scenario are shown separately for each week in Fig. 5 a. Total demands during the first week of the shut-down remain low throughout the day, when compared with average 2019 hourly demands (shown as the bold line in Fig. 5a). This trend is driven by the change in residential demand (Fig. 5b), which makes up a significant portion of the total demand. The first four weeks show that the morning peak was shifted from 6:00 to 11:00 am and was reduced in magnitude to approximately 50% of the morning peak demand reported for the 2019 scenario. The evening peak remains at 7:00 pm and was reduced to approximately 75% of the 2019 value. Over the eight-week period, the morning peak of the residential demand recovered to the average peak value for the 2019 scenario and occurred at the same hour of the day as reported in the 2019 scenario. The evening peak recovered to a value that exceeds the evening peak of the 2019 scenario by 25%. The total volume of demand during week 8 of the COVID-19 scenario is 6.82E m, compared with 7.90E m, which is the average weekly volume of demand for the 2019 scenario. In general, the following trends are observed: demands remain low for weeks 1–4, with incremental adjustments. In weeks 5–8, evening peaks exceed the evening peak of the 2019 scenario, and morning peaks reach pre-COVID-19 values by week 7. California’s stay-at-home order was lifted on May 8, 2020, when the state entered Stage 2 for reopening (State of California Office of the Governor, 2020). May 8, corresponds to week 7 in the data, and behaviors around water began to normalize at pre-COVID-19 levels in weeks 5 and 6.
Fig. 5.

Average hourly water demand for the eight-week period for (a) all customers, (b) residential, and (c) non-residential customers. Bold black line shows average demand over all days in eight weeks of 2019. Light lines show average demand over one week in 2020, and labels indicate corresponding weeks (1 = March 23–29; 2 = March 30-April 5; 3 = April 6–12; 4 = April 13–19; 5 = April 20–26; 6 = April 27-May3; 7 = May 4–10; 8 = May 11–17, 2020).
The non-residential demand dropped to very low consumption values during the first week of the shut-down (Fig. 5c). Account data shows that 30 fast-food restaurants had a slight increase in total demand (0.44%), compared with 2019 week 1 demands. Most non-residential accounts reduced demands drastically. User types including auto services, beauty salons, car washes, supermarkets, theaters, and schools reduced demands substantially, by more than 40%. Other non-residential accounts, including 12 nurseries and 30 churches, generated a reduction of 30% in the volume of demands at those 42 accounts during week 1 of the COVID-19 scenario, compared with week 1 of the 2019 scenario. Irrigation accounts reduced demands by varying amounts. During week 1, two large irrigation meters reduced total demand by 8%; 50 medium irrigation meters reduced demands by 25%; and 131 small irrigation meters reduced demand by 40%. Irrigation meters exert a large volume of non-residential demands overnight, or from the hours 9:00 pm to 3:00 am, which leads to the demand pattern shown in Fig. 5c. Non-residential demands during the working hours and evening recovered by week 5 to pre-COVID-19 levels, and early morning demands reached pre-COVID-19 levels by week 6.
Finally, the daily total demand over the two month period is shown in Fig. 6 . This figure shows that the peak daily demand varies between 500 and 1500 m/h at the system level until day 32 during the COVID-19 scenario. After day 32, peak daily demand varies between 1100 and 2400 m/h, similar to the daily peak demand for the 2019 scenario.
Fig. 6.

Total nodal demand for the 2019 and COVID-19 eight week periods.
Total water demand is reported for the month prior to the onset of the pandemic to provide a baseline for assessing the results shown in Fig. 6. Demand during the months of February 2019 and February 2020 are compared in Fig. 7 . These results demonstrate that the daily demand recorded during February 2019 is approximately equivalent to the demand for February 2020 and highlight the severity of the difference between the 2019 and COVID-19 scenarios shown in Fig. 6.
Fig. 7.
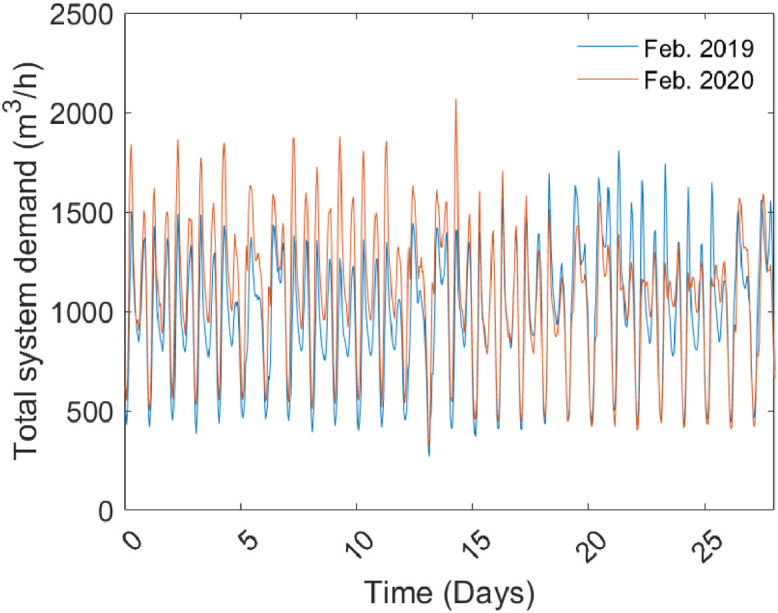
Total nodal demand from February 2019 and February 2020 before the response actions to the COVID-19 pandemic.
5.2. network hydraulic analysis
Network performance is compared for the two scenarios based on system average pressure, energy consumption, and water age.
5.2.1. system average pressure
The average system pressure increases due to the decrease in water demand in the Lakewood network (Fig. 8 ) during the first 32 days of the COVID-19 scenario. Mirroring the return of demands, the pressure returns to normal operating conditions after 32 days, when pressure variations match those of the 2019 scenario. During the first week of the shelter-in-place order, the average pressure across the system reached up to 65 m, and after demands increased closer to 2019 conditions, the pressure values decreased to a range of 45 to 50 m. Increased pressures during the first 32 days should be monitored, as they can lead to increases in the volume of water lost from leaks or cracks in the system (Schwaller and van Zyl, 2015). The water network hydraulic model uses demand-driven analysis. The model adjusts the nodal pressure to satisfy the demand of each nonzero demand node throughout the simulation (Laucelli et al., 2012). This simulation does not capture any changes to valves during the 2019 and COVID-19 scenarios. SCADA data can be acquired and explored to determine if modifications were made by system operators. In this approach, we do not incorporate SCADA, but focus on editing demand on a real-time basis to update the results of the hydraulic model without editing the infrastructure controls.
Fig. 8.
Average nodal pressure for the 2019 and COVID-19 eight week periods.
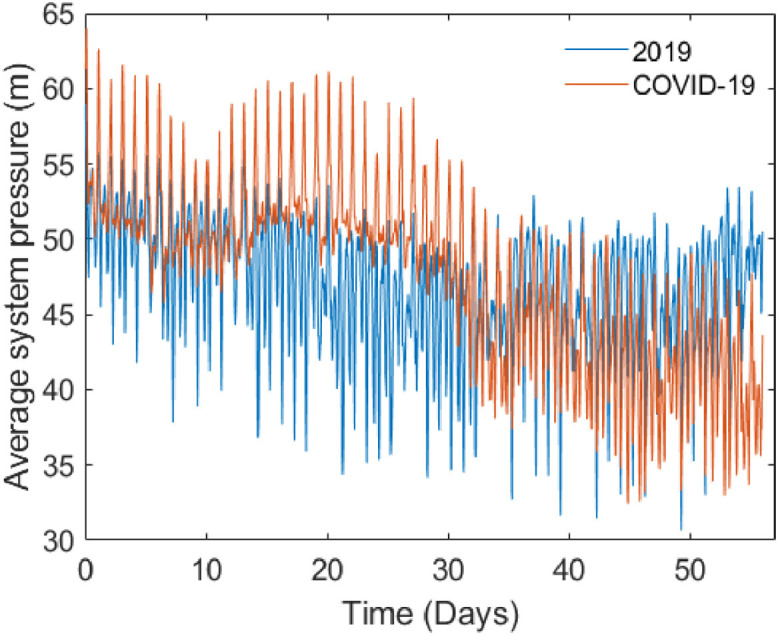
Pressures are also compared during February of 2019 and 2020 to establish a baseline for assessing changes during the pandemic. The daily system average pressure is similar when February 2019 and February 2020 are compared, and both months report a range of pressures between 40 and 75 m of head (Fig. 9 ). These results highlight the significance of the difference between the 2019 and COVID-19 scenarios (Fig. 8).
Fig. 9.

Average nodal pressure from February 2019 and February 2020 before the response actions to the COVID-19 pandemic.
Spatial analysis was performed for the Lakewood system for week 1 of the 2019 and COVID-19 scenarios (Monday March 25, - Sunday March 31, 2019 and Monday March 23, - Sunday March 29, 2020) to identify areas of the network that were most affected due to changes in water demand. At the end of the week of simulation for both scenarios, the pressure at each node and link of the network are evaluated to explore emergent spatial variation. The location of the changes in pressure are shown in Fig. 10 . High pressures occur during night hours, and pressures at 1:00 am on the second day of the simulation (Tuesday March 26, 2019 and Tuesday, March 24, 2020) are reported in Fig. 10. Under 2019 conditions, 741 nodes report pressure higher than 80 psi (56 m), whereas, for the COVID-19 scenario, 1345 nodes report high pressure. Spatial analysis shows that different areas of the network have been affected at different scales. The bottom left area highlighted in Fig. 10 demonstrates an area of the network where pressures have increased, and operators can use this analysis to manipulate valves and control pressures in this area.
Fig. 10.

Pressure is reported at 1:00 am during the second day of week 1 for (a) 2019 and (b) COVID-19 conditions. Red dots indicate nodes where pressure exceeds 80 psi (56 m).
5.2.2. water age
The evaluation of water age at the end of the hydraulic simulation provides insight about the time water takes from the point of production to consumption points. As a result of demand reductions (Fig. 5), detention times in the networks increased. The recommended threshold for water age is 48 hours after one week of simulation (Marchi et al., 2014). The water age is displayed as the average over all nodes in the network over the eight week period (Fig. 11 ), and the average water age exceeds 48 hours after 20 days. Specifically, 58 nodes located in the southwest part of the system (Fig. 10a) and far from the pump stations and storage tanks are the ones with possible stagnation problems in 2019. The standard deviation shows that some nodes exceed the standard by a significant amount, and these modeling results can be used to identify areas where potential stagnation problems have occurred (Proctor et al., 2020). During COVID-19 conditions, 85 nodes reported water age values higher than 48 hours, and these nodes are located at the southwest part of the system, shown as the box in Fig. 10b. Utility operators can sample water quality at nodes with high water age and flush hydrants in the immediate area to improve water quality.
Fig. 11.

Water quality reported as the average hourly water age of the system demand nodes over the two-month period of simulation. The bands around the mean represent one standard deviation above and below the average water age values.
5.2.3. energy consumption
A reduction in energy production that was calculated from the pumps and reservoirs is associated with the reduction in water demand. As shown in Fig. 12 , peak energy demands occur steadily during 2019, with a maximum daily value of 711 kWh after 50 days of simulation. In contrast, during the COVID-19 conditions, energy decreased to values around 500 kWh in week 1 and steadily increased, reaching a maximum value of 715 kWh at day 56. The total energy produced at pumps during week 1 decreases by 9% for the COVID-19 scenario, compared with week 1 of the 2019 scenario.
Fig. 12.

Total energy consumed at pumps, reported as the hourly sum for eight weeks of simulation for COVID-19 and 2019 scenarios.
The total energy consumption of the pump stations for February 2019 and 2020 was also evaluated. Similar to the outcomes shown for total water demand and average system pressure, the total energy consumed by the pumps was similar for the months of February in 2019 and 2020 (Fig. 13 ) and highlight the difference between the 2019 and COVID-19 scenarios.
Fig. 13.
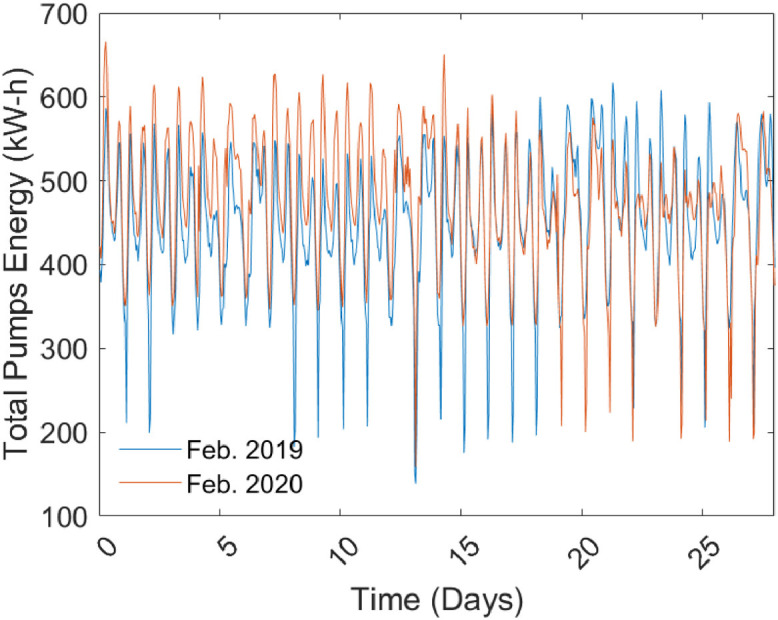
Total energy consumed at pumps before the response actions to the COVID-19 pandemic reported as the hourly sum for February 2019 and February 2020 scenarios.
Spatial analysis is used to analyze energy consumption of week 1 of the 2019 and COVID-19 scenarios. Fig. 14 demonstrates that the variation in water demand between the 2019 and COVID-19 conditions has a substantial effect on the energy of the large pump station of the system and smaller effects on energy consumed at the remaining pump stations. The main water plant and pump station provide water to nearly the entire system and the energy consumption of this plant is reduced from 18.4 MWh under 2019 conditions to 15 MWh under COVID-19 conditions (Fig. 14). Two other pump stations reported small changes in energy consumption. One pump station is located on the east side of the network and reports a reduction in energy consumption of approximately 100 kWh, and a second pump station on the west showed an increase in energy consumption by 20 kWh.
Fig. 14.

Energy consumption at pump stations for week 1 of 2019 and COVID-19 scenarios.
To further investigate the energy reduction of the main pump (Pump 4 in Fig. 14), the operation point was found for each scenario. The system and pump curves for 2019 show that the main pump operated at a flow rate () of 160 m providing the system a total head of 50 (Fig. 15 ). Conversely, during the first week of the COVID-19 scenario, the flow rate of the operating pump decreased by 30% to 112 m. The total head increased slightly to 53 . The pump efficiency of both scenarios is fixed at 70% from the hydraulic model, and pump settings, such as changing pump speed and pump controls, were not edited in the simulations.
Fig. 15.

System and pump curves with their main pump operating point for the (a) 2019 and (b) COVID-19 scenarios.
5.3. water outage event
A multi-modal failure event is simulated to evaluate how a change in demand and hydraulics during the COVID-19 pandemic may have mitigating or cascading effects during the onset of a water outage. This scenario simulates that a disruption occurs at the main system source (Pump 4 in Fig. 14). To simulate the disruption, the status of the pipe connecting the main storage tank with the network was changed from open to closed starting at the beginning of the simulation. Both the 2019 and COVID-19 demand scenarios were analyzed to assess the time until the system is unable to meet demands (Fig. 16). The disruption at the main source produces a negative pressure event measured at a highly affected node, which is shown in Fig. 16 , after four days under 2019 conditions (Fig. 17 ). At the same node under COVID-19 conditions, no negative pressure is reported, though the pressure drops nearly to 10 m. Reduced demands during the COVID-19 scenario leads to a system that is less vulnerable to water outages.
Fig. 16.

Negative pressure reported at 8:00 pm on day 4 due to a disruption occurring at the main drinking plant, simulated for the (a) 2019 scenario and (b) COVID-19 scenario. Star indicates a node where pressure is reported in Fig. 17.
Fig. 17.

Pressure over a five day period at an affected node located in the southwest region of Lakewood, shown as a star in Fig. 16. A water outage is simulated at the main drinking plant for 2019 and COVID-19 conditions.
6. discussion
6.1. water demand during the COVID-19 pandemic
This research demonstrates a new application of a digital twin for exploring the hydraulic performance of a water distribution network under new demands induced by social distancing practices during the COVID-19 pandemic and compared results with performance during 2019. First, shifts in demands are analyzed to develop a new understanding of how demands changed during the pandemic. Analysis of AMI data confirms reports of changing water demands for other data sets. Analysis finds that residential demands decreased in the first week of the shut-down and recovered to volumes similar to the 2019 scenario after four to five weeks. Morning peaks were delayed by a few hours in the first three weeks and returned the same peak time by the seventh week of the shutdown. Non-residential demands decreased substantially and recovered after five to six weeks. While other research studies report on the change in volume of demands (Kalbusch, Henning, Brikalski, de Luca, Konrath, 2020, Spearing, Thelemaque, Kaminsky, Katz, Kinney, Kirisits, Sela, Faust, 2021, American Water Works Association, Cooley, Gleick, Abraham, & Cai) and the change in diurnal patterns (Balacco, Totaro, Iacobellis, Manni, Spagnoletta, Piccinni, 2020, Ludtke, Luetkemeier, Schneemann, Liehr, 2021), this research reports on how diurnal patterns changed in response to a shelter-in-place and the dynamics of the recovery of demands to pre-COVID-19 patterns. These dynamics provide another context to understand how communities returned to typical routines after initial response to the pandemic and shelter-in-place orders.
6.2. water infrastructure performance during the COVID-19 pandemic
While a number of research studies have explored demand changes, this research applies data about demand changes to assess infrastructure performance. Several metrics of performance are evaluated for 2019 and COVID-19 scenarios, including average system pressure, energy consumption, and water age. The Lakewood water network showed higher average system pressure values during COVID-19 conditions, as expected due to water demand decreases across the network. New pressure values are not critical, as most of them vary between 50 and 60 m and may not represent a threat to the normal operations of the network. Utility managers can use this information to assess non-revenue water lost during times of high pressures.
Low flows and high demands also lead to potential water quality problems, and water age is reported at high values at nodes in Lakewood during the first few weeks of the shelter-in-place. In a survey of 28 utilities, Spearing et al. (2021) found that 24 utilities reported a change or challenge associated with water use, but only three utilities observed negative water quality consequences. Water quality effects associated with rapidly change water demands may be ephemeral, and sampling programs may have missed these changes as they occurred. In addition, some utilities reported challenges with continuing to monitor water quality during the pandemic (Spearing et al., 2021), creating further difficulties in managing water quality. A digital twin can simulate water quality changes and serve as an early warning system to alert a water utility about potential issues and inform the location of sampling efforts.
This analysis finds that energy consumption was reduced in the Lakewood network during the COVID-19 pandemic at the main pump station, due to the decrease in water demand. Peak energy demands also drop during the first few weeks of the shelter-in-place. The energy costs paid by the Lakewood water utility are highly dependent on peak energy use. Demand charges, or transmission charges, are fees applied to the electric bills of water utilities based upon the highest amount of power drawn during any (typically 15-minute) interval during the billing period. The demand patterns shown in Figs. 4 and 5 indicate that demands are returning to pre-COVID-19 levels and savings in energy have not continued; however, utility managers can use this new information about changing water use habits to assess demand management programs that aim to reduce peak water demands and energy costs.
Spatial analysis is used to evaluate how the changes in water demand affected different zones of the water network and identify which part of the network was affected the most. Spatial analysis depends on the topology and topographical characteristics of each network being analyzed and has been previously applied for water systems applications to partition the network into District and Pressure Metering Areas (DMAs) (Chatzivasili, Papadimitriou, Kanakoudis, 2019, Pesantez, Berglund, Mahinthakumar, 2020b, Salomons, Skulovich, Ostfeld, 2017). COVID-19 lockdown measures may differ across the network and the spatial evaluation of which district or zone of the network was affected the most can assist water utilities in the planning and operation of the system.
Modeling the network performance under a physical disruption was presented as an application for a digital twin to represent a potential multi-modal disaster and assess resilience and vulnerability (Klise, Bynum, Moriarty, Murray, 2017, Luna, Balakrishnan, Dagli, 2011, Nazif, Karamouz, 2009). Identifying changes in pressure and energy due to variations in demand under extreme events such as the pandemic may provide insights to operators and managers about updating controls to continue to satisfy hydraulic and quality requirements of the system. For the water outage that was modeled in this research, reductions in demand during COVID-19 lead to improved water infrastructure resilience. A digital twin can have important application in multi-modal events, in which the complexity of interactions among modes may drive unexpected emergent infrastructure performance. For example, Winter Storm Uri in 2021 led to water infrastructure failures due to complex interactions among the dynamics of frozen water pipes, COVID-19 social distancing behaviors, and widespread power outages. Water utilities in Memphis, Tennessee, and Arlington, Texas were able to take advantage of AMI and use remotely read smart meter data to identify pipe bursts in real-time (Peterson, Watts). Digital twins can be used to further improve utility knowledge about water flows, areas of pressure loss, and declining levels of service as an event unfolds to select appropriate infrastructure controls and allocate resources to targeted areas of a network.
The pandemic has had a range of effects on how water utilities operate due to lockdowns and social distancing practices. Recent research has reported that some water utilities found that social distancing practices pose serious problems to managers in maintaining expected levels of service (Sowby, 2020, Spearing, Thelemaque, Kaminsky, Katz, Kinney, Kirisits, Sela, Faust, 2021). Problems related to maintaining staff at the workplace, revenue, supply chain, and deferring investment on large projects were outlined as the most common issues. In addition, spatial and temporal variations in water demand may cause unexpected hydraulic responses from the systems and water quality degradation in empty buildings (Proctor et al., 2020). These studies have emphasized that disasters like the COVID-19 pandemic revealed a lack of planning by water utilities related to what to expect under sudden demand variation from residential and non-residential type of customers. Digital twins can help utilities to visualize the effect of water demand variation to develop insight about emerging issues for water infrastructure.
The demands associated with COVID-19 may represent new and unforeseen conditions for some water networks, creating an opportunity to update or verify calibrated hydraulic models for new scenarios (Walski, 2017). Based on new water demand data, measured pressure, and water levels of the tanks associated with the COVID-19 pandemic, scenarios analysis can be used to evaluate model performance and error under new demand conditions (Zhuang and Sela, 2020). New demand patterns can also be used to evaluate the vulnerabilities of water infrastructure systems and develop management strategies to improve resilience. It is expected that demands for freshwater changed significantly during the COVID-19 pandemic in water supply systems where highly treated water is applied for all domestic purposes (e.g., drinking, hygiene, toilet flushing, and irrigation). Utilities that can encourage diversification of water sources for alternative end uses may help to create more resilient systems that can respond during emergencies causing major changes in demand profiles. For example, novel water management paradigms that allow trading rainwater harvesting for irrigation (Ramsey et al., 2020) and hybrid systems that integrate centralized and decentralized water sources (Fornarelli et al., 2019) can reduce community dependence on a centralized water utility and facilitate efficient management of disruptions. Further, water is a key component in fighting COVID-19, as it is critical for disinfection and washing hands frequently. Communities living under threat of the COVID-19 and other pandemics may see significant increases in water demands and water prices in the future (Sivakumar, 2020). The increased use of water for hygiene and disinfection may increase water consumption and exacerbate water shortages, especially in water-scarce areas where there is a heightened tension between water supply and water needed for hygiene and disinfecting surfaces. Providing analysis about the expected changes in infrastructure performance based on increases and changes in demand is critical to enable utilities to consider and plan for future supply interruptions.
6.3. advancing digital twins for water infrastructure systems
The advent of smart meters as part of AMI reporting consumption, pressure, and quality measurements with a high temporal and spatial resolution is a key component for management purposes of water utilities (Cominola, Giuliani, Piga, Castelletti, Rizzoli, 2015, Nguyen, Stewart, Zhang, Sahin, Siriwardene, 2018). Demand data at the user level can be used to analyze user patterns, and this data can be aggregated to report spatial changes in demands. Consumption patterns that result due to responses related to extreme events such as the COVID-19 pandemic can be evaluated using information from AMI, and this information will provide utility insights about how and where demands have changed and to what degree these changes affect the operation of their systems. The digital twin presented here can be applied by water operators to identify areas where the network changes due to new demand patterns. Specifically, the system’s southwest area presents a potentially high-pressure issue where under pre-COVID-19 conditions the pressure did not exceed 56 m of head of water. Managers may use these results to guide selection of valves in that area that should be checked. There are also potential water age issues due to the drastic demand reduction observed at the beginning of the lockdown. Managers and operators can review their sampling plans and schedule actions, such as unidirectional flushing strategies, to ensure that water quality parameters remain within the standard values. Pump settings can be revised to ensure that these demand changes do not lead to longer residence times in storage tanks. However, the performance of these analyses depends on how well the hydraulic model represents real conditions. Historically, nodal demands have been the most uncertain and dynamic variables in water distribution system modeling and management (Kang, Lansey, 2009, Kun, Tian-Yu, Jun-Hui, Jin-Song, 2015). However, AMI data can quantify the precise volume of water demands, and model error is attributed to unknown parameters and dynamic changes in the infrastructure, rather than in human behaviors. In this research, demands are reported in increments of one gallon each hour, leading to a precise value for demands exerted. The uncertainties in model parameters, status of infrastructure components, and network topology limit the accuracy of model output. The Lakewood hydraulic water network represents a skeletonized version of the system, and components where demands at the user-level were aggregated to replicate the system conditions. In developing a reliable and accurate digital twin, the model must be calibrated and represent infrastructure elements with accuracy and fidelity to reproduce the behaviour of network elements in normal and extreme operating conditions (Conejos Fuertes et al., 2020). Further research is needed to refine the model of the Lakewood infrastructure and reduce uncertainty and error in the digital twin. SCADA data can be used to improve model error, and new methods to rapidly integrate SCADA data in calibration are needed to automate complex calibration procedures.
In smart city literature, the use of the term real-time can be over-used, as truly real-time models should automate the entire process of system simulation and prediction from remote sensing to model output (Shafiee et al., 2018). The framework demonstrated here develops middleware for downloading data and a wrapper for translating cleaned AMI data to input for the hydraulic model, providing important components in a real-time modeling process, similar to the framework described by Shafiee et al. (2020). Further research is needed to extend this framework to achieve a fully automated digital twin, as conceptualized by Shafiee et al. (2018) and implemented by Conejos Fuertes et al. (2020) for Valencia, Spain. To extend the framework that is reported here, analytical tools should be connected to the data lake to scrub data, fill in missing values, and filter out corrupted or missing data in an automated train of technologies. While the framework described here uses a manual approach to clean data, the wrapper provides automated functionality to receive streaming data, run the EPANET model, and write out results. The EPANET model is designed to execute in real-time by updating new model parameters automatically using AMI data. Boundary conditions are not automatically updated using streaming values from SCADA, and future studies should integrate SCADA and other streaming data into the data cycle to improve the digital twin’s ability to realistically represent its physical counterpart. For example, Twitter data was analyzed during flooding events associated with a hurricane to analyze spatial and temporal impacts on residential neighborhoods (Fan et al., 2020). Social data that is available through social media platforms (e.g., Twitter and Facebook) and transportation applications (e.g., Waze) can be automatically collected, cleaned, and analyzed to update predictions of the location and timing of water demands for use within a digital twin of water infrastructure systems.
7. conclusions
This research develops a digital twin to evaluate the effects of changing demands on water infrastructure during the COVID-19 pandemic. Smart metered data was used to determine how water demand changed due to COVID-19 stay-at-home restrictions. Twelve weeks of data were used from February-April of 2019 and from February-April of 2020 to represent pre-COVID-19 and COVID-19 conditions, respectively. AMI data showed that the typical daily consumption curve with two peaks, one in the morning and one in the evening, was replaced by a one-peak curve occurring at early evening hours during weekdays. A digital twin was implemented to connect AMI demand data with a hydraulic model and explore emerging infrastructure performance. Pressure, energy consumption, and water quality were simulated using the digital twin, with large variations in the first few weeks of the shut-down, when compared with the 2019 scenario. System parameters returned to pre-COVID-19 conditions after 3–4 weeks, with the return to pre-COVID-19 demands. A water outage at the main treatment plant was simulated to test how these changes in demand affect the resilience of the system, and results quantify that vulnerabilities to loss of pressure decrease due to the reduction in demands.
Smart technologies support urban management goals, including resilience of urban services, infrastructure renewal, and efficiency in resource use, which contribute to the development of sustainable cities. By studying the effects of the responses related to the COVID-19 pandemic on water demands and infrastructure, utilities can gain new insight about unexpected demand scenarios to plan for a more resilient water infrastructure that can recover from external shocks caused by a future pandemic or other types of natural and human-made disasters. The performance of civil engineering infrastructure, as a sociotechnical system, relies heavily on the patterns of demands exerted by customers, and unexpected demand profiles can feed back to the system to create new performance regimes and change the level of service experienced by consumers. Changes in demands may cause new system vulnerabilities, and analysis such as the research presented here is needed to develop insight into the type of changes that may emerge for unexpected demand profiles associated with disasters and natural hazards such as heatwaves, droughts, and contamination events that can exacerbate water scarcity or water quality issues. Hydraulic models with real-time streaming demand can assist utility managers to analyze scenarios to improve system response and reduce vulnerabilities. The digitalization of water systems as part of the smart city paradigm can accelerate the development of digital twin models and the use of streaming data in reporting and managing changes in the network during extreme events and emergencies.
8. data availability statement
Some models and code that support the findings of this study are available from the corresponding author upon request.
Declaration of Competing Interest
None.
Acknowledgments
The authors would like to thank the City of Lakewood for collaborating on this project and providing information and data. Jorge Pesantez was funded by the Government of Ecuador through the Secretaria Nacional de Educacion, Ciencia, Tecnologia e Investigacion (SENESCYT). Faisal Alghamdi was funded by King Abdulaziz University, Saudi Arabia, through the Saudi Arabian Cultural Mission to the US (SACM).
References
- Alsharef A., Banerjee S., Uddin S., Albert A., Jaselskis E. Early impacts of the covid-19 pandemic on the united states construction industry. International journal of environmental research and public health. 2021;18(4):1559. doi: 10.3390/ijerph18041559. [DOI] [PMC free article] [PubMed] [Google Scholar]
- American Water Works Association (2020). The Financial Impact of the COVID-19 Crisis on US Drinking Water Utilities. https://www.awwa.org/Portals/0/AWWA/Communications/AWWA-AMWA-COVID-Report_2020-04.pdf.
- Angjeliu G., Coronelli D., Cardani G. Development of the simulation model for digital twin applications in historical masonry buildings: The integration between numerical and experimental reality. Computers & Structures. 2020;238:106282. [Google Scholar]
- Asadi-Ghalhari M., Aali R. Covid-19: Reopening public spaces and secondary health risk potential via stagnant water in indoor pipe networks. Indoor and Built Environment. 2020 [Google Scholar]; 1420326X20943257
- AWWA Committee report: Trends in water distribution system modeling. Journal of the American Water Works Association. 2014;106(10):51–59. [Google Scholar]
- Balacco G., Totaro V., Iacobellis V., Manni A., Spagnoletta M., Piccinni A.F. Influence of covid-19 spread on water drinking demand: The case of puglia region (southern italy) Sustainability. 2020;12(15):5919. [Google Scholar]
- Beal C.D., Gurung T.R., Stewart R.A. Demand-side management for supply-side efficiency: modeling tailored strategies for reducing peak residential water demand. Sustainable Production and Consumption. 2016;6:1–11. [Google Scholar]
- Berglund E.Z., Monroe J.G., Ahmed I., Noghabaei M., Do J., Pesantez J.E., Khaksar Fasaee M.A., Bardaka E., Han K., Proestos G.T., et al. Smart infrastructure: A vision for the role of the civil engineering profession in smart cities. Journal of Infrastructure Systems. 2020;26(2):03120001. [Google Scholar]
- Berglund E.Z., Thelemaque N., Spearing L., Faust K.M., Kaminsky J., Sela L.…Keck J., et al. Water and wastewater systems and utilities: challenges and opportunities during the covid-19 pandemic. Journal of Water Resources Planning and Management. 2021;147(5):02521001. [Google Scholar]
- Berman J.D., Ebisu K. Changes in us air pollution during the covid-19 pandemic. Science of the Total Environment. 2020;739:139864. doi: 10.1016/j.scitotenv.2020.139864. [DOI] [PMC free article] [PubMed] [Google Scholar]
- Bethke G., Cohen A., Stillwell A. Emerging investigator series: Disaggregating residential sector high-resolution smart water meter data into appliance end-uses with unsupervised machine learning. Environmental Science - Water Research and Technology. 2021;7(3):487–503. [Google Scholar]
- Bibri S.E., Krogstie J. Smart sustainable cities of the future: An extensive interdisciplinary literature review. Sustainable Cities and Society. 2017;31(May):183212. [Google Scholar]
- Blokker E., Vreeburg J., Van Dijk J. Simulating residential water demand with a stochastic end-use model. Journal of Water Resources Planning and Management. 2010;136(1):19–26. [Google Scholar]
- Bolton A., Enzer M., Schooling J. Centre for Digital Built Britain; Cambridge, UK: 2018. The gemini principles: Guiding values for the national digital twin and information management framework. [Google Scholar]
- Booysen M., Ripunda C., Visser M. Results from a water-saving maintenance campaign at cape town schools in the run-up to day zero. Sustainable Cities and Society. 2019;50(October) [Google Scholar]
- Braga F., Scarpa G., Brando B., Manfe G., Zaggia L. Covid-19 lockdown measures reveal human impact on water transparency in the venice lagoon. Science of the Total Environment. 2020;736:139612. doi: 10.1016/j.scitotenv.2020.139612. Sep. [DOI] [PMC free article] [PubMed] [Google Scholar]
- Chatzivasili S., Papadimitriou K., Kanakoudis V. Optimizing the formation of dmas in a water distribution network through advanced modelling. Water. 2019;11(2):278. [Google Scholar]
- Cheng W.-p., Liu E.-h., Liu J.-q. A novel statistical model for water age estimation in water distribution networks. Mathematical Problems in Engineering. 2015;2015 [Google Scholar]
- Cominola A., Giuliani M., Piga D., Castelletti A., Rizzoli A.E. Benefits and challenges of using smart meters for advancing residential water demand modeling and management: A review. Environmental Modelling & Software. 2015;72:198–214. [Google Scholar]
- Conejos Fuertes P., Martínez Alzamora F., Hervás Carot M., Alonso Campos J. Building and exploiting a digital twin for the management of drinking water distribution networks. Urban Water Journal. 2020;17(8):704–713. [Google Scholar]
- Cooley, H., Gleick, P., Abraham, S., & Cai, W. (2020). Water and the COVID-19 Pandemic: Impacts on Municipal Water Demand. https://pacinst.org/publication/coronavirus-impacts-on-municipal-water-demand/.
- Davila Delgado J.M., Oyedele L. Digital twins for the built environment: Learning from conceptual and process models in manufacturing. Advanced Engineering Informatics. 2021;49:101332. [Google Scholar]
- DiCarlo M.F., Berglund E.Z. Connected communities improve hazard response: An agent-based model of social media behaviors during hurricanes. Sustainable Cities and Society. 2021;69:102836. [Google Scholar]
- Eastman, L., Smull, E., Patterson, L., & Doyle, M. (2020). COVID-19 Impacts on Water Utility Consumption and Revenues- Preliminary Results. https://nicholasinstitute.duke.edu/sites/default/files/publications/COVID-19-Resources-Impacts-on-Water-Utility-Consumption-and-Revenues.pdf.
- Eliades D.G., Kyriakou M., Vrachimis S., Polycarpou M.M. Proc. 14th international conference on computing and control for the water industry (ccwi) 2016. Epanet-matlab toolkit: An open-source software for interfacing epanet with matlab; p. 8. [DOI] [Google Scholar]; The Netherlands
- Fan C., Jiang Y., Mostafavi A. Social sensing in disaster city digital twin: integrated textual–visual–geo framework for situational awareness during built environment disruptions. Journal of Management in Engineering. 2020;36(3):04020002. [Google Scholar]
- Fan C., Zhang C., Yahja A., Mostafavi A. Disaster city digital twin: A vision for integrating artificial and human t intelligence for disaster management. International journal of information management. 2021;56(102049) [Google Scholar]
- Ford D., Wolf C. Smart cities with digital twin systems for disaster management. Journal of Management in Engineering. 2020;36(4):04020027. [Google Scholar]
- Fornarelli R., Anda M., Dallas S., Schmack M., Dawood F., Byrne J., Morrison G., Fox-Reynolds K. Enabling residential hybrid water systems through a water creditdebit system. Water Supply. 2019;19(7):2131–2139. [Google Scholar]
- Friedman K., Heaney J.P., Morales M., Palenchar J. Analytical optimization of demand management strategies across all urban water use sectors. Water resources research. 2014;50(7):5475–5491. [Google Scholar]
- Goenaga B., Matini N., Karanam D., Underwood B. Disruption and recovery: Initial assessment of covid-19 traffic impacts in north carolina and virginia. Journal of Transportation Engineering Part A. 2021;147(4):06021001. [Google Scholar]
- Gurung T.R., Stewart R.A., Beal C.D., Sharma A.K. Smart meter enabled informatics for economically efficient diversified water supply infrastructure planning. Journal of cleaner production. 2016;135:1023–1033. [Google Scholar]
- Gurung T.R., Stewart R.A., Sharma A.K., Beal C.D. Smart meters for enhanced water supply network modelling and infrastructure planning. Resources, Conservation and Recycling. 2014;90:34–50. [Google Scholar]
- Ivanov D. Predicting the impacts of epidemic outbreaks on global supply chains: A simulation-based analysis on the coronavirus outbreak (covid-19/sars-cov-2) case. Transportation Research Part E. 2020;136:101922. doi: 10.1016/j.tre.2020.101922. [DOI] [PMC free article] [PubMed] [Google Scholar]
- Kalbusch A., Henning E., Brikalski M.P., de Luca F.V., Konrath A.C. Impact of coronavirus (covid-19) spread-prevention actions on urban water consumption. Resources, Conservation and Recycling. 2020;163:105098. doi: 10.1016/j.resconrec.2020.105098. [DOI] [PMC free article] [PubMed] [Google Scholar]
- Kang D., Lansey K. Real-time demand estimation and confidence limit analysis for water distribution systems. Journal of Hydraulic Engineering. 2009;135(10):825837. [Google Scholar]
- Klise K.A., Bynum M., Moriarty D., Murray R. A software framework for assessing the resilience of drinking water systems to disasters with an example earthquake case study. Environmental modelling & software. 2017;95:420–431. doi: 10.1016/j.envsoft.2017.06.022. [DOI] [PMC free article] [PubMed] [Google Scholar]
- Krause, A., Perciavalle, P., Johnson, K., Owens, B., Frodl, D., & Sarni, W. (2018). The digitization of water.
- Kun D., Tian-Yu L., Jun-Hui W., Jin-Song G. Inversion model of water distribution systems for nodal demand calibration. Journal of Water Resources Planning and Management. 2015;141(9):04015002. [Google Scholar]
- Laucelli D., Berardi L., Giustolisi O. Assessing climate change and asset deterioration impacts on water distribution networks: Demand-driven or pressure-driven network modeling? Environmental Modelling & Software. 2012;37:206–216. [Google Scholar]
- Lindell M.K., Perry R.W., Prater C. Wiley; 2007. Introduction to emergency management. [Google Scholar]
- Lu Q., Parlikad A., Woodall P., Ranasinghe G., Xie X., Liang Z., Konstantinou E., Heaton J., Schooling J. Developing a digital twin at building and city levels: Case study of west cambridge campus. Journal of Management in Engineering. 2020;36:05020004. [Google Scholar]
- Lu Q., Xie X., Parlikad A.K., Schooling J.M. Digital twin-enabled anomaly detection for built asset monitoring in operation and maintenance. Automation in Construction. 2020;118:103277. [Google Scholar]
- Ludtke D., Luetkemeier R., Schneemann M., Liehr S. Increase in daily household water demand during the first wave of the covid-19 pandemic in germany. Water. 2021;13(260):13. [Google Scholar]
- Luna R., Balakrishnan N., Dagli C.H. Postearthquake recovery of a water distribution system: Discrete event simulation using colored petri nets. Journal of Infrastructure Systems. 2011;17(1):25–34. [Google Scholar]
- Marchi A., Salomons E., Ostfeld A., Kapelan Z., Simpson A.R., Zecchin A.C.…Song Y., et al. Battle of the water networks ii. Journal of Water Resources Planning and Management. 2014;140(7):04014009. [Google Scholar]
- MATLAB . The MathWorks Inc.; Natick, Massachusetts: 2020. Version 9.9.0 (R2020b) [Google Scholar]
- Mazumder R.K., Salman A.M., Li Y., Yu X. Performance evaluation of water distribution systems and asset management. Journal of Infrastructure Systems. 2018;24(3):03118001. [Google Scholar]
- Melbourne Water (2020). How our new way of life is changing our household water habits. http://www.melbournewater.com.au/water-data-and-education/news/how-our-new-way-life-changing-our-household-water-habitsAccessed: 2020-06-22.
- Mohammadi N., Taylor J.E. 2017 ieee symposium series on computational intelligence (ssci) 2017. Smart city digital twins; pp. 1–5. [DOI] [Google Scholar]
- Nazif S., Karamouz M. Algorithm for assessment of water distribution systems readiness: Planning for disasters. Journal of Water Resources Planning and Management. 2009;135(4):244–252. [Google Scholar]
- Nguyen K.A., Stewart R.A., Zhang H., Sahin O., Siriwardene N. Re-engineering traditional urban water management practices with smart metering and informatics. Environmental Modelling & Software. 2018;101:256–267. [Google Scholar]
- Omaghomi T., Buchberger S., Cole D., Hewitt J., Wolfe T. Probability of water fixture use during peak hour in residential buildings. Journal of Water Resources Planning and Management. 2020;146(5):04020027. [Google Scholar]
- O’Dwyer E., Pan I., Charlesworth R., Butler S., Shah N. Integration of an energy management tool and digital twin for coordination and control of multi-vector smart energy systems. Sustainable Cities and Society. 2020;62:102412. [Google Scholar]
- Pang J., Huang Y., Zie Z., Li J., Cai Z. Collaborative city digital twin for the covid-19 pandemic: A federated learning solution. Tsinghua science and technology. 2021;26(5):759–771. [Google Scholar]
- Pedregosa F., Varoquaux G., Gramfort A., Michel V., Thirion B., Grisel O.…Duchesnay E. Scikit-learn: Machine learning in python. Journal of Machine Learning Research. 2011;12:2825–2830. [Google Scholar]
- Perelman L., Maslia M.L., Ostfeld A., Sautner J.B. Using aggregation/skeletonization network models for water quality simulations in epidemiologic studies. Journal-American Water Works Association. 2008;100(6):122–133. [Google Scholar]
- Pesantez J.E., Berglund E.Z., Kaza N. Smart meters data for modeling and forecasting water demand at the user-level. Environmental Modelling & Software. 2020;125:104633. [Google Scholar]
- Pesantez J.E., Berglund E.Z., Mahinthakumar G. Geospatial and hydraulic simulation to design district metered areas for large water distribution networks. Journal of Water Resources Planning and Management. 2020;146(7):06020010. doi: 10.1061/(ASCE)WR.1943-5452.0001265. [DOI] [PMC free article] [PubMed] [Google Scholar]
- Peterson, T. (2021). Remote read meter data aids in arlington winter storm recovery.
- Proctor C.R., Rhoads W.J., Keane T., Salehi M., Hamilton K., Pieper K.J., Cwiertny D.M., Prévost M., Whelton A.J. Considerations for large building water quality after extended stagnation. AWWA Water Science. 2020;2(4):e1186. doi: 10.1002/aws2.1186. [DOI] [PMC free article] [PubMed] [Google Scholar]
- R Core Team (2017). R: A language and environment for statistical computing. R Foundation for Statistical ComputingVienna, Austria.
- Ramsey E., Pesantez J., Fasaee M., DiCarlo M., Monroe J., Berglund E. A smart water grid for micro-trading rainwater: hydraulic feasibility analysis. Water. 2020;12(11):3075. [Google Scholar]
- Rossman L., Woo H., Tryby M., Shang F., Janke R., Haxton T. 1st. US Environmental Protection Agency; Cincinnati, OH: 2020. EPANET 2.2 Users manual. [Google Scholar]
- Salomons E., Skulovich O., Ostfeld A. Battle of water networks dmas: Multistage design approach. Journal of Water Resources Planning and Management. 2017;143(10):04017059. [Google Scholar]
- Sarni, W., White, C., Webb, R., Cross, K., & Glotzbach, R. (2019). Digital water: Industry leaders chart the transformation journey.
- Schrotter G., Hürzeler C. The digital twin of the city of zurich for urban planning. PFG–Journal of Photogrammetry, Remote Sensing and Geoinformation Science. 2020;88(1):99–112. [Google Scholar]
- Schwaller J., van Zyl J.v. Modeling the pressure-leakage response of water distribution systems based on individual leak behavior. Journal of Hydraulic Engineering. 2015;141(5):04014089. [Google Scholar]
- Shafiee M., Barker Z., Rasekh A. Enhancing water system models by integrating big data. Sustainable Cities and Society. 2018;37:485–491. [Google Scholar]
- Shafiee M.E., Rasekh A., Sela L., Preis A. Streaming smart meter data integration to enable dynamic demand assignment for real-time hydraulic simulation. Journal of Water Resources Planning and Management. 2020;146(6):06020008. [Google Scholar]
- Shahat E., Hyun C.T., Yeom C. City digital twin potentials: A review and research agenda. Sustainability. 2021;13(6):3386. [Google Scholar]
- Sivakumar, B. (2020). Covid-19 and water. https://link.springer.com/article/10.1007/s00477-020-01837-6. [DOI] [PMC free article] [PubMed]
- Sowby R.B. Emergency preparedness after covid-19: A review of policy statements in the us water sector. Utilities policy. 2020;64:101058. doi: 10.1016/j.jup.2020.101058. [DOI] [PMC free article] [PubMed] [Google Scholar]
- Spearing L.A., Thelemaque N., Kaminsky J.A., Katz L.E., Kinney K.A., Kirisits M.J., Sela L., Faust K.M. Implications of social distancing policies on drinking water infrastructure: An overview of the challenges to and responses of us utilities during the covid-19 pandemic. ACS ES&T Water. 2021 doi: 10.1021/acsestwater.0c00229. [DOI] [PubMed] [Google Scholar]
- State of California Office of the Governor (2020). Governor newsom issues executive order on extending deadlines impacted by covid-19. https://www.gov.ca.gov/2020/05/08/governor-newsom-issues-executive-order-on-extending-deadlines-impacted-by-covid-19/.
- Tao, F., & Qi, Q. (2019). Make more digital twins. [DOI] [PubMed]
- Triguero I., García-Gil D., Maillo J., Luengo J., García S., Herrera F. Transforming big data into smart data: An insight on the use of the k-nearest neighbors algorithm to obtain quality data. Wiley Interdisciplinary Reviews: Data Mining and Knowledge Discovery. 2019;9(2):e1289. [Google Scholar]
- Van Rossum G., Drake F.L. CreateSpace; Scotts Valley, CA: 2009. Python 3 reference manual. [Google Scholar]
- Visser M., Booysen M., Bruhl J., Berger K. Saving water at cape town schools by using smart metering and behavioral change. Water Resources and Economics. 2021;34(April) [Google Scholar]
- Walski T. Procedure for hydraulic model calibration. Journal: American Water Works Association. 2017;109(6) [Google Scholar]
- Walski T.M., Chase D.V., Savic D.A., Grayman W., Beckwith S., Koelle E. Haestad press; 2003. Advanced water distribution modeling and management. [Google Scholar]
- WaterWorld (2017). Lakewood, ca., selects fathom to modernize utility billing. https://www.waterworld.com/water-utility-management/article/16223637/lakewood-ca-selects-fathom-to-modernize-utility-billing.
- Watts, M. (2021). Memphis water pressure ’turning the corner’ but boil advisory remains, for now, officials say.
- West Monroe (2017). State of advanced metering infrastructure (ami) and data analytics adoption.
- Wickham, H. (2019). stringr: Simple, consistent wrappers for common string operations. R package version 1.4.0.
- Xie X., Lu Q., Herrera M., Yu Q., Parlikad A.K., Schooling J.M. Does historical data still count? exploring the applicability of smart building applications in the post-pandemic period. Sustainable Cities and Society. 2021;69:102804. doi: 10.1016/j.scs.2021.102804. [DOI] [PMC free article] [PubMed] [Google Scholar]
- Zhuang J., Sela L. Impact of emerging water savings scenarios on performance of urban water networks. Journal of Water Resources Planning and Management. 2020;146(1):04019063. doi: 10.1061/(ASCE)WR.1943-5452.0001265. [DOI] [PMC free article] [PubMed] [Google Scholar]
Associated Data
This section collects any data citations, data availability statements, or supplementary materials included in this article.
Data Availability Statement
Some models and code that support the findings of this study are available from the corresponding author upon request.