

Abstract
This study aimed to find a good coupling feature extraction method to effectively analyze resting state EEG signals (rsEEG) of amnestic mild cognitive impairment(aMCI) with type 2 diabetes mellitus(T2DM) and normal control (NC) with T2DM. A method of EEG signal coupling feature extraction based on weight permutation conditional mutual information (WPCMI) was proposed in this research. With the WPCMI method, coupling feature strength of two time series in Alpha1, Alpha2, Beta1, Beta2 and Gamma bands for aMCI with T2DM and NC with T2DM could be extracted respectively. Then selected three frequency bands coupling feature matrix with the help of multi-spectral image transformation method to map it as spectral image characteristics. And finally classified these characteristics through the convolution neural network method(CNN). For aMCI with T2DM and NC with T2DM, the highest classification accuracy of 96%, 95%, 95% could be achieved respectively in the combination of three frequency bands (Alpha1, Alpha2, Gamma), (Beta1, Beta2 and Gamma) and (Alpha2, Beta1, Beta2). This WPCMI method highlighted the coupling dynamic characteristics of EEG signals, and its classification performance was better than all previous methods in aMCI with T2DM diagnosis field. WPCMI method could be used as an effective biomarker to distinguish EEG signals of aMCI with T2DM and NC with T2DM. The coupling feature extraction method used in this paper provided a new perspective for the EEG analysis of aMCI with T2DM.
Keywords: Coupling feature, Resting state EEG signals, Amnestic mild cognitive impairment with type 2 diabetes mellitus, Weight permutation conditional mutual information
Introduction
Diabetes is a metabolic disease characterized by high blood sugar (Shoback and Dolores 2011) and is associated with the risk of cognitive impairment (Gispen and Biessels 2000; Shoback and Dolores 2011; Strachan et al. 2011). Patients with T2DM were the most common type of diabetes and associated with an increased risk of aMCI (Ganguli et al. 2004; Busse et al. 2006; Yaffe et al. 2006; Hussain 2007; Luchsinger et al. 2007; HiroyukiShimada et al. 2010; Strachan et al. 2011; Roberts, Knopman et al. 2014). Therefore, it is worth exploring an effective method to identify aMCI with T2DM, which is crucial for early intervention.
Resting-state electroencephalogram (rsEEG) contains information related to the basis of brain activity and its network connectivity (Steriade 2006). According to recent research, rsEEG can be used as aid in the diagnosis of patients with MCI (Dauwels et al. 2010; Knyazeva et al. 2013; Babiloni et al. 2014; Wen et al. 2014). Some studies applied analysis of EEG signals to investigate the cognitive impairment with T2DM (Cooray et al. 2008, 2011; Baskaran et al. 2013; Bian et al. 2014; Wen et al. 2016; Wen et al. 2020b). Due to the nature of the complex features of EEG signals, many methods are used to analyze EEG signals from MCI patients from different aspects (Cooray et al. 2008, 2011; Dauwels et al. 2010; Baskaran et al. 2013; Knyazeva et al. 2013; Babiloni et al. 2014; Wen et al. 2014).
Coupling often occurred between groups of neurons or across different regions of the brain (Kurths 2003). The coupling strengths between those neurons and regions were used to describe their interaction and also contained information about the causality of such interaction (Cantero et al. 2009; Darvas, Ojemann, and Sorensen, 2009). Specifically, clusters of neurons from different brain regions regulated their dynamics and locked specific brain activities within a specific time and frequency bands (Pikovsky 1983; Michael et al. 1995; Rulkov et al. 1995; Arkady and Jürgen 2003). The analysis of the coupling strength provided deeper insights into the mechanisms of interactions between different brain regions (Muller et al. 2016), and had become the focus of studies in both normal (Darvas et al. 2009) and diseased brains (Rudrauf et al. 2006; Darvas et al. 2009).
Several methods have been proposed to estimate the coupling strengths of neural series (Li and Ouyang 2010; Romero-Garcia, Atienza, and Cantero 2014), including Granger causality analysis (GCA) (Granger 1969; Winterhalder et al. 2006; Seth 2010; Faes, Erla, and Nollo 2012; Barnett and Seth 2014; Babiloni et al. 2016; Hejazi and Mona 2019), transfer entropy (Schreiber 2000; Faes, Nollo, and Porta 2011), conditional mutual information (Palus 1994; Palus et al. 2001; Palus and Stefanovska 2003; Frenzel and Pompe 2007; Li and Ouyang 2010; Sun and Bollt 2014), common spatial pattern (CSP) (Jin et al. 2020; Sun et al. 2020), nonlinear prediction methods (Terry and Breakspear 2003; Faes, Porta, and Nollo 2008; Andrzejak and Kreuz 2011), cluster analysis (Stuart, Walter, and Borisyuk 2005), permutation conditional mutual information (Li and Ouyang 2010; Wen et al. 2016; Afshani et al. 2019) and graph theoretic analysis (Stam et al. 2007).
Among these methods, permutation condition mutual information (PCMI) is an effective method for analyzing coupling strength, which is robust to noise (Li and Ouyang 2010). However, PCMI only analyzes the coupling characteristics in the time domain, without considering the information in the frequency domain. Relevant studies have shown that frequency domain information could improve the analysis performance of time domain information for EEG (Chamanzar et al. 2017). Therefore, it is necessary to design a more effective method to analyze EEG signals in both time domain and frequency domain.
This study extended the PCMI method and proposed a new method of weight permutation conditional mutual information (WPCMI) to estimate the coupling strength from the perspective of time domain and frequency domain. To be specific, the time series of pairwise channels were transformed into the spectrum with the help of discrete Fourier transform, and the spectrum values under different frequency bands were extracted. The spectrum values were taken as the weight of a pairwise combination of PCMI to calculate the characteristic values of WPCMI.
Related studies have shown that the EEGLearn method could also be used to improve the classification accuracy of EEG signals in cognitive classification task experiments (Bashivan et al. 2016) and this method preserved the spatial, time and frequency information of EEG signals. Thus, in order to verify the performance of WPCMI, this paper compared the WPCMI, PCMI and EEGlearn methods by analyzing real multi-channel EEG signals to distinguish aMCI with T2DM from NC with T2DM patients.
Material and method
Data Set
The data set for this study were from the The Rocket Force Hospital of Chinese People's Liberation Army, which included 19 aMCI patients with T2DM and 20 NC patients with T2DM (Wen et al. 2016). All participants in the study signed written informed consent forms authorized by the institutional review board of the hospital. In addition, the experiment was conducted in accordance with the Declaration of Helsinki (1964) and was approved by the Beijing Normal University ethics committee. Wen et al. studied the descriptive statistical characteristics, diagnostic criteria and neuropsychological test scale of the subjects, recorded and preprocessed EEG signals, and obtained the demographic and clinical characteristics associated with EEG signals.
Based on previous research (Wen et al. 2016, 2014; Li et al. 2013; Bartolomei et al. 2001; Chai et al. 2019), this study analyzed EEG signals of the following 5 frequency bands: Alpha1 (8–10.5 Hz), Alpha2 (10.5–13 Hz), Beta1 (13-15 Hz), Beta2 (15–30 Hz) and Gamma (30–40 Hz). The values of R, G and B of the corresponding frequency band were needed in the three-channel pixel image conversion. Therefore, 3 frequency bands among 5 frequency bands for combination were choosed. Due to limited space of the paper, only four best frequency band combination results are presented in this paper referring previous studies (Wen et al. 2020a, 2020b): Alpha1, Alpha2 and Gamma combination, Alpha1, Alpha2 and Beta1 combination, Alpha2, Beta1 and Beta2 combination, and Beta1, Beta2 and Gamma combination.
The EEG signal used in this study were from 128 channels, but this study only carried out experiments on 19 channels related to aMCI patients, which were FP2, FZ, FP1, F3, F7, C3, T3, P3, T5, PZ, O1, OZ, O2, P4, T6, C4, T4, F8, F4 (as shown in Fig. 1). In this study, a band-pass filter of 1–45 Hz was first used. Then, the average voltage of electrode 57 (left mastoid, LM) and electrode 100 (right mastoid, RM) in 128 channels was taken as the reference value to resampler the data at a sampling rate of 500 Hz. The artifact of eye movements, muscle movements and other types of movements was removed by visual inspection of the original EEG signals. Finally, the 2-min EEG signals were segmented and analyzed. Specifically, the EEG signals of each subject in the two samples were divided into 239 data segments using a sliding window with a time window length of 500 sampling points and a repetition interval of 250 sampling points.
Fig. 1.

The distribution diagram of 19 channels
PCMI and EEGlearn
Permutation conditional mutual information (PCMI)
PCMI is a method to determine the coupling relationship between two brain regions by combining the sorting pattern and conditional mutual information. Given any two-channel time series and the observation data at a particular moment, the method can determine the probability distribution of sorting mode, joint sorting mode and conditional sorting mode in m-dimensional space. Thus, the sequencing entropy in these three modes can be obtained, and PCMI values of pairwise EEG signals can be calculated (Wen et al. 2016).
EEGLearn
Studies showed that the classification accuracy of EEG signals could be improved using convolutional neural network, after converting EEG signals into a series of multi-spectral images with preserved topological structures. The EEGLearn method preserved the spatial, time and frequency information of EEG signals. And the cognitive load classification task experiment showed that the EEGLearn method could improve its classification performance (Bashivan et al. 2016).
Weighted permutation conditional mutual information(WPCMI)
In this research, time domain features and frequency domain features were combined to apply to the classification and recognition of the human brain cognitive impairment stage. In other words, the idea of the weighted average of time domain PCMI method was proposed, and the required weights were calculated according to the discrete Fourier transform method. Figure 2 shows the process of the method described in this article.
Fig. 2.

Feature extraction and classification process of WPCMI
This method used permutation conditional mutual information to determine the coupling strength between channels in different brain regions for different frequency bands. Firstly, the PCMI coupling strength value between channels in a certain frequency band was calculated, where {Alpha1(8 ~ 10.5 Hz), Alpha2(10.5 ~ 13 Hz), Beta1(13 ~ 20 Hz), Beta2(20 ~ 30 Hz), Gamma(30 ~ 40 Hz)}.
For multi-channel EEG signal data, two time series and were selected alternately from different channels, which were and . Then, the sum of and was input into the m-dimensional space, and the m-dimensional vector and were obtained ( and ,, represents the delay time). Sorted and in ascending order respectively. If two equal values existed in and , then the two values should be sorted according to their subscripts. After the process above, each vector of length n in m-dimensional space had sort mode, which was expressed as . If one time series was divided by the length of the time window, each window could be a sequence arrangement. Therefore, each time series had many different sorting modes. The way to get some information about the time series by calculating the probability of the occurrence of the sorting mode is permutation conditional mutual information.
Assuming that the sorting modes of the above two time series and satisfy the probability density function and ; is the joint probability density function of the two sequences; is the conditional probability density function of x when y exists. Based on the mathematical quantities above and related theory, the entropy of arrangement and permutation conditional mutual information are calculated:
| 1 |
| 2 |
| 3 |
| 4 |
where is the permutation entropy of ; is the permutation entropy of ; is the joint permutation entropy of and ; is conditional permutation entropy of given .
According to formula (3) and (4), the permutation conditional mutual information of , can be calculated:
| 5 |
| 6 |
where, and represent the observed values of and in the next moment (the value of is taken from 3 to 15), namely: . The coupling strength from channel to channel can be calculated:
| 7 |
And the coupling strength from channel to channel is:
| 8 |
In Eq. (7) and (8), and are two time series from different electrode channels.
In this method, other parameter values and three probability density functions were set according to the analysis method of multi-channel EEG signals in existing studies (Wen et al. 2016). Wherein, the delay time is 20, the embedding dimension m is 3, and the time window length n is 500, to calculate the coupling coefficient.
Since the time series of EEG signals are non-stationary signals, the global Fourier transform cannot meet the needs of spectrum analysis of the series. Therefore, the discrete Fourier transform (DTF) was used in this study to calculate the spectrum values of each time domain window, which was defined as follows:
| 9 |
where exp{} represents the base of the natural logarithm. i represents the imaginary unit. m represents the electrode channel. k represents the ordinal number of sampling frequency. n represents the number of sampling frequency. is the frequency spectrum value calculated by DFT. is the input signal during sampling, which is the real signal. The single-frequency component of linear frequency can be represented by complex exponential , where is the sampling time interval.
Then fast Fourier transform was used to calculate the amplitude of each electrode channel in the corresponding frequency band . According to the frequency range value above, would be averaged and normalized. The spectrum value under frequency band f of channel X and under frequency band f of channel Y could be calculated from Eq. (9), as shown in Eqs. (10) and (11).
| 10 |
| 11 |
represents the k th frequency sampling point on frequency band f, represents the spectrum value of the k th frequency sampling point on channel X, where .
The method of weighted average feature extraction is common in the field of image recognition, and an adaptive weighted fusion method has been applied to face recognition with remarkable results (Huo 2015). This study make use of the idea of weighted average feature fusion, which is beneficial to extract more refined features. The weight coefficients used in the WPCMI method are the average of the amplitude values of the discrete Fourier transform (DFT) of the EEG signals.
According to the calculation method of weighted average value, the weighted coupling coefficient value of channel X and channel Y in frequency band f could be obtained, which is named as , and the results are shown in Eq. (12):
| 12 |
In Eq. (12), is the WPCMI characteristic value extracted by channel combination (X, Y) in the multi-channel EEG signal under frequency band f. When X = Y, , the WPCMI characteristic value in the frequency band f is shown in Eq. (13). In the calculation, the frequency band f is constant.
| 13 |
The WPCMI characteristic matrix of all channel combinations can be represented by an upper triangular matrix, as shown in Eq. (14).
| 14 |
Classification and statistical analysis
In this study, WPCMI characteristic value of 19-channel EEG signals under 5 frequency bands were calculated respectively. And the values of in 3 frequency bands were selected as three color channel values of three-channel pixel images. There are 171 unordered combinations of any two channels in all 19 channels. Adding the combined value of the 19 channels themselves, 190 values could be obtained and arranged into a 10*19 image matrix. Figure 3 shows the three-channel pixel image generated by the WPCMI feature combination of Alpha1, Alpha2 and Gamma frequency bands in aMCI and NC samples, with the size of 10*19.
Fig. 3.

WPCMI three-channel pixel image of a combination of Alpha1, Alpha2 and Gamma bands for aMCI and NC samples. a represents the three-channel pixel image of aMCI, and b represents the three-channel pixel image of NC
Finally, three-channel pixel images of the two samples were input into the convolutional neural network for classification. The schematic diagram of the convolutional neural network is shown in Fig. 4.
Fig. 4.

WPCMI characteristic convolution classification structure of Alpha1, Alpha2 and Gamma band combination
As shown in Fig. 4, combined WPCMI feature value of frequency bands f1,f2,f3 into a three dimensional matrix. Then mapped it into a three-channel image and input into the convolutional network for classification. The structure of the convolutional neural network consisted of two convolutional layers (convolution kernel is 3*3) and two pooling layers (pooling kernel is 2*2). The convolution layer operation (ReLU was selected as the activation function) was performed firstly and then alternated with the pooling layer operation. Finally, two full connection layers were used to combine the feature vectors and operated softmax normalized to output categories.
For the machine learning, selecting an appropriate evaluation method and evaluation index is important. In this study, K-fold cross validation (K = 5) was adopted to verify the reliability of the method. Then, the mean value of the evaluation index after K-fold cross validation was used to evaluate the performance of the model. Finally, precision, recall, F1-score, AUC and average classification accuracy were used to evaluate the method.
Results
Classification results under different feature extraction methods
Table 1 presents the classification performance with CNN classifier on four frequency band combinations separately. Table 1a presents the classification performance of Alpha1, Alpha2 and Beta1 combinations, which shows that the highest precision, recall, F1 score and AUC of the WPCMI method are slightly less than that of the EEGLearn. These four indicators of the PCMI method are all lower, which are about 0.2 lower than that of the WPCMI method. Table 1b presents the classification performance of Alpha2, Beta1 and Beta2 combinations with CNN classifier, which shows that the highest precision, recall, F1 score and AUC of the WPCMI method are slightly higher than that of the EEGLearn method. And the highest precision of the WPCMI method is 0.01 higher than that of the EEGLearn method. Compared with the WPCMI method, the PCMI method is about 0.28 lower in the above four indexes. Table 1c shows the classification performance of the three methods in combination with Beta1, Beta2 and Gamma with CNN classifier. Among them, the highest precision of the WPCMI method is 0.02 higher than that of the EEGLearn method and 0.27 higher than that of the PCMI method. WPCMI is also better than the other two methods in the other three evaluation indexes. Table 1d shows the classification performance of the three methods in the combination of Alpha1, Alpha2 and Gamma with CNN classifier. The highest precision, recall and F1 score of the WPCMI method are 0.05 higher than those of the EEGLearn method, and the highest AUC value is 0.04 higher. All the classification performance indexes of WPCMI are far exceeded those of the PCMI method.
Table 1.
Precision, recall, F1-score and AUC for WPCMI, EEGlearn and PCMI method
| Method | Precision | Recall | F1-score | AUC |
| (a) Alpha1, Alpha2 and Beta1 combination | ||||
| WPCMI | 0.91 | 0.91 | 0.91 | 0.97 |
| EEGLearn | 0.92 | 0.92 | 0.92 | 0.97 |
| PCMI | 0.71 | 0.71 | 0.71 | 0.76 |
| (b) Alpha2, Beta1 and Beta2 combination | ||||
| WPCMI | 0.95 | 0.95 | 0.95 | 0.98 |
| EEGLearn | 0.94 | 0.94 | 0.94 | 0.98 |
| PCMI | 0.67 | 0.67 | 0.67 | 0.73 |
| (c)Beta1, Beta2 and Gamma combination | ||||
| WPMCI | 0.96 | 0.96 | 0.96 | 0.99 |
| EEGLearn | 0.94 | 0.94 | 0.94 | 0.97 |
| PCMI | 0.69 | 0.69 | 0.68 | 0.74 |
| (d) Alpha1, Alpha2 and Gamma combination | ||||
| WPCMI | 0.96 | 0.96 | 0.96 | 0.99 |
| EEGLearn | 0.91 | 0.91 | 0.91 | 0.95 |
| PCMI | 0.73 | 0.73 | 0.73 | 0.80 |
Figure 5a shows the average classification accuracy curve of the three feature extraction methods under the combination of Alpha1, Alpha2 and Beta1. Among them, the average classification accuracy curve of the WPCMI method and PCMI method tends to be stable after 100 iterations, while the average classification accuracy curve of the EEGLearn method tends to be stable after 120 iterations. After the stabilization, the highest accuracy of WPCMI and EEGLearn reaches about 0.91 and the accuracy of these two approaches are nearly the same.
Fig. 5.

Average classification accuracy curve of four frequency band combination a Alpha1, Alpha2 and Beta1 combination b Alpha2, Beta1 and Beta2 combination c Beta1, Beta2 and Gamma combination d Alpha1, Alpha2 and Gamma combination
Figure 5b shows the average classification accuracy curve of the three feature extraction methods under the combination of Alpha2, Beta1 and Beta2. The average classification accuracy curves of the WPCMI method and PCMI method tend to be stable after 40 iterations, while the accuracy curve of the EEGLearn method tends to be stable after 67 iterations. Moreover, the accuracy of the WPCMI method is higher than that of the other two methods from the 1st iteration to the 67th iteration.
Figure 5c shows the average classification accuracy curve of the three feature extraction methods under the combination of Beta1, Beta2 and Gamma. The accuracy curves of the WPCMI method and PCMI method become stable after 50 iterations, while the accuracy curve of the EEGLearn method becomes stable after 93 iterations.
Figure 5d shows the average classification accuracy curve of the three feature extraction methods under the combination of Alpha1, Alpha2 and Gamma combination. The accuracy curve of the WPCMI method tends to be stable after 190 iterations, with the highest accuracy reaching about 0.96. The accuracy curve of the PCMI method tends to be stable after 40 iterations, but the accuracy is below 0.73. Moreover, the accuracy curve of the EEGLearn method fluctuates greatly, with the highest average accuracy reaching about 0.91.
It can be seen from the classification of the four frequency band combinations above: the classification effect of the WPCMI method is the best, and the average accuracy of the four frequency band combinations reaches 0.95. The second method is EEGlearn, with an average accuracy of 0.91. The PCMI approach is the worst for classification. Compared with the combination of each band, the WPCMI feature extraction method has the best classification performance under the combination of Beta1, Beta2 and Gamma and Alpha1, Alpha2 and Gamma.
As can be seen from Fig. 6, under four frequency band combinations, the accuracy curve of WPCMI classification results tends to be stable after 185 iterations, and the average accuracy value is greater than 0.90. The average accuracy curve of Alpha1, Alpha2 and Gamma band combination converges slowest. Among them, the frequency band combinations with the highest average accuracy are Beta1, Beta2, Gamma and Alpha1, Alpha2 and Gamma.
Fig. 6.

Average classification accuracy curve of WPCMI characteristic value under four frequency band combinations
Comparison of classification performance based on SVM and CNN
To verify the WPCMI characteristics extracted from multi-channel EEG signals are not greatly affected by the classifier, this study used support vector machines(SVM) to classify the extracted WPCMI characteristics. And compared with the results of the CNN in Sect. 3.1. By combining three frequency bands, the WPCMI characteristics were input into the SVM classifier for classification. The SVM classifier used the RBF kernel function, selected the best parameter combination (C, Gamma) by grid search to train and classify WPCMI features, and used the same frequency band combination of WPCMI features in Sect. 3.1 for classification. As shown in Fig. 7, the average accuracy, precision, recall, F1 score and AUC of Alpha1, Alpha2 and Gamma band combinations are higher than those of the other three frequency bands.
Fig. 7.

Classification of four frequency band combinations of CNN classification
The results of SVM for frequency band combinations classification compared with the results of CNN are shown in Table 2(all are average values). The average classification accuracy value in the table is the maximum value when the average classification accuracy curve of the corresponding frequency band combination tends to be stable.
Table 2.
Average classification accuracy, precision, recall, F1-score and AUC for classifier CNN and SVM
| Classifier | Accuracy | Precision | Recall | F1-score | AUC |
|---|---|---|---|---|---|
| (a) Alpha1, Alpha2 and Beta1 combination | |||||
| CNN | 0.92 | 0.91 | 0.91 | 0.91 | 0.97 |
| SVM | 0.94 | 0.94 | 0.94 | 0.94 | 0.94 |
| (b) Alpha2, Beta1 and Beta2 combination | |||||
| CNN | 0.95 | 0.95 | 0.95 | 0.95 | 0.98 |
| SVM | 0.89 | 0.90 | 0.90 | 0.90 | 0.90 |
| (c) Beta1, Beta2 and Gamma combination | |||||
| CNN | 0.95 | 0.96 | 0.96 | 0.96 | 0.99 |
| SVM | 0.89 | 0.90 | 0.90 | 0.90 | 0.90 |
| (d) Alpha1, Alpha2 and Gamma combination | |||||
| CNN | 0.96 | 0.96 | 0.96 | 0.96 | 0.99 |
| SVM | 0.97 | 0.98 | 0.98 | 0.98 | 0.98 |
It can be seen from the five evaluation indicators in the above four classification results, the average classification accuracy of SVM is slightly higher than CNN for the classification of Alpha1, Alpha2, Beta1 combination and Alpha1, Alpha2 and Gamma combination. For the classification of Alpha2, Beta1 and Beta2 combination and Beta1, Beta2 and Gamma combination, the average classification accuracy of CNN is higher than that of SVM. It can be seen from each table that the AUC of CNN is always greater than that of SVM.
Figure 8 shows the comparison between CNN and SVM on average classification accuracy in four different frequency band combinations. The average classification accuracy of these two classifiers in Alpha1, Alpha2 and Gamma bands is higher than that of the other three frequency band combinations.
Fig. 8.
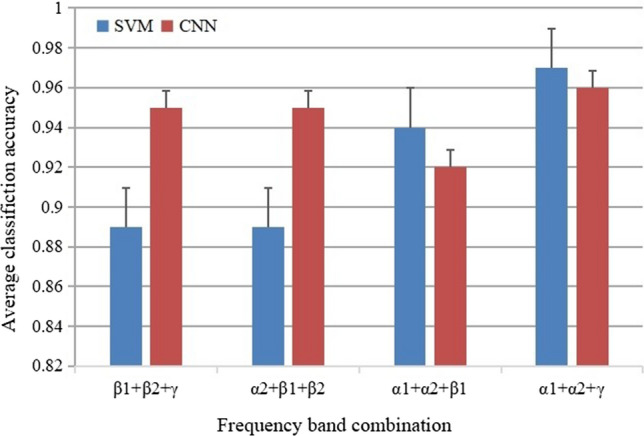
Average classification accuracy of SVM and CNN for four frequency band combinations
To sum up, different classifiers were used to classify WPCMI characteristics in this research. From the classification results of the five evaluation indexes, the influence of the two classifiers on the classification results was small.
Discussion
Feasible and effectiveness of WPCMI method
There have been a variety of methods including PCMI to study the coupling relationship between neural signals and validate the effectiveness in extracting the coupling features of neural data (Cui et al. 2016). And EEGLearn was also used to research feature extraction of EEG signals (Li and Ouyang 2010; Brzezicka et al. 2011; Katarzyn and Blinowska 2010; Vecchio and Babiloni 2011; Faes et al. 2016; Wen et al. 2016). However, PCMI only analyzes the coupling characteristics in the time domain, without considering the information in the frequency domain. Relevant studies have shown that frequency domain information can improve the analysis performance of EEG signal time domain information (Chamanzar et al. 2017). In addition, EEGLeran also had the problem of insufficient expression of time domain features (Bashivan et al. 2016).
Compared with the PCMI and EEGLearn, the WPCMI method takes into account the influence of the frequency domain. With the help of discrete Fourier transform, the time series of pairwise channels are converted into a spectrum, and the spectrum values under different frequency bands are extracted. The spectrum values are taken as the weight of PCMI for pairwise combination, and the characteristic values of WPCMI are calculated. The classification of aMCI with T2DM and NC with T2DM showed that the classification performance of WPCMI proposed in this study exceeded that of PCMI and EEGLearn methods in multiple frequency band combinations. Therefore, the WPCMI method proposed in this paper is effective.
The clinical performance of the WPCMI method
Based on the experimental results in Sects. 3.1 and 3.2, the WPCMI method was more effective than PCMI in the early diagnosis of aMCI. The experimental results showed that the accuracy curve of Alpha1, Alpha2 and Gamma band combination converged most slowly. Moreover, the results indicated that the classification of WPCMI features was the best, with the average classification accuracy of the four combinations reaching 0.95. The frequency band combinations with the higher classification accuracy were Beta1, Beta2, Gamma and Alpha1, Alpha2 and Gamma. The WPCMI characteristics in the Gamma band may also be an effective biomarker for aMCI with T2DM. The results were similar to those of previous studies, that there were significant differences in the coupling intensity of EEG signals in different brain regions for aMCI with T2DM and NC with T2DM (Cui et al. 2015; Wen et al. 2016). And proved that the proposed algorithm had better clinical application performance than previous algorithms.
As relevant studies have shown that the changes in the Gamma band can better reflect the differences in cognitive activities (White et al. 2019; Moretti et al. 2008; Başar et al. 2019), calculations involving the Gamma band can more accurately distinguish between high and low cognitive abilities (Wen et al. 2020a, b), and can also improve the effect of distinguishing whether there are cognitive disorders (Tao and Tian, 2006). Therefore, the biological significance of the Gamma band confirms that the classification performance of the combination of Beta1, Beta2, Gamma or Alpha1, Alpha2, Gamma in this paper is better than that of other band combinations which do not include the Gamma band.
Because the sample size of this paper is small, the method can be further verified by adding more EEG signal samples. At the same time, as the future development direction, a classifier that best matches the feature extraction method might be chosen to compare with the WPCMI method to improve classification performance. And in the future, some feature extraction ideas in this analysis area of ERP signals (Miao et al. 2020; Zhang et al. 2021) can be used to improve the WPCMI method. Moreover, the multivariate multi-scale method could be combined into the WPCMI method, which can quantify not only the characteristics of different brain regions and multiple time scales but also the amplitude information contained in the multichannel EEG signals simultaneously (Deng et al. 2017).
Conclusion
In this research, a feature extraction method of EEG signal based on the WPCMI method was proposed. Then, CNN and SVM were used to classify these features. This WPCMI method combined time domain and frequency domain to calculate the EEG signal, and its classification performance was better than the previous EEG signal feature extraction methods in aMCI with T2DM diagnosis field. Therefore, the WPCMI method can be used as an effective biomarker to distinguish EEG signals of aMCI with T2DM and NC with T2DM, and can provide a new perspective for EEG signal analysis of aMCI with T2DM.
Acknowledgment
This research was funded by National Natural Science Foundation of China (61876165, 61503326), Natural Science Foundation of Hebei Province in China (F2016203343), China Postdoctoral Science Foundation (2015M581317). The authors have no any potential conflicts.
Footnotes
Publisher's Note
Springer Nature remains neutral with regard to jurisdictional claims in published maps and institutional affiliations.
Yijun Liu, Xiaodong Xu and Yanhong Zhou contributed equally to this paper.
References
- Afshani F, Shalbaf A, Shalbaf R, et al. Frontal-temporal functional connectivity of EEG signal by standardized permutation mutual information during anesthesia. Cogn Neurodyn. 2019;13(6):531–540. doi: 10.1007/s11571-019-09553-w. [DOI] [PMC free article] [PubMed] [Google Scholar]
- Andrzejak RG, Kreuz T. Characterizing unidirectional couplings between point processes and flows. EPL (Europhys Lett) 2011;96:50012. [Google Scholar]
- Arkady Pikovsky MR, Kurths J. Synchronization: A Universal Concept in Nonlinear Sciences. Cambridge: Cambridge University Press; 2003. p. 411. [Google Scholar]
- Babiloni C, Del PC, Lizio R, Marzano N, Infarinato F, Soricelli A, Salvatore E, Ferri R, Bonforte C, Tedeschi GJNoA. Cortical sources of resting state electroencephalographic alpha rhythms deteriorate across time in subjects with amnesic mild cognitive impairment. Neurobiol Aging. 2014;35(1):130–142. doi: 10.1016/j.neurobiolaging.2013.06.019. [DOI] [PubMed] [Google Scholar]
- Babiloni C, Lizio R, Marzano N, Capotosto P, Soricelli A, Triggiani AI, Cordone S, Gesualdo L, Del Percio C. Brain neural synchronization and functional coupling in Alzheimer's disease as revealed by resting state EEG rhythms. Int J Psychophysiol. 2016;103:88–102. doi: 10.1016/j.ijpsycho.2015.02.008. [DOI] [PubMed] [Google Scholar]
- Bartolomei F, Wendling F, Bellanger JJ, et al. Neural networks involving the medial temporal structures in temporal lobe epilepsy. Clin Neurophysiol Off J Int Fed Clin Neurophysiol. 2001;112(9):1746–1760. doi: 10.1016/s1388-2457(01)00591-0. [DOI] [PubMed] [Google Scholar]
- Barnett L, Seth AK. The MVGC multivariate Granger causality toolbox: a new approach to Granger-causal inference. J Neurosci Methods. 2014;223:50–68. doi: 10.1016/j.jneumeth.2013.10.018. [DOI] [PubMed] [Google Scholar]
- Başar M, Duru A, Akan A. (2019). Investigation of Emotional Changes Using Features of EEG-Gamma Band and Different Classifiers. 2019 Medical Technologies Congress (TIPTEKNO), Izmir, Turkey.
- Bashivan P, Rish I, Yeasin M, et al. (2016). Learning Representations from EEG with Deep Recurrent-Convolutional Neural Networks. International conference on learning representations.
- Baskaran A, Milev R, Mcintyre RSJNDT. A review of electroencephalographic changes in diabetes mellitus in relation to major depressive disorder. Neuropsychiatr Dis Treat. 2013;2013(9):143–150. doi: 10.2147/NDT.S38720. [DOI] [PMC free article] [PubMed] [Google Scholar]
- Bian Z, Li Q, Wang L, Lu C, Yin S, Li X. Relative power and coherence of EEG series are related to amnestic mild cognitive impairment in diabetes. Front Aging Neurosci. 2014;6:11. doi: 10.3389/fnagi.2014.00011. [DOI] [PMC free article] [PubMed] [Google Scholar]
- Brzezicka A, Kaminski M, Kaminski J, et al. Information transfer during a transitive reasoning task. Brain Topogr. 2011;24(1):1–8. doi: 10.1007/s10548-010-0158-6. [DOI] [PMC free article] [PubMed] [Google Scholar]
- Busse A, Hensel A, Gühne U, Angermeyer M. Mild cognitive impairment: long-term course of four clinical subtypes. Neurol. 2006;67(12):2176. doi: 10.1212/01.wnl.0000249117.23318.e1. [DOI] [PubMed] [Google Scholar]
- Cantero JL, Atienza M, Cruz-Vadell A, Suarez-Gonzalez A, Gil-Neciga E. Increased synchronization and decreased neural complexity underlie thalamocortical oscillatory dynamics in mild cognitive impairment. Neuroimage. 2009;46:938–948. doi: 10.1016/j.neuroimage.2009.03.018. [DOI] [PubMed] [Google Scholar]
- Chai X, Weng X, Zhang Z, et al (2019) Quantitative EEG in mild cognitive impairment and alzheimer’s disease by AR-spectral and multi-scale entropy analysis. World Congr Med Phys Biomed Eng Singap 159–163
- Chamanzar A, Shabany M, Malekmohammadi A, et al. Efficient hardware implementation of real-time low-power movement intention detector system using FFT and adaptive wavelet transform. IEEE Trans Biomed Circuits Syst. 2017;11(3):585–596. doi: 10.1109/TBCAS.2017.2669911. [DOI] [PubMed] [Google Scholar]
- Cooray G, Nilsson E, Wahlin A, Brismar K, Brismar TJCN. MO32 Effect of intensified metabolic control on cognitive performance and EEG in patients with type 2 diabetes. Clin Neurophysiol. 2008;119(08):S38–S38. [Google Scholar]
- Cooray G, Nilsson E, Wahlin A, Laukka EJ, Brismar K, Brismar TJP. Effects of intensified metabolic control on CNS function in type 2 diabetes. Psychoneuroendocrinol. 2011;36(1):77–86. doi: 10.1016/j.psyneuen.2010.06.009. [DOI] [PubMed] [Google Scholar]
- Cui D, Pu W, Liu J, et al. A new EEG synchronization strength analysis method: S-estimator based normalized weighted-permutation mutual information. Neural Netw. 2016;82(C):30–38. doi: 10.1016/j.neunet.2016.06.004. [DOI] [PubMed] [Google Scholar]
- Cui D, Wang J, Bian Z. Analysis of entropies based on empirical mode decomposition in amnesic mild cognitive impairment of diabetes mellitus. J Innov Opt Health Sci. 2015;8(5):1550010. [Google Scholar]
- Darvas F, Ojemann JG, Sorensen LB. Bi-phase locking—a tool for probing non-linear interaction in the human brain. Neuroimage. 2009;46:123–132. doi: 10.1016/j.neuroimage.2009.01.034. [DOI] [PMC free article] [PubMed] [Google Scholar]
- Dauwels J, Vialatte F, Cichocki AJCAR. Diagnosis of Alzheimer's disease from EEG signals: where are we standing? Curr Alzheimer Res. 2010;7(6):487–505. doi: 10.2174/156720510792231720. [DOI] [PubMed] [Google Scholar]
- Deng B, Cai L, Li S, et al. Multivariate multi-scale weighted permutation entropy analysis of EEG complexity for Alzheimer's disease. Cogn Neurodyn. 2017;11(3):217–231. doi: 10.1007/s11571-016-9418-9. [DOI] [PMC free article] [PubMed] [Google Scholar]
- Faes L, Erla S, Nollo G. Measuring connectivity in linear multivariate processes: definitions, interpretation, and practical analysis. Comput Math Methods Med. 2012;2012:140513. doi: 10.1155/2012/140513. [DOI] [PMC free article] [PubMed] [Google Scholar]
- Faes L, Marinazzo D, Nollo G, et al. An Information-Theoretic Framework to Map the Spatiotemporal Dynamics of the Scalp Electroencephalogram. IEEE Trans Biomed Eng. 2016;63(12):2488–2496. doi: 10.1109/TBME.2016.2569823. [DOI] [PubMed] [Google Scholar]
- Faes L, Nollo G, Porta A. Information-based detection of nonlinear Granger causality in multivariate processes via a nonuniform embedding technique. Phys Rev E Stat Nonlin Soft Matter Phys. 2011;83:051112. doi: 10.1103/PhysRevE.83.051112. [DOI] [PubMed] [Google Scholar]
- Faes L, Porta A, Nollo G. Mutual nonlinear prediction as a tool to evaluate coupling strength and directionality in bivariate time series: comparison among different strategies based on k nearest neighbors. Phys Rev E Stat Nonlin Soft Matter Phys. 2008;78:026201. doi: 10.1103/PhysRevE.78.026201. [DOI] [PubMed] [Google Scholar]
- Frenzel S, Pompe B. Partial mutual information for coupling analysis of multivariate time series. Phys Rev Lett. 2007;99:204101. doi: 10.1103/PhysRevLett.99.204101. [DOI] [PubMed] [Google Scholar]
- Ganguli M, Dodge H, Shen C, DeKosky S. Mild cognitive impairment, amnestic type An epidemiologic study. Neurol. 2004;63(1):115. doi: 10.1212/01.wnl.0000132523.27540.81. [DOI] [PubMed] [Google Scholar]
- Gispen WH, Biessels G-J. Cognition and synaptic plasticity in diabetes mellitus. Trends Neurosci. 2000;23(11):542–549. doi: 10.1016/s0166-2236(00)01656-8. [DOI] [PubMed] [Google Scholar]
- Granger CWJ. Investigating causal relations by econometric models and cross-spectral methods. Econometrica. 1969;37:15. [Google Scholar]
- Hejazi M. Prediction of epilepsy seizure from multi-channel electroencephalogram by effective connectivity analysis using Granger causality and directed transfer function methods. Cogn Neurodyn. 2019;13(5):461–473. doi: 10.1007/s11571-019-09534-z. [DOI] [PMC free article] [PubMed] [Google Scholar]
- Shimada H, Miki T, Tamura A, Ataka S. Neuropsychological status of elderly patients with diabetes mellitus. Diabet Res Clin Pract. 2010;87(3):224–227. doi: 10.1016/j.diabres.2009.09.026. [DOI] [PubMed] [Google Scholar]
- Huo Y. A novel face recognition algorithm based on the multi-dimensional algorithm. Harbin: Harbin University of Science and Technology; 2015. [Google Scholar]
- Hussain HJN. Conversion from subtypes of mild cognitive impairment to Alzheimer dementia. Neurol. 2007;68(4):288–291. doi: 10.1212/01.wnl.0000252358.03285.9d. [DOI] [PubMed] [Google Scholar]
- Jin J, Xiao R, Daly I, et al. Internal feature selection method of CSP based on L1-Norm and Dempster-Shafer Theory. Trans Neural Netw Learning Syst. 2020 doi: 10.1109/TNNLS.2020.3015505. [DOI] [PubMed] [Google Scholar]
- Katarzyn J, Blinowska JZ. Practical biomedical signal analysis using MATLAB. USA: CRC Press; 2010. [Google Scholar]
- Knyazeva MG, Carmeli C, Khadivi A, Ghika J, Meuli R, Frackowiak RS. Evolution of source EEG synchronization in early Alzheimer's disease. Neurobiol Aging. 2013;34(3):694–705. doi: 10.1016/j.neurobiolaging.2012.07.012. [DOI] [PubMed] [Google Scholar]
- Kurths, A. P. M. R. J. (2003). Synchronization: A Universal Concept in Nonlinear Sciences. Cambridge Nonlinear Science Series (Vol. 12): Cambridge University Press.
- Li X, Ouyang G. Estimating coupling direction between neuronal populations with permutation conditional mutual information. Neuroimage. 2010;52:497–507. doi: 10.1016/j.neuroimage.2010.05.003. [DOI] [PubMed] [Google Scholar]
- Li X, Yan Y, Wei W. Identifying Patients with Poststroke Mild Cognitive Impairment by Pattern Recognition of Working Memory Load-Related ERP. Comput Math Methods Med. 2013 doi: 10.1155/2013/658501. [DOI] [PMC free article] [PubMed] [Google Scholar]
- Luchsinger JA, Reitz C, Patel B, Tang MX, Manly JJ, Mayeux R. Relation of diabetes to mild cognitive impairment. Arch Neurol. 2007;64(4):570–575. doi: 10.1001/archneur.64.4.570. [DOI] [PubMed] [Google Scholar]
- Miao Y, Yin E, Allison BZ, et al. An ERP-based BCI with peripheral stimuli: validation with ALS patients. Cogn Neurodyn. 2020;14:21–33. doi: 10.1007/s11571-019-09541-0. [DOI] [PMC free article] [PubMed] [Google Scholar]
- Rosenblum MG, Pikovsk AS, Kurths J. Phase synchronization of chaotic oscillators. Phys Rev Lett. 1995;76:4. doi: 10.1103/PhysRevLett.76.1804. [DOI] [PubMed] [Google Scholar]
- Moretti DV, Frisoni GB, Pievani M, Rosini S, Geroldi C, Binetti G, et al. Cerebrovascular disease and hippocampal atrophy are differently linked to functional coupling of brain areas: an EEG coherence study in MCI subjects. J Alzheimer’s Dis. 2008;14:28–99. doi: 10.3233/jad-2008-14303. [DOI] [PubMed] [Google Scholar]
- Muller A, Kraemer JF, Penzel T, Bonnemeier H, Kurths J, Wessel N. Causality in physiological signals. Physiol Meas. 2016;37:R46–72. doi: 10.1088/0967-3334/37/5/R46. [DOI] [PubMed] [Google Scholar]
- Palus M. Coarse-grained entropy rates for characterization of complex time series. Physica D: Nonlinear Phenom. 1994;93(12):64–77. [Google Scholar]
- Palus M, Komarek V, Hrncir Z, Sterbova K. Synchronization as adjustment of information rates: detection from bivariate time series. Phys Rev E Stat Nonlin Soft Matter Phys. 2001;63:046211. doi: 10.1103/PhysRevE.63.046211. [DOI] [PubMed] [Google Scholar]
- Palus M, Stefanovska A. Direction of coupling from phases of interacting oscillators: an information-theoretic approach. Phys Rev E Stat Nonlin Soft Matter Phys. 2003;67:055201. doi: 10.1103/PhysRevE.67.055201. [DOI] [PubMed] [Google Scholar]
- Pikovsky AS. On the interaction of strange attractors. Condensed Matte. 1983;55:6. [Google Scholar]
- Roberts R, Knopman D, Geda Y. Association of diabetes with amnestic and nonamnestic mild cognitiveimpairment. Alzheimers Dement. 2014;10(1):18–26. doi: 10.1016/j.jalz.2013.01.001. [DOI] [PMC free article] [PubMed] [Google Scholar]
- Romero-Garcia R, Atienza M, Cantero JL. Predictors of coupling between structural and functional cortical networks in normal aging. Hum Brain Mapp. 2014;35:2724–2740. doi: 10.1002/hbm.22362. [DOI] [PMC free article] [PubMed] [Google Scholar]
- Rudrauf D, Douiri A, Kovach C, Lachaux JP, Cosmelli D, Chavez M, Adam C, Renault B, Martinerie J, Le Van Quyen M. Frequency flows and the time-frequency dynamics of multivariate phase synchronization in brain signals. Neuroimage. 2006;31:209–227. doi: 10.1016/j.neuroimage.2005.11.021. [DOI] [PubMed] [Google Scholar]
- Rulkov NF, Sushchik MM, Tsimring LS, Abarbanel HDI. Generalized synchronization of chaos in directionally coupled chaotic systems. Phys Rev E. 1995;51:980–994. doi: 10.1103/physreve.51.980. [DOI] [PubMed] [Google Scholar]
- Schreiber T. Measuring information transfer. Phys Rev Lett. 2000;85:4. doi: 10.1103/PhysRevLett.85.461. [DOI] [PubMed] [Google Scholar]
- Seth AK. A MATLAB toolbox for Granger causal connectivity analysis. J Neurosci Methods. 2010;186:262–273. doi: 10.1016/j.jneumeth.2009.11.020. [DOI] [PubMed] [Google Scholar]
- Shoback and Dolores . Greenspan’s basic and clinical endocrinology. 9. NewYork: McGraw-Hill Medical; 2011. [Google Scholar]
- Stam CJ, Jones BF, Nolte G, Breakspear M, Scheltens P. Small-world networks and functional connectivity in Alzheimer's disease. Cereb Cortex. 2007;17:92–99. doi: 10.1093/cercor/bhj127. [DOI] [PubMed] [Google Scholar]
- Steriade M. Grouping of brain rhythms in corticothalamic systems. Neurosci. 2006;137(4):1087–1106. doi: 10.1016/j.neuroscience.2005.10.029. [DOI] [PubMed] [Google Scholar]
- Strachan MW, Reynolds RM, Marioni RE, Price JF. Cognitive function, dementia and type 2 diabetes mellitus in the elderly. Nat Rev Endocrinol. 2011;7(2):108–114. doi: 10.1038/nrendo.2010.228. [DOI] [PubMed] [Google Scholar]
- Stuart L, Walter M, Borisyuk R. The correlation grid: analysis of synchronous spiking in multi-dimensional spike train data and identification of feasible connection architectures. Biosyst. 2005;79:223–233. doi: 10.1016/j.biosystems.2004.09.011. [DOI] [PubMed] [Google Scholar]
- Sun J, Bollt EM. Causation entropy identifies indirect influences, dominance of neighbors and anticipatory couplings. Physica D. 2014;267:49–57. [Google Scholar]
- Sun H, Jin J, Kong W, et al. Novel channel selection method based on position priori weighted permutation entropy and binary gravity search algorithm. Cogn Neurodyn. 2020;15(1):114–156. doi: 10.1007/s11571-020-09608-3. [DOI] [PMC free article] [PubMed] [Google Scholar]
- Tao H, Tian X. (2006). Coherence Characteristics of Gamma-band EEG during rest and cognitive task in MCI and AD. 2005 IEEE Engineering in Medicine and Biology 27th Annual Conference, pp 2747–2750, Shanghai, China. [DOI] [PubMed]
- Terry JR, Breakspear M. An improved algorithm for the detection of dynamical interdependence in bivariate time-series. Biol Cybern. 2003;88:129–136. doi: 10.1007/s00422-002-0368-4. [DOI] [PubMed] [Google Scholar]
- Vecchio F, Babiloni C. Direction of Information Flow in Alzheimer's Disease and MCI Patients. Int J Alzheimers Dis. 2011;2011:214580. doi: 10.4061/2011/214580. [DOI] [PMC free article] [PubMed] [Google Scholar]
- Wen D, Bian Z, Li Q, et al. Resting-state EEG coupling analysis of amnestic mild cognitive impairment with type 2 diabetes mellitus by using permutation conditional mutual information. Clin Neurophysiol. 2016;127(1):335–348. doi: 10.1016/j.clinph.2015.05.016. [DOI] [PubMed] [Google Scholar]
- Wen D, Xue Q, Lu C. A global coupling index of multivariate neural series with application to the evaluation of mild cognitive impairment. Neural Netw. 2014;56:1–9. doi: 10.1016/j.neunet.2014.03.001. [DOI] [PubMed] [Google Scholar]
- Wen D, Yuan J, Zhou Y, et al. The EEG Signal Analysis for Spatial Cognitive Ability Evaluation Based on Multivariate Permutation Conditional Mutual Information-Multi-Spectral Image. IEEE Trans Neural Syst Rehabil Eng. 2020;28(10):2113–2122. doi: 10.1109/TNSRE.2020.3018959. [DOI] [PubMed] [Google Scholar]
- Wen D, Zhou Y, Li P, et al. Resting-state EEG Signal Classification of Amnestic Mild Cognitive Impairment with Type 2 Diabetes Mellitus based on Multispectral Image and Convolutional Neural Network. J Neural Eng. 2020;17:036005. doi: 10.1088/1741-2552/ab8b7b. [DOI] [PubMed] [Google Scholar]
- White DJ, Congedo M, Ciorciari J, Silberstein RB. Brain oscillatory activity during spatial navigation: theta and gamma activity link medial temporal and parietal regions. J Cognitive Neurosci. 2012;24(3):686–697. doi: 10.1162/jocn_a_00098. [DOI] [PubMed] [Google Scholar]
- Winterhalder M, Schelter B, Hesse W, Schwab K, Leistritz L, Timmer J, Witte H. Detection of directed information flow in biosignals. Biomed Tech (Berl) 2006;51:281–287. doi: 10.1515/BMT.2006.058. [DOI] [PubMed] [Google Scholar]
- Yaffe K, Petersen R, Lindquist K, Kramer J. Subtype of mild cognitive impairment and progression to dementia and death. Dement Geriatr Cogn Disord. 2006;22:312–319. doi: 10.1159/000095427. [DOI] [PubMed] [Google Scholar]
- Zhang X, Jin J, Li S, et al. Evaluation of color modulation in visual P300-speller using new stimulus patterns. Cogn Neurodyn. 2021 doi: 10.1007/s11571-021-09669-y. [DOI] [PMC free article] [PubMed] [Google Scholar]