

Abstract
Background:
Smoking visibility may affect smoking norms with implications for tobacco initiation, particularly amongst youths. Understanding how smoking is distributed across urban environments would contribute to the design and implementation of tobacco control policies. Our objective is to estimate the visibility of smokers in a large urban area using a novel GIS-based methodological approach.
Methods:
We used systematic social observation to gather information about the presence of smokers in the environment within a representative sample of census tracts in Madrid city in 2016. We designed a GIS-based methodology to estimate the visibility of smokers throughout the whole city using the data collected in the fieldwork. Last, we validated our results in a sample of 40 locations distributed across the city through direct observation.
Results:
We mapped estimates of smokers’ visibility across the entire city. The visibility was higher in the central districts and in streets with a high density of hospitality venues, public transportation stops, and retail shops. Peripheral districts, with larger green areas and residential or industrial land uses, showed lower visibility of smokers. Validation analyses found high agreement between the estimated and observed values of smokers’ visibility (R=0.845, p=<0.001).
Discussion:
GIS-based methods enable the development of novel tools to study the distribution of smokers and their visibility in urban environments. We found differences in the visibility by population density and leisure, retail shops and business activities. The findings can support the development of policies to protect people from smoking.
Keywords: smoking visibility, GIS, viewshed analysis, smoking normalization
1. INTRODUCTION
Globally, tobacco kills more than 7.1 million people each year, of which 12.5% are non-smokers exposed to second-hand smoke (SHS).[1] Key to understanding why people continue to smoke is their socio-geographical context. Sociological research on smoking emphasizes the importance of factors including social relationships, power, identity, and body image, and argue a social contagion driven by the visibility and exposure to smoking.[2,3] Tobacco consumption may be linked to certain social perceptions including that smoking has psychological benefits (e.g. smoking helps people to cope better with life, gives them confidence and helps them relax), makes people more sociable and, reflects a positive body image from themselves (e.g. being "cool" or "mature").[4,5] Smoking in public spaces increases the visibility of these role models, contributing to the normalization and social acceptation of smoking.[6] Thus, smoking visibility may increase tobacco initiation and undermine cessation, particularly among current smokers, former smokers, and youth. Moreover, smoking normalization may reduce the perception of the health risks associated with tobacco use.[6,7] The visibility of smoking is related to SHS exposure[8] and may create opportunities for people to smoke or exchange tobacco products.[6]
Since the implementation of indoor smoking bans over the past 10-15 years, there has been a focus on examining specific outdoor public spaces where smokers may have relocated, including: outdoor areas of hospitality venues (i.e. bars, restaurants, and cafeterias);[9-11] entrances to healthcare centres;[12] surrounding areas of schools and university campuses;[13,14] parks and beaches;[15] playgrounds;[16] public transportation stops;[17] or entrances to other public buildings (e.g. shopping centres, government buildings, etc.).[18,19] Different methodologies have been used to assess the incidence of tobacco on these specific venues, such as systematic social observation to capture visibility of smokers,[20] airborne makers and biomarkers to obtain objective measures of SHS exposure [21,22] or surveys and interviews to capture perceptions about tobacco visibility and SHS exposure.[23,24] However, the findings of these studies suggest the need to assess the extent of smoking visibility and SHS exposure in these settings and other parts of the urban environment, and the implications for tobacco consumption.[18] A systematic and comprehensive spatial approach would help to map the distribution of people smoking at different locations in a given urban area (e.g. a city as a whole).[10] This approach would help to understand how the population is dynamically exposed to smoking visibility and related second-hand smoke in their daily activities throughout the urban space. These data will provide new insights into how to improve and develop new smoke-free policies in outdoor public areas.
The use of Geographical Information Systems (GIS) enables the integration of disparate information into a comprehensive spatial approach. Specifically, GIS techniques support the development of robust and geographically-specific measures of smoking visibility. In the present study, we aimed to develop a novel method for estimating and mapping the visibility of smokers across a large urban area, using systematic social observation and GIS. Additionally, we aimed to validate the results to assess reliability of the estimations with direct on-field measurements.
2. METHODS
2.1. Study area and project design
This study is part of the Heart Healthy Hoods project (https://hhhproject.eu/), that explores how social and physical characteristics of the urban environment (including tobacco exposure) affect residents’ health.[25,26] Our study area is the whole municipality (from now on city) of Madrid, Spain, with a population of 3.2 million inhabitants in 2018.[27] The prevalence of smoking in Madrid in 2014 was rather high (27% of population between 18 and 64 years old)[28] as compared with other large cities (e.g. 14.6% in London or 14.3% in New York)[29,30]. In 2016 the volume of tobacco sales per capita (including manufactured and roll-your-own cigarettes and considering population older than 15 years old) was greater in Madrid (1,534 cigarettes/person),[31] and overall in Spain (1,499 cigarettes/person), as compared with other settings (in France, 1,090 cigarettes/person; in the United States, 1,070 cigarettes/person; and in the United Kingdom, 828 cigarettes/person).[1]
The study is organized in several stages. First, we conducted systematic social observation to collect data about people smoking in outdoors spaces within the city of Madrid. We purposively sampled 42 census tracts (≈2% of census tracts of Madrid), representing a wide variety of the socio-economic and urban form characteristics of the whole municipality. Specifically, we first selected two representative neighbourhoods for each district within the city (n=21, 42 neighbourhoods) according to unemployment, precarious work, occupational class, educational level and immigration. This was a non-probabilistic sample. Next, we selected the median census tract in each neighbourhood in terms of population density, business density, educational level, immigration and aging.[11] Census tracts are the smallest administrative unit in Spain and designed to have similar sized populations (an average of 1,500 residents). Then, we designed a GIS-based methodology to estimate the visibility of smokers throughout the whole city using the data collected in the fieldwork. Finally, we validated these results by comparing on-field measures in a sample of 40 points to our estimated exposure data. Figure 1 shows a flow-diagram illustrating the methodology developed in this study.
Figure 1:

Flow diagram describing the project design of the study.
2.2. Data collection and databases
2.2.1. Signs of tobacco consumption
A single trained data collector recorded data and geocoded all people smoking at the time of the observation encountered across the outdoor public spaces within the 42 census sections by using systematic social observation (also known as “field observation”) (stage 1 in figure 1). We defined the outdoor public spaces as all publicly accessible outdoor places (i.e. streets, squares, parks, and other public pathways and open spaces). The data collector walked a pre-defined route within each census tract depicted in a map to guide the fieldwork. Data on smokers’ visibility were collected using an adapted version of an audit questionnaire designed to characterize the tobacco environment.[9,11,19] This tool collects exhaustive data on 1) the presence and number of people smoking, 2) the type of public space in which the smoker was located (e.g. hospitality venues, public transportation stops, educational centres, hospitals, supermarkets, other venues within parks or streets, etc.), and 3) contextual information including address, date, and time of each registry.
We implemented the audit tool on smartphones using Open Data Kit (ODK) (https://opendatakit.org/use/collect/) to facilitate data collection. This app supported the capture of pictures and the geocoding of all the observations using the smartphone GPS. Fieldwork was conducted between May and September 2016, from Monday to Thursday. Weekdays were selected to capture the visibility to smokers in a “working” day. Data collection was completed in the evenings (between 5 and 9 pm) since previous studies estimated that smoking visibility is highest during this time period.[10,32]
2.2.2. Data for GIS analyses
We created a spatial database which included all required data to perform the geographical analyses and the cartographic representations of the results, through information collected from official sources. First, we obtained data about administrative boundaries (city, districts, neighbourhoods, and census tract boundaries) and areas categorized as public land use and suitable for pedestrians from the Open Database website of the Madrid City Council for July 2016 (https://datos.madrid.es/). Second, we procured data about the location (UTM coordinates and address) of all public spaces, and related facilities, across the city, including hospitality venues (bars, restaurants, cafeterias and pubs), healthcare centres, educational institutions, supermarkets and food stores, playgrounds, other public buildings (such as post offices, government buildings, retail shops or other service premises), public transportation stops (considering bus, metro and train) and other specific elements of the urban furniture which characterize public spaces. On these latter elements, only data about benches were available. This information was also obtained from the same source and date.
Finally, we obtained data on all buildings within the city, including their footprints and height from the Spanish Land Registry (Cadastre) in July 2017 (https://www.sedecatastro.gob.es/).
2.3. Descriptive analyses of data on smoking visibility
Through fieldwork in 42 census tracts, the types of places where smokers are frequently found (for instance bars and restaurants entrances or public transport stops) were identified. Then, with this information, the percentage of these places where there were smokers was determined (stage 2 in figure 1).
2.4. Extrapolation of smoking visibility to the whole city
Considering each of these places showed a particular percentage of visible smokers, we extrapolated it to the complete dataset on these kinds of locations for the whole city. This way we could estimate, for instance, the total percentage of bars and restaurants in the whole city where we could find smokers. We assumed that at each of these locations there is a probability to find smokers according to the proportions obtained from the sampled locations during the fieldwork, which could be visible from a certain surrounded area. We completed this procedure in several steps (stage 3 in figure 1).
First, the locations were added to a Digital Elevation Model (DEM) to estimate the visible areas around each location by using the 3D Viewshed tool in ArcGIS 10.4. (ESRI Inc., Redlands, CA, USA). A DEM is a 3D raster file (digital matrix of pixels, in which each pixel displays a specific portion of the space) that represents the elevation of different elements of the landscape that may obstruct for visibility (i.e. topography, buildings, etc.). In our analyses, to generate the DEM, we extruded the buildings footprints on the ground surface according to their height in the whole city, defining a pixel resolution of 1x1 meter. Given that slope is not significant in most parts of Madrid, topography was disregarded, and we considered the ground surface as flat terrain. Thus, using the DEM surface, we calculated lines of sight (LoS) from the observer points to the locations to depict the viewshed area. We assumed an observation height of 170 cm (approximately, the height of a standing person), and performed a maximum distance of 50 meters to approximate the maximum distance at which a smoker could be seen under good visibility conditions: clarity, flat terrain and no obstacles.[33] The viewshed analysis generates a raster surface in which the value of each pixel represents the number of locations with smokers that can be seen from that location. For instance, a value of 0 indicates that no locations were visible, while a value equal or greater than 1 determines that one or more locations where smokers could be seen are visible from the location of the pixel.
Given that the probability of seeing smokers varies between different types of public spaces, we conducted a viewshed analysis for each type of public space across the city individually. Thus, we weighted the value of visibility for each pixel at each one of the maps of visible areas by the observed probability of seeing smokers at each type of public space respectively (obtained in stage 2). Next, we added the values of each pixel obtained from the different viewshed analyses of each type of public space to obtain an aggregated value that represents the total visual exposure to smokers (i.e. a magnitude of smoking visibility) in each pixel. Then, we normalized the resulting values using the following equation:
| [1] |
When X’ is the new pixel standardized value, X is the old pixel value, and Xmin and Xmax are the lowest and the highest pixel value in the map extension, respectively. We categorized the final values of smoking visibility into 3 groups (moderate, high and extreme) using Natural Breaks to facilitate their interpretation. Natural Breaks is a classification method which optimizes the classification of values by reducing the variance of the values within each class and maximizing the variance of the values between classes.[34] The areas represented with a value of 0 were included as a fourth category, which was interpreted as null visibility of smokers.
This extrapolation procedure required that the types of public spaces considered in our analyses were linked to specific addresses which were registered and georeferenced in the administrative databases (i.e. hospitality venues, schools, etc.).
Finally, we quantified the total areas with estimated exposure to smokers within the residential areas (according to the land use classification from the Madrid City Council) and how many people live there using GIS.
2.5. Validation analyses
To validate our results, we compared the estimates with observed values of visibility of smokers in a subsample of 40 observation points throughout the entire city (stage 4 in figure 1). To sample these 40 points, we randomly chose 10 addresses within each category of exposure (null, moderate, high, and extreme). A similar procedure to define points for validation was designed in a previous study.[35] We excluded the 42 census sections selected for the first observational fieldwork for the validation analysis.
The estimated values of smokers’ visibility at each point were collected from the results of the viewshed analyses explained above (section 2.4.). We considered the unstandardized values for validation analysis. To obtain on-field measures, we visited each point and collected data on the number of visible smokers from that location. Data were collected by the same data collector as in stage 1, between July and September 2018, from Monday to Thursday and between 5 and 9 pm.
We calculated a correlation coefficient and linear regression analysis to compare both observed and estimated measures of smoking visibility. We interpreted the correlation coefficients as follows: ±0-0.3 (negligible), ±0.3-0.5 (low), ±0.5-0.7 (moderate), ±0.7-0.9 (high) and ±0.9-1 (very high).[36] All statistical analyses were conducted using Stata v.12. software.
3. RESULTS
3.1. Descriptive results of observational data
We identified a total of 263 public spaces with people smoking within the 42 census tracts selected for the observation (table 1). The highest values of smokers’ visibility were found around hospitality venues. In 52.97% of bars and restaurants there were at least one person smoking. Other types of public spaces where we identified visibility of smokers were the public transportation stops (10.00%), playgrounds (7.32%), educational centres (3.57%), benches in the streets and parks (1.45%) and in the entrance to supermarkets, markets and, food stores (0.83%) (table 1). However, we identified a large number of smokers walking around other locations within parks and green areas (n=6/263, 2.28%) and streets, squares and other public pathways (n=121/263, 42.21%). (table 1).
Table 1.
Types of outdoor public spaces with smokers’ visibility during the fieldwork (42 census tracts).
| Final list of public spaces observed |
Number of places with smokers |
Total number of places observed across the 42 census sections |
Percent of places with smokers over the total number of places |
|---|---|---|---|
| Hospitality venues a | 107 | 202 | 52.97% |
| Public Transportation stops | 8 | 80 | 10.00% |
| Playgrounds | 3 | 41 | 7.32% |
| Educational centers entrances | 1 | 28 | 3.57% |
| Supermarkets and food stores entrances | 2 | 240 | 0.83% |
| Benches | 15 | 1033 | 1.45% |
| Parks and green spaces b | 6 | -c | -c |
| Streets, squares and, public pathways d | 121 | -c | -c |
| Total | 263 |
We considered only those premises that were opened by the time of observation.
This type of place comprises smokers walking around the parks and green areas.
These data could not be estimated. These measures were either related to non-specific addresses which are difficult to concrete as points or to very specific elements which are not registered and geocoded in the secondary databases and could not be counted. See section 3.2. for more information.
This type of place encompassed smokers walking around the streets, sidewalks, squares, car parking’s or other public pathways.
3.2. Public spaces selected for extrapolation and spatial distribution
The final typologies of public spaces imputed to the entire city for the visibility analyses were as follows: 1) hospitality venues, 2) public transportation stops, 3) entrances to educational centres, 4) entrances to supermarkets and food stores, 5) playgrounds and 6) benches. The locations that were not related to specific addresses nor registered on secondary databases (e.g. smokers found walking around traversing paths within parks) could not be included in the analyses. We considered parks, squares and streets as uncountable places since their influence are less determined by their number than their land area. For instance, a given neighbourhood with a preponderance of small parks may present a smaller number of smokers than another neighbourhood with only one park but a larger total area of parkland. For that reason, smokers observed in these spaces were not considered in our analyses. In contrast, smokers registered within playgrounds were included. According to Madrid City Council, the whole playgrounds in the city have similar dimensions and presents well-defined and homogeneous characteristics.
A total of 104,120 locations were correctly compiled and geocoded, including 16,730 hospitality venues, 5,860 transportation stops, 2,159 educational centres, 14,998 supermarkets, markets and, food stores, 1,935 playgrounds and 62,438 benches along the city.
3.3. Visibility of smokers
Figure 2 represents the estimated visibility of smokers in Madrid. We observed the highest values of visibility in the central districts of the city, particularly in downtown (“Centro district”). We also found that the main streets and squares within each district presented high values of visibility. These areas included a large density of hospitality venues and public transportation stops, where the visibility of smokers is higher than in other types of public spaces (table 1). In contrast, the areas with lower visibility of smokers coincided with residential, industrial and green areas, which are mostly concentrated in the peripheral areas. We also observed that southern districts showed higher visibility than northern districts, where larger areas of null exposure were depicted (figure 2), given that southern districts have a higher density of hospitality venues, public transportation stops and supermarkets, markets and, food stores. Figure 2 (upper right) shows that for the downtown area, the main streets and squares have a large number of hospitality venues, entrances to public transportation stations and retail shops. All of them constitute places where the visibility of smokers is high or extreme.
Figure 2:

Smoker’ visibility in public outdoor spaces in Madrid, Spain.
The lower right side of figure 2 shows a zoomed section over a popular central square and represents all the public spaces with estimated visibility of smokers. This image represents how the estimated visibility of smokers is distributed around each point. This visibility is greater in those zones where the calculated visible areas from different venues are overlapped, particularly in those with higher concentration of hospitality venues, playgrounds, and benches (figure 2).
According to the land use classification of the Madrid City Council, we estimated a total of 58.98 km2 of outdoor public spaces within residential areas in the city. We identified that 69.26% (40.86 km2) of the residential areas had at least a moderate visibility of smokers. We calculated that 78.98% of Madrid total population (2.5 million people) were exposed to smokers from their residential addresses.
3.4. Validation results
The location and spatial distribution of all validation points throughout the city is shown in the supplementary material (figure S1). We applied Spearman’s correlation coefficient since variables were skewed (see supplementary file, figure S2). The correlation between observed and estimated visibility of smokers was high (r=0.845, p=<0.001) (figure 3). However, we noted some inaccuracies in certain points. Some areas with null estimated visual exposure to smokers presented visibility of people smoking in the validation fieldwork, while certain areas with high estimated visual exposure had low observed visibility values.
Figure 3:
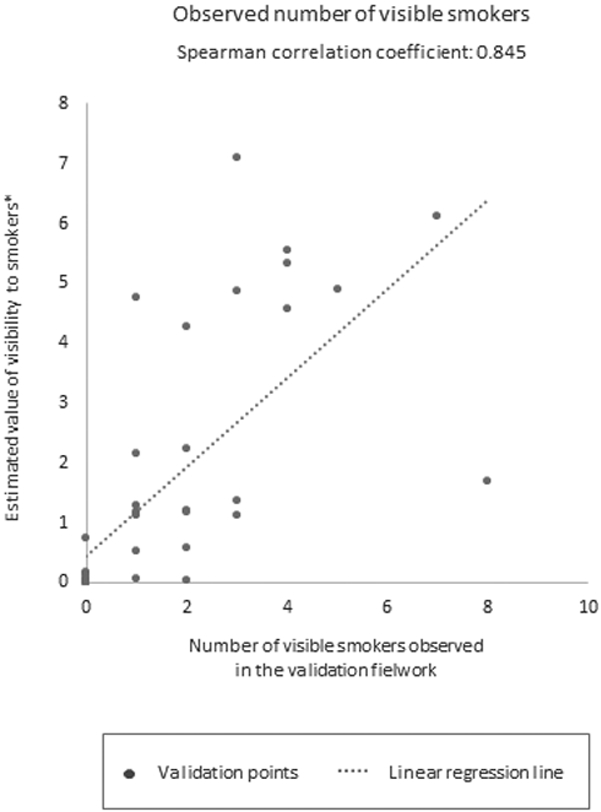
Correlations between the on-field and estimated values of visibility of smokers.
* Notes:
- The estimated values of visibility are all unstandardized in order to not introduce errors in the calculations.
- Note that the estimated values were weighted (stage 3, section 2.4.). The estimated value of visibility to smokers do not represent directly the number of visible smokers. This measure should be interpreted as a magnitude of the exposure.
4. DISCUSSION
This study presents a novel methodological approach based on systematic social observation and GIS to estimate and map the visibility of smokers in and around outdoor public spaces across the whole urban area of Madrid. The study findings were validated and showed that 78.98% of the population in Madrid have visibility of smokers in their residential addresses. These results demonstrate that smokers are highly visible and, therefore, it might be anticipated that smoking is highly normalized among the population.
We found a significant geographical unevenness in the visual exposure to smokers, as the central districts and main streets and squares within the city demonstrate higher levels of visibility in comparison to the peripheral districts. This is probably because these areas have higher number of tourists and population densities, and have a greater range of leisure, retail shops and business activities. Southern districts, with a higher diversification of land use, also had greater exposure. These findings add on to the results obtained in a previous study that also applied viewshed analyses to examine the visibility of smokers in New Zealand, where streets with high level of retail shops and hospitality venues showed higher values of visibility.[10]
This study reveals the potential of GIS techniques for developing valuable tools for tobacco control research. To our knowledge, no previous studies have leveraged integration of GIS techniques to provide a spatial citywide approach to understand visibility of smokers. Previous studies that examined visibility of smokers (i.e. surveys, interviews or systematic social observation) were constrained to small areas (e.g. downtown of a city or a sample of streets)[10] or to specific types of places (e.g. entrances to public buildings).[19,20] Further, GIS-based methods are replicable to other urban settings providing that the necessary databases for the analyses are available.
From an international perspective, our study provides a new insight to study smoking visibility, and related urban spatial health inequalities, reporting the need for future interventions in specific outdoor public spaces. These interventions would include extending smoke-free laws to some outdoor areas, such as outdoor hospitality venues where we found greater visibility of smokers. Previous studies conducted in Spain,[13] and also in other countries,[8,19,20] showed that smoking was most reported in bars and restaurants in comparison to other outdoor places. Furthermore, public transportation stops were places where we also observed visibility of smokers in accordance to other international studies,[17,37] and should be considered in future interventions. This approach has been adopted in setting such as Queensland, Australia, where smoking is banned within 5 metres of public transportation waiting areas.[38]
We also underlined visibility of smokers at playgrounds and entrances to educational centres, despite the Spanish current smoke-free law prohibits smoking in playgrounds and recommends not smoking in the nearby of educational centres where minors may be present, including their precincts, entrances and adjacent sidewalks.[39] Smoking bans should be enforced in those places where smoking is already prohibited, and strengthen in those places where the specifications of smoking prohibition may be confusing (such as the case of educational centres) to protect these serving-youth facilities. Similarly, these findings evidenced the need to evaluate compliance with smoke-free laws to protect people from SHS exposure, especially vulnerable people including minors.
Finally, we found smokers at the entrances of other public buildings such as supermarkets, markets and, food stores. Beyond the behavioural influences of the smoking visibility, these spaces are also problematic because users entering or exiting the building cannot avoid SHS exposure.[18,40] Some jurisdictions provide guidelines to regulate smoking at outdoor main building entrances. For instance, the Australian States adopted diverse regulations. In New South Wales, the current laws ban smoking up to 4 meters from an entrance to a public building used by pedestrians.[41] In Queensland smoking is prohibited in the precincts around State Government Buildings and up to 5 metres to smoke-free entrances in some public buildings (e.g. hospitals and other health facilities, etc.).[38,42] Similar, but stronger policies were found in Canada. In Quebec, smoking and vaping are prohibited within 9 meters of any door, air intake or operable window leading to enclosed spaces that are open to the public.[43] Different political frameworks have been developed in the United Kingdom, where the proprietors of commercial and public service venues (e.g. airports or shopping centres) can voluntarily create smoking areas at the entrances to the building.[44] Further, in Japan, we found some jurisdictions that implemented banning smoking policies in the streets,[45] and in Tasmania, Australia, smoking is prohibited at public streets with high offer of retail shops and declared by regulation to be “pedestrian malls”.[46] Our findings may assist in the design and implementation of these kind of policies to reduce visibility of smokers outdoors.
Several limitations must be acknowledged. First, the data were collected during a specific time slot (weekdays, between 5 and 9 pm). Further studies should examine variations in visibility at other times. Second, the extrapolation of observational data was subject to the availability of geocoded data on specific public spaces, and we could not capture smokers walking around the space. Future studies should collect data on population movement around the space to infer this type of exposure. Last, the validation analysis showed some discrepancies with on-field measures in areas with null and extreme visibility. That reflects the difficulties of measuring the visibility of ephemeral behaviours such as smoking and suggests the ubiquity of this type of exposure within urban settings. In addition, some uncertainties exist in our estimations. They are derived from certain parameters and conditions that we have assumed in the viewshed analyses such as the elements which may obstruct the visibility in the DEM, the spatial resolution of the DEM or the maximum distance at which we consider that a smoker may be visible under good visibility conditions. However, we validated our methodology and our findings showed that the estimations presented in this study were highly correlated with the observed measures (R=0.845, p=<0.001).
The methodology presented in this study suggests several implications for future studies on tobacco control research. Further work can usefully analyse the associations between the visual exposure to smokers and socio-economic characteristics of population, smoking prevalence, smoking-cessation rates or the tobacco sales across different geographic areas for different demographic groups. In Madrid, we are collecting these data about smoking behaviours from a cohort of adult residents.[11] Beyond tobacco-related studies, our methodology could be broadly applied to other research fields in public and environmental health concerned with unhealthy behaviours and commodities. For example, in alcohol research, viewshed analyses may be suitable to estimate and quantify the visibility of alcohol consumption in the environment.
In conclusion, this study estimated the visibility of smokers using GIS technologies in a large city as Madrid. We designed a replicable geographical method which provides valuable contributions to tobacco control studies. We observed differences in the distribution of smokers’ visibility in Madrid and highlighted specific public spaces that constitute a focus for this exposure. This method and findings may help to evaluate the existing smoke-free policies and provide keys for future interventions to reduce smokers’ visibility, and denormalise and mitigate tobacco consumption and its initiation.
Supplementary Material
Acknowledgements:
RV was funded by a predoctoral fellowship offered to trainee researchers from the University of Alcalá (FPI/UAH). This study is part of the Heart Healthy Hoods project, funded by the European Research Council under the European Union’s Seventh Framework Program (FP7/2007– 2013/ERC Starting Grant Heart Healthy Hoods Agreement no. 623 336893) and the Instituto de Salud Carlos III, Subdirección General de Evaluación y Fomento de la Investigación, Government of Spain Grant (PI15/02146). UB was supported by the Office of the Director of the National Institutes of Health under award number DP5OD26429. The funding agencies were not involved in the study design; in the data collection, analyses or interpretation of data; in the writing of this work; or in the decision to submit the manuscript for publication.
Footnotes
Competing interests: The authors declare they have no actual or potential competing financial interest.
REFERENCES
- 1.Drope J, Schluger NW, Cahn Z, et al. The Tobacco Atlas. Sixth Edit. Atlanta, GA, USA: : American Cancer Society and Vital Strategies; 2018. https://tobaccoatlas.org/ [Google Scholar]
- 2.Poland B, Frohlich K, Haines R, et al. The social context of smoking: the next frontier in tobacco control? Tob Control 2006;15:59–63. doi: 10.1136/tc.2004.009886 [DOI] [PMC free article] [PubMed] [Google Scholar]
- 3.Barnett JR, Moon G, Pearce J, et al. Smoking geographies : space, place and tobacco. 2016. doi: 10.1002/9781118349144 [DOI] [Google Scholar]
- 4.Loomis BR, Kim AE, Busey AH, et al. The density of tobacco retailers and its association with attitudes toward smoking, exposure to point-of-sale tobacco advertising, cigarette purchasing, and smoking among New York youth. Prev Med 2012;55:468–74. doi: 10.1016/j.ypmed.2012.08.014 [DOI] [PubMed] [Google Scholar]
- 5.Tunstall H, Shortt NK, Niedzwiedz CL, et al. Tobacco outlet density and tobacco knowledge, beliefs, purchasing behaviours and price among adolescents in Scotland. Soc Sci Med 2018;206:1–13. doi: 10.1016/j.socscimed.2017.11.046 [DOI] [PubMed] [Google Scholar]
- 6.Alesci NL, Forster JL, Blaine T. Smoking visibility, perceived acceptability, and frequency in various locations among youth and adults. Prev Med 2003;36:272–81. doi: 10.1016/S0091-7435(02)00029-4 [DOI] [PubMed] [Google Scholar]
- 7.Klein EG, Bernat DH, Forster JL. Young adult perceptions of smoking in outdoor park areas. Health Place 2012;18:1042–5. doi: 10.1016/j.healthplace.2012.06.002 [DOI] [PMC free article] [PubMed] [Google Scholar]
- 8.Sureda X, Fernández E, López MJ, et al. Secondhand tobacco smoke exposure in open and semi-open settings: A systematic review. Environ Health Perspect 2013;121:766–73. doi: 10.1289/ehp.1205806 [DOI] [PMC free article] [PubMed] [Google Scholar]
- 9.Fu M, Fernández E, Martínez-Sánchez JM, et al. Second-hand smoke exposure in indoor and outdoor areas of cafés and restaurants: Need for extending smoking regulation outdoors? Environ Res 2016;148:421–8. doi: 10.1016/j.envres.2016.04.024 [DOI] [PubMed] [Google Scholar]
- 10.Pearson AL, Nutsford D, Thomson G. Measuring visual exposure to smoking behaviours: a viewshed analysis of smoking at outdoor bars and cafés across a capital city’s downtown area. BMC Public Health 2014;14:300. doi: 10.1186/1471-2458-14-300 [DOI] [PMC free article] [PubMed] [Google Scholar]
- 11.Sureda X, Bilal U, Fernández E, et al. Second-hand smoke exposure in outdoor hospitality venues: Smoking visibility and assessment of airborne markers. Environ Res 2018;165:220–7. doi: 10.1016/j.envres.2018.04.024 [DOI] [PubMed] [Google Scholar]
- 12.Sureda X, Fu M, José López M, et al. Second-hand smoke in hospitals in Catalonia (2009): A cross-sectional study measuring PM2.5 and vapor-phase nicotine. Environ Res 2010;110:750–5. doi: 10.1016/j.envres.2010.09.008 [DOI] [PubMed] [Google Scholar]
- 13.Sureda X, Fernández E, Martínez-Sánchez JM, et al. Secondhand smoke in outdoor settings: smokers’ consumption, non-smokers’ perceptions, and attitudes towards smoke-free legislation in Spain. BMJ Open 2015;5:e007554. doi: 10.1136/bmjopen-2014-007554 [DOI] [PMC free article] [PubMed] [Google Scholar]
- 14.Jancey J, Bowser N, Burns S, et al. No smoking here: Examining reasons for noncompliance with a smoke-free policy in a large university. Nicotine Tob Res 2014;16:976–83. doi: 10.1093/ntr/ntu012 [DOI] [PubMed] [Google Scholar]
- 15.Johns M, Farley SM, Rajulu DT, et al. Smoke-free parks and beaches: an interrupted time-series study of behavioural impact in New York City. Tob Control 2015;24:497–500. doi: 10.1136/tobaccocontrol-2013-051335 [DOI] [PubMed] [Google Scholar]
- 16.McIntosh AH, Collins D, Parsons M. ‘A place for healthy activity’: Parent and caregiver perspectives on smokefree playgrounds. Health Place 2015;31:146–53. doi: 10.1016/j.healthplace.2014.11.011 [DOI] [PubMed] [Google Scholar]
- 17.Wilson N, Oliver J, Thomson G. Smoking close to others and butt littering at bus stops: pilot observational study. PeerJ 2014;2:e272. doi: 10.7717/peerj.272 [DOI] [PMC free article] [PubMed] [Google Scholar]
- 18.Kaufman P, Griffin K, Cohen J, et al. Smoking in urban outdoor public places: Behaviour, experiences, and implications for public health. Health Place 2010;16:961–8. doi: 10.1016/j.healthplace.2010.05.012 [DOI] [PubMed] [Google Scholar]
- 19.Navas-Acien A, Çarkoğlu A, Ergör G, et al. Compliance with smoke-free legislation within public buildings: a cross-sectional study in Turkey. Bulletin of World Health Organization 2016;94:92–102. doi: 10.2471/BLT.15.158238 [DOI] [PMC free article] [PubMed] [Google Scholar]
- 20.Kaplan B, Grau-Perez M, Çarkoglu A, et al. Smoke-free Turkey: Evaluation of outdoor areas of public places. Environ Res 2019;175:79–83. doi: 10.1016/j.envres.2019.05.003 [DOI] [PubMed] [Google Scholar]
- 21.Sureda X, Bilal U, Fernández E, et al. Second-hand smoke exposure in outdoor hospitality venues: Smoking visibility and assessment of airborne markers. Environ Res 2018;165. doi: 10.1016/j.envres.2018.04.024 [DOI] [PubMed] [Google Scholar]
- 22.Martínez-Sánchez JM, Sureda X, Fu M, et al. Secondhand smoke exposure at home: Assessment by biomarkers and airborne markers. Environ Res 2014;133:111–6. doi: 10.1016/j.envres.2014.05.013 [DOI] [PubMed] [Google Scholar]
- 23.Martínez-Sánchez JM, Blanch C, Fu M, et al. Do smoke-free policies in work and public places increase smoking in private venues? Tob Control 2014;23:204–7. doi: 10.1136/tobaccocontrol-2012-050877 [DOI] [PubMed] [Google Scholar]
- 24.Katikireddi SV, Der G, Roberts C, et al. Has childhood smoking reduced following smoke-free public places legislation? A segmented regression analysis of cross-sectional UK school-based surveys. Nicotine Tob Res 2016;18:1670–4. doi: 10.1093/ntr/ntw018 [DOI] [PMC free article] [PubMed] [Google Scholar]
- 25.Bilal U, Díez J, Alfayate S, et al. Population cardiovascular health and urban environments: the Heart Healthy Hoods exploratory study in Madrid, Spain. BMC Med Res Methodol 2016;16:104. doi: 10.1186/s12874-016-0213-4 [DOI] [PMC free article] [PubMed] [Google Scholar]
- 26.Carreño V, Franco M, Gullón P. Studying city life, improving population health. Int J Epidemiol 2015;46:14–21. doi: 10.1093/ije/dyv207 [DOI] [PubMed] [Google Scholar]
- 27.Spanish Statistical Office. Instituto Nacional de Estadistica. 2019.http://www.ine.es/ (accessed 15 Feb 2019).
- 28.Madrid Health Department. Vigilancia del consumo de tabaco y de la exposición ambiental al humo de tabaco en la Comunidad de Madrid: Informe 2014. Madrid: 2014. doi:http://www.comunidad.madrid/file/13842/download?token=kkk45n-t [Google Scholar]
- 29.Greater London Authority. London Datastore. 2018.https://data.london.gov.uk/ (accessed 27 Oct 2018).
- 30.Henkle D, Feliciano O, Bilogur A, et al. Oversaturated: How an oversaturation of licensed tobacco retail outlets in New York City is impacting Public Health. Report. American Cancer Society 2017. [Google Scholar]
- 31.Spanish Ministry of Finance and Public Administration. Comisionado para el Mercado de Tabacos (Tobacco Market Commissioner). 2019.https://www.hacienda.gob.es/es-ES/AreasTematicas/CMTabacos/Paginas/Default.aspx (accessed 28 Oct 2019).
- 32.Chan J, Burnett T, Baillie R, et al. Smoking in outdoor areas of bars and cafés: Large differences between midday and evening prevalences. Drugs Educ Prev Policy 2014;21:484–8. doi: 10.3109/09687637.2014.917273 [DOI] [Google Scholar]
- 33.Lee J. Analyses of visibility sites on topographic surfaces. Int J Geogr Inf Syst 1991;5:413–29. doi: 10.1080/02693799108927866 [DOI] [Google Scholar]
- 34.Cauvin C, Escobar F, Serradj A. Thematic cartography and transformations. John Wiley & Sons; 2010. [Google Scholar]
- 35.Marah M, Novotny TE. Geographic patterns of cigarette butt waste in the urban environment. Tob Control 2011;20:2010–2. doi: 10.1136/tc.2010.042424 [DOI] [PMC free article] [PubMed] [Google Scholar]
- 36.Mukaka MM. A guide to appropriate use of correlation coefficient in medical research. Malawi Med J 2012;24:69–71. doi: 10.1016/j.cmpb.2016.01.020 [DOI] [PMC free article] [PubMed] [Google Scholar]
- 37.Thomson G, Russell M, Jenkin G, et al. Informing outdoor smokefree policy: Methods for measuring the proportion of people smoking in outdoor public areas. Health Place 2013;20:19–24. doi: 10.1016/j.healthplace.2012.11.006 [DOI] [PubMed] [Google Scholar]
- 38.Government of Queensland. Tobacco and Other Smoking Products (Smoke-free Places) Amendment Act 2016. 2016.https://www.legislation.qld.gov.au/view/html/asmade/act-2016-006
- 39.Parliament of Spain. Ley 42/2010, de 30 de diciembre, por la que se modifica la Ley 28/2005, de 26 de diciembre, de medidas sanitarias frente al tabaquismo y reguladora de la venta, el suministro, el consumo y la publicidad de los productos del tabaco. Boletín Of del Estado. 2010;318:11370–421. doi:BOE-A-2012-5403 [Google Scholar]
- 40.Sureda X, Martínez-Sánchez J, López M, et al. Secondhand smoke levels in public building main entrances: outdoor and indoor PM2.5 assessment. Tob Control 2012;21:543–8. doi: 10.1136/tobaccocontrol-2011-050040 [DOI] [PubMed] [Google Scholar]
- 41.Parlamentary Counsel’s Office of New South Wales Australia. Smoke-free Environment Act. 2000.https://www.legislation.nsw.gov.au/#/view/act/2000/69/part2/sec6a (accessed 18 Oct 2018).
- 42.Government of Queensland. Health and Other Legislation Amendment Act 2014. 2014.https://www.legislation.qld.gov.au/view/pdf/asmade/act-2014-065
- 43.Government of Québec. Tobacco Control Act. 2015;:29.http://legisquebec.gouv.qc.ca/en/showdoc/cs/L-6.2 [Google Scholar]
- 44.Parliament of Scotland. Smoking, Health and Social Care (Scotland). 2005. doi:https://www.legislation.gov.uk/asp/2005/13/contents
- 45.Ueda H, Armada F, Kashiwabara M, et al. Street smoking bans in Japan: A hope for smoke-free cities? Health Policy 2011;102:49–55. doi: 10.1016/j.healthpol.2011.05.013 [DOI] [PubMed] [Google Scholar]
- 46.Government of Tasmania. Public Health Amendment Act. 2011.https://www.legislation.tas.gov.au/
Associated Data
This section collects any data citations, data availability statements, or supplementary materials included in this article.