

Abstract
AIM:
Larger tumour size and lymph node involvement traditionally predict poorer survival in colon cancer patients. However, it has been recently suggested that very small tumours (<5 mm) may be a predictor of poor prognosis in colon cancer patients when lymph nodes are involved. This study investigated whether node-positive colon cancer patients with small tumours had worse survival compared to those with larger tumours in the Department of Defense’s (DoD) Military Health System (MHS), a universal health care system.
METHODS:
Surgically treated colon cancer patients were identified from the DoD’s Automated Central Tumour Registry (ACTUR). They were diagnosed with stage I-III colon cancer between 1989 and 2010, with ≥1 lymph node examined, and did not receive pre-operative radiotherapy, and were followed through 2013 for vital status. Multivariable Cox models were used to examine survival differences by tumour size groups and stratified by lymph node status and age.
RESULTS:
There were no differences in overall survival by tumour size in the study population. These findings remained similar in stratified analysis by lymph node status and age.
CONCLUSION:
In a universal health care system, small tumour size is not associated with worse prognosis in node-positive colon cancer patients.
Keywords: colon cancer, tumour size, survival, universal health care, military health system
Introduction
Regional lymph node involvement and increasing tumour size are strong predictors of poorer survival in colon cancer patients,[1,2] and the two tumour characteristics tend to be highly correlated. That is, as the tumour grows, the likelihood of regional lymph node involvement increases as well, which in turn affects the treatment strategy and survival.
However, studies in some cancer sites have observed worse survival in node-positive cancers, even for those with very small tumours.[3–5] A recent study on colon cancer found that though the likelihood of death from colon cancer increased monotonically with tumour size in node-negative patients, patients with very small tumours (<5 mm) had worse cancer-specific mortality than did those with larger tumours among node-positive patients.[6] Findings from this study suggest that very small tumours may be more biologically aggressive and are more likely to invade regional lymph nodes than larger tumours.[4,3,6]
With the limitations of the SEER data in treatment, the study of Muralidhar et al., however, could not consider the effect of chemotherapy on survival, while all study patients underwent surgery.[6] For example, adjuvant chemotherapy is a standard treatment recommended for tumour stage III colon cancer that has lymph node involvement.[7,8] Adherence to adjuvant chemotherapy recommendations has been shown to improve survival, especially in stage III patients.[9,10] However, it is not clear whether the receipt of chemotherapy varies by tumour size among lymph node positive patients (stage III). If node positive patients with a very small tumour are less likely to receive chemotherapy, then their survival could be negatively affected. Since receipt of treatment is related to whether a person has medical insurance, a study in a universal healthcare system may be the best means to further investigate the relationship, minimizing the possible influence of unequal access to care on the research results.
The Department of Defense’s (DoD) Military Health System (MHS) provides universal healthcare to all beneficiaries and has a cancer registry with information on cancer characteristics, surgical procedures, and other treatments. Using the data from the DoD cancer registry, we investigated the relationship between tumour size and survival among colon cancer patients and whether the relationship varied by lymph node status in the MHS. With available treatment data, we also evaluated the effects of chemotherapy on the tumour size-survival relationship.
Methods
Data Source and Study Population
The data for this retrospective cohort study were from the DoD’s Automated Central Tumor Registry (ACTUR). ACTUR is DoD’s cancer registry system that collects information about cancer patients who are active-duty members, retirees or their family members and have been diagnosed and/or treated at military treatment facilities (MTFs). The MTFs are required to report cancer cases to ACTUR, which complies data following the North American Association of Central Cancer Registries guidelines. Data collected in ACTUR include demographics, tumour characteristics, cancer treatment, date at diagnosis, date at last patient contact, and date at death. ACTUR follows up patients according to the Commission on Cancer 2012 Cancer Program Standards,[11] using various sources to collect follow-up information. These resources include contact with patient or patient’s family members, contact with physician(s), inpatient or outpatient services, pathology reports, death certificates, patient locator software, obituary listings and other resources (personal communication, E. Butts).
Eligible patients were those histologically diagnosed with stage I-III colon cancer who underwent a surgical procedure between 1989 and 2010. The cancer site codes were C180 and C182-C189 (International Classification of Diseases for Oncology, Third Revision topography codes [ICD-O-3]). Patients were followed from the time of diagnosis to death or the end of the study (December 31, 2013). Patients who were lost to follow up or alive at the end of the study were censored. Patients with missing information on tumour size, vital status, age, or sex were excluded.
The use of the ACTUR data for this study was approved by the Institutional Review Board of the Walter Reed National Military Medical Center.
Study Variables
Tumour variables included tumour size, number of regional lymph nodes examined, number of positive lymph nodes, T stage, and tumour grade. Tumour size was divided into five groups, using groupings by Muralidhar et al[6]: less than 5 mm, 5 to 19 mm, 20 to 39 mm, 40 to 59, and 60 mm or more. The number of regional lymph nodes examined was divided into three categories: 1 to 11 lymph nodes, 12 or more lymph nodes, and unknown number, following the guidelines for the evaluation of lymph nodes for colorectal cancer.[12] Tumour stages included T1, T2, T3, T4, or unknown based on the American Joint Committee on Cancer staging recommendations.[13] Tumour grade was defined as grade I (well differentiated), grade II (moderately differentiated), grade III/IV (poorly differentiated/undifferentiated), and unknown.[13] Both tumour stage and grade definitions followed the American Joint Committee on Cancer staging recommendations. Patients were classified into those receiving chemotherapy or not receiving it. The study outcome was overall survival because data on cause of death were not complete.
Demographic variables included age, gender, race, marital status, active-duty status, sponsor’s military service branch, and diagnosis year. We classified age at diagnosis into four groups, 18–49 years, 50–59 years, 60–69 years, and 70 years or older. Racial groups included white, black, and other/unknown.Marital statusat diagnosis included married, never married, separated, divorced or widowed, and unknown. Sponsor military service branch included Army, Navy/Marines, Air Force, and other (Coast Guard, and unknown or not reported). Diagnosis year was grouped into 1989–1994, 1995–1999, 2000–2004, and 2005–2010.
Statistical Analysis
We first presented the distributions of demographic and tumour characteristics by lymph node status at diagnosis (positive vs negative). Kaplan-Meier survival curves were plotted to compare overall survival stratified by tumour size. Log-rank test for homogeneity of effect was used to test differences of the survival curves. We then conducted multivariable Cox proportional hazard analysis to estimate hazards ratios (HRs) and the 95% confidence intervals (95% CIs) for tumour size in relation to overall survival adjusted for demographic and tumour characteristics. To evaluate the effects of chemotherapy, we calculated HRs and 95% CIs with and without adjustment for chemotherapy. Stratified analyses were performed by lymph node status (LN− and LN+) and age groups (<50 and ≥ 50 years). Age of 50 years was used as a cut-off point because this is the age recommended for colon cancer screening, which may be related to tumour size detected. The SAS software version 9.4 (SAS Institute, Inc., Cary, NC) was utilized for statistical analyses with a statistical significance based on a two-sided p-value ≤ 0.05.
Results
Between 1989 and 2013, there were 4,397 patients diagnosed with stage I-III colon cancer in the ACTUR (Table 1). Overall, most colon cancer patients were 60 years of age or older (53.3%), male (59.2%), white (76.4%), married (77.0%), and non-active duty (92.8%). Compared with node-negative patients, node-positive patients were younger, more likely to be black or other races, and to be in service branches other than Army, Navy or Air Force. In terms of tumour characteristics, node-positive patients had larger tumours and were more likely to have T3 or T4 tumors, have 12 or more lymph nodes examined or have received chemotherapy. There were no significant differences between the two groups in other characteristics (Table 1).
Table 1.
Demographic and tumor characteristics overall and by age at diagnosis among colon cancer patients in the DoD’s Automated Central Tumour Registry (ACTUR), 1989 – 2010
| Variable | Lymph Node Status | |||||||||
|---|---|---|---|---|---|---|---|---|---|---|
| Overall (N = 4,397) | Negative (N = 2,710) | Positive (N = 1,687) | ||||||||
| N | % | N | % | N | % | p-valuea | ||||
| Age group at diagnosis, years | <0.001 | |||||||||
| 18–49 | 658 | 14.96 | 339 | 12.50 | 319 | 18.91 | ||||
| 50–59 | 955 | 21.72 | 568 | 20.95 | 387 | 22.94 | ||||
| 60–69 | 1,357 | 30.86 | 858 | 31.69 | 499 | 29.58 | ||||
| 70+ | 1,427 | 32.45 | 945 | 34.68 | 482 | 28.57 | ||||
| Sex | 0.299 | |||||||||
| Female | 1,794 | 40.80 | 1,089 | 40.21 | 705 | 41.79 | ||||
| Male | 2,603 | 59.20 | 1,621 | 59.79 | 982 | 58.21 | ||||
| Race | 0.001 | |||||||||
| White | 3,362 | 76.44 | 2,123 | 78.31 | 1,239 | 73.44 | ||||
| Black | 648 | 14.73 | 372 | 13.72 | 276 | 16.36 | ||||
| Other/Unknown | 388 | 8.82 | 216 | 7.97 | 172 | 10.20 | ||||
| Marital status | 0.775 | |||||||||
| Married | 3,385 | 76.98 | 2,099 | 77.43 | 1,287 | 76.29 | ||||
| Not married | 140 | 3.18 | 82 | 3.02 | 58 | 3.44 | ||||
| Other | 731 | 16.62 | 446 | 16.45 | 285 | 16.89 | ||||
| Unknown | 141 | 3.21 | 84 | 3.10 | 57 | 3.38 | ||||
| Active-duty status | 0.150 | |||||||||
| No | 4,079 | 92.77 | 2,527 | 93.21 | 1,553 | 92.06 | ||||
| Yes | 318 | 7.23 | 184 | 6.79 | 134 | 7.94 | ||||
| Service branchb | 0.001 | |||||||||
| Army | 1,516 | 34.48 | 951 | 35.08 | 565 | 33.49 | ||||
| Navy/Marines | 1,192 | 27.11 | 725 | 26.74 | 467 | 27.68 | ||||
| Air Force | 1,362 | 30.98 | 865 | 31.91 | 498 | 29.52 | ||||
| Other | 327 | 7.44 | 170 | 6.27 | 157 | 9.31 | ||||
| Tumour Size | <0.001 | |||||||||
| Less than 5 mm | 143 | 3.25 | 111 | 4.09 | 32 | 1.90 | ||||
| 5 to 19 mm | 539 | 12.26 | 389 | 14.35 | 151 | 8.95 | ||||
| 20 to 39 mm | 1,478 | 33.61 | 920 | 33.94 | 558 | 33.08 | ||||
| 40 to 59 mm | 1,327 | 30.18 | 772 | 28.48 | 555 | 32.9 | ||||
| 60 mm or more | 910 | 20.70 | 519 | 19.14 | 391 | 23.18 | ||||
| T stage | <0.001 | |||||||||
| T1 | 550 | 12.51 | 478 | 17.63 | 72 | 4.27 | ||||
| T2 | 848 | 19.29 | 658 | 24.27 | 191 | 11.32 | ||||
| T3 | 2,614 | 59.45 | 1,401 | 51.68 | 1,213 | 71.90 | ||||
| T4 | 342 | 7.78 | 148 | 5.46 | 194 | 11.50 | ||||
| Unknown | 43 | 0.98 | 26 | 0.96 | 17 | 1.01 | ||||
| Grade | <0.001 | |||||||||
| Well differentiated | 677 | 15.40 | 527 | 19.44 | 150 | 8.89 | ||||
| Moderately differentiated | 2,944 | 66.95 | 1,811 | 66.80 | 1,134 | 67.22 | ||||
| Poorly differentiated/Undifferentiated | 598 | 13.60 | 253 | 9.33 | 345 | 20.45 | ||||
| Unknown | 178 | 4.05 | 120 | 4.43 | 58 | 3.44 | ||||
| Number of lymph nodes examined | <0.001 | |||||||||
| 1–11 | 1,602 | 36.43 | 1,055 | 38.92 | 547 | 32.42 | ||||
| ≥12 | 2,731 | 62.11 | 1,613 | 59.50 | 1,118 | 66.27 | ||||
| Unknown | 65 | 1.48 | 43 | 1.59 | 22 | 1.30 | ||||
| Chemotherapy | <0.001 | |||||||||
| No | 2,668 | 61.63 | 2,231 | 82.32 | 437 | 25.90 | ||||
| Yes | 1,729 | 38.37 | 479 | 17.68 | 1,250 | 74.10 | ||||
Chi-square test for difference in proportions by lymph node status
Service branch or rank of active-duty member or sponsor
The median follow-up time was 6.62 years. Figure 1 shows unadjusted overall survival curves by tumour size. No significant differences in survival were observed between different tumour size groups (log rank p = 0.10). Table 2 presents the HRs from the multivariable Cox proportional hazard models. After adjustment for age, gender, race, marital status, active-duty status, diagnosis year, sponsor service branch, tumour stage, grade, number of lymph nodes examined, node status, no differences in survival were shown between different tumour sizes. Compared to those with tumour size 60 mm or more, the HRs were 1.05 (95% CI=0.93 to 1.18), 0.98 (95% CI=0.87 to 1.11), 0.97 (95% CI=0.82 to 1.15), and 0.95 (95% CI=0.71 to 1.28) for tumour sizes 40–59 mm, 20–39mm, 5–19mm and less than 5 mm, respectively (Table 2, Model 1). The HRs remained similar after further adjustment for chemotherapy in the model (Table 2, Model 2).
Figure 1.
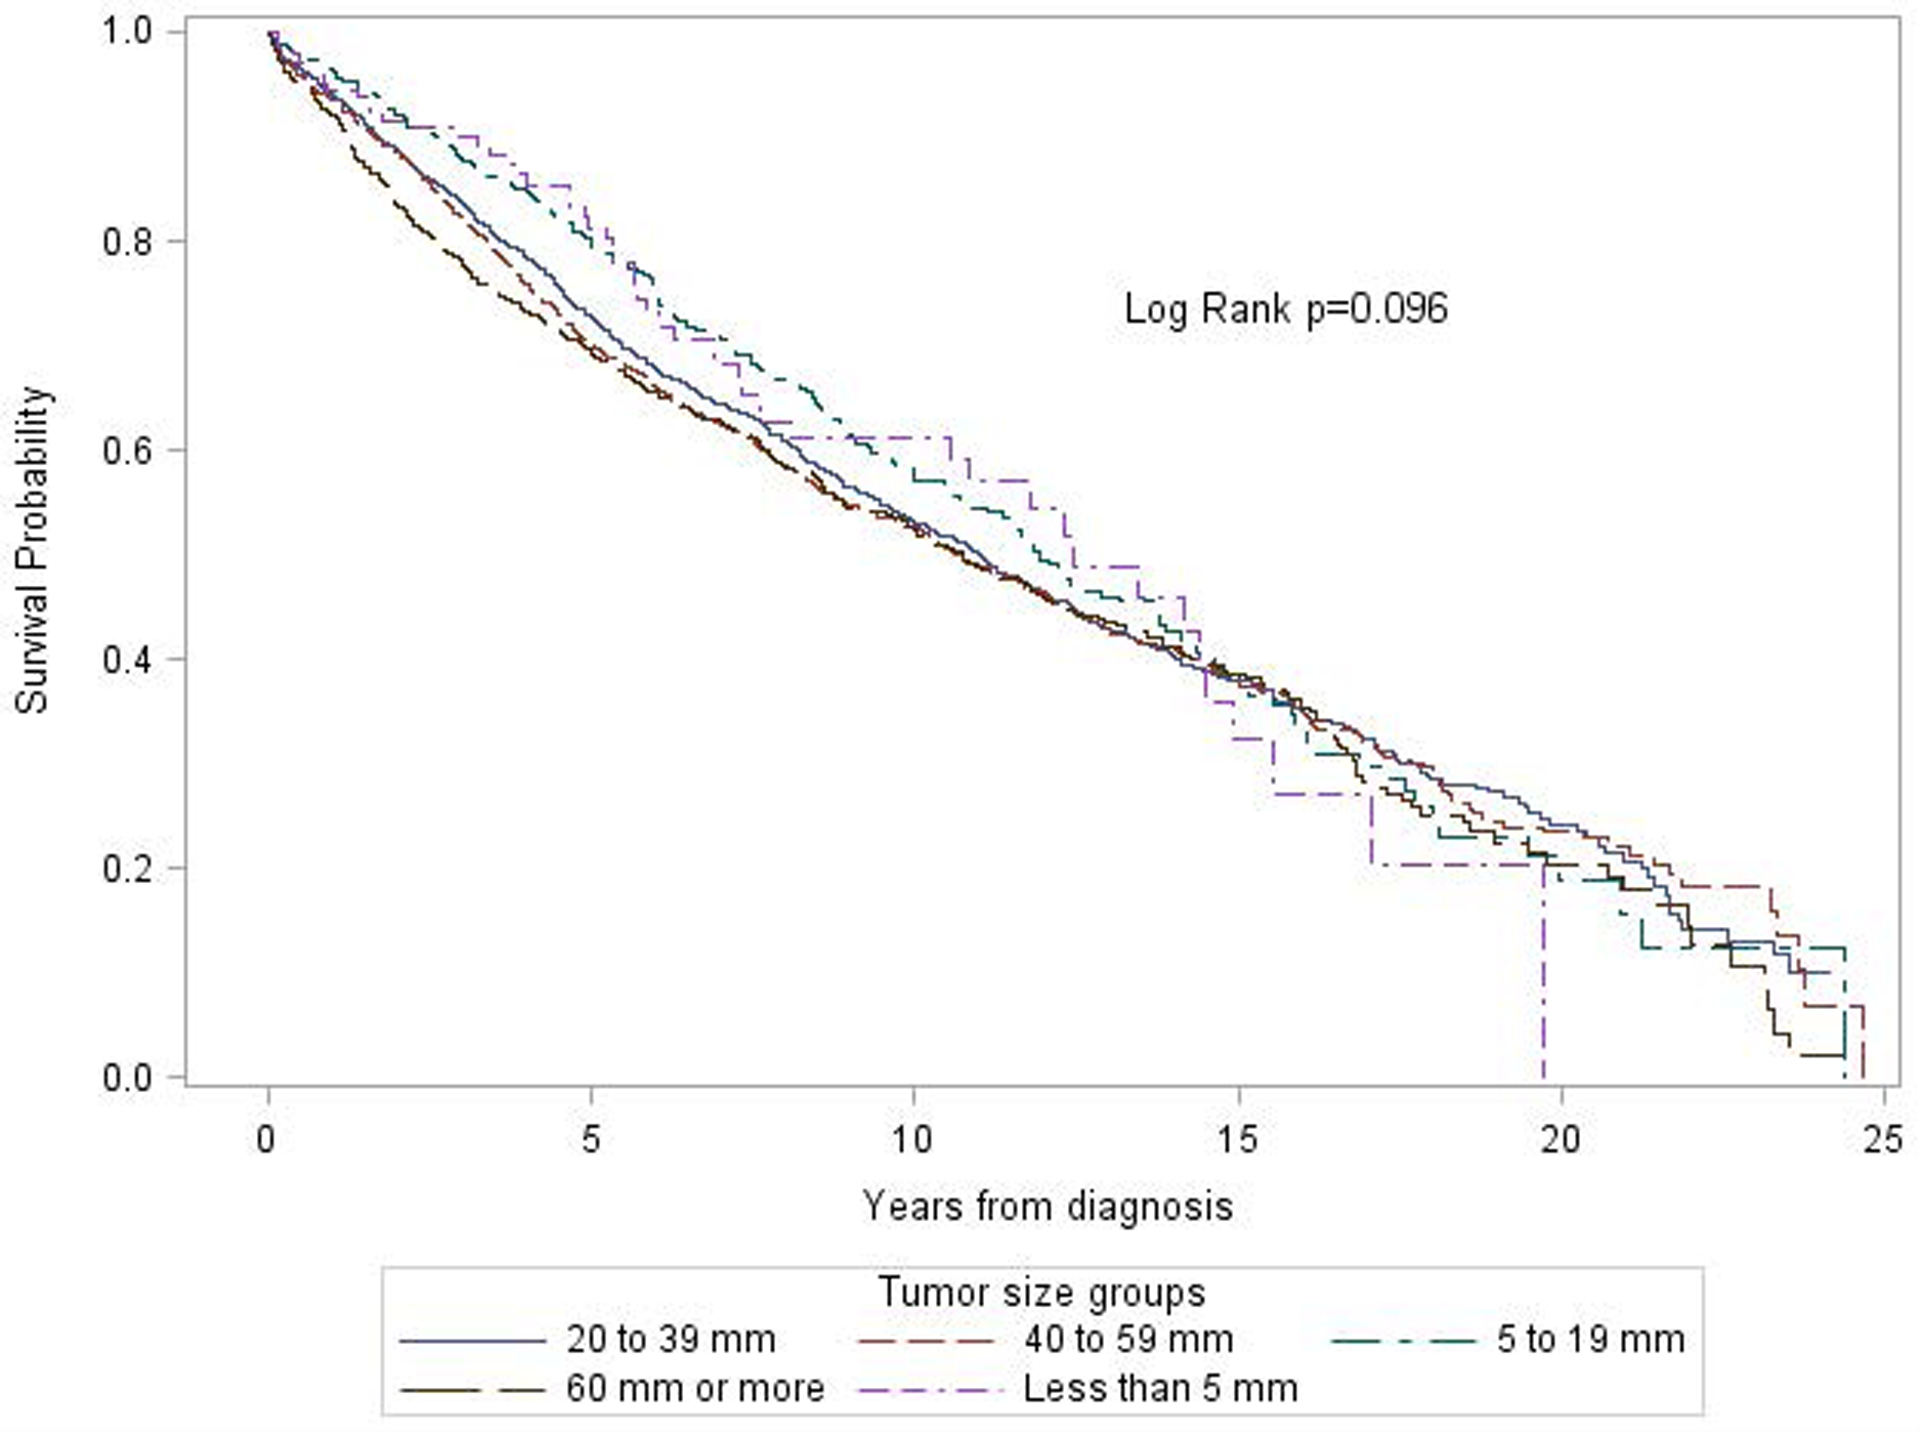
Unadjusted Kaplan-Meier (KM) survival curves of overall survival among colon cancer patients diagnosed between 1990 and 2010 in the Automated Cancer Tumour Registry (ACTUR) by tumour size.
Table 2.
Adjusted Hazards Ratios for overall survival among patients diagnosed with colon cancer in the DoD’s Automated Central Tumour Registry (ACTUR), 1989–2010
| Model 1& | Model 2* | ||||||
|---|---|---|---|---|---|---|---|
| Variable | N | % | Adjusted HR | 95% CI | Adjusted HR | 95% CI | |
| Tumour size | |||||||
| ≥60 mm | 910 | 20.70 | ref | -- | ref | -- | |
| 40 to 59 mm | 1,327 | 30.18 | 1.05 | 0.93–1.18 | 1.04 | 0.92 – 1.17 | |
| 20 to 39 mm | 1,478 | 33.61 | 0.98 | 0.87–1.11 | 0.96 | 0.85 – 1.09 | |
| 5 to 19 mm | 539 | 12.26 | 0.97 | 0.82–1.15 | 0.96 | 0.81 – 1.13 | |
| < 5 mm | 143 | 3.25 | 0.95 | 0.71–1.28 | 0.92 | 0.68 – 1.23 | |
| Age group, years | |||||||
| 70+ | 1,427 | 32.45 | ref | -- | ref | -- | |
| 60–69 | 1,357 | 30.86 | 0.49 | 0.45–0.54 | 0.53 | 0.48 – 0.58 | |
| 50–59 | 955 | 21.72 | 0.29 | 0.25–0.32 | 0.31 | 0.27 – 0.36 | |
| 18–49 | 658 | 14.96 | 0.32 | 0.26–0.38 | 0.36 | 0.30 – 0.44 | |
| Sex | |||||||
| Male | 2,603 | 59.20 | ref | -- | ref | -- | |
| Female | 1,794 | 40.80 | 0.75 | 0.69–0.82 | 0.75 | 0.69 – 0.83 | |
| Race | |||||||
| White | 3,362 | 76.44 | ref | -- | ref | -- | |
| Black | 648 | 14.73 | 1.03 | 0.91–1.17 | 1.03 | 0.91– 1.17 | |
| Other/Unknown | 388 | 8.82 | 0.78 | 0.65–0.93 | 0.80 | 0.67 – 0.95 | |
| Marital status | |||||||
| Married | 3,385 | 76.98 | -- | ref | -- | ||
| Never married | 140 | 3.18 | 1.24 | 0.97–1.59 | 1.24 | 0.97– 1.59 | |
| Separated/divorced/widowed | 731 | 16.62 | 1.22 | 1.09–1.36 | 1.20 | 1.07 – 1.34 | |
| Unknown | 141 | 3.21 | 1.00 | 0.78–1.27 | 0.96 | 0.75 – 1.22 | |
| Active-duty status | |||||||
| No | 4,079 | 92.77 | ref | -- | ref | -- | |
| Yes | 318 | 7.23 | 0.52 | 0.39–0.70 | 0.53 | 0.40 – 0.71 | |
| Sponsor Service branch | |||||||
| Army | 1,516 | 34.48 | ref | -- | ref | -- | |
| Navy/Marines | 1,192 | 27.11 | 1.09 | 0.98–1.21 | 1.07 | 0.97 – 1.19 | |
| Air Force | 1,362 | 30.98 | 0.93 | 0.84–1.03 | 0.93 | 0.84 – 1.03 | |
| Other | 327 | 7.44 | 1.10 | 0.97–1.26 | 1.13 | 0.97 – 1.35 | |
| Year of Diagnosis | |||||||
| 1989–1994 | 613 | 13.94 | ref | -- | Ref. | ||
| 1995–1999 | 1245 | 28.31 | 1.32 | 1.17–1.51 | 1.37 | 1.21–1.56 | |
| 2000–2004 | 1342 | 30.52 | 1.41 | 1.23–1.62 | 1.47 | 1.28–1.69 | |
| 2005–2010 | 1197 | 27.22 | 1.65 | 1.40–1.94 | 1.74 | 1.48–2.05 | |
| T stage | |||||||
| T1 | 550 | 12.51 | ref | -- | ref | -- | |
| T2 | 848 | 19.29 | 1.09 | 0.92–1.30 | 1.12 | 0.94 – 1.33 | |
| T3 | 2,614 | 59.45 | 1.25 | 1.07–1.47 | 1.36 | 1.16 – 1.60 | |
| T4 | 342 | 7.78 | 2.00 | 1.63–2.46 | 2.31 | 1.87 – 2.85 | |
| Unknown | 43 | 0.98 | 0.72 | 0.35–1.47 | 0.71 | 0.35 – 1.45 | |
| Grade | |||||||
| Well differentiated | 677 | 15.40 | ref | -- | ref | -- | |
| Moderately differentiated | 2,944 | 66.95 | 1.10 | 0.97–1.26 | 1.13 | 0.99 – 1.28 | |
| Poorly differentiated/Undifferentiated | 598 | 13.60 | 1.35 | 1.14–1.59 | 1.40 | 1.19 – 1.64 | |
| Unknown | 178 | 4.05 | 1.20 | 0.95–1.52 | 1.24 | 0.98 – 1.57 | |
| Number of lymph nodes examined | |||||||
| ≥12 | 2,731 | 62.11 | ref | -- | ref | -- | |
| 1–11 | 1,602 | 36.43 | 1.23 | 1.13–1.35 | 1.25 | 1.14 – 1.37 | |
| Unknown | 65 | 1.48 | 1.35 | 0.86–1.89 | 1.32 | 0.94 – 1.85 | |
| Nodal status | |||||||
| LN− | 2,710 | 61.63 | ref | -- | ref | -- | |
| LN+ | 1,687 | 38.37 | 1.54 | 1.41–1.68 | 1.99 | 1.80– 2.21 | |
| Chemotherapy | |||||||
| No | 2,668 | 61.63 | -- | -- | ref | -- | |
| Yes | 1,729 | 38.37 | -- | -- | 0.60 | 0.53 – 0.66 | |
LN−, Lymph node negative; LN+, Lymph node positive; HR, Hazard ratio; CI, Confidence intervals
Contains all variables except chemotherapy and all the variables were mutually adjusted
Contains all variables including chemotherapy and all the variables were mutually adjusted
Table 3 shows the results of the Cox proportional hazards models stratified by nodal status (LN− and LN+) or age (<50 years and ≥50 years). No significant differences by tumour size in overall survival were observed in these subgroups. Similar results were obtained regardless whether the analysis was adjusted for chemotherapy.
Table 3.
Adjusted Hazards Ratios for overall survival among patients diagnosed with colon cancer in the DoD’s Automated Central Tumour Registry (ACTUR), 1989–2010, stratified by select factors
| Model 1& | Model 2* | ||||||
|---|---|---|---|---|---|---|---|
| Stratum | Tumor Size | N | % | Adjusted HR | 95% CI | Adjusted HR | 95% CI |
| LN− | ≥60 mm | 519 | 19.15 | ref | -- | ref | -- |
| 40 to 59 mm | 772 | 28.49 | 1.12 | 0.94–1.32 | 1.10 | 0.93 – 1.30 | |
| 20 to 39 mm | 920 | 33.95 | 0.96 | 0.81–1.13 | 0.93 | 0.79 – 1.11 | |
| 5 to 19 mm | 388 | 14.32 | 1.08 | 0.86–1.34 | 1.05 | 0.85 – 1.31 | |
| < 5 mm | 111 | 4.10 | 1.02 | 0.71–1.45 | 0.99 | 0.70 – 1.42 | |
| LN+ | ≥60 mm | 391 | 23.18 | ref | -- | ref | -- |
| 40 to 59 mm | 555 | 32.90 | 0.98 | 0.82–1.16 | 0.97 | 0.82 – 1.15 | |
| 20 to 39 mm | 558 | 33.08 | 0.99 | 0.82–1.18 | 0.99 | 0.83 – 1.18 | |
| 5 to 19 mm | 151 | 8.95 | 0.82 | 0.62–1.08 | 0.83 | 0.63 – 1.09 | |
| < 5 mm | 32 | 1.90 | 0.85 | 0.48–1.50 | 0.83 | 0.47 – 1.46 | |
| <50 years | ≥60 mm | 181 | 27.51 | ref | -- | ref | -- |
| 40 to 59 mm | 211 | 32.07 | 0.93 | 0.63–1.36 | 0.93 | 0.63 – 1.36 | |
| 20 to 39 mm | 199 | 30.24 | 1.22 | 0.81–1.83 | 1.22 | 0.81 – 1.83 | |
| 5 to 19 mm | 52 | 7.90 | 0.79 | 0.39–1.62 | 0.78 | 0.38 – 1.60 | |
| < 5 mm | 15 | 2.28 | 1.04 | 0.23–4.60 | 1.07 | 0.24 – 4.77 | |
| ≥50 years | ≥60 mm | 729 | 19.50 | ref | -- | ref | -- |
| 40 to 59 mm | 1,116 | 29.85 | 1.06 | 0.94–1.21 | 1.05 | 0.93 – 1.19 | |
| 20 to 39 mm | 1,279 | 34.21 | 0.96 | 0.85–1.09 | 0.94 | 0.82 – 1.06 | |
| 5 to 19 mm | 487 | 13.02 | 0.98 | 0.82–1.16 | 0.96 | 0.81 – 1.15 | |
| < 5 mm | 128 | 3.42 | 0.94 | 0.69–1.27 | 0.90 | 0.66 – 1.22 | |
LN−, Lymph node negative; LN+, Lymph node positive; CI, Confidence intervals
Adjusted for age, gender, race, marital status, active-duty status, sponsor branch, year of diagnosis, tumour grade, tumour stage, number of lymph nodes examined and nodal status while the stratification variable (e.g. age) was not adjusted in the corresponding stratified analysis (e.g. stratified analysis by age). Chemotherapy was not adjusted for.
Adjusted for age, gender, race, marital status, active-duty status, sponsor branch, year of diagnosis, tumour grade, tumour stage, number of lymph nodes examined and nodal status while the stratification variable (e.g. age) was not adjusted in the corresponding stratified analysis (e.g. stratified analysis by age). Chemotherapy was adjusted for.
Discussion and Conclusions
Our study in a universal healthcare system found no association between tumour size and overall survival in node-positive colon cancer patients after adjustment for potential confounders. This finding persisted despite age or lymph node status.
Our findings differ from those in the study by Muralidhar et al,[6] in which very small tumours (<5mm) in node-positive colon cancer were associated with worse cancer-specific survival compared with larger tumours. The authors hypothesized that small tumours with lymph node involvement may signify more aggressive tumour biology. However, as chemotherapy data were not available in SEER, they were unable to assess the effects of chemotherapy, which is a standard treatment recommended for colon cancer patients with lymph node involvement and improves survival among them.[9,10] In our Cox model, we adjusted for chemotherapy and found that very small tumour size was not related to worse overall survival. The results remained similar after chemotherapy was excluded from the model, suggesting the minimum impact of adjuvant chemotherapy on the relationship between tumour size and survival. It is noteworthy that the outcome of our study was all-cause death, rather than cancer-specific death used in the study of Muralidhar et al.[6] Thus, the results may not be directly comparable because all-cause death may also result from factors other than tumour size.
The current study has the following strengths. First, to the best of our knowledge, our study is the first one in a universal healthcare system and therefore the effects of factors related to access to care, which are associated with both tumour size at diagnosis and survival, may be minimized. Second, our data contain information on chemotherapy, which is important for treatment of tumours with node involvement but unavailable in the SEER data for public use, allowing for assessing its potential effects on the relationship between tumour size and survival. Our study also had limitations. First, as mentioned, our study outcome was overall survival rather than cancer-specific survival and thus we do not exclude the effects of other factors on the study outcome. Due to incomplete information on comorbidities from the cancer registry data, we were unable to assess if comorbid conditions might have affected the study results. Second, chemotherapy data from the cancer registry do not contain detailed information such as drugs used and time interval between diagnosis and treatment, and thus its residual effects on the study findings cannot be excluded. Finally, sample sizes were relatively small especially for the group with very small tumours and therefore the study power might be low for the group.
In conclusion, tumour size was not associated with overall survival among colon cancer patients in the MHS, a universal healthcare system. Larger studies with a longer follow-up are warranted in the future to confirm the findings.
What does this paper add to the literature?
It is important to improve our knowledge about the relationship between tumour size and survival among colon cancer patients. It has been suggested that colon cancer patients with very small tumours have poorer survival than those with large tumours when lymph nodes are involved. In contrast to this finding, our study in a universal health care system found that small tumour size was not associated with worse survival in node-positive colon cancer patients.
Acknowledgements:
The authors thank the Joint Pathology Center (formerly Armed Forces Institute of Pathology) for providing ACTUR data.
Funding:
This project was supported by John P. Murtha Cancer Center, Uniformed Services University of the Health Sciences and Walter Reed National Military Medical Center under the auspices of the Henry M. Jackson Foundation for the Advancement of Military Medicine.
Footnotes
Publisher's Disclaimer: Disclaimer: The contents of this publication are the sole responsibility of the author(s) and do not necessarily reflect the views, opinions or policies of Uniformed Services University of the Health Sciences (USUHS), The Henry M. Jackson Foundation for the Advancement of Military Medicine, Inc., the Department of Defense (DoD) or the Departments of the Army, Navy, or Air Force. Mention of trade names, commercial products, or organizations does not imply endorsement by the U.S. Government.
Conflicts of Interest: None
Ethics approval: The use of the data for this study was approved by the Institutional Review Board of the Walter Reed National Military Medical Center.
References
- 1.Kornprat P, Pollheimer MJ, Lindtner RA, Schlemmer A, Rehak P, Langner C (2011) Value of tumor size as a prognostic variable in colorectal cancer: a critical reappraisal. American journal of clinical oncology 34 (1):43–49. doi: 10.1097/COC.0b013e3181cae8dd [DOI] [PubMed] [Google Scholar]
- 2.Saha S, Shaik M, Johnston G, Saha SK, Berbiglia L, Hicks M, Gernand J, Grewal S, Arora M, Wiese D (2015) Tumor size predicts long-term survival in colon cancer: an analysis of the National Cancer Data Base. American journal of surgery 209 (3):570–574. doi: 10.1016/j.amjsurg.2014.12.008 [DOI] [PubMed] [Google Scholar]
- 3.Wo JY, Chen K, Neville BA, Lin NU, Punglia RS (2011) Effect of very small tumor size on cancer-specific mortality in node-positive breast cancer. Journal of clinical oncology : official journal of the American Society of Clinical Oncology 29 (19):2619–2627. doi: 10.1200/jco.2010.29.5907 [DOI] [PMC free article] [PubMed] [Google Scholar]
- 4.Ryu JM, Lee HJ, Yoon TI, Lee ES, Lee SJ, Jung JH, Chae BJ, Nam SJ, Lee JE, Lee SK, Bae SY, Yu J, Kim SW (2016) Breast cancer-specific mortality in small-sized tumor with node-positive breast cancer: a nation-wide study in Korean breast cancer society. Breast cancer research and treatment 159 (3):489–498. doi: 10.1007/s10549-016-3943-4 [DOI] [PubMed] [Google Scholar]
- 5.Muralidhar V, Nipp RD, Mamon HJ, Punglia RS, Hong TS, Ferrone C, Fernandez-Del Castillo C, Parikh A, Nguyen PL, Wo JY (2018) Association Between Very Small Tumor Size and Decreased Overall Survival in Node-Positive Pancreatic Cancer. Ann Surg Oncol 25 (13):4027–4034. doi: 10.1245/s10434-018-6832-8 [DOI] [PubMed] [Google Scholar]
- 6.Muralidhar V, Nipp RD, Ryan DP, Hong TS, Nguyen PL, Wo JY (2016) Association Between Very Small Tumor Size and Increased Cancer-Specific Mortality in Node-Positive Colon Cancer. Dis Colon Rectum 59 (3):187–193. doi: 10.1097/dcr.0000000000000532 [DOI] [PubMed] [Google Scholar]
- 7.Vogel JD, Eskicioglu C, Weiser MR, Feingold DL, Steele SR (2017) The American Society of Colon and Rectal Surgeons Clinical Practice Guidelines for the Treatment of Colon Cancer. Dis Colon Rectum 60 (10):999–1017. doi: 10.1097/dcr.0000000000000926 [DOI] [PubMed] [Google Scholar]
- 8.Boland GM, Chang GJ, Haynes AB, Chiang YJ, Chagpar R, Xing Y, Hu CY, Feig BW, You YN, Cormier JN (2013) Association between adherence to National Comprehensive Cancer Network treatment guidelines and improved survival in patients with colon cancer. Cancer 119 (8):1593–1601. doi: 10.1002/cncr.27935 [DOI] [PMC free article] [PubMed] [Google Scholar]
- 9.Andre T, Boni C, Navarro M, Tabernero J, Hickish T, Topham C, Bonetti A, Clingan P, Bridgewater J, Rivera F, de Gramont A (2009) Improved overall survival with oxaliplatin, fluorouracil, and leucovorin as adjuvant treatment in stage II or III colon cancer in the MOSAIC trial. Journal of clinical oncology : official journal of the American Society of Clinical Oncology 27 (19):3109–3116. doi: 10.1200/jco.2008.20.6771 [DOI] [PubMed] [Google Scholar]
- 10.Schmoll HJ, Twelves C, Sun W, O’Connell MJ, Cartwright T, McKenna E, Saif M, Lee S, Yothers G, Haller D (2014) Effect of adjuvant capecitabine or fluorouracil, with or without oxaliplatin, on survival outcomes in stage III colon cancer and the effect of oxaliplatin on post-relapse survival: a pooled analysis of individual patient data from four randomised controlled trials. The Lancet Oncology 15 (13):1481–1492. doi: 10.1016/s1470-2045(14)70486-3 [DOI] [PMC free article] [PubMed] [Google Scholar]
- 11.Commission on Cancer (2012) Cancer Program Standards 2012: Ensuring Patient-Centered Care. Data Quality. American College of Surgeons, [Google Scholar]
- 12.Nelson H, Petrelli N, Carlin A, Couture J, Fleshman J, Guillem J, Miedema B, Ota D, Sargent D (2001) Guidelines 2000 for colon and rectal cancer surgery. J Natl Cancer Inst 93 (8):583–596 [DOI] [PubMed] [Google Scholar]
- 13.American Joint Committee on Cancer (2002) AJCC Cancer Staging Manual. 6th edn. Springer, New York [Google Scholar]