Abstract
MRI-based cartilage compositional analysis shows biochemical and microstructural changes at early stages of osteoarthritis before changes become visible with structural MRI sequences and arthroscopy. This could help with early diagnosis, risk assessment, and treatment monitoring of osteoarthritis. Spin-lattice relaxation time constant in rotating frame (T1ρ) and T2 mapping are the MRI techniques best established for assessing cartilage composition. Only T2 mapping is currently commercially available, which is sensitive to water, collagen content, and orientation of collagen fibers, whereas T1ρ is more sensitive to proteoglycan content. Clinical application of cartilage compositional imaging is limited by high variability and suboptimal reproducibility of the biomarkers, which was the motivation for creating the Quantitative Imaging Biomarkers Alliance (QIBA) Profile for cartilage compositional imaging by the Musculoskeletal Biomarkers Committee of the QIBA. The profile aims at providing recommendations to improve reproducibility and to standardize cartilage compositional imaging. The QIBA Profile provides two complementary claims (summary statements of the technical performance of the quantitative imaging biomarkers that are being profiled) regarding the reproducibility of biomarkers. First, cartilage T1ρ and T2 values are measurable at 3.0-T MRI with a within-subject coefficient of variation of 4%–5%. Second, a measured increase or decrease in T1ρ and T2 of 14% or more indicates a minimum detectable change with 95% confidence. If only an increase in T1ρ and T2 values is expected (progressive cartilage degeneration), then an increase of 12% represents a minimum detectable change over time. The QIBA Profile provides recommendations for clinical researchers, clinicians, and industry scientists pertaining to image data acquisition, analysis, and interpretation and assessment procedures for T1ρ and T2 cartilage imaging and test-retest conformance. This special report aims to provide the rationale for the proposed claims, explain the content of the QIBA Profile, and highlight the future needs and developments for MRI-based cartilage compositional imaging for risk prediction, early diagnosis, and treatment monitoring of osteoarthritis.
© RSNA, 2021
Online supplemental material is available for this article.
See also the editorial by Kijowski in this issue.
Summary
This article summarizes the claims and procedures of the Musculoskeletal Biomarker Committee Profile of the Quantitative Imaging Biomarkers Alliance for standardized MRI-based cartilage compositional imaging (spin-lattice relaxation time constant in rotating frame, or T1ρ, and T2).
Key Results
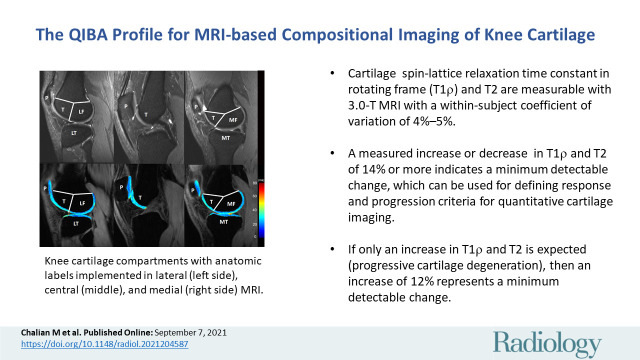
■ Cartilage spin-lattice relaxation time constant in rotating frame (T1ρ) and T2 are measurable with 3.0-T MRI with a within-subject coefficient of variation of 4%–5%.
■ A measured increase or decrease in T1ρ and T2 of 14% or more indicates a minimum detectable change, which can be used for defining response and progression criteria for quantitative cartilage imaging.
■ If only an increase in T1ρ and T2 is expected (progressive cartilage degeneration), then an increase of 12% represents a minimum detectable change.
Introduction
Advances in MRI technology have revolutionized cartilage imaging from morphologic assessment to compositional analysis. MRI-based compositional cartilage biomarkers such as spin-lattice relaxation time constant in rotating frame (T1ρ) and T2 values provide quantitative measures used for early detection of cartilage damage (1–3). T1ρ is an MRI sequence developed for use in musculoskeletal imaging research and not in widespread clinical use. T1ρ is sensitive to proteoglycan content of cartilage, whereas T2 is more sensitive to water and collagen content and orientation of collagen fibers. The measures have also been used to predict and monitor incidence and progression of osteoarthritis (4–7) while also assessing response to interventions, such as cartilage repair and osteotomy (8–11). Nevertheless, MRI-based compositional cartilage biomarkers have not been used widely in clinical practice. Instead, they have been used mostly for cross-sectional and longitudinal research studies (12–14). A major issue preventing the transition to clinical application is a lack of standardization, which includes patient preparation, image acquisition, and image analysis, to reduce measurement variability and achieve comparable outcomes with different scanners.
To overcome technical limitations and to better standardize quantitative imaging biomarkers, the Radiological Society of North America launched Quantitative Imaging Biomarkers Alliance (QIBA) in 2007. QIBA aims to "improve the value and practicality of quantitative imaging biomarkers by reducing variability across devices, sites, patients, and time" (15) and to "unite researchers, healthcare professionals and industry to advance quantitative imaging and the use of imaging biomarkers in clinical trials and clinical practice" (16). The primary output of QIBA committees are quantitative imaging documents based on validated and standardized imaging biomarkers called Profiles. A Profile makes performance claims. Claims are summary statements of the technical performance of the quantitative imaging biomarkers being profiled on the basis of currently accepted standards. A Profile also defines the groundwork activities, clinical context, and appropriate compliance procedures to achieve the claims.
The QIBA Musculoskeletal, or MSK, Committee aims to standardize the application of T1ρ and T2 imaging as biomarkers for the quantification of cartilage composition. To implement this task, the QIBA MSK Committee has worked on requirements and recommendations for acquisition devices, technologists, radiologists, reconstruction software, and image analysis tools involved in study participant handling, image acquisition, image data reconstruction, image quality assurance, and image interpretation. The requirements are focused on achieving sufficient reproducibility for the longitudinal evaluation of cartilage composition by using different MRI scanners.
This report provides a concise summary of the QIBA MSK Committee Profile on MRI-based compositional cartilage biomarkers and describes its claims. This report also includes potential implications for clinical patient care and research including clinical trials and epidemiologic observational studies, and future directions in this field.
Current State and Challenges of Cartilage Compositional Imaging
Osteoarthritis is the most common type of arthritis and a major health concern for our aging population, with prevalence of 33.6% in adults older than 65 years (17). Disease burden of osteoarthritis is multifaceted and includes direct, indirect, and intangible costs related to pain, disability, and reduced quality of life (18). To our knowledge, we do not have an efficacious drug therapy for this debilitating and progressive disease. Thus, the development of reproducible biomarkers for risk assessment, early diagnosis, and monitoring of osteoarthritis has a considerable impact at personal and public levels.
The Kellgren-Lawrence grading system, accepted by the World Health Organization in 1961, remains the current reference standard to diagnose osteoarthritis. It is based on radiographic findings of osteophytes and joint space narrowing as indirect evidence of cartilage loss (19). Over the last 2 decades, noninvasive compositional cartilage imaging by using MRI has been developed and used extensively, mostly in research settings. MRI has become the imaging modality of choice for cartilage assessment because of its ability to depict a wide spectrum of structural and compositional features of tissues. Thus, MRI is a central component of large-scale longitudinal epidemiologic studies such as the Osteoarthritis Initiative, or OAI, and the Multicenter Osteoarthritis Study, or MOST.
Typically, osteoarthritis-related changes at MRI are assessed with morphologic analysis (20) but this assessment has drawbacks, including subjective evaluation and diagnosis at advanced disease stages when cartilage loss has already occurred. To address these limitations, quantitative imaging biomarkers for assessing cartilage compositional changes at a prestructural stage have been developed. Several techniques have been developed, such as T2/T2* mapping (21–27), T1ρ measurements (23,27–30), delayed gadolinium-enhanced MRI in cartilage (31,32), sodium imaging (33), glycosaminoglycan chemical exchange saturation transfer (34,35), and diffusion MRI (36,37). These techniques analyze the cartilage mainly by providing information regarding water content, collagen integrity, and proteoglycan content (38).
Among all the available techniques for MRI-based compositional cartilage imaging, T2 and T1ρ mappings have become widely accepted with the largest body of literature. Multiple studies, mostly at the knee, have reported promising data regarding the validity, reproducibility, ability to monitor interventions, and ability to predict symptomatic osteoarthritis for T2 (21–27) and T1ρ (23,27–30). Other compositional cartilage imaging techniques overall have been studied less rigorously because they are newer and their advanced technical requirements limit them to a handful of research institutions.
In clinical practice, there are still tangible concerns regarding the standardization of compositional cartilage imaging techniques for longitudinal examinations, particularly regarding the use of different scanners from the same or different vendors. In addition, to our knowledge, no reference values for T2 and T1ρ have been established to define cartilage as normal or abnormal. These shortcomings have limited the utility of the biomarkers to clinical research, such as longitudinal clinical trials. Thus, addressing them is crucial before these imaging approaches can be used as reliable and reproducible tools in clinical practice (12–14). These issues are mainly the results of specific scanner features, sequence protocols (including image noise, spatial resolution), and different technologies from multiple vendors (including data reconstruction, correction). These are addressed in the QIBA MSK Profile and its claims.
Profile Claims
The QIBA Profile summarizes test-retest variability and minimum detectable change (the smallest change over time that can confidently declare a true change) of cartilage T2 and T1ρ values in claims 1 and 2.
Claim 1
Test-retest variability (nonlongitudinal) of cartilage T2 and T1ρ values are measurable at the knee with a within-subject coefficient of variation of 4%–5%. This claim applies to 3.0-T scanners from the same vendor (2,23,25,27,39).
Claim 2
A measured increase or decrease in T2 and T1ρ of 14% or more indicates that a minimum detectable change has occurred with 95% confidence on longitudinal scans. If only an increase in T2 and T1ρ is expected (ie, progressive cartilage degeneration), then an increase of 12% represents a minimum detectable change.
The claims are focused on these specific measurements because of their relevance for clinical practice and clinical trials, and availability of published supporting literature. The practical implication of the claims is to establish a measurement assay (4%–5%) for test-retest reliability of T2 and T1ρ measurements. Also, claim 2 provides the minimum detectable difference in T2 and T1ρ values in a single patient in longitudinal scans, which can be used as a basis for defining response and progression criteria for quantitative cartilage imaging. Clinical trials with larger sample sizes could potentially detect smaller differences on the basis of the sample size, and intersubject and within-subject coefficient of variations.
Considerations for the Profile Claims to Be Valid
The following several conditions should be considered for the claims to be valid:
The claims are for knee cartilage only. There are only a few studies that use T1ρ and T2 at the hip, with less standardization of measurements. The hip may be added at a later stage.
The claims require most of the morphologic structure of the cartilage to be normal without marked cartilage loss or major defects. Therefore, analyses should be restricted to patients with a Kellgren-Lawrence score of 2 or less at baseline.
These claims are on the basis of semiautomatic or automatic cartilage segmentation by using dedicated analysis software.
The claims are applicable for single and multicenter studies by using the same 3.0-T MRI scanner model, type, and imaging protocol. We do not anticipate that the claims will be met for scanners from different manufacturers at this point.
The claims require use of calibration phantoms to confirm consistency of measurements.
Derivation of the Claim
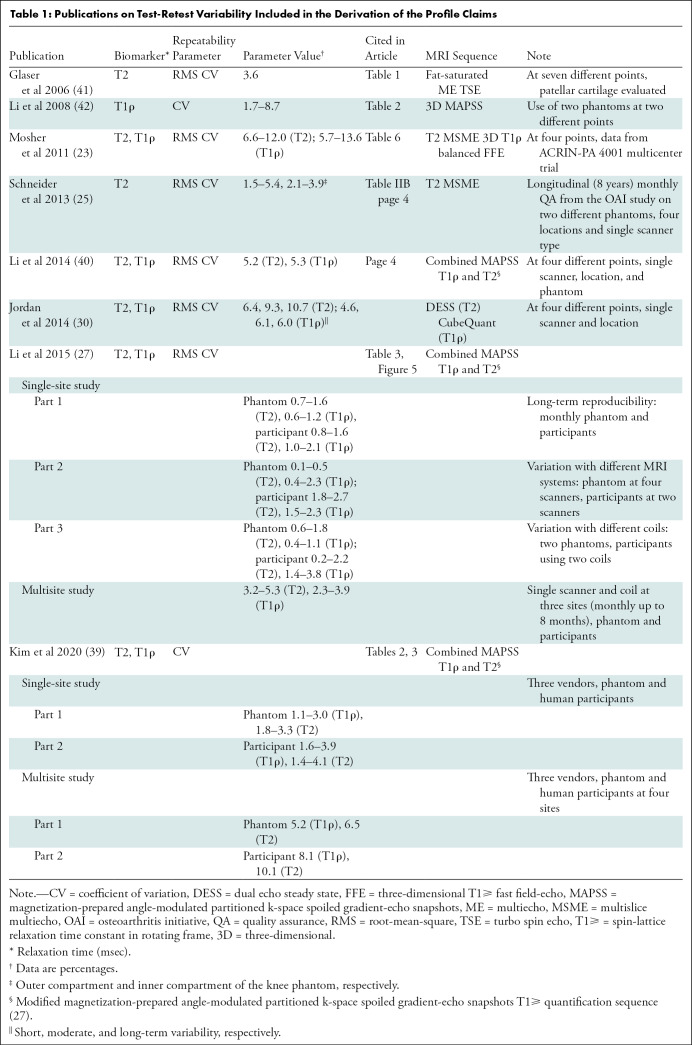
Test-retest reproducibility and variability of T2 and T1ρ values have been reported in a number of publications (25,27,30,40). Details of the claims were derived from extensive review of the literature (Table 1) and two recent meta-analyses (2,3). Comparing repeatability of measurements from different studies is complicated by lack of standard imaging protocols and heterogeneity in methodologic analyses. Therefore, the proposed claims are mainly consensus claims that have not yet been substantiated by studies that strictly conform to the specifications in the Profile. The expectation is that data will be collected from future studies and/or field testing, and changes will be made to the Profile accordingly.
Table 1:
Publications on Test-Retest Variability Included in the Derivation of the Profile Claims
A further complication when comparing publications is the difference in scanner systems, and single versus multiple sites of imaging. Most of the published literature uses a single scanner system (23,40–42). Schneider et al (25) reported data on the basis of the Osteoarthritis Initiative study by using the same scanner model at different sites. Li et al (27) reported test-retest reproducibility of T2 and T1ρ at single and multiple sites by using same scanner system, coils, and imaging protocols. Recently, Kim et al (39) used different MRI scanner systems at multiple sites to report reproducibility of T2 and T1ρ. Studies also vary in terms of internal validation of measurements with phantom imaging and different MRI sequences used for T2 and T1ρ imaging (Table 1).
Global or regional segmentation of cartilage for measurement of T2 and T1ρ values also varied between publications. Whereas Mosher (23) and Li et al (40) reported values on a five-regions-of-interest segmentation system, Jordan et al (30) used a 10-regions-of-interest segmentation of the knee. Glaser (41) reported reproducibility of T2 value only on the patellar cartilage.
Clinical Interpretation
An increase in T1ρ and T2 measurements represents progressive cartilage degeneration, driven by risk factors for osteoarthritis such as obesity (43), previous injury (44), and excessive physical activity (45,46). The smaller the amount of increase in these measurements, the less cartilage degeneration is observed. Of note, cartilage injury related to marathon running has been shown to be reversible, with increase in T2 value after the marathon and normalization over 3 months (47).
Profile Structure
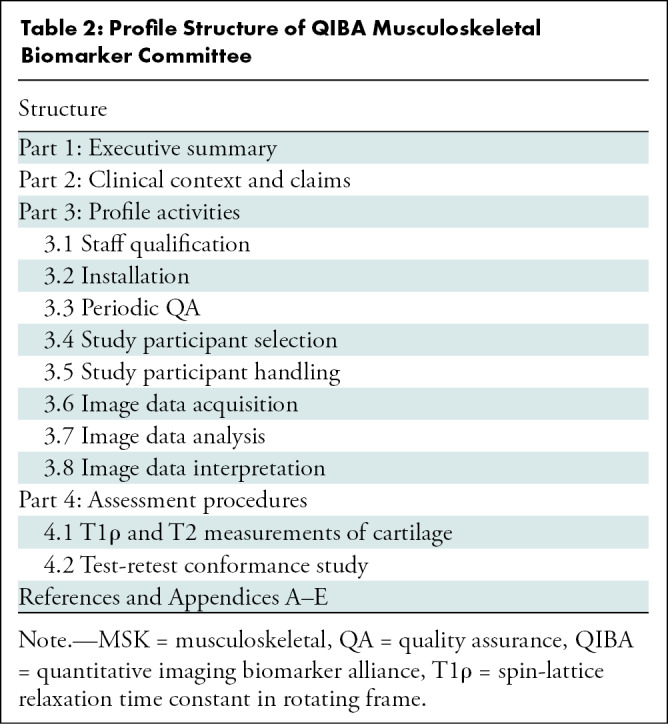
Table 2 lists the overall structure and activities of the Profile. Each section describes recommendations necessary to achieve the Profile claims. Here we provide a brief overview of the steps and recommendations. Some critical information necessary to achieve the Profile claims are presented as appendices and checklists.
Table 2:
Profile Structure of QIBA Musculoskeletal Biomarker Committee
Profile Activities
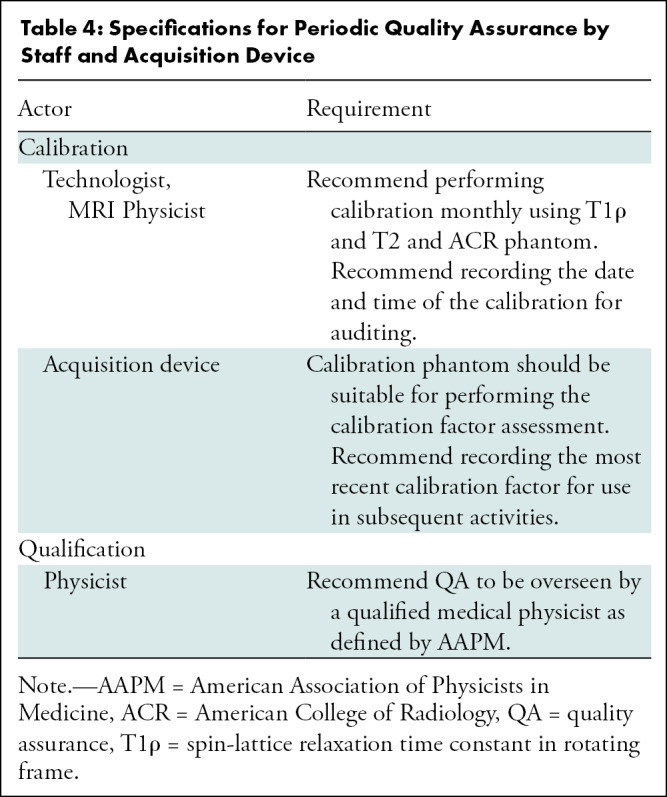
This section of the Profile organizes details on qualification, installation, quality assurance, study participant handling, image acquisition, image analysis, and data interpretation in a pipeline that extracts quantitative imaging biomarkers with the specifications described in the Profile claims. Site, equipment, staff, and software should claim conformance to this Profile as the "actors" (Table 3) supporting the listed “activities.” Table 4 is an example of three components of parameter, actor, and requirements for periodic quality assurance. The requirements in this Profile do not codify a standard of care and only provide guidance intended to achieve the stated claims. Failing to conform to a “recommendation” in this Profile is a protocol deviation. Although deviations invalidate the Profile claims, such deviations may be reasonable and unavoidable, and the radiologist or supervising physician is expected to do so when required in the best interest of the patient or research participant.
Table 3:
Profile Activities: Actors and Required Activities
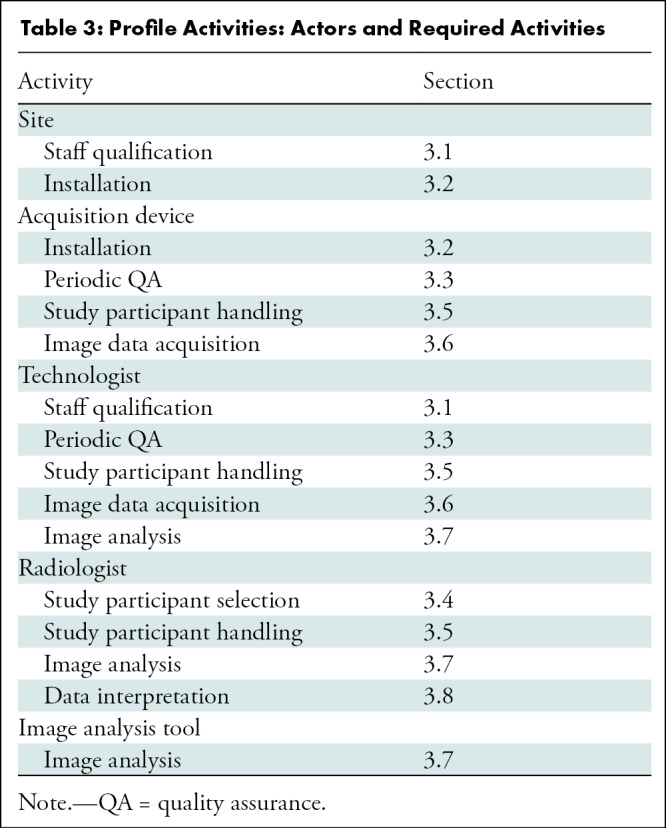
Table 4:
Specifications for Periodic Quality Assurance by Staff and Acquisition Device
Installation of Pulse Sequences, Coils, Phantoms, and Segmentation Software
We recommend performing installation and initial validation according to manufacturer-defined procedures and specifications. Pulse sequences are based on the recommendations of the published cross-calibration study (39) (details are listed in the Image Data Acquisition section). To achieve the Profile claims of reproducibility, our recommendations for installation include the following:
For reproducible knee positioning, at a minimum, use knee quadrature transmit eight-channel phased-array receiver coils or eight-channel phased array flex coil with positioning device.
Use identical coils for repeated longitudinal measurements.
Use a calibration phantom to cross-calibrate repeated measurements across scanners and different sites and to assess reproducibility of T1ρ and T2 measurements.
Install semi-automatic or automatic segmentation software that allows reproducible segmentation of the cartilage.
Image Data Acquisition
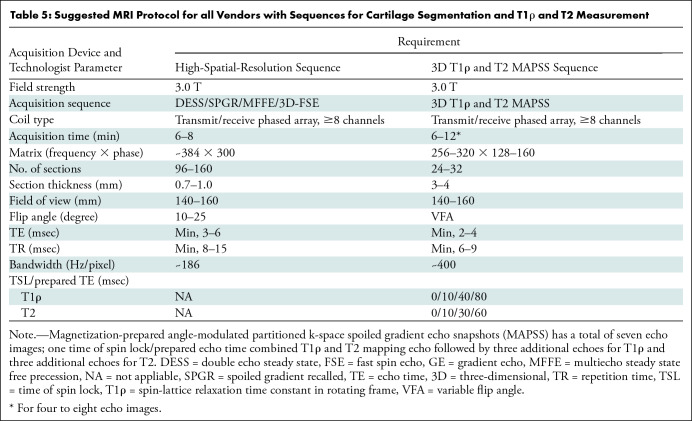
Our recommendations (Table 5) for image data acquisition include the following:
Table 5:
Suggested MRI Protocol for all Vendors with Sequences for Cartilage Segmentation and T1ρ and T2 Measurement
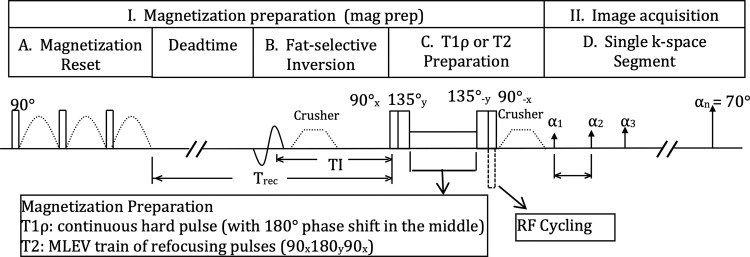
T1ρ and T2 sequences are recommended to be based on the magnetization-prepared angle-modulated partitioned k-space spoiled gradient-echo snapshots acquisition (Fig 1).
High-spatial-resolution three-dimensional gradient-echo sequences are recommended (48) for registration with T1ρ and T2 sequences and to perform reliable and reproducible cartilage segmentation. In particular, fast acquisition double echo, dual-echo steady state, and multi-echo in steady state acquisition sequences provides superior contrast between cartilage and fluid for segmentation.
It is recommended to scan the calibration phantom by using geometric structures included in the phantom for the high-spatial-resolution imaging for registration and cartilage segmentation.
Figure 1:
The magnetization-prepared angle-modulated partitioned k-space spoiled gradient echo snapshots–based spin-lattice relaxation time constant in rotating frame (T1ρ) and T2 imaging sequence is available as a research prototype by the three major MRI vendors including GE Healthcare, Siemens Healthineers, and Philips Healthcare Solutions. MLEV = Malcolm Levitt composite-pulse decoupling sequence, RF = radiofrequency.
The magnetization-prepared angle-modulated partitioned k-space spoiled gradient echo snapshots technique has been validated in multisite multivendor studies (27,39,42) and has a combined T1ρ and T2 mapping capability (40). Multisection multiecho sequences have been used to measure cartilage T2 value (49). Whereas multisection multiecho sequences have good reproducibility across different sites for one vendor (25), statistically significant differences in T2 measures have been reported between vendors (10%–25%) (50). Multisection multiecho sequences are also prone to variations introduced by stimulated echoes and magnetization transfer effects (51). Three-dimensional fast spin-echo sequences (such as CUBE and sampling perfection with application optimized contrasts by using different flip-angle evolution, known as SPACE) have been used for cartilage segmentation but tend to have signal loss in the deep cartilage layers (52).
Image Data Analysis and Interpretation
The following are our recommendations on image analysis and interpretation:
Global, knee compartment-specific, and focal (lesion-specific) cartilage analysis should be performed.
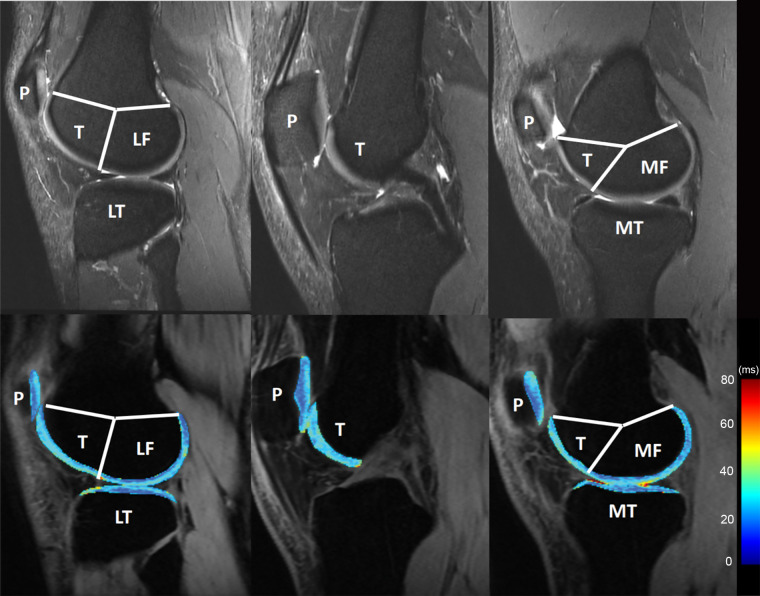
Semiautomatic or automatic segmentation software could be used. Six knee compartments are defined in Figure 2. The femoral and tibial compartments can be further divided into subcompartments on the basis of meniscus anatomy (53).
The region of interest could be manually drawn around areas of cartilage repair and evolving cartilage lesions for lesion-specific analysis (54). Surrounding cartilage should be segmented and used as a control region. “Surrounding” cartilage should include all the remaining and clearly distinguishable cartilage in one of the six knee compartments.
The segmentations obtained should be overlaid on the first echo of the T1ρ- and T2-weighted images after registration.
Mean and standard deviation of T1ρ and T2 values should be measured for each defined compartment and the average of all compartments (55).
Figure 2:
Knee cartilage compartments with anatomic labels implemented in lateral (left side), central (middle), and medial (right side) MRI obtained with an intermediate weighted fat-saturated fast-spin-echo sequence (top row) and a spin-lattice relaxation time constant in rotating frame (T1ρ) magnetization-prepared angle-modulated partitioned k-space spoiled gradient echo snapshots sequence (bottom row, T1ρ maps). Study was performed without administration of intravenous gadolinium-based contrast material. The lateral femur (LF)/medial femur (MF) and lateral tibia (LT)/medial tibia (MT) can be further divided into subcompartments on the basis of meniscus anatomy according to Eckstein et al. Source.—Reference 53. P = patella, T = trochlea.
Image data interpretation will focus on longitudinal changes of the cartilage composition on the basis of the claims of the Profile. A large-scale normative cartilage T2 value database specific to age, sex, and body mass index is available on the basis of data from the Osteoarthritis Initiative (56). Currently, to our knowledge, there is no T1ρ and T2 normal reference database with the sequences proposed in this Profile. Development of a normal reference database is beyond the scope of this Profile but would be the next step in the clinical implementation of T1ρ and T2 measurements.
Assessment Procedures and Conformance
Procedures to assess test-retest conformance are in Appendix E1 (online). Table 6 depicts specifications for imaging requirements and procedures.
Table 6:
Specifications for Imaging Requirements and Procedures
Limitations
First, the variability among vendors, centers, MRI scanners, and patients could limit the reproducibility of the claims of this Profile. Second, open source semiautomated or fully automated cartilage segmentation data set and analysis software is lacking, which may further increase variability among different centers.
Future Developments and Conclusions
Multiple studies and technological advancements that can be implemented in the next version of this Profile are under development. Compositional cartilage MRI data sets are available through the Osteoarthritis Initiative (57) and other multicenter studies (27). Moreover, continuous advances in technology (58,59) have made it feasible to take a stepwise approach to bringing quantitative cartilage imaging to the clinic. Further studies that provide normative data and cutoff values for MRI-based cartilage biomarkers to define abnormal cartilage compositional values and disease burden are required. Many of these studies are currently underway or in the planning stage:
A National Institutes of Health and National Institute of Arthritis and Musculoskeletal and Skin Diseases–funded multicenter calibration study is underway to standardize cartilage compositional MRI sequences across different vendor platforms. This will help to establish reproducibility of T1ρ and T2 values across different sites and vendors.
Also funded through the National Institutes of Health and the National Institute of Arthritis and Musculoskeletal and Skin Diseases, a calibration phantom is being developed to obtain reference measurements with T1ρ and T2 that makes data comparison between different sites and vendors feasible.
Development of single “best suited” and vendor-independent high-spatial-resolution three-dimensional MRI sequence for cartilage segmentation and registration is another goal of the QIBA MSK Biomarker Committee to further improve reproducibility and standardization of MRI cartilage composition.
Machine learning–based image reconstruction algorithms are being developed for automatic cartilage segmentation, cartilage lesion detection, and differentiation of different musculoskeletal anatomies (58,60–65).
Successful accomplishment of the claims of this Profile and these four steps will expedite establishing normative data and cutoff values for MRI-based cartilage biomarkers to define pathologic structure (12). Large-scale validated quantitative biomarker data could be used to improve risk prediction models for clinical use such as the Tool for Osteoarthritis Risk Prediction model developed on the basis of study participant characteristics, knee radiographs, and MRI data (66).
The current version of the Quantitative Imaging Biomarkers Alliance (QIBA) Profile for MRI-based cartilage compositional imaging provides practical recommendations for standardized cartilage compositional imaging, which can be used clinically, for research, and for developing drugs. The proposed claims could be used for longitudinal clinical evaluation and research (67). We acknowledge that it is challenging to follow the proposed claims outside specialized scientific and research centers at this time. However, we believe that with recent advancements in MRI techniques, artificial intelligence and deep learning–based algorithms are promising tools to overcome these obstacles that will be available in the near future. This Profile will be updated periodically on the basis of emerging data and advances in technology. We believe QIBA Profiles including the presented work provide roadmaps for implementation of quantitative imaging in clinical practice and a robust foundation for technology advancements and precision medicine.
Acknowledgments
Acknowledgments
We thank all the individuals and institutions that provided us with their invaluable comments on the publicly available version of the MSK QIBA Profile. We are particularly grateful for the assistance and diligent support provided by the RSNA staff and QIBA leaderships.
RSNA QIBA MSK Biomarker Committee Members (alphabetically ordered): Michael Boss, PhD, American College of Radiology (ACR); Angie Botto-van Bemden, PhD, ATC, CSCS, International Cartilage Regeneration & Joint Preservation Society (ICRS); Robert Boutin, MD, Stanford University; Ruud de Boer, PhD, Philips Healthcare (Netherlands); Harry Friel, MS, Philips Medical Systems; Maggie Fung, Meng, GE Healthcare; Peter Hardy, PhD, University of Kentucky; Gabby Joseph, PhD, University of California, San Francisco (UCSF); Youngkyoo Jung, PhD, DABR, University of California, Davis; Kathryn Keenan, PhD, National Institute of Standards and Technology (NIST); Jason Kim, PhD, Arthritis Foundation; Feliks Kogan, PhD, Stanford University; Leon Lenchik, MD, Wake Forest University; Kecheng Liu, PhD, MBA, Siemens Healthineers; Annelise (Annie) Malkus, PhD, HealthMyne; Elizabeth Mirowski, PhD, Verellium; Yuxi Pang, PhD, University of Michigan; Qi (Chris) Peng, PhD, Albert Einstein College of Medicine; Rob Peters, PhD, GE Healthcare; Fraser Robb, PhD, GE Healthcare; Suraj Serai, PhD, Children’s Hospital of Philadelphia; Scott Swanson, PhD, University of Michigan; Carl Winalski, MD, Cleveland Clinic Foundation; Can Wu, PhD, Philips Health Systems North America; Cory Wyatt, PhD, Oregon Health and Science University.
X.L. supported by the National Institutes of Health/National Institute of Arthritis and Musculoskeletal and Skin Diseases (R01AR077452).
Disclosures of Conflicts of Interest: M.C. disclosed receiving the RSNA R&E Research Scholar Grant. X.L. disclosed no relevant relationships. A.G. disclosed consultancies from Pfizer, AstraZeneca, Regeneron, Novartis, MerckSerono, TissueGene; stock/stock options from BICL; is member of the Radiology editorial board. N.A.O. disclosed money paid to author’s institution from RSNA because the author is a statistical consultant for QIBA through a contract between Cleveland Clinic and RSNA. J.A.C. disclosed consultancies from Pfizer, Covera, Globus, Simplify Medical; disclosed travel/accommodations/meeting expenses from Carestream, Image Analysis Group; disclosed that author is a deputy editor for Radiology, associate editor for Arthritis and Rheumatology. E.H.O. disclosed no relevant relationships. T.M.L. is member of the Radiology editorial board.
Abbreviations:
- QIBA
- Quantitative Imaging Biomarkers Alliance
- T1ρ
- spin-lattice relaxation time constant in rotating frame
Contributor Information
Majid Chalian, Email: mchalian@uw.edu.
Collaborators: Michael Boss, Angie Botto-van Bemden, Robert Boutin, Ruud de Boer, Harry Friel, Maggie Fung, Peter Hardy, Gabby Joseph, Youngkyoo Jung, Kathryn Keenan, Jason Kim, Feliks Kogan, Leon Lenchik, Kecheng Liu, Annelise (Annie) Malkus, Elizabeth Mirowski, Yuxi Pang, Qi (Chris) Peng, Rob Peters, Fraser Robb, Suraj Serai, Scott Swanson, Carl Winalski, Can Wu, and Cory Wyatt
References
- 1. Li X , Benjamin Ma C , Link TM , et al . In vivo T(1rho) and T(2) mapping of articular cartilage in osteoarthritis of the knee using 3 T MRI . Osteoarthritis Cartilage 2007. ; 15 ( 7 ): 789 – 797 . [DOI] [PMC free article] [PubMed] [Google Scholar]
- 2. MacKay JW , Low SBL , Smith TO , Toms AP , McCaskie AW , Gilbert FJ . Systematic review and meta-analysis of the reliability and discriminative validity of cartilage compositional MRI in knee osteoarthritis . Osteoarthritis Cartilage 2018. ; 26 ( 9 ): 1140 – 1152 . [DOI] [PubMed] [Google Scholar]
- 3. Atkinson HF , Birmingham TB , Moyer RF , et al . MRI T2 and T1ρ relaxation in patients at risk for knee osteoarthritis: a systematic review and meta-analysis . BMC Musculoskelet Disord 2019. ; 20 ( 1 ): 182 . [DOI] [PMC free article] [PubMed] [Google Scholar]
- 4. Prasad AP , Nardo L , Schooler J , Joseph GB , Link TMT . T1ρ and T2 relaxation times predict progression of knee osteoarthritis . Osteoarthritis Cartilage 2013. ; 21 ( 1 ): 69 – 76 . [DOI] [PMC free article] [PubMed] [Google Scholar]
- 5. Gallo MC , Wyatt C , Pedoia V , et al . T1ρ and T2 relaxation times are associated with progression of hip osteoarthritis . Osteoarthritis Cartilage 2016. ; 24 ( 8 ): 1399 – 1407 . [DOI] [PMC free article] [PubMed] [Google Scholar]
- 6. Joseph GB , Baum T , Alizai H , et al . Baseline mean and heterogeneity of MR cartilage T2 are associated with morphologic degeneration of cartilage, meniscus, and bone marrow over 3 years--data from the Osteoarthritis Initiative . Osteoarthritis Cartilage 2012. ; 20 ( 7 ): 727 – 735 . [DOI] [PMC free article] [PubMed] [Google Scholar]
- 7. Liebl H , Joseph G , Nevitt MC , et al . Early T2 changes predict onset of radiographic knee osteoarthritis: data from the osteoarthritis initiative . Ann Rheum Dis 2015. ; 74 ( 7 ): 1353 – 1359 . [DOI] [PMC free article] [PubMed] [Google Scholar]
- 8. Nishioka H , Nakamura E , Hirose J , Okamoto N , Yamabe S , Mizuta H . MRI T1ρ and T2 mapping for the assessment of articular cartilage changes in patients with medial knee osteoarthritis after hemicallotasis osteotomy . Bone Joint Res 2016. ; 5 ( 7 ): 294 – 300 . [DOI] [PMC free article] [PubMed] [Google Scholar]
- 9. Theologis AA , Schairer WW , Carballido-Gamio J , Majumdar S , Li X , Ma CB . Longitudinal analysis of T1ρ and T2 quantitative MRI of knee cartilage laminar organization following microfracture surgery . Knee 2012. ; 19 ( 5 ): 652 – 657 . [DOI] [PMC free article] [PubMed] [Google Scholar]
- 10. Welsch GH , Mamisch TC , Domayer SE , et al . Cartilage T2 assessment at 3-T MR imaging: in vivo differentiation of normal hyaline cartilage from reparative tissue after two cartilage repair procedures--initial experience . Radiology 2008. ; 247 ( 1 ): 154 – 161 . [DOI] [PubMed] [Google Scholar]
- 11. Holtzman DJ , Theologis AA , Carballido-Gamio J , Majumdar S , Li X , Benjamin C . T(1ρ) and T(2) quantitative magnetic resonance imaging analysis of cartilage regeneration following microfracture and mosaicplasty cartilage resurfacing procedures . J Magn Reson Imaging 2010. ; 32 ( 4 ): 914 – 923 . [DOI] [PMC free article] [PubMed] [Google Scholar]
- 12. Link TM . Editorial comment: the future of compositional MRI for cartilage . Eur Radiol 2018. ; 28 ( 7 ): 2872 – 2873 . [DOI] [PMC free article] [PubMed] [Google Scholar]
- 13. Roemer FW , Kijowski R , Guermazi A . Editorial: from theory to practice - the challenges of compositional MRI in osteoarthritis research . Osteoarthritis Cartilage 2017. ; 25 ( 12 ): 1923 – 1925 . [DOI] [PubMed] [Google Scholar]
- 14. Hayashi D , Li X , Murakami AM , Roemer FW , Trattnig S , Guermazi A . Understanding Magnetic Resonance Imaging of Knee Cartilage Repair: A Focus on Clinical Relevance . Cartilage 2018. ; 9 ( 3 ): 223 – 236 . [DOI] [PMC free article] [PubMed] [Google Scholar]
- 15. Jackson EF . Quantitative Imaging: The Translation from Research Tool to Clinical Practice . Radiology 2018. ; 286 ( 2 ): 499 – 501 . [DOI] [PubMed] [Google Scholar]
- 16.Quantitative Imaging Biomarkers Alliance Web site. https://www.rsna.org/en/research/quantitative-imaging-biomarkers-alliance. Accessed August 13, 2021.
- 17. Pedoia V , Lee J , Norman B , Link TM , Majumdar S . Diagnosing osteoarthritis from T2 maps using deep learning: an analysis of the entire Osteoarthritis Initiative baseline cohort . Osteoarthritis Cartilage 2019. ; 27 ( 7 ): 1002 – 1010 . [DOI] [PMC free article] [PubMed] [Google Scholar]
- 18. Hunter DJ , Schofield D , Callander E . The individual and socioeconomic impact of osteoarthritis . Nat Rev Rheumatol 2014. ; 10 ( 7 ): 437 – 441 . [DOI] [PubMed] [Google Scholar]
- 19. Kellgren JH , Lawrence JS . Radiological assessment of osteo-arthrosis . Ann Rheum Dis 1957. ; 16 ( 4 ): 494 – 502 . [DOI] [PMC free article] [PubMed] [Google Scholar]
- 20. Marinetti A , Tessarolo F , Ventura L , et al . Morphological MRI of knee cartilage: repeatability and reproducibility of damage evaluation and correlation with gross pathology examination . Eur Radiol 2020. ; 30 ( 6 ): 3226 – 3235 . [DOI] [PubMed] [Google Scholar]
- 21. David-Vaudey E , Ghosh S , Ries M , Majumdar S . T2 relaxation time measurements in osteoarthritis . Magn Reson Imaging 2004. ; 22 ( 5 ): 673 – 682 . [DOI] [PubMed] [Google Scholar]
- 22. Regatte RR , Akella SV , Lonner JH , Kneeland JB , Reddy R . T1rho relaxation mapping in human osteoarthritis (OA) cartilage: comparison of T1rho with T2 . J Magn Reson Imaging 2006. ; 23 ( 4 ): 547 – 553 . [DOI] [PubMed] [Google Scholar]
- 23. Mosher TJ , Zhang Z , Reddy R , et al . Knee articular cartilage damage in osteoarthritis: analysis of MR image biomarker reproducibility in ACRIN-PA 4001 multicenter trial . Radiology 2011. ; 258 ( 3 ): 832 – 842 . [DOI] [PMC free article] [PubMed] [Google Scholar]
- 24. Stehling C , Baum T , Mueller-Hoecker C , et al . A novel fast knee cartilage segmentation technique for T2 measurements at MR imaging--data from the Osteoarthritis Initiative . Osteoarthritis Cartilage 2011. ; 19 ( 8 ): 984 – 989 . [DOI] [PMC free article] [PubMed] [Google Scholar]
- 25. Schneider E , Nessaiver M . The Osteoarthritis Initiative (OAI) magnetic resonance imaging quality assurance update . Osteoarthritis Cartilage 2013. ; 21 ( 1 ): 110 – 116 . [DOI] [PMC free article] [PubMed] [Google Scholar]
- 26. Williams AA , Titchenal MR , Do BH , Guha A , Chu CR . MRI UTE-T2* shows high incidence of cartilage subsurface matrix changes 2 years after ACL reconstruction . J Orthop Res 2019. ; 37 ( 2 ): 370 – 377 . [DOI] [PMC free article] [PubMed] [Google Scholar]
- 27. Li X , Pedoia V , Kumar D , et al . Cartilage T1ρ and T2 relaxation times: longitudinal reproducibility and variations using different coils, MR systems and sites . Osteoarthritis Cartilage 2015. ; 23 ( 12 ): 2214 – 2223 . [DOI] [PMC free article] [PubMed] [Google Scholar]
- 28. Wheaton AJ , Dodge GR , Borthakur A , Kneeland JB , Schumacher HR , Reddy R . Detection of changes in articular cartilage proteoglycan by T(1rho) magnetic resonance imaging . J Orthop Res 2005. ; 23 ( 1 ): 102 – 108 . [DOI] [PMC free article] [PubMed] [Google Scholar]
- 29. Li X , Cheng J , Lin K , et al . Quantitative MRI using T1ρ and T2 in human osteoarthritic cartilage specimens: correlation with biochemical measurements and histology . Magn Reson Imaging 2011. ; 29 ( 3 ): 324 – 334 . [DOI] [PMC free article] [PubMed] [Google Scholar]
- 30. Jordan CD , McWalter EJ , Monu UD , et al . Variability of CubeQuant T1ρ, quantitative DESS T2, and cones sodium MRI in knee cartilage . Osteoarthritis Cartilage 2014. ; 22 ( 10 ): 1559 – 1567 . [DOI] [PMC free article] [PubMed] [Google Scholar]
- 31. Williams A , Gillis A , McKenzie C , et al . Glycosaminoglycan distribution in cartilage as determined by delayed gadolinium-enhanced MRI of cartilage (dGEMRIC): potential clinical applications . AJR Am J Roentgenol 2004. ; 182 ( 1 ): 167 – 172 . [DOI] [PubMed] [Google Scholar]
- 32. Bashir A , Gray ML , Hartke J , Burstein D . Nondestructive imaging of human cartilage glycosaminoglycan concentration by MRI . Magn Reson Med 1999. ; 41 ( 5 ): 857 – 865 . [DOI] [PubMed] [Google Scholar]
- 33. Shapiro EM , Borthakur A , Gougoutas A , Reddy R . 23Na MRI accurately measures fixed charge density in articular cartilage . Magn Reson Med 2002. ; 47 ( 2 ): 284 – 291 . [DOI] [PMC free article] [PubMed] [Google Scholar]
- 34. Schmitt B , Zbýn S , Stelzeneder D , et al . Cartilage quality assessment by using glycosaminoglycan chemical exchange saturation transfer and (23)Na MR imaging at 7 T . Radiology 2011. ; 260 ( 1 ): 257 – 264 . [DOI] [PubMed] [Google Scholar]
- 35. Krusche-Mandl I , Schmitt B , Zak L , et al . Long-term results 8 years after autologous osteochondral transplantation: 7 T gagCEST and sodium magnetic resonance imaging with morphological and clinical correlation . Osteoarthritis Cartilage 2012. ; 20 ( 5 ): 357 – 363 . [DOI] [PubMed] [Google Scholar]
- 36. Raya JG . Techniques and applications of in vivo diffusion imaging of articular cartilage . J Magn Reson Imaging 2015. ; 41 ( 6 ): 1487 – 1504 . [DOI] [PMC free article] [PubMed] [Google Scholar]
- 37. Raya JG , Melkus G , Adam-Neumair S , et al . Diffusion-tensor imaging of human articular cartilage specimens with early signs of cartilage damage . Radiology 2013. ; 266 ( 3 ): 831 – 841 . [DOI] [PubMed] [Google Scholar]
- 38. Link TM , Neumann J , Li X . Prestructural cartilage assessment using MRI . J Magn Reson Imaging 2017. ; 45 ( 4 ): 949 – 965 . [DOI] [PubMed] [Google Scholar]
- 39. Kim J , Mamoto K , Lartey R , et al . Multi-vendor multi-site T1ρ and T2 quantification of knee cartilage . Osteoarthritis Cartilage 2020. ; 28 ( 12 ): 1539 – 1550 . [DOI] [PMC free article] [PubMed] [Google Scholar]
- 40. Li X , Wyatt C , Rivoire J , et al . Simultaneous acquisition of T1ρ and T2 quantification in knee cartilage: repeatability and diurnal variation . J Magn Reson Imaging 2014. ; 39 ( 5 ): 1287 – 1293 . [DOI] [PMC free article] [PubMed] [Google Scholar]
- 41. Glaser C , Mendlik T , Dinges J , et al . Global and regional reproducibility of T2 relaxation time measurements in human patellar cartilage . Magn Reson Med 2006. ; 56 ( 3 ): 527 – 534 . [DOI] [PubMed] [Google Scholar]
- 42. Li X , Han ET , Busse RF , Majumdar S . In vivo T(1rho) mapping in cartilage using 3D magnetization-prepared angle-modulated partitioned k-space spoiled gradient echo snapshots (3D MAPSS) . Magn Reson Med 2008. ; 59 ( 2 ): 298 – 307 . [DOI] [PMC free article] [PubMed] [Google Scholar]
- 43. Collins AT , Kulvaranon ML , Cutcliffe HC , et al . Obesity alters the in vivo mechanical response and biochemical properties of cartilage as measured by MRI . Arthritis Res Ther 2018. ; 20 ( 1 ): 232 . [DOI] [PMC free article] [PubMed] [Google Scholar]
- 44. Knox J , Pedoia V , Wang A , et al . Longitudinal changes in MR T1ρ/T2 signal of meniscus and its association with cartilage T1p/T2 in ACL-injured patients . Osteoarthritis Cartilage 2018. ; 26 ( 5 ): 689 – 696 . [DOI] [PMC free article] [PubMed] [Google Scholar]
- 45. Taylor KA , Collins AT , Heckelman LN , et al . Activities of daily living influence tibial cartilage T1rho relaxation times . J Biomech 2019. ; 82 ( 228 ): 233 . [DOI] [PMC free article] [PubMed] [Google Scholar]
- 46. Kumar D , Souza RB , Singh J , et al . Physical activity and spatial differences in medial knee T1rho and t2 relaxation times in knee osteoarthritis . J Orthop Sports Phys Ther 2014. ; 44 ( 12 ): 964 – 972 . [DOI] [PMC free article] [PubMed] [Google Scholar]
- 47. Luke AC , Stehling C , Stahl R , et al . High-field magnetic resonance imaging assessment of articular cartilage before and after marathon running: does long-distance running lead to cartilage damage? Am J Sports Med 2010. ; 38 ( 11 ): 2273 – 2280 . [DOI] [PubMed] [Google Scholar]
- 48. Wirth W , Nevitt M , Hellio Le Graverand MP , et al . Sensitivity to change of cartilage morphometry using coronal FLASH, sagittal DESS, and coronal MPR DESS protocols--comparative data from the Osteoarthritis Initiative (OAI) . Osteoarthritis Cartilage 2010. ; 18 ( 4 ): 547 – 554 . [DOI] [PMC free article] [PubMed] [Google Scholar]
- 49. Jungmann PM , Gersing AS , Baumann F , et al . Cartilage repair surgery prevents progression of knee degeneration . Knee Surg Sports Traumatol Arthrosc 2019. ; 27 ( 9 ): 3001 – 3013 . [DOI] [PubMed] [Google Scholar]
- 50. Balamoody S , Williams TG , Wolstenholme C , et al . Magnetic resonance transverse relaxation time T2 of knee cartilage in osteoarthritis at 3-T: a cross-sectional multicentre, multivendor reproducibility study . Skeletal Radiol 2013. ; 42 ( 4 ): 511 – 520 . [DOI] [PubMed] [Google Scholar]
- 51. Maier CF , Tan SG , Hariharan H , Potter HG . T2 quantitation of articular cartilage at 1.5 T . J Magn Reson Imaging 2003. ; 17 ( 3 ): 358 – 364 . [DOI] [PubMed] [Google Scholar]
- 52. Chen CA , Kijowski R , Shapiro LM , et al . Cartilage morphology at 3.0T: assessment of three-dimensional magnetic resonance imaging techniques . J Magn Reson Imaging 2010. ; 32 ( 1 ): 173 – 183 . [DOI] [PMC free article] [PubMed] [Google Scholar]
- 53. Eckstein F , Ateshian G , Burgkart R , et al . Proposal for a nomenclature for magnetic resonance imaging based measures of articular cartilage in osteoarthritis . Osteoarthritis Cartilage 2006. ; 14 ( 10 ): 974 – 983 . [DOI] [PubMed] [Google Scholar]
- 54. Kretzschmar M , Nevitt MC , Schwaiger BJ , Joseph GB , McCulloch CE , Link TM . Spatial distribution and temporal progression of T2 relaxation time values in knee cartilage prior to the onset of cartilage lesions - data from the Osteoarthritis Initiative (OAI) . Osteoarthritis Cartilage 2019. ; 27 ( 5 ): 737 – 745 . [DOI] [PMC free article] [PubMed] [Google Scholar]
- 55. Pedoia V , Su F , Amano K , et al . Analysis of the articular cartilage T1ρ and T2 relaxation times changes after ACL reconstruction in injured and contralateral knees and relationships with bone shape . J Orthop Res 2017. ; 35 ( 3 ): 707 – 717 . [DOI] [PMC free article] [PubMed] [Google Scholar]
- 56. Joseph GB , McCulloch CE , Nevitt MC , et al . A reference database of cartilage 3 T MRI T2 values in knees without diagnostic evidence of cartilage degeneration: data from the osteoarthritis initiative . Osteoarthritis Cartilage 2015. ; 23 ( 6 ): 897 – 905 . [DOI] [PMC free article] [PubMed] [Google Scholar]
- 57. Peterfy CG , Schneider E , Nevitt M . The osteoarthritis initiative: report on the design rationale for the magnetic resonance imaging protocol for the knee . Osteoarthritis Cartilage 2008. ; 16 ( 12 ): 1433 – 1441 . [DOI] [PMC free article] [PubMed] [Google Scholar]
- 58. Zhou Z , Zhao G , Kijowski R , Liu F . Deep convolutional neural network for segmentation of knee joint anatomy . Magn Reson Med 2018. ; 80 ( 6 ): 2759 – 2770 . [DOI] [PMC free article] [PubMed] [Google Scholar]
- 59. Pedoia V , Li X , Su F , Calixto N , Majumdar S . Fully automatic analysis of the knee articular cartilage T1ρ relaxation time using voxel-based relaxometry . J Magn Reson Imaging 2016. ; 43 ( 4 ): 970 – 980 . [DOI] [PMC free article] [PubMed] [Google Scholar]
- 60. Liu F , Zhou Z , Samsonov A , et al . Deep Learning Approach for Evaluating Knee MR Images: Achieving High Diagnostic Performance for Cartilage Lesion Detection . Radiology 2018. ; 289 ( 1 ): 160 – 169 . [DOI] [PMC free article] [PubMed] [Google Scholar]
- 61. Zhang K , Lu W , Marziliano P . Automatic knee cartilage segmentation from multi-contrast MR images using support vector machine classification with spatial dependencies . Magn Reson Imaging 2013. ; 31 ( 10 ): 1731 – 1743 . [DOI] [PubMed] [Google Scholar]
- 62. Gaj S , Yang M , Nakamura K , Li X . Automated cartilage and meniscus segmentation of knee MRI with conditional generative adversarial networks . Magn Reson Med 2020. ; 84 ( 1 ): 437 – 449 . [DOI] [PubMed] [Google Scholar]
- 63. Liu F , Zhou Z , Jang H , Samsonov A , Zhao G , Kijowski R . Deep convolutional neural network and 3D deformable approach for tissue segmentation in musculoskeletal magnetic resonance imaging . Magn Reson Med 2018. ; 79 ( 4 ): 2379 – 2391 . [DOI] [PMC free article] [PubMed] [Google Scholar]
- 64. Norman B , Pedoia V , Majumdar S . Use of 2D U-Net Convolutional Neural Networks for Automated Cartilage and Meniscus Segmentation of Knee MR Imaging Data to Determine Relaxometry and Morphometry . Radiology 2018. ; 288 ( 1 ): 177 – 185 . [DOI] [PMC free article] [PubMed] [Google Scholar]
- 65. Kijowski R , Liu F , Caliva F , Pedoia V . Deep learning for lesion detection, progression, and prediction of musculoskeletal disease . J Magn Reson Imaging 2020. ; 52 ( 6 ): 1607 – 1619 . [DOI] [PMC free article] [PubMed] [Google Scholar]
- 66. Joseph GB , McCulloch CE , Nevitt MC , et al . Tool for osteoarthritis risk prediction (TOARP) over 8 years using baseline clinical data, X-ray, and MRI: Data from the osteoarthritis initiative . J Magn Reson Imaging 2018. ; 47 ( 6 ): 1517 – 1526 . [DOI] [PMC free article] [PubMed] [Google Scholar]
- 67. Obuchowski NA , Mozley PD , Matthews D , Buckler A , Bullen J , Jackson E . Statistical Considerations for Planning Clinical Trials with Quantitative Imaging Biomarkers . J Natl Cancer Inst 2019. ; 111 ( 1 ): 19 – 26 . [DOI] [PubMed] [Google Scholar]


