

Abstract
Coculture fermentation of Penicillium fuscum and P. camembertii/clavigerum yielded berkeleypenostatins A-G (1–7) as well as the previously reported berkeleylactones A-H, the known macrolide A26771B, citrinin and patulin. As was true with the berkeleylactones, there was no evidence of the berkeleypenostatins in either axenic culture. The structures were deduced from analyses of spectral data, and the absolute configuration of berkeleypenostatin A (1) was determined by single crystal X-ray crystallography. Berkeleypenostatin A (1) and E (5) inhibited migration of human pancreatic carcinoma cells (HPAF-II). Both compounds were tested by the NCI Developmental Therapeutics Program. In the NCI 60 Cell Five-Dose Screen, Berkeleypenostatin E (5) was the more active of the two, with 1–10 μM total growth inhibition (TGI) of all leukemia cell lines, as well as the majority of colon, CNS, melanoma, ovarian, prostate, renal, and breast cancer cell lines.
Microorganisms culled from both terrestrial and marine extreme environments have proven to be a good source of novel, bioactive compounds when grown in axenic culture.1–3 Our studies of the microbes isolated from the acidic, metal-rich waters of Berkeley Pit Lake have contributed to the library of compounds derived from terrestrial extremophilic fungi.3 For over twenty years we have used enzyme inhibition assays targeting matrix metalloproteinase-3 (MMP-3), caspase-1, and caspase-3 to guide the isolation of compounds that block epithelial mesenchymal transition,4–6 inflammation,7–9 and apoptosis,10–11 respectively, from pure cultures of these fungi.
For the past three years we have also examined the effects of fungal coculture on secondary metabolite production.12 Fungi and bacteria are able to synthesize a diverse array of small molecules, many of which exhibit potent biological activity. Recent advances in genome sequencing have shown that microorganisms have the potential to yield even more structurally diverse secondary metabolites.13 “Crosstalk” between microbes can activate silent gene clusters and lead to the formation of novel secondary metabolites.14
There have been few reports of the effects of fungal coculture on secondary metabolite production, as most coculture experiments examine the effects of fungal-bacterial interactions. In 2017 we reported the berkeleylactones which were produced exclusively in a coculture experiment with Penicillium camembertii/clavigerum and P. fuscum, two extremophilic fungi isolated from a Berkeley Pit surface water sample.12 In earlier studies, scientists had described the effects of coculture on the production and activity of secondary metabolites in several Aspergillus species.15 Although no novel chemistry was reported, the effects of interspecies competition on the production of known bioactive secondary metabolites was compelling. In 2013, Bionectria ochroleuca was shown to produce 4″-hydroxysulfoxy-2,2″-dimethylthielavin when cocultured with Trichophyton rubrum on solid agar.16 Cocultivation of Penicillium sp. Ma(M3)V and Trichoderma sp. Gc(M2)1 yielded the polyketides, (Z)-2-ethylhex-2-enedioic acid and (E)-4-oxo-2-propylideneoct-7-enoic acid.17 The following year, in two separate studies, the mangrove fungi Phomopsis sp. K38 and Alternaria sp. E33 produced cyclo (L-leucyl-trans-4-hydroxy-L-prolyl-D-leucyl-trans-4-hydroxy-L-proline)18 and the antifungal tetrapeptides cyclo (gly-L-phe-L-pro-L-tyr) and cyclo (D-pro-L-tyr-L-pro-L-tyr).19
In 2017, cocultivation of two plant-associated Trichoderma sp. yielded harziaphilic acid,20 while coculture of the mollusk-associated fungi Chaunopycnis sp. and Trichoderma hamatum produced chaunopyran A and methyl pyridoxatin.21 In 2018, scientists described an elegant metabolomics approach to the dynamics of metabolite induction in fungal cocultures at both volatile and non-volatile levels. Although the compounds reported were known, the approach was interesting and has the potential to yield novel chemistry.22 In 2019, scientists isolated five new secondary metabolites, including phexandiols A and B, from cocultivation of the endophytic fungus Phoma sp. from Gastrodia elata, a saprophytic orchid used in Chinese traditional medicine, and an Armillaria sp.23 And finally, in 2020, scientists reported the isolation and characterization of talarodone A from Talaromyces pinophilus and Paraphaeosphaeria sp., two soil fungi isolated from Japan.24
Results and Discussion
The berkeleypenostatins were isolated from the same coculture experiment that yielded the berkeleylactones. As described previously, P. camembertii/clavigerum and P. fuscum were grown as axenic cultures and in coculture, and then extracted with CHCl3 at time of harvest. When the 1H NMR spectra of all three CHCl3 extracts were compared, it was obvious that the coculture experiment contained unique compounds that were not apparent in either pure culture.12 One of these compounds, berkeleylactone A, exhibited potent antibiotic activity against multi-drug resistant Staphylococcus aureus. Given this initial success, we returned to the same coculture experiment to look for other compounds with similar activity. Consequently, we tested the crude CHCl3 extract of the coculture and all of the initial flash silica gel column fractions for antibiotic activity. As expected, the fractions that contained the berkeleylactones exhibited potent activity against S. aureus. However, some of the more polar column fractions also exhibited moderate antibiotic activity, which guided the isolation of the berkeleypenostatins, which are described here.

The molecular formula of compound 1 was established as C29H42O10 by HRESIMS, with nine sites of unsaturation. 13C NMR spectral data (MeOH-d4, Table 1) indicated the presence of ketone (δc 203.3) and ester carbonyl carbons (δc 170.9), two oxygen-bearing carbons (δc 91.6, 84.5), as well as two double bonds (δc 137.5, 137.3, 131.1, 121.4). These data indicated that compound 1 was pentacyclic.
Table 1.
1H and 13C NMR spectral data of berkeleypenostatin A (1) in MeOH-d4 (125 MHza, 600 MHzb)
| carbon | δc, typea | δH, mult (J in Hz)b | HMBC correlations |
|---|---|---|---|
| 1 | 203.3, C | H-2α, H-2β | |
| 2α | 46.7, CH2 | 2.93, d (18.7) | H-4β |
| 2β | 2.67, d (18.7) | ||
| 3 | 91.6, C | H-2α, H-4α, H-8, H-6β | |
| 4α | 43.8, CH2 | 2.66, dd (16.7, 6.2) | H-6β |
| 4β | 2.14, dd (16.7, 9.3) | ||
| 5 | 80.4, CH | 4.72, dddd (9.3, 6.2, 6.1, 1.0) | H-1’, H-6β, H-4β |
| 6α | 38.8, CH2 | 1.83, ddd (13.6, 12.3, 6.1) | H-4α, H-7, H-8 |
| 6β | 2.45, ddd (13.6, 7.0, 1.0) | ||
| 7 | 49.4, CH | 2.54, dt (12.3, 7.0) | H-2α, H-2β, H-6α, H-6β |
| 8 | 41.1, CH | 2.64, bd (7.0) | H-6α, H-7 |
| 9 | 84.5, C | H-8 | |
| 10 | 121.4, CH | 5.59, bs | H-7, H-22 |
| 11 | 137.5, C | H-12, H-13, H-22 | |
| 12 | 80.8, CH | 4.67, bd (9.4) | H-10, H-14, H-22 |
| 13 | 131.1, CH | 6.03, dd (15.3, 9.4) | H-15 |
| 14 | 137.3, CH | 5.76, dt (15.3, 6.8) | H-12,H-13, H-15 |
| 15 | 33.3, CH2 | 2.13, m | H-13 |
| 16 | 30.4, CH2 | 1.44, bs | |
| 17 | 30.4, CH2 | 1.33, bs | |
| 18 | 30.3, CH2 | 1.32, bs | |
| 19 | 33.2, CH2 | 1.32, bs | |
| 20 | 23.0, CH2 | 1.32, bs | |
| 21 | 14.6, CH3 | 0.90, t (7.1) | H-19 |
| 22 | 20.4, CH3 | 1.60, bs | H-10 |
| 23 | 170.9, C | ||
| glucose | |||
| 1’ | 103.2, CH | 4.33, d (7.8) | H-2’ |
| 2’ | 75.2, CH | 3.14, bt (8.2) | H-1’, H-3’ |
| 3’ | 78.1, CH | 3.36, m | H-1’, H-2’, H-4’ or H- 5’ (3.27) |
| 4’ | 71.8, CH | 3.27, m | H-3’, H-6’ |
| 5’ | 78.1, CH | 3.27, m | H-6’ |
| 6’ | 62.9, CH2 | 3.87, bd (11.7) 3.66, dd (11.7, 4.6) | H-4’ or H-5’ (3.27) |
All assignments are based on COSY, HSQC and HMBC NMR experiments, J is in Hz
Analysis of HSQC and 1H NMR spectral data of compound 1 indicated that the double bonds were trans-disubstituted [δH 6.03 dd (J = 15.3, 9.4 Hz), 5.76 dt (J = 15.3, 6.8)] and trisubstituted [δH 5.59 bs], respectively. Although the 1H NMR spectrum (MeOH-d4, Table 1) was complex with several overlapping signals, analysis of 1H-1H-COSY (Figure S6) provided evidence of several isolated spin systems. Spin system A included eight carbons: CH2-CHO-CH2-CH-CH-CH=CCH3 [H2-4 (δH 2.66, 2.14), H-5 (δH 4.72), H2-6 (δH 1.83, 2.45), H-7 (δH 2.54), H-8 (δH 2.64), H-10 (δH 5.59), H3-22 (δH 1.60]. Spin system B: CHO-CH=CH-(CH2)6CH3 [H-12 (δH 4.67), H-13 (δH 6.03), H-14 (δH 5.76), H2-15 (δH 2.13), H2-16 (δH 1.44), H2-17 – H2-20 (δH 1.32–1.33), H3-21 (δH 0.90) constituted a terminal 2-decenyl moiety. Spin system C was a hexose moiety [H-1’ (δH 4.33), H-2’ (δH 3.14), H-3’ (δH 3.36), H-4’ (δH 3.27), H-5’ (δH −3.27), H2-6’ (3.87, 3.66), and spin system D was an isolated CH2 group [H2-2 (δH 2.93, 2.67)]. Comparison of the NMR spectral data of the hexose moiety with that of known compounds supported the assignment of β-D-glucose.25
Careful analysis of the HMBC spectrum (Figure S8) provided connectivity data for the hexose moiety, the 2-decenyl moiety, and the remaining tetracyclic component (Figure 1). The tetracyclic component, which accommodated thirteen carbons including the ketone and the ester, was assembled as follows: isolated spin system D [H2-2 (δH 2.93)] showed 2-bond coupling to both ketone C-1 (δc 203.3) and to oxygen bearing C-3 (δc 91.6), and 3-bond coupling to C-7 (δC 49.4). Both H-8 (δH 2.64) and H-6β (δH 2.45) showed long-range connectivity to C-3 and provided two additional points of connectivity between spin systems A and D.
Figure 1.
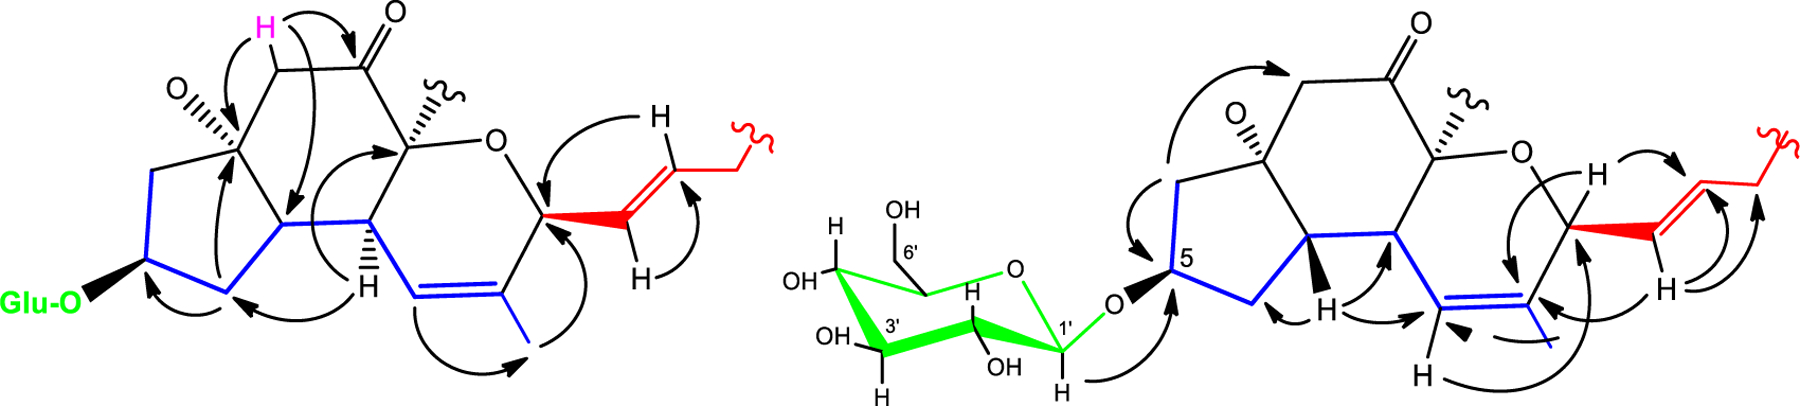
Selected HMBC correlations for berkeleypenostatin A (1). Spin systems A (blue), B (red), C (green), and D (pink) were established by 1H-1H-COSY.
Connectivity between spin systems A and B was established by HMBC correlations from olefinic H-10 (δH 5.59) to allylic methyl C-22 (δC 20.4) and oxygen-bearing methine C-12 (δC 80.8), as well as correlations from H-12 to C-11 (δC 137.5) and C-14 (δC 137.3). HMBC correlations from H-1’ to C-5 established the point of attachment of the glucose moiety. It remained to establish the final ring system and the position of the ester functionality. C-9 (δC 84.5) and oxygen-bearing C-3 (δC 91.6) were the logical and only remaining points of attachment, creating a bridge and the final ring of compound 1, as shown.
2D-NOESY, 1D-NOE, and 1H-1H-COSY experiments provided sufficient information to assign the relative configuration of 1. Glucose-bearing H-5 had NOE interactions to H-6α (δH 1.83), H-4α (δH 2.66), and to H-1’(δH 4.33). H-6α also correlated to H-8, consistent with a syn-relationship for these protons. NOE interactions between H-7 and H-2β (δH 2.67), H-4β (δH 2.14), H-6β (δH 2.45) and H-10 (δH 5.59), established their syn-relationships. Molecular modeling provided support for these assignments. The 3JHH between H-7 and H-8 was 7.0 Hz. Using either a standard Karplus equation or the Bothner-By equation,26 this was possible for a H-7-H-8 torsion angle of approximately 40° or 130°, which, according to optimized molecular models, required a trans-relationship between the two protons (actual value = 131°). The structure was confirmed and the absolute configuration of 1 was determined by single crystal X-ray crystallography (Figure 2).
Figure 2.
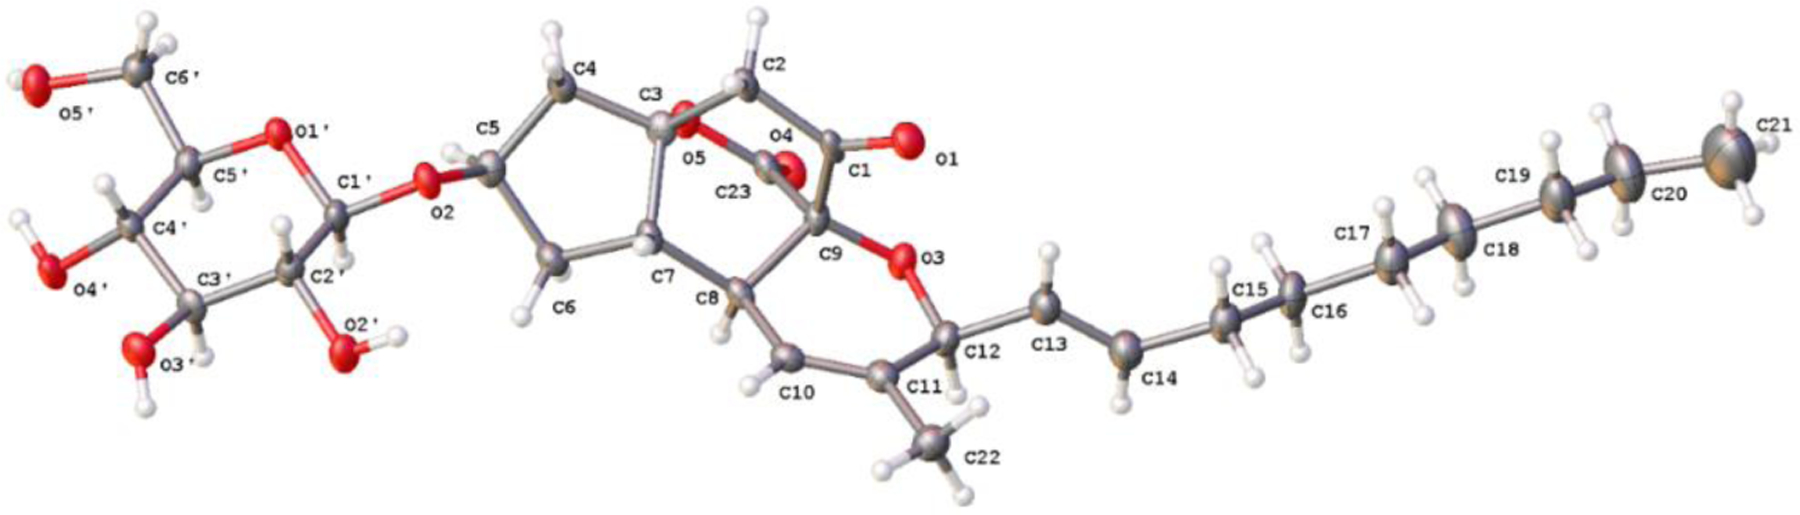
X-ray structure of berkeleypenostatin A (1).
The tetracyclic ring system of compound 1 is similar to that of penostatin G (8) which was isolated from a Penicillium sp. associated with the marine green alga Enteromorpha intestinalis.27,28 Compound 1 and penostatin G (8) differ in oxidation levels at C-1, in the relative configurations at C-7, C-8 and C-12, and in the presence of a glucose moiety in compound 1. The original penostatins represented a unique skeletal system, so we named compound 1 berkeleypenostatin A to reflect this relationship.27–30
We ran molecular modeling (Spartan ‘06 ES) and molecular dynamic studies (Chem3D Pro) on compound 1, as well as on five in silico epimers of compound 1 that differed either at C-5, C-7, C-8, C-9 or C-12. These particular epimers were generated because previously reported penostatins showed variations at these positions.27–30 Specific torsion angles and atomic distances for compound 1 were closer to actual 1H-1H coupling constants and NOE data than any of the in silico epimers.
Cheminfo Multiplet Simulator31 and modified Karplus plots26 for five and six-membered rings were used to generate 1H NMR coupling patterns for direct comparison with actual NMR spectral data of specific protons from berkeleypenostatin A (1). This allowed us to assess these analyses on a well-characterized molecule in which the stereoconfiguration was supported by X-ray crystallography. We could then use this approach to assign the relative configurations of other berkeleypenostatins. This analytical scheme proved effective in assigning the stereoconfigurations of the berkchaetoazaphilones in 2015.3f A more detailed discussion of these analyses for specific protons can be found in the supporting information (Figures S49–S52).
The molecular formula of compound 2 was established as C23H32O5 from HRESIMS data, with eight sites of unsaturation. The molecular formulas of 1 and 2 differed by C6H10O5, which suggested the absence of a glucose moiety in 2, which was confirmed by comparison of NMR (Tables 1, 2 and 4) and HMBC spectral data of compounds 1 and 2 (Figures S8 and S14).
Table 2.
1H NMR spectral data of berkeleypenostatins 2–4 in MeOH-d4* or acetone-d6± (400 MHz)
| 2* | 3* | 3± | 4* | |
|---|---|---|---|---|
| position | δH, mult (J in Hz) | δH, mult (J in Hz) | δH, mult (J in Hz) | δH, mult (J in Hz) |
| 2α | 2.93 d (18.7) | 2.89, d (19.0) | 2.89, d (19.0) | 5.59, bs |
| 2β | 2.66, d (18.7) | 2.56, d (19.0) | 2.56, d (19.0) | |
| 4α | 2.61, dd (15.9, 6.8) | 2.38, m, 2H | 2.41, dd, (17.1, 9.2) | 2.65 m, 2H |
| 4β | 1.85, dd (15.9, 9.4) | 2.31, dd (17.1, 4.3) | ||
| 5 | 4.60, dddd (9.4, 6.8, 6.0, 1.7) | 4.58, m (9.39, 8.2, 7.0, 3.9) | 4.55, dddd (9.2, 8.2, 7.0, 4.3) | 4.51, bt |
| 6α | 1.93, ddd (13.4, 12.4, 6.0) | 2.72, m | 2.69, dt (13.0, 7.0) | 1.46, td (12.4, 4.6) |
| 6β | 2.20 ddd (13.4, 7.0, 1.7) | 1.80, td (12.5, 7.9) | 1.75, td (13.0, 8.2) | 2.56, m |
| 7 | 2.49, dt (12.4, 7.0) | 2.15, m | 2.18, ddd (13.0, 7.0, 6.7) | 3.27, m |
| 8 | 2.61, bd (7.0) | 2.70, m | 2.65, bdd (6.7, 4.2) | 2.90, bt (4.9) |
| 9 | ||||
| 10 | 5.58, bs | 5.55, bs | 5.55, bdd (4.2, 1.2) | 5.63, bd (6.3) |
| 12 | 4.67, bd (9.5) | 4.68, bd (9.1) | 4.63, bd (9.8) | 5.64, d (11.4) |
| 13 | 6.03, dd (15.0, 9.5) | 6.03, dd (15.3, 9.1) | 6.04, dd (15.4, 9.8) | 5.39, dd (11.4, 9.4) |
| 14 | 5.76, dt (15.0,6.7) | 5.76, dt (15.3, 6.7) | 5.74, dt (15.4, 6.9) | 2.72, dt (9.4, 8.0) |
| 15 | 2.12, m | 2.14, m | 2.13, m | 1.62, m |
| 16 | 1.43, bs | 1.44, bs | 1.44, bs | 1.28, m |
| 17 | 1.32, bs | 1.32, bs | 1.32, bs | 1.28, m |
| 18 | 1.32, bs | 1.32, bs | 1.32, bs | 1.28, m |
| 19 | 1.32, bs | 1.32, bs | 1.32, bs | 1.28, m |
| 20 | 1.32, bs | 1.32, bs | 1.32, bs | 1.28, m |
| 21 | 0.90, t (6.8) | 0.90, t (6.8) | 0.88, t (6.8) | 0.90, t (6.4) |
| 22 | 1.61, bs | 1.60, bs | 1.57, bs | 1.78, bs |
| glucose | ||||
| 1’ | 4.32, d (7.9) | 4.35, d (7.9) | 4.37, d (7.8) | |
| 2’ | 3.19, bt (7.9) | 3.19, bt (7.9) | 3.16, t (7.8) | |
| 3’ | 3.35, m | 3.35, m | 3.30, m | |
| 4’ | 3.30, m | 3.30, m | 3.30, m | |
| 5’ | 3.29, m | 3.29, m | 3.30, m | |
| 6’ | 3.87, bd (11.9) 3.67, dd (11.9, 5.1) |
3.87, bd (11.9) 3.67, dd (11.9, 5.1) |
3.87, d (11.7) 3.67, dd (11.7, 4.4) |
All assignments are based on COSY, HSQC and HMBC NMR experiments,
Table 4.
13C NMR spectral data of berkeleypenostatins 2–7 in MeOH-d4 (100 MHz)
| 2 | 3 | 4 | 5 | 6 | 7 | |
|---|---|---|---|---|---|---|
| carbon | δC, type | δC, type | δC, type | δC, type | δC, type | δC, type |
| 1 | 203.7, C | 203.2, C | 83.5, C | 195.5, C | 195.4, C | 198.7, C |
| 2 | 46.7, CH2 | 46.6, CH2 | 125.2, C | 120.7, CH | 120.7, CH | 121.4, CH |
| 3 | 91.8, C | 90.4, C | 147.9, C | 176.8, C | 175.3, C | 175.0, C |
| 4 | 45.4, CH2 | 42.5, CH2 | 39.0, CH2 | 41.6, CH2 | 41.3, CH2 | 41.2, CH2 |
| 5 | 73.1, CH | 78.2, CH | 80.8, CH | 79.4, CH | 78.9, CH | 79.1, CH |
| 6 | 42.1, CH2 | 39.2, CH2 | 41.0, CH2 | 37.5, CH2 | 37.0, CH2 | 36.7, CH2 |
| 7 | 49.6, CH | 50.0, CH | 50.1, CH | 47.8, CH | 47.5, CH | 46.4, CH |
| 8 | 41.2, CH | 41.5, CH | 51.8, CH | 46.7, CH | 46.8, CH | 46.5, CH |
| 9 | 84.4, C | 84.5, C | 213.4, C | 92.8, C | 92.9, C | 75.3, CH |
| 10 | 121.3, CH | 121.3, CH | 128.8, CH | 121.4, CH | 121.4, CH | 123.4, CH |
| 11 | 137.6, C | 137.6, C | 131.2, C | 135.4, C | 135.6, C | 137.2, C |
| 12 | 80.8, CH | 80.8, CH | 131.5, CH | 77.8, CH | 77.7, CH | 79.1, CH |
| 13 | 131.2, CH | 131.1, CH | 134.4, CH | 129.7, CH | 129.6, CH | 127.8, CH |
| 14 | 137.2, CH | 137.3, CH | 44.9, CH | 137.4, CH | 137.2, CH | 137.5, CH |
| 15 | 33.2, CH2 | 33.5, CH2 | 29.3, CH2 | 33.4, CH2 | 33.4, CH2 | 33.5, CH2 |
| 16 | 30.3, CH2 | 30.3, CH2 | 28.0, CH2 | 30.5, CH2 | 30.4, CH2 | 30.4, CH2 |
| 17 | 30.4, CH2 | 30.4, CH2 | 29.5, CH2 | 30.4, CH2 | 30.3, CH2 | 30.3, CH2 |
| 18 | 30.6, CH2 | 30.4, CH2 | 29.2, CH2 | 30.4, CH2 | 30.3, CH2 | 30.3, CH2 |
| 19 | 33.3, CH2 | 33.2, CH2 | 30.9, CH2 | 33.2, CH2 | 33.2, CH2 | 33.2, CH2 |
| 20 | 23.9, CH2 | 23.8, CH2 | 28.3, CH2 | 23.8, CH2 | 23.8, CH2 | 23.8, CH2 |
| 21 | 14.6, CH3 | 14.6, CH3 | 14.6, CH3 | 14.6, CH3 | 14.6, CH3 | 14.6, CH3 |
| 22 | 20.4, CH3 | 20.2, CH3 | 25.8, CH3 | 19.8, CH3 | 19.7, CH3 | 20.2, CH3 |
| 23 | 170.9, C | 171.0, C | ||||
| 1’ | 104.2, CH | 103.4, CH | 103.6, CH | 103.6, CH | 103.1, CH | |
| 2’ | 75.2, CH | 75.1, CH | 75.1, CH | 75.2, CH | 75.2, CH | |
| 3’ | 80.0, CH | 78.2, CH | 78.1, CH | 78.2, CH | 78.2, CH | |
| 4’ | 71.7, CH | 71.8, CH | 71.8, CH | 71.8, CH | 71.8, CH | |
| 5’ | 78.2, CH | 75.1, CH | 78.1, CH | 79.0, CH | 78.2, CH | |
| 6’ | 63.0, CH2 | 62.9, CH2 | 62.9, CH2 | 63.0, CH2 | 62.9, CH2 |
The small upfield shifts of both H-5 (δH 4.60 compared to δH 4.72) and C-5 (δc 73.1 compared to δc 80.4) of compound 2 relative to 1 were also consistent with this analysis. Comparison of coupling constants and NOE data with that of 1 helped determine both the structure and the configuration of compound 2. Of particular importance were the similarities in coupling constants between H-6α and H-7 (J = 12.3 Hz and J = 12.4 Hz, for 1 and 2 respectively) which reflected their trans-relationship, and between H-7 and H-8 (J = 7.0 Hz for both 1 and 2) which supported their trans-relationship.
Single frequency homonuclear decoupling experiments helped to deconvolute complex spectra and assign specific protons.32 For example, irradiation of H-7 (δH 2.49) resulted in the collapse of H-6β to a doublet of doublets (J = 13.4, 1.7 Hz), confirming that 3JHH of H-7-H-6β was 7.0 Hz, consistent with compound 1. All of these data were consistent with the structure of compound 2, berkeleypenostatin B, as shown.
The molecular formula of compound 3 was established as C29H42O10 from HRESIMS data, and was isomeric with 1. The NMR spectral data of 3 and 1 were similar, although H-7 showed an upfield shift to δH 2.15 in compound 3, from δH 2.54 in compound 1 (Tables 1 and 2), without a similar upfield shift in the 13C NMR spectrum (Table 4). Analysis of 1H-1H COSY and HMBC spectral data (Figures S17 and S18) suggested a tetracyclic ring system similar to that of compound 1. The differences in NMR spectral data were attributed to differences in stereoconfiguration, particularly that of C-7 and C-8, rather than connectivity.
Unfortunately, several key resonances overlapped in the 1H NMR spectrum when run in MeOH-d4, so 1H NMR and 2D-NOESY experiments were also conducted using acetone-d6 to establish the stereoconfiguration of compound 3 (Figures S21–22). 3JHH for H-7 and H-8 was 6.7 Hz, with a torsion angle of 132°. Using the same analysis applied to compound 1, this suggested H-7-H-8 had a trans-relationship.26 Molecular modeling studies showed that torsion angles for either H-7α-H-8α or H-7β-H-8β (cis-relationships) would be 9.5° or 3.7°, respectively, with 3JHH values closer to 10 Hz.26 However, these two positions must therefore be epimeric with compound 1 (H-7α, H-8β), otherwise 1 and 3 would be identical compounds.
2D-NOESY data (acetone-d6), showed correlations between H-6α (δH 2.69) and both H-7 (δH 2.18) and H-5 (δH 4.55), while H-5 had an additional NOE correlation to H-4α (δH 2.41). These data indicated that all four protons were on the same side of the ring system, as is further evidenced by analysis of the coupling pattern of H-7, ddd (J = 13.0, 7.0, 6.7 Hz). (Figures S50–51).
Single frequency decoupling experiments were also useful in establishing specific assignments for compound 3. When H-5 was irradiated, H-6β [δH 1.75, td (J = 13.0, 8.2 Hz)] collapsed to a triplet (J = 13.0). H-6β retained its geminal coupling (13 Hz) to H-6α as well as its large Jtrans to H-7 (13 Hz), appropriate for a torsion angle of 161°.26 When H-6β was irradiated, H-7 collapsed from a ddd to a dd (J = 7.0, 6.7 Hz). These data, as well as the upfield chemical shift of H-7, suggested that compound 3 had the same stereoconfiguration as penostatin G (8).28 This established the structure of 3, berkeleypenostatin C, as the C-7-C-8 epimer of berkeleypenostatin A (1).
The molecular formula of 4 was C28H42O8, with eight sites of unsaturation, established by HRESIMS, which showed a loss of CO2 compared to compounds 1 and 3. 13C NMR data confirmed the presence of a glucose moiety as well as a ketone (δc 213.4), and two tri-substituted double bonds. 1H-1H COSY data also showed the presence of cis-double bond H-12-H-13 [δH 5.64, d (J = 11.5 Hz); δH 5.39, dd (J = 11.4, 9.4)], which was coupled to methine H-14 [δH 2.72, dt (J = 9.4, 8.0 Hz)], which was further coupled to a heptyl side chain (Tables 2 and 4). This was in stark contrast to compounds 1-3 which included a trans-double bond that was part of a decenyl moiety.
HMBC correlations supported these assignments (Figure S27). Olefin H-12 had correlations to C-14, as well as to olefin C-10 (δC 128.8) and methyl C-22 (δC 25.8), indicating that C10-C11 and C12-C13 were conjugated. 1H-1H COSY data (Figure S25) showed that H-10 was scalar coupled to H-8 [bt, 2.90 (J = 4.9)] and was part of a spin system that also included H-7 through H2-4. These data suggested that 4, berkeleypenostatin D, had a different skeleton than that of 1-3, but was similar to penostatin I (9).28
Compound 4 was isolated from a sample of compound 1 that had been dissolved in DMSO-d6. After the solvent was removed by heating the sample under vacuum, we found that the sample had degraded. HPLC purification yielded pure compound 1 as well compound 4, which appears to be a rearrangement product. A proposed route for this conversion, which includes a Claisen rearrangement, is shown in Figure 3. It has also been proposed elsewhere that both penostatin I (9) and F are actually conversion products of penostatins A (10) and B respectively.33
Figure 3.

Proposed Claisen rearrangement of berkeleypenostatin A (1) to generate compound 4.
The molecular formula of compound 5 was established as C28H42O9 from the HRESIMS peak at 545.2705 [M+Na]+, with eight sites of unsaturation. This formula indicated a loss of CO and one site of unsaturation compared to berkeleypenostatin A (1). NMR spectral data (Tables 3 and 4), including 1H-1H-COSY correlations (Figure S30), indicated that the tricyclic ring system, the glucose moiety and the C-12-C-21 side chain of compounds 1–3 were intact. The most obvious differences gleaned from the 13C NMR spectrum were the absence of the β-ketoester functionality (C-23) and the addition of a tri-substituted double bond (δC 120.7 and δC 176.8, respectively). In compound 5, ketone C-1 resonated at δC 195.5, unlike compounds 1–3 (δC 203), which suggested α,β-unsaturation and a logical position for the new double bond.
Table 3.
1H NMR spectral data of berkeleypenostatins 5–7 in MeOH-d4 (400 MHz)
| 5 | 6 | 7 | |
|---|---|---|---|
| position | δH, mult (J in Hz) | δH, mult (J in Hz) | δH, mult (J in Hz) |
| 2 | 5.99, bd (1.7) | 5.98, dd (2.1, 1.8) | 5.91, bs |
| 4α | 3.00, d (20.0) | 2.70, ddt (19.0, 6.8, 2.1) | 2.89, bs, 2H |
| 4β | 2.91, bdd (20.0, 4.6) | 3.05, dd (19.0, 7.5, 1.8) | |
| 5 | 4.56, td (4.6, 1.3) | 4.51, dddd (7.7, 7.5, 7.3, 6.8) | 4.60, m |
| 6α | 1.55, td (13.6, 4.6) | 1.62, m | 1.50, td (12.7, 4.7) |
| 6β | 2.47, dd (13.6,7.0) | 2.53, ddd (12.4, 7.3, 6.1) | 2.55, dd (12.7,6.9) |
| 7 | 2.99, ddd (13.6, 10.3, 7.0) | 2.62, ddd (12.0, 10.0, 6.1) | 2.92, m |
| 8 | 2.15, dd (10.3, 6.1) | 2.27, dd (10.0, 6.1) | 2.34, bt (11.5) |
| 9 | 4.10, d (11.5) | ||
| 10 | 5.71, bd (6.1) | 5.73, bd (6.1) | 5.66, bs |
| 12 | 4.61, d (8.8) | 4.61, bd (8.5) | 4.55, bd (6.6) |
| 13 | 5.36, dd (15.2, 8.8) | 5.34, dd (15.1, 8.5) | 5.61, dd (15.5, 6.6) |
| 14 | 5.76, dt (15.2, 6.8) | 5.76, dt (15.1, 6.7) | 5.74, dt (15.5, 6.8) |
| 15 | 2.07, bq (6.8) | 2.06, q (6.7) | 2.10, q (6.8) |
| 16 | 1.44, bs | 1.42, bs | 1.42, bs |
| 17 | 1.32, bs | 1.32, bs | 1.32, bs |
| 18 | 1.32, bs | 1.32, bs | 1.32, bs |
| 19 | 1.32, bs | 1.32, bs | 1.32, bs |
| 20 | 1.32, bs | 1.32, bs | 1.32, bs |
| 21 | 0.90, t (7.0) | 0.90, t, (7.0) | 0.89, t (7.1) |
| 22 | 1.60, bs | 1.61, bs | 1.67, bs |
| glucose | |||
| 1’ | 4.37, d (7.8) | 4.37, d, (7.9) | 4.39, d (7.9) |
| 2’ | 3.15, bt (7.8) | 3.15, bt, (7.9) | 3.14, bt (7.9) |
| 3’ | 3.36, m | 3.34, m | 3.37, m |
| 4’ | 3.29, m | 3.30, m | 3.28 m |
| 5’ | 3.29, m | 3.27, m | 3.31 m |
| 6’ | 3.87, d (11.7) 3.67, dd (11.7, 4.5) |
3.88, bd (11.9) 3.66, dd (11.9, 5.0) |
3.88 bd (11.7) 3.66 dd (11.7, 5.4) |
All assignments are based on COSY, HSQC and HMBC experiments
Infrared spectral data supported this assignment as the ketone stretching frequency shifted from 1741cm−1 in compound 1 to 1671cm−1, typical of an α,β-unsaturated ketone in an unstrained ring system. HMBC data provided further evidence. H-5 (δH 4.56) showed correlations to olefinic C-3 (δC 176.8), C-7 (δC 47.8), and C-1’ (δC 103.6), which also supported the position of the olefin C2-C3 relative to the glucose moiety. H-10 (δH 5.71) showed 3-bond correlations to C-22 (δC 19.8) and to an oxygen-bearing carbon resonating at δC 92.8. Both H-2 (δH 5.99) and H-8 (δH 2.15) showed HMBC correlations to this same carbon, which supported its assignment as alcohol C-9.
2D-NOESY spectral data showed correlations between H-5 and both H-1’and H-6α, and between H-6α and H-8, which supported their mutually syn-relationships. The magnitude of the coupling between H-7 and H-8 (J = 9.2 Hz) indicated a trans-relationship, consistent with compounds 1 and 2. H-10 showed NOE correlations to both H-8 and H-6β that were not possible for any of the energy minimized in silico epimers generated for comparison.
All NMR experiments for compound 5 were also run in acetone-d6, which was particularly helpful in establishing the configuration of C-9 (Figures S34–37). A proton resonating at δH 5.03 in the 1H NMR spectrum showed no carbon correlation in the HSQC experiment, indicating that it was attached to a heteroatom (oxygen). HMBC data showed a clear correlation between this proton and both C-9 and C-8, establishing its identity as the hydroxy proton at C-9. 2D NOESY spectral data showed a correlation between the hydroxy proton and H-7. Collectively, these data could be accommodated by the structure proposed for 5, berkeleypenostatin E.
Compound 6 was isomeric with compound 5. Although the 13C NMR spectral data of these two compounds were almost identical (Table 4), in the 1 H NMR spectrum there were small differences in chemical shifts and 3 JHH values for H-4 through H-8 (Table 3). The most striking difference was the magnitude of the coupling constants for H-5. In compound 5, H-5 appeared as a triplet of doublets, whereas in compound 6, H-5 approximated a quintet, indicating a change in configuration at C-5. The two larger coupling constants associated with H-7 [δH 2.62, ddd, J = 12.0, 10.0, 6.1 Hz) indicated its trans-relationship to both H-8 and H-6α. Molecular modeling showed a H-6α-H-7 torsion angle of 168°, appropriate for a 3JHH value of 12 Hz, and the H-7-H-8 torsion angle was appropriate for a 3JHH value of 10 Hz. The coupling pattern for H-4α [2.70 (ddt, J = 19.0, 6.8, 2.1 Hz)] was particularly complex because it showed allylic coupling to H-2 and W-coupling to H-7.
2D NOESY spectral data showed correlations between H-7 and H-4β (δH 3.05), H-6β (δH 2.53), and H-5 (δH 4.51) indicating that all four protons were on the same side of the ring system. NOE correlations between H-10 (δH 5.73) and H-8 (δH 2.27) and H-6β (δH 2.53) also supported these assignments. These data were consistent with the structure of 6, berkeleypenostatin F as shown.
The molecular formula of compound 7 was established as C28H42O8 from HRESIMS data. Compound 7 had one less oxygen than either 5 or 6, with eight sites of unsaturation. 13C NMR spectral data (Table 4) showed that hydroxy-bearing C-9 of compounds 5 and 6 was replaced by a methine in compound 7, with an appropriate upfield chemical shift from δC 92.9 to δC 75.3. Methine H-8 (δH 2.34) was spin-coupled to both H-7 (δH 2.92) and H-9 (δH 4.10) with 3JHH values of 11.5 Hz, supporting a trans-relationship between H-8 and both H-7 and H-9. A 2D NOESY spectrum showed correlations between H-9 and both H-7 and H-13 (δH 4.55), which confirmed their mutually cis-relationship.
It was not possible to definitively assign H-4α or H-4β as the Δν of these two protons approached zero, and was therefore smaller than the expected geminal coupling (3JHH ≈ 19 Hz). However, the coupling pattern for H-6α reflected its trans-relationship to H-7 and its geminal relationship to H-6β. These data were consistent with the structure of compound 7, berkeleypenostatin G, as shown.
Production of Berkeleypenostatins in Coculture
Although 1H NMR spectroscopy was an effective tool in detecting the presence of the berkeleylactones in coculture,12 it was not effective in assessing berkeleypenostatin synthesis. The berkeleypenostatins were present in much lower concentrations in coculture than the berkeleylactones. We turned instead to liquid chromatography-mass spectrometry (LC-MS) using Agilent Mass Hunter Qualitative Analysis to compare the chloroform extracts of axenic cultures and coculture of P. fuscum (PW2A) and P. clavigerum/camembertii (PW2B) for the presence of the berkeleypenostatin A. Under these conditions, three peaks were diagnostic for the detection of berkeleypenostatin A in this analysis: m/z 551 [M+1]+; m/z 568 [M+18]+; and m/z 1118 [2M+18]+. These peaks were present exclusively in the crude CHCl3 extract of the fungal coculture but were not apparent in the axenic cultures of either fungus (Figure 4).
Figure 4.

Comparison of LC-MS spectral data of pure berkeleypenostatin A (1) with crude extracts of PW2A/PW2B coculture and axenic cultures of PW2A and PW2B. Under these conditions, three peaks were diagnostic for the detection of berkeleypenostatin A: m/z 551 [M+1]+; m/z 568 [M+18]+; and m/z 1118 [2M+18]+.
Biological Activity
The berkeleypenostatins were tested for antibiotic activity against a selection of Gram-positive and Gram-negative bacteria. Berkeleypenostatin E (5) exhibited the most potent antibiotic activity, with MIC values of 4–9 μg/mL against both wild type and multidrug-resistant Staphylococcus aureus, and 4 μg/mL against Bacillus anthracis. Berkeleypenostatin F (6), the C-5 epimer of 5, had MIC values of 17 – 33 μg/mL against the same bacteria. (Figures S53–54). In our hands, Ciprofloxacin had a MIC value of 0.064 μg/mL against B. anthracis.
The berkeleypenostatins were moderate inhibitors (50 – 100 μM) of MMP-3 (compound 4 was not tested), an enzyme that plays a key role in metastatic processes in tumor cells. Tumor cell migration and invasion are key characteristics that distinguish benign from malignant lesions. Up-regulated MMP-3 is an important promoter of epithelial mesenchymal transition which facilitates both cancer cell migration and movement across tissue boundaries.4–6 Berkeleypenostatin E (5) was the most potent inhibitor with an IC50 of 50 μM. Both 1 and 5 were submitted to the National Cancer Institute Developmental Therapeutics Program for evaluation against their panel of 60 human tumor cell lines (Figures S55–S56). Compound 5 was the more active of the two compounds with 1–10 μM total growth inhibition (TGI) of all leukemia cell lines, as well as the majority of colon, melanoma, CNS, ovarian, prostate, renal, and breast cancer cell lines in the NCI 60 Cell Five-Dose Screen.
Berkeleypenostatin A (1) and E (5) were also tested in the cell invasion and migration assays against HPAF-II (pancreatic epithelial cell carcinoma) (S59–60). Although neither compound was effective at reducing cell invasion, both compounds reduced cancer cell migration by 30% at a concentration of 1.25 μM over a 24-hour period. Untreated cancer cells were the control, and N-Isobutyl-N-(4-methoxyphenylsulfonyl) glycyl hydroxamic acid (NNGH), a potent MMP-3 inhibitor (1.25 μM), was used as the positive control (migration inhibitor).
Experimental Section
General Experimental Procedures.
Optical rotations were recorded on a Perkin-Elmer 241 MC Polarimeter using a 1.0 mL cell. IR spectra were recorded on a Perkin Elmer Spectrum One FT-IR spectrometer. Nuclear magnetic resonance (NMR) spectra (1D and 2D) were obtained with a VNMRS Varian 600 MHz, VNMRS Varian 500 MHz, or a Bruker Avance 400 MHz spectrometer. Chemical shift values (δ) were given in parts per million (ppm), and the coupling constants (J) were in Hz. All of the chemical shifts were recorded with respect to the deuterated solvent shift (CDCl3: δH 7.24 for the proton resonance and δC 77.0 for the carbon; MeOH-d4: δH 3.31 for the proton resonance and δC 49.1 for the carbon; acetone-d6: δH 2.05 for the proton resonance and δC 29.92 for the carbon). Mass spectrometry experiments (low and high resolution) were recorded on a Micromass LCT Premier XE Mass Spectrometer. Liquid chromatography/mass spectrometry experiments were run on Agilent 6520 Q-TOF-LC/MS using a Phenomenex Gemini NX-C18 column. The LC was run in a gradient mode from 50% CH3CN/H2O with 0.1% formic acid to 100% CH3CN over 12 minutes, then held at 100% CH3CN for 3 minutes. X-ray diffraction studies were run on a Bruker D8 Venture instrument. All solvents used were spectral grade or distilled prior to use.
Collection, Extraction, and Isolation Procedures.
The collection and isolation of Berkeley Pit fungi has previously been described.12 P. fuscum and P. camembertii/clavigerum34 were isolated from a surface water sample taken from the Berkeley Pit Lake. For the coculture experiment Penicillium camemberti was grown in pure culture in potato dextrose broth (3 flasks with 500 mL broth per flask). After 24 h, an agar cube (8mm3) impregnated with Penicillium fuscum was added to each flask and the resulting coculture was shaken for 6 additional days (200 rpm, room temperature). At time of harvest, MeOH (50 mL/flask) was added, the mycelia were removed by gravity filtration and the broth was extracted with CHCl3 (3 × 1L). The CHCl3 was removed in vacuo to yield 171 mg of crude extract.
The CHCl3 extract was fractionated by flash silica gel column chromatography using IPA-hexanes in a stepwise gradient system of increasing polarity, starting with 5% IPA to 100% IPA (10%, 20%, 50% IPA), followed by 100% MeOH. Fraction 3 yielded citrinin (4.6 mg), and fractions 6 and 7 were a mixture containing berkeleylactone A (40 mg). Fractions 10–13 (50% IPA-Hex) yielded a mixture of the berkeleypenostatins. These 4 fractions were recombined, and then further resolved using semi-preparative silica gel HPLC [Varian Dynamax Microsorb 100–5] in gradient mode from 30% IPA-hexanes to 100% IPA over 60 min to yield berkeleypenostatin B (2, 0.5 mg), berkeleypenostatin F (6, 2.3 mg), berkeleypenostatin E (5, 2.1 mg), berkeleypenostatin G (7, 0.8 mg), berkeleypenostatin A (1, 4.1 mg), and berkeleypenostatin C (3, 3.7 mg).
Berkeleypenostatin A (1):
colorless solid, [α]25D −28.9° (c 0.9, MeOH): IR (CHCl3) νmax 3409, 3014, 2929, 2857, 1781, 1746, 1669, 1437, 1359, 1280, 1078, 1022, 918cm−1; 1H NMR and 13C NMR see Table 1: HRESIMS m/z [M+Na]+ 573.2652 (calcd for C29H42O10Na, 573.2676).
Berkeleypenostatin B (2):
colorless oil, [α]25D 0.0° (c 0.2, MeOH): IR (CHCl3) νmax 3611, 3437, 3017, 2929, 2857, 1782, 1746, 1672, 1452, 1380, 1280, 1154, 1133, 1092, 972, 877cm−1; 1H NMR see Table 2; 13C NMR see Table 4: HRESIMS m/z [M+H]+ 389.2319 (calcd for C23H33O5, 389.2328).
Berkeleypenostatin C (3):
colorless oil, [α]25D 0.0° (c 0.1, CHCl3): IR (CHCl3) νmax 3401, 3015, 2929, 2857, 1780, 1745, 1447, 1280, 1078, 1038, 917 cm−1; 1H NMR see Table 2; 13C NMR see Table 4: HRESIMS m/z [M+Na]+ 573.2658 (calcd for C29H42O10Na, 573.2676).
Berkeleypenostatin D (4):
Rearrangement of berkeleypenostatin A (1): Compound 1 (16mg) was dissolved in DMSO-d6 and NMR data was collected. The solvent was removed by heating (35 °C) the sample under vacuum. A 1H NMR spectrum of the sample in MeOH-d4 showed significant degradation of the original material. HPLC of the sample using 5% MeOH/CHCl3 on Sigel gave pure 1 (10 mg) and a pure new compound 4 (2.1 mg). 1H NMR (400MHz, CDCl3) see Table 2; 13C NMR (100MHz, MeOH-d4) see Table 4; HRESIMS m/z [M+H]+ 507.2978 (calcd for C28H43O8, 507.2958).
Berkeleypenostatin E (5):
colorless oil, [α]25D 11.3° (c 1.2, MeOH): IR (CHCl3) νmax 3399, 3014, 2929, 2857, 1671, 1617, 1403, 1282, 1121, 1075, 1022, 840cm−1; 1H NMR see Table 3; 13C NMR see Table 4: HRESIMS m/z [M+Na]+ 545.2705 (calcd for C28H42O9Na, 545.2727).
Berkeleypenostatin F (6):
colorless oil, [α]25D 305° (c 0.6, MeOH): IR (CHCl3) νmax 3413, 3015, 2929, 2857, 1672, 1357, 1279, 1077, 1040, 841cm−1; 1H NMR see Table 3; 13C NMR see Table 3: HRESIMS m/z [M+Na]+ 545.2733 (calcd for C28H42O9Na, 545.2727).
Berkeleypenostatin G (7):
colorless oil, [α]25D 43.0° (c 0.4, MeOH): IR (CHCl3) νmax 3396, 3014, 2929, 2857, 1685, 1455, 1342, 1098, 1076, 1021, 899cm−1; 1H NMR see Table 2; 13C NMR see Table 4: HRESIMS m/z [M+H]+ 507.2977 (calcd for C28H43O8, 507.2958).
X-ray Diffraction Data for Berkeleypenostatin A (1).
Colorless rods of 1 were obtained by slow (3 months) evaporation of MeOH from a MeOH/H2O solution in the freezer (−20C). X-ray diffraction data for 1 were collected at 100 K on a Bruker D8 Venture using CuKα (λ = 1.54178). Data have been corrected for absorption using SADABS35 area detector absorption correction program. Using Olex236, the structure was solved with the SHELXT37 structure solution program using Direct Methods and refined with the SHELXL38 refinement package using least squares minimization. All non-hydrogen atoms were refined with anisotropic thermal parameters. Hydrogen atoms attached to heteroatoms were found from the residual density maps, placed, and refined with isotropic thermal parameters. All other hydrogen atoms in the investigated structure were located from difference Fourier maps but finally their positions were placed in geometrically calculated positions, and refined using a riding model. Isotropic thermal parameters of the placed hydrogen atoms were fixed to 1.2 times the U value of the atoms they are linked to (1.5 times for methyl groups). The absolute structure was determined by refinement of the Flack Parameter39, based on anomalous scattering, with a final Flack parameter of 0.05(6). Further analysis of the absolute structure was carried out using likelihood methods40 within PLATON.41 The results were a final Hooft parameter of 0.04(6). Calculations and refinement of structures were carried out using APEX242, SHELXTL43, and Olex2 software.
Crystallographic Data for Berkeleypenostatin A (1).
C29H42O10, monoclinic, space group P21 (no. 4), a = 18.8533(6), b = 7.0067(2), c = 21.3135(7), β = 98.1860(10), V = 2786.81(15), Z = 4, T = 100 K, μ(CuKα) = 0.814 mm−1, ρcalcd = 1.312 g ml−1, 2ϴmax = 103.818, 30217 reflections collected, 6177 unique (Rint = 0.0369, Rsigma = 0.0327), R1 = 0.0342 (I > 2σ(I)), wR2 = 0.0831 (all data), Flack Parameter = 0.05(6), Hooft parameter 0.04(6).
Signal Transduction Assays.
The signal transduction Drug Discovery Kits for the Matrix Metalloproteinase-3 (MMP-3) enzyme were purchased from Enzo Life Sciences, BML-AK400.
Antibiotic Testing.
Compounds 1 and 3–7 were tested against Gram-positive and Gram-negative bacteria as well as two Candida species (S53–54). Minimum inhibitory concentrations (MIC) were assessed for each bacterium in the assay series using a broth microdilution approach based on CLSI standards and the use of the colorimetric reporter Alamar Blue. Stock solutions of test compounds were made at 50 mM in DMSO. Serial two-fold dilutions of the stocks were prepared in test wells with a maximum concentration of 500 μM (test concentrations therefore being 500, 250, 125, 64, 32, 16, 8, 4, 2 and 1 μM etc.) MIC data were reported in μM and μg/mL to facilitate comparison to other literature data.12
Cell Migration and Invasion Assays for HPAF-II Cells
Cell Lines:
Human pancreatic carcinoma cells, (HPAF-II) were purchased from ATCC.
In Vitro Cytotoxicity Assay.
Cell cytotoxicity was measured using the Vybrant MTT Cell Proliferation Assay (ThermoFisher Scientific). Assay reagents were prepared according to manufacturer’s protocol. Cells were harvested using 0.25% trypsin/0.53 mM EDTA and cell viability was determined after harvesting. Neither compound was cytotoxic to the HPAF-II cells at concentrations up to 50 μM, and both compounds were tested in the migration and invasion assays at 1.25 μM. NNGH, N-Isobutyl-N-(4-methoxyphenylsulfonyl) glycyl hydroxamic acid, a potent MMP-3 inhibitor, was tested (12.5 μM and 125 μM) in duplicate. NNGH was used as a positive control in the cell migration and cell invasion assays.
FluoroBlok Cell Migration Kinetics Assay.
Cell migration was measured using the HTS Fluoroblok 96 well insert system (Corning). Cells were harvested at ~80% confluency, and viability was determined. The cells were resuspended (5 ×10⁵ cells/mL) in serum free DMEM medium. The resuspended cells were stained using CellTracker CMFDA Dye (ThermoFisher Scientific) according to manufacturer’s protocol. The inhibitor compounds, berkeleypenostatin A (1) and berkeleypenostatin E (5), were diluted to appropriate concentration (1.25 μM) with serum free DMEM medium. the concentration of inhibitor compounds with the HPAF-II cells was 1.25 μM.
Fluoroblok Cell Invasion Kinetics Assay.
Cell invasion was measured using the BioCoat Tumor Invasion System 96-Multiwell Format (8 μm pore size) coated with Matrigel Matrix (Corning). Cells were harvested and stained using procedure described above. Inhibitor compounds 1 and 5 were diluted in serum free DMEM medium in separate 96-well plate at a concentration of 1.25 μM for assay with HPAF-II cells. Both compounds were tested in triplicate. (Full experimental details in supporting information, S58-59).
Supplementary Material
Figure 5.

Cancer cell migration inhibition assay of compounds 1 and 5 (1.25 μM) with HPAF-II pancreatic cancer cells. NNGH was used as a positive control and untreated cancer cells were the control.
ACKNOWLEDGMENT
We thank NIH for the grants that supported this research: 1R15AI131161-01A1, P20GM103546 and 5P30NS055022. We also thank NSF grant #CHE-9977213 for acquisition of an NMR spectrometer and the M.J. Murdock Charitable Trust Reference #2015427:JAT:2/25/2016 for support of Apedaile’s work and Ref # 99009:JVZ:11/18/99 for acquisition of the mass spectrometer. The Macromolecular X-ray Diffraction Core Facility at the University of Montana was supported by a Centers of Biomedical Research Excellence grant from the National Institute of General Medical Sciences (P20GM103546) and by the National Science Foundation (NSF)-MRI (CHE-1337908).
Footnotes
Supporting Information. Experimental details including 1H NMR, 13C NMR, COSY, HSQC, 2D NOESY, and HMBC spectra for compounds 1 – 7, cancer cell line data from NCI-DTP for 1 and 5, and cell migration and invasion assay. The Supporting Information is available free of charge on the ACS Publications website at DOI: 10.1021/acs.jnatprod.1c00248
References and Notes
- 1.Giddings L-A; Newman DJ Bioactive Compounds from Terrestrial Extremophiles; In Springer Briefs in Microbiology; Extremophilic Bacteria; Tiquia-Arashiro SM.; Mormile M.Eds.; Springer; Heidelberg, 2015, pp. 6–61, 65–73. [Google Scholar]
- 2.Giddings L-A; Newman DJ Bioactive Compounds from Marine Extremophiles; In Springer Briefs in Microbiology; Extremophilic Bacteria; Tiquia-Arashiro SM.; Mormile M.Eds.; Springer; Heidelberg, 2015, pp. 4–39, 54–121. [Google Scholar]
- 3.Some of the previous reports of the isolation of secondary metabolites from Berkeley Pit fungi include;; (a) Stierle DB; Stierle AA; Patacini B; McIntyre K; Girtsman T; Bolstad EJ Nat. Prod 2011, 74, 2273–2277. [DOI] [PMC free article] [PubMed] [Google Scholar]; (b) Stierle AA; Stierle DB; Girtsman TJ Nat. Prod 2012, 75, 344–350. [DOI] [PMC free article] [PubMed] [Google Scholar]; (c) Stierle AA; Stierle DB In Studies in Natural Products Chemistry; Atta-Ur-Rahman, Ed.; Elsevier Science; Amsterdam, 2013; Vol. 39, pp 1–44. [Google Scholar]; (d) Stierle AA; Stierle DB; Mitman GG; Snyder S; Antczak C; Djaballah H Nat. Prod. Commun 2014, 9, 87–90. [PubMed] [Google Scholar]; (e) Stierle AA; Stierle DB Nat. Prod. Commun 2014, 9, 1037–1044. [PMC free article] [PubMed] [Google Scholar]; (f) Stierle AA; Stierle D; Girtsman T; Antczak C; Djaballah HJ Nat. Prod 2015, 78, 2917–2923. [DOI] [PMC free article] [PubMed] [Google Scholar]
- 4.Thiery JP; Acioque H; Huang RYJ; Nieto MA Cell 2009, 139, 871–890. [DOI] [PubMed] [Google Scholar]
- 5.Radisky DC; Levy DD; Littlepage LE; Hong Liu, Nelson CM; Fata JE; Leake D; Godden EL; Albertson DG; Nieto MA; Werb Z; Bissell MJ Nature 2005, 436, 123–127. [DOI] [PMC free article] [PubMed] [Google Scholar]
- 6.Comoglio PM; Trusolino L Nature Medicine 2005, 11, 1156–1159. [DOI] [PubMed] [Google Scholar]
- 7.Franchi L; Eigenbrod T; Muñoz-Planillo R; Nuñez G Nat. Immunol 2009, 10, 241–256. [DOI] [PMC free article] [PubMed] [Google Scholar]
- 8.Schlosser S; Gansauge F; Ramadani M; Beger H-G; Gansauge S FEBS Letters 2001, 491, 104–108. [DOI] [PubMed] [Google Scholar]
- 9.Coffelt SB; de Visser KE Nature 2014, 507, 48–49. [DOI] [PubMed] [Google Scholar]
- 10.McIlwain DR; Berger T; Mak TW Cold Spring Harb. Perspect. Biol 2013, 5; a008656. [DOI] [PMC free article] [PubMed] [Google Scholar]
- 11.Clark RSB; Kochanek PM; Watkin SC; Chen M; Dixon CE; Seidberg NA; Melick J; et al. J. Neurochem 2000, 74, 740–753. [DOI] [PubMed] [Google Scholar]
- 12.Stierle A; Stierle D; Decato D; Priestley ND; Alverson JH; Hoody J; McGrath K; Klepacki DJ Nat. Prod 2017, 80, 1150–1160. [DOI] [PMC free article] [PubMed] [Google Scholar]
- 13.Bertrand S; Bohni N; Schnee S; Schumpp O; Gindro K; Wolfender JL Biotechnology Advances 2014, 32, 1180–1204. [DOI] [PubMed] [Google Scholar]
- 14.Netzker T; Fischer J; Weber J; Mattern DJ; König CC; Valiante V; Schroeckh V; Brakhage AA Front. Microbiol 2015, 6, 1–13. [DOI] [PMC free article] [PubMed] [Google Scholar]
- 15.Losada L; Ajayi O; Frisvad JC; Yu J; Nierman WC Medical Mycology, 2009, 47, Issue Supplement_1, S88–S96. [DOI] [PubMed] [Google Scholar]
- 16.Bertrand S; Schumpp O; Bohni N; Monod M; Gindro K; Wolfender JL J. Nat. Prod 2013, 76, 1157–1165. [DOI] [PubMed] [Google Scholar]
- 17.Kossuga MH; Ferreira AG; Sette LD; Berlinck RG S. Nat. Prod. Commun 2013, 8, 721–724. [Google Scholar]
- 18.Li C; Wang J; Luo C; Ding W; Cox DG Nat. Prod. Res 2014, 28, 616–621. [DOI] [PubMed] [Google Scholar]
- 19.Huang S; Ding W; Li C; Cox DG Pharmacogn. Mag 2014, 40, 410–414. [DOI] [PMC free article] [PubMed] [Google Scholar]
- 20.Vinale F; Nicoletti R; Borrelli F; Mangoni A; Parisi OA; Marra R; Lombardi N; Lacatena F; Grauso L; Finizio S; Lorito M; Woo SL Scientific Reports, 2017, 7, 14330. [DOI] [PMC free article] [PubMed] [Google Scholar]
- 21.Shang Z; Salim AA; Capon RJ J. Nat. Prod 2017, 80, 1167–1172. [DOI] [PubMed] [Google Scholar]
- 22.Azzollini A; Boggia L; Boccard J; Sgorbini B; Lecoultre N; Allard P; Rubiolo P; Rudaz S; Gindro K; Bicchi C; Wolfender J-L. Front. Microbiol 2018, 9, article 72, 1–12. [DOI] [PMC free article] [PubMed] [Google Scholar]
- 23.Li HT, Zhou H; Duan RT; Li HY; Tang LH; Yang XQ; Yang YB; Ding ZT J. Nat. Prod 2019, 82, 1009–1013. [DOI] [PubMed] [Google Scholar]
- 24.Murakami S; Hayashi N; Inomata T; Kato H; Hitora Y; Tsukamoto SJ Nat. Med 2020, 74, 545–549. [DOI] [PubMed] [Google Scholar]
- 25.Sun Jingbo; Xu Jian; Wang Shan; Hou Zhidong; Lu Xuechun; An Liping; Du Peige Fitoterapia 2019, 138, 104342. [DOI] [PubMed] [Google Scholar]
- 26. http://www.nmr.ch.tum.de/home/dames/J_reich_uwisc.pdf.
- 27.Takahashi C; Numata A; Yamada T; Minoura K; Enomoto S; Konishi K; Nakai M; Matsuda C; Nomoto K Tetrahedron Lett 1996, 37, 655–658. [Google Scholar]
- 28.Iwamoto C; Minoura K; Hagishita S; Nomota K; Numata AJ Chem. Soc. Perkin Trans 1, 1998, 449–456. [Google Scholar]
- 29.Iwamoto C; Minoura K; Oka T; Ohta T; Hagishita S; Numata A Tetrahedron 1999, 55, 14353–14368. [Google Scholar]
- 30.Chen YP; Yang CG; Wei PY; Li L; Luo DQ; Zheng ZH; Lu XH Molecules 2014, 19, 1663–1671. [DOI] [PMC free article] [PubMed] [Google Scholar]
- 31. http://www.cheminfo.org/Spectra/NMR/Tools/Multiplet_simulator/index.html.
- 32.Claridge TDW. High-Resolution NMR Techniques in Organic Chemistry; Baldwin JE; Williams FRS; Williams RM Eds.; Pergamon; New York, 1999, pp. 117–118 [Google Scholar]
- 33.Jansma JE; Hoye TR Org. Lett 2012, 14, 4738–4741. [DOI] [PMC free article] [PubMed] [Google Scholar]
- 34. Microbial ID, Inc., Delaware, originally identified the organisms based on the alignment of 321 base pairs of the 28S rRNA gene. PW- 2A was originally identified as Eupenicillium pinetorum (GenBank match 100%, Eupenicillium pinetorum DQ473557, which has since been renamed Penicillium fuscum (Sopp) Raper & Thom). It has therefore been designated as Penicillium fuscum (Eupenicillium pinetorum, synonym), GenBank accession no. KT828537. It has been deposited as NRRL 66320. PW2B was identified as Penicillium camembertii Thom (P. clavigerum-camembertii), GenBank accession no. KT828538. It has been deposited as NRRL 66321.
- 35.Sheldrick GM SADABS; Area Detector Absorption Correction; University of Göttingen; Göttingen, Germany, 2001. [Google Scholar]
- 36.Dolomanov OV; Bourhis LJ; Gildea RJ; Howard JAK; Puschmann HJ Appl. Cryst 2009, 42, 339–341. [Google Scholar]
- 37.Sheldrick GM Acta Cryst. 2015, A71, 3–8. [Google Scholar]
- 38.Sheldrick GM Acta Cryst. 2015, C71, 3–8. [Google Scholar]
- 39.Flack HD; Bernardinelli GJ Appl. Cryst 2000, 33, 1143–1148. [Google Scholar]
- 40.Hooft RWW; Straver LH; Spek AL J. Appl. Cryst 2008, 41, 96–103 [DOI] [PMC free article] [PubMed] [Google Scholar]
- 41.Spek AL Acta Cryst. 2009, D65, 148–155. [DOI] [PMC free article] [PubMed] [Google Scholar]
- 42.Bruker (2007). APEX2. Bruker AXS Inc., Madison, Wisconsin, USA. [Google Scholar]
- 43.Sheldrick GM Acta Cryst. 2008, A64, 112–122. [Google Scholar]
Associated Data
This section collects any data citations, data availability statements, or supplementary materials included in this article.