Abstract
The standard clinical assessment of pain is limited primarily to self-reported pain or clinician impression. While the self-reported measurement of pain is useful, in some circumstances it cannot be obtained. Automatic facial expression analysis has emerged as a potential solution for an objective, reliable, and valid measurement of pain. In this study, we propose a video based approach for the automatic measurement of self-reported pain and the observer pain intensity, respectively. To this end, we explore the added value of three self-reported pain scales, i.e., the Visual Analog Scale (VAS), the Sensory Scale (SEN), and the Affective Motivational Scale (AFF), as well as the Observer Pain Intensity (OPI) rating for a reliable assessment of pain intensity from facial expression. Using a spatio-temporal Convolutional Neural Network - Recurrent Neural Network (CNN-RNN) architecture, we propose to jointly minimize the mean absolute error of pain scores estimation for each of these scales while maximizing the consistency between them. The reliability of the proposed method is evaluated on the benchmark database for pain measurement from videos, namely, the UNBC-McMaster Pain Archive. Our results show that enforcing the consistency between different self-reported pain intensity scores collected using different pain scales enhances the quality of predictions and improve the state of the art in automatic self-reported pain estimation. The obtained results suggest that automatic assessment of self-reported pain intensity from videos is feasible, and could be used as a complementary instrument to unburden caregivers, specially for vulnerable populations that need constant monitoring.
Keywords: Pain, Facial Expression, Dynamics, Visual Analogue Scale, Observer Pain Intensity, Convolutional Neural Network, Recurrent Neural Network
1. INTRODUCTION
Pain is a source of human suffering, a symptom and consequence of numerous disorders, and a contributing factor in medical and surgical treatment [10]. The standard clinical assessment for pain is based on subjective self-report using uni-dimensional tools such as the Visual Analogue Scale (VAS). However, self-report measures cannot be used with young children, patients in postoperative care or transient states of consciousness, and patients with severe cognitive disorders (e.g., dementia). As a result, pain is often poorly assessed, underestimated, and inadequately treated especially in vulnerable populations [9]
Significant efforts have been made to provide reliable and valid behavioral indicators of pain (e.g., facial expression) to substitute self-report of pain, especially in vulnerable populations [21] [7]. The most comprehensive method requires manual labeling of facial muscle movement [6–8] by highly trained observers. However, a critical limitation of manual labeling is that it is time-intensive. Manual labeling of a single minute of video can require several hours of effort making it ill-suited for clinical use.
With the release of publicly available pain databases (e.g., the UNBC-McMaster Pain Archive) and advancements in computer vision and machine learning, automatic assessment of pain from behavioral measures (e.g., facial expression) has emerged as a possible alternative to manual observations [10]. Using either spatial features or spatio-temporal features [10], researchers have automatically detected pain in the flow of behavior [1, 16, 19], differentiated feigned from genuine pain [2, 16, 17], detected ordinal pain intensity [11, 12, 15, 22–27, 29] and distinguished pain from expressions of emotion [3, 13, 14] (see [10, 28] for a detailed review).
Most previous efforts for automatic pain assessment have focused on frame-level pain intensity measurement consistent with the Facial Action Coding System (FACS) based Prkachin and Solomon Pain Intensity (PSPI) metric. The PSPI metric describes the intensity of pain experience at the frame level as the sum of the intensities of a subset of facial action units—brow lowering (AU4), orbital tightening (AU6 and AU7), levator labii contraction (AU9 and AU10), and eye closure (AU43). The PSPI metric discriminates among 16 pain intensity levels on a frame-by-frame basis [10]. The emphasis on frame level scores, from static images or subset of images, is consistent with approaches to objective AU detection more generally [10]. However, an important problem in medical practice often is to reliably measure subjective self-reported pain experience (e.g., in vulnerable populations).
To date, little attention has been applied to video based assessment consistent with the self-reported pain scores. Using the publicly available UNBC-McMaster Pain Archive, to the best of our knowledge, only two recent studies have investigated automatic assessment of self-reported pain from video. For instance, Martinez and colleagues [20] proposed a two-step learning approach to estimate self-reported pain intensity consistent with the Visual Analogue Scale (VAS1). The authors employed a Recurrent Neural Network to automatically estimate the FACS based PSPI scores [21] at the frame level. The estimated scores were then fed into the personalized Hidden Conditional Random Fields, used to estimate the self-reported VAS pain scores at the sequence level. To account for individual differences in facial expressiveness of pain, the authors introduced the individual facial expressiveness score as the ratio of independent observers pain intensity (OPI2) to the VAS. However, the proposed method requires to be retrained on previously acquired VAS ratings from the participants and thus does not generalize to previously unseen participants. To overcome this limitation, Liu et al. [18] proposed another set of predefined personalized features (i.e., age range, gender, complexion) for automatic estimation of the self-reported VAS. The authors combined facial shape with the set of predefined personalized features to train an end-to-end combination of Neural Network and Gaussian Regression model, named DeepFaceLIFT, for the VAS pain intensity measurement from video.
The two previous efforts for automatic self-reported pain measurement required an intermediate learning stage (i.e., two-step approaches). They first predicted the PSPI or the VAS at the frame level and then combined the predicted scores in a followup leaning stage to predict pain scores at the video level. As a contribution to previous efforts, we propose a spatio-temporal end-to-end CNN-RNN model for pain intensity measurement directly from videos. Additionally, we propose a new learning approach that enforces the consistency between 1) complementary self-reported pain scores, and 2) self-reported and observers pain scores, for a more reliable and valid assessment of pain experience from facial expression.
2. METHOD
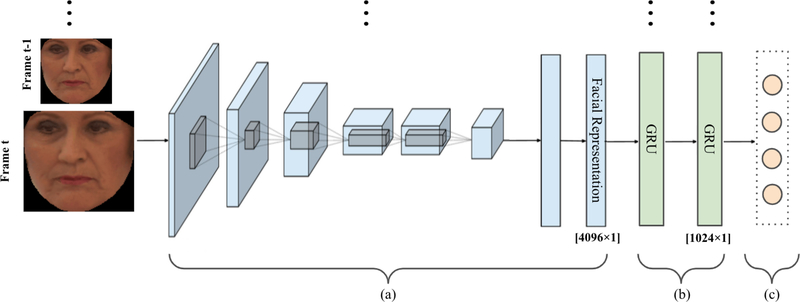
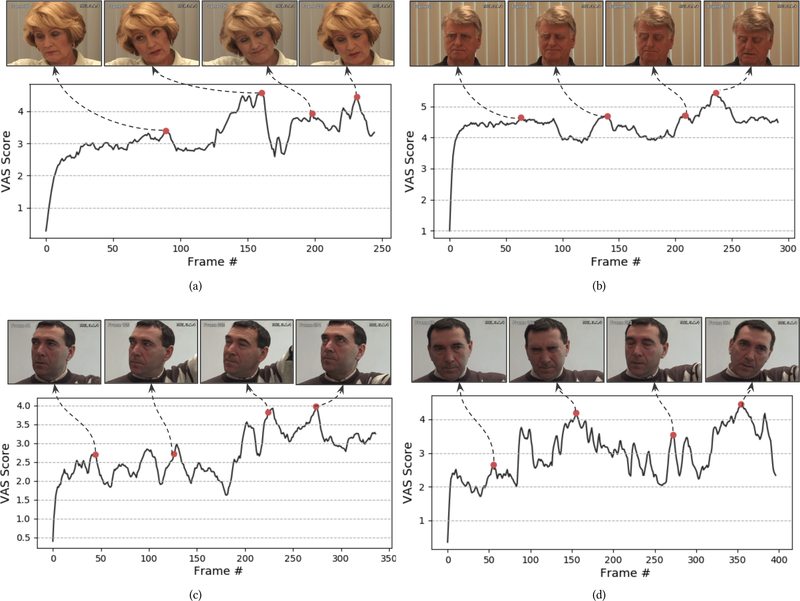
Consistent with approaches to Action Unit and facial expression detection, the focus of previous efforts has been on detection of pain occurrence and intensity in individual video frames or in short segments of video [10]. However, people do not communicate pain experience solely by the exchange of static face displays. Pain communication is dynamic with gradual or abrupt onset and/or offset [10] (see Figure 8). Our goal is to automatically measure self-reported and observer reported pain intensity from the dynamic changes facial movement. To do so, an end-to-end model was trained to capture the spatial features in each frame using convolutional neural network (CNN), while capturing the underlying dynamic changes through a Recurrent Neural Network (GRU). The proposed model is illustrated in Figure 1.
Figure 1:
The graphical representation of our end-to-end pain estimation model. (a) The CNN model trained to learn frame-by-frame spatial features (4096D per frame) and (b) The 2-layer GRU model trained to learn per-video temporal dynamics of facial features. (c) The multivariate regression model to estimate pain intensity scores consistent with the VAS, SEN, AFF, and OPI independently and in combination [19].
2.1. Face Localisation and Registration
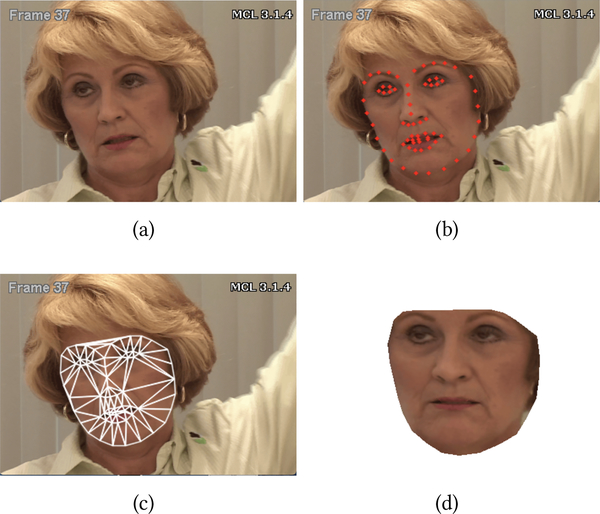
The first step in automatic pain intensity measurement from facial expression is the automatic detection of the face. To do so, we use the 66 facial points distributed with the UNBC-McMaster Pain Archive (see Figure 2(b)) [19]. The tracked facial points are used to extract the normalized face appearance in each video frame (see Figure 2). To remove non-rigid head pose variation, faces are first roughly aligned by fixing the inter-ocular distance. Then, an average facial shape is computed by averaging all of the landmark points in the roughly aligned faces. Each face in the database is finally warped to the average face using piece-wise linear warping, where the facial pieces are formed using Delaunay triangulation. The normalized faces are then cropped out by forming a mask with the convex hull of the landmark points resulting in 224×224 images (see Figure 2(d)).
Figure 2:
Face registration. (a) Original image. (b) Tracked facial landmarks. (c) Triangulation. (d) Normalized face [19].
2.2. End-to-End Spatio-Temporal Model
The normalized face images (see Figure 2(d)) are used to train a spatio-temporal model to estimate pain intensity from video. To do so, a convolutional neural network (CNN) is used to learn the spatial characteristics from each video frame followed by a recurrent neural network (RNN) to model the dynamic changes in the extracted spatial features between consecutive video frames. A regression model is then used to estimate pain intensity scores for each video.
2.2.1. Convolutional Module.
Given the very small sample size of training data in clinically relevant databases (in our case pain, see section 3.1), reducing the complexity of the model and the number of parameters in the deep learning architectures is warranted. We employ the CNN AlexNet architecture (composed of 5 convolutional layers, a max-pooling layer, and 2 fully-connected layers) as our convolutional module. To leverage common image patterns, and enhance the effectiveness of training process, the pre-trained AlexNet weights are used for initialization. At each time step of a given video of size N frames, aligned face image in the target frame with a size of 224 × 224 × 3 pixels, is fed to the CNN network as an input. A 4096-dimensional mid-level spatial representation is generated from the second fully-connected layer and is aggregated as an input to the corresponding time step of the recurrent model (see following section). In the backward pass, the parameters in the convolutional module are optimized by back-propagating output gradients of the upper recurrent module through all frames.
2.2.2. Recurrent Module.
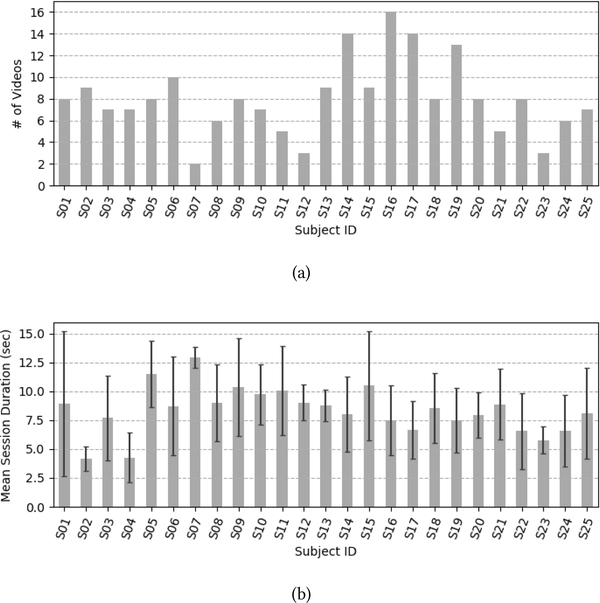
We employ a two-layer gated recurrent network with 1024 hidden units (at each layer) as our recurrent module. The depth of the recurrent network is selected based on our preliminary experiments where a 2-layer recurrent network has outperformed both a single-layer and a 3-layer recurrent network on multiple settings. To remember possible long-term temporal dependencies, Gated Recurrent Units (GRU) [4] is employed. The GRU is similar to the long short-term memory (LSTM) with forget gate but has fewer parameters than the LSTM, as it lacks an output gate. The GRU is computationally suitable for small databases to reduce over-fitting while still generalize well. At each time step of the input video (of size N frames), the corresponding output of the convolutional module is fed to the GRU model, and a 1024-dimensional temporal representation is computed. The model process one video at the time and handle videos of different duration (see Figure 3(b) and Figure 8). In order to capture the dynamics of the whole sequence (input video), the representation obtained after the last time step (i.e., after processing the whole video) is passed to a multivariate linear regression layer to estimate pain intensity of the corresponding video-sequence. Because pain scores are continuous and not independent, a regression function is used instead of a multi-class classification.
Figure 3:
The UNBC-McMaster Pain Archive distribution per participant for (a) the number of videos (b) the mean duration (with standard deviation) of the videos.
2.2.3. Loss Function.
To model the intensity of pain from facial features, we exploit the relevance and relation of pain scores collected using multiple self-reported pain scales and observer pain scale (see section 3.1). To this end, we propose a custom loss function as follows:
| (1) |
where, denotes the weight parameters of the deep model. Let indicates the Mean Absolute Error (MAE) as:
| (2) |
and, is the loss that measures the consistency in pain scores obtained using different pain scales (e.g., consistency between the predicted self-reported and observed pain scores). indicates the L2 norm of the weight parameters, α is the trade-off parameter (between and ), λ is the regularization rate, and denote the actual and predicted pain scores of the ith video using the jth pain scale, respectively. While n represents the number of training videos, S is the set of predefined pain scales, i.e., S = {VAS, AFF, SEN, OPI}, and m is the size of S (see section 3.1 for the definition of pain scales).
As shown in Eq. 1, our loss definition consists of three terms. The first term , aims to minimize the difference between the predicted scores and their actual values (in each pain scale). The second term, namely the consistency term, enforces the consistency of the predictions from different pain scales (i.e., VAS, AFF, SEN, and OPI). Based on the fact that pain intensity scores should be consistent between different pain scales, their variance for each video is computed, and the average of the variance values of the training samples is used as the consistency loss:
| (3) |
where, denotes the predicted labels for the ith video, particularly . Therefore, if the predicted pain scores from different pain scales vary highly in magnitude, the inter-class variability increases, and thus, loss increases penalizing the difference. Please notice that we normalize the scores of each rating scale to a range of [0, 1] so as to provide comparability between them in the training process. Lastly, the third term of our loss definition is the L2 regularization term.
Using the proposed loss function, our architecture is trained on individual pain scales separately and in combination, respectively. As mentioned in sections 2.2.1 and 2.2.2, the pre-trained CNN AlexNet weights are used for initialization whereas the GRU’s weights are randomly initialized. All modules are jointly trained in an end-to-end manner by minimizing the proposed loss through back-propagation. The trade-off parameter (α) (see Eq. 1) is selected based on our preliminary experiments where α = 0.7 has outperformed other values 0.5, 0.3 on multiple settings. The hyper-parameters of the network are determined based on the minimum validation error in terms of MAE (i.e., minimizing the difference between the predicted and actual pain scores). Table 1 shows the list of the investigated hyper-parameters and the considered values for each one of them.
Table 1:
List of the considered hyper-parameters for the CNN-RNN model optimization
| Hyper-parameter | Values |
|---|---|
|
| |
| Learning rate | {0.00001, 0.0001} |
| Dropout factor | {0.3, 0.5} |
| Regularization rate | {1e–6, 5e–6} |
3. EXPERIMENTS AND RESULTS
3.1. The UNBC-McMaster Pain Archive
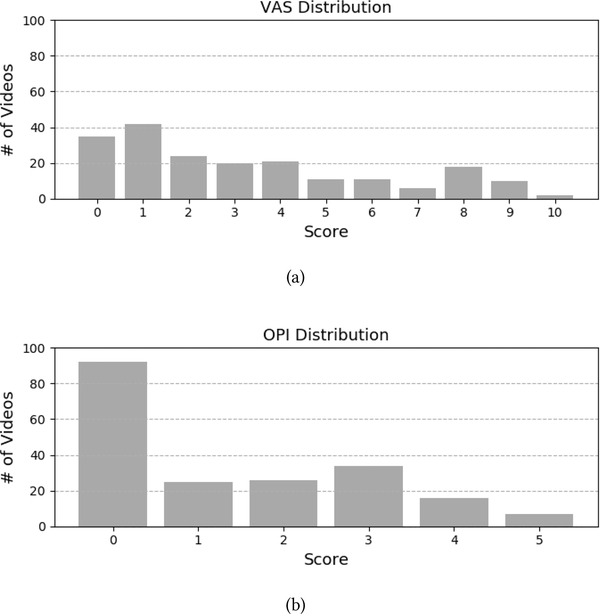
The UNBC-McMaster Pain Archive [19] is used to address the need for a well annotated facial expression database for pain assessment from video. The UNBC-McMaster Pain Archive is composed of participants self-identified as having shoulder pain [19]. Participants were video recorded during the abduction and flexion movements of their affected and unaffected shoulders. The publicly available portion of the database consists of 200 videos from 25 different participants (with 48398 frames [19]). Figure 3 shows the number of videos available per participant as well as the mean duration of videos per participant. For each video, the data contains three self-reported pain intensity scores and one observer pain intensity score. After each test, participants self-reported the maximum pain they experienced using three different scales [19]. The first two self-reported scales were the sensory scale (SEN) and the affective motivational scale (AFF). Those two were performed on a 15 point likert-type scale which ranged from 0–14. The SEN scale ranged from “extremely weak” to “extremely insane” and the AFF scale ranged from “bearable” to “excruciating”. The third self-reported scale was the commonly used Visual Analogue Scale (VAS). The VAS was performed on an 11 point likert-type scale which ranged from 0 “no pain” to 10 “pain as bad as it could be”. Additionally, a fourth independent and offline observer pain intensity (OPI) ratings were collected. The OPI ratings were measured on a 6 point likert-type scale that ranged from “no pain” to “strong pain”. Figure 4 shows the distribution of pain intensity scores (i.e., number of available videos) for the VAS and the OPI, respectively.
Figure 4:
Distribution of pain intensity scores for (a) VAS and (b) OPI in the UNBC-McMaster Pain Archive.
3.2. Experimental Setup
Our goal is to measure the self-reported Visual Analogue Scale pain scores (VAS) and the objective Observer Pain Intensity scores (OPI), separately and in combination. The VAS is chosen, because it’s the gold standard for self-reported pain assessment in clinical context. The OPI, a valid observer based assessment was used as a proxy for perceived pain intensity scores by healthcare professional (e.g., clinician).
We use a two-level 5-fold cross-validation scheme to train and test the proposed spatio-temporal model. The data is divided into five independent folds, for each run of the outer cross validation, one fold is separated as test-set and the four remaining folds are used in the inner loop for training and validation. All participants used for the test fold are removed from the training fold (subject-independent). Because pain scores are continuous and not independent, a regression function is used instead of a multi-class classification. The regression model is optimized (i.e., searching for the best hyper-parameters of the end-to-end CNN-RNN model) on the validation set by minimizing the minimum validation error (i.e. mean absolute error, MAE). The optimized hyper-parameters are the drop out factor, the learning rate, and the regularization rate λ for the loss function (see Table 1).
The standard approach for training deep models is to use a random sampling of data for each training batch. Because some gradations of pain intensity are sparsely represented (see Figure 4), the trained models would be affected by the number of samples per intensity seen during the training. To address the imbalanced number of samples per pain intensity level (see Figure 4) and its effect on model training, we perform a stratification (i.e., re-sampling) of the data. By doing so, the training data is randomly sampled while making sure a similar distribution of pain intensity scores is used between training folds. This also insure that for each training fold, each intensity score appears at least once.
The outputs of the trained models are continuous values (estimated from our regression model). To measure the error in pain scores, we first round the obtained continuous scores to an ordinal (discrete) predictions, and then measure the mean absolute error between the ground truth (ordinal) and the rounded predictions. Please notice that the provided mean absolute errors are not based on (normalized) [0,1] range but the original intervals of the corresponding pain scales (i.e, [0, 10] for the VAS and [0, 5] for the OPI).
3.3. Added Value of Multiple Pain Scales for Automatic Prediction of Pain Scores
While useful, self-reported pain have notable limitations such as inconsistent metric properties across scale dimensions, reactivity to suggestion, and differences between clinicians’ and sufferers’ conceptualizations of pain [10]. Multiple self-reported pain scales (e.g., VAS, AFF, SEN) have varying numbers of pain levels with different wordings for pain scores, making the obtained scores across multiple instruments complementary. We propose an approach that increases the degree of agreement among the different uni-dimensional pain scales, and thus increases the accuracy of self-reported (i.e., the VAS3 pain scores) as well as perceived pain scores (i.e., the OPI pain scores), respectively.
3.3.1. Data Analysis.
Table 2 and Table 3 summarize the obtained results for pain estimation using the VAS and the OPI pain scales, respectively. For both scales, we compared the added value of combining multiple pain scales for the prediction of pain intensity scores. Given the repeated-measures nature of the data, non-parametric repeated measures Friedman test4 was used to evaluate the mean differences in the MAEs between the use of a single and multiple pain scales (for VAS and OPI, respectively). Separate Friedman tests were used for the VAS and OPI results, respectively. Wilcoxon signed-rank test was used for post-hoc analyses following significant Friedman test.
Table 2:
MAEs in estimating the self-reported VAS pain scores using different pain scales in training
| Training Scales | MAE (VAS) |
|---|---|
|
| |
| 1 Scale (VAS) | 2.64 |
| 2 Scales (VAS+OPI) | 2.53 |
| 3 Scales (VAS+AFF+SEN) | 2.48 |
| 4 Scales (VAS+OPI+AFF+SEN) | 2.34 |
Table 3:
MAEs in estimating the OPI pain scores using different pain scales in training
| Training Scales | MAE (OPI) |
|---|---|
|
| |
| 1 Scale (OPI) | 1.35 |
| 2 Scales (VAS+OPI) | 1.32 |
| 4 Scales (vAS+OPI+AFF+SEN) | 1.38 |
3.3.2. VAS Results.
Table 2 shows the VAS pain estimation results. In a scale of [0, 10], the MAE of the estimated VAS scores is 2.64. There is a main effect on the VAS MAEs for the use of multiple pain scales (χ2 = 17.1, df = 3, p < 0.001, see Table 2). Using four scales (i.e., self-reported and perceived pain scales) improves pain scores estimation (i.e., lower MAEs) compared to using a single self-reported pain scale (W = 3466, p < 0.001) and to combining the self-reported pain scale with the perceived pain scale (W = 1970, p = 0.004), as well as combining all self-reported pain scales (W = 3376.0, p = 0.028). There is no difference between using a single self-reported scale and combining it with the perceived pain scale (W = 4703, p = 0.23). The combination of multiple self-reported pain scales improves the measurement of self-reported pain. The combination of self-reported pain scale alone with observer reported scale does not improve the estimation.
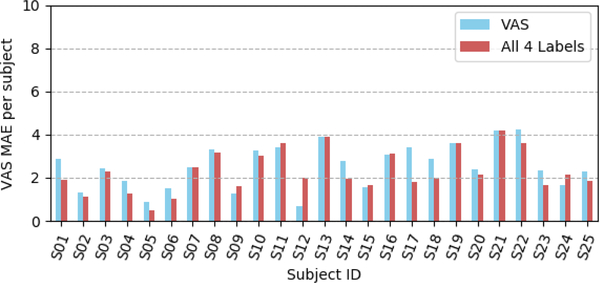
Figure 5 summarizes the overall distribution of our model performances for the VAS pain scores estimation for the 25 participants of the UNBC-McMaster Pain Archive [19]. One can observe that the combination of multiple pain scales consistently improves the measurement of self-reported pain for all participants but for 4 participants (see Figure 5).
Figure 5:
Distribution of the VAS MAEs per participant using all four scales in training with the consistency term compared to a single label.
Overall, the obtained results shown in Table 2 and illustrated in Figure 5 support the hypothesis that multiple self-reported measures (i.e., VAS, AFF, SEN) are complementary and their combination reduces the inconsistency and increases the reliability of self-reported pain estimation (in our case the VAS pain scores).
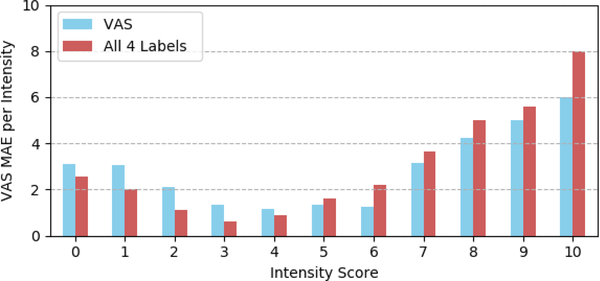
To better assess the reliability of pain intensity estimation, we also report the distribution of MAEs per intensity level. Figure 6 shows the results for the self-reported VAS pain score from 0 (no pain) to 10 (pain as bad as it could be). The best results are obtained for pain intensities lower than 7. These results may be explained by the distribution of data available for training the model (i.e., 6, 18, 10 and 2 videos for 7, 8, 9, and 10 pain intensity levels, respectively). One can also observe that the combination of multiple self-reported pain scales improves the performances for pain scores with higher number of training samples (see Figures 4 and 6). The results reported for pain scores 0 and 1 can be explained by the little difference between the absence of pain (pain score=0) and trace of pain (pain score=1). Overall the obtained results are very promising given the task difficulty and the very small sample size used to train the model.
Figure 6:
Distribution of the VAS MAEs per pain intensity level.
3.3.3. OPI Results.
Table 3 shows the OPI pain estimation results. In a scale of [0, 5], the MAE of the estimated OPI scores is 1.35. There is no effect on the OPI MAEs for the use of multiple pain scales (χ2 = 2.8, df = 2, p = 0.24, see Table 3). The joint use of the OPI scores together with three different self-reported scores (VAS, AFF, SEN) decreases the reliability of the OPI predictions. Combining only the VAS and the OPI scales improves only slightly the predictions (p > 0.05). These results may be explained by the fact that using relatively small amount of noisy labels in training would serve as an additional regularization. Overall, these findings reinforce the reliability of the OPI pain scores (i.e., perceived pain) compared to the more subjective self-reported pain scores.
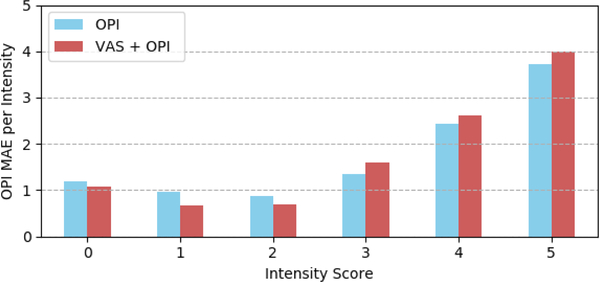
Figure 7 shows the distribution of the OPI MAEs per intensity level from 0 (no pain) to 5 (strong pain). The obtained results are consistent with the VAS results. Better results are obtained for pain scores with higher number of samples for training the model (see Figure 4).
Figure 7:
Distribution of the OPI MAEs per pain intensity level.
3.4. Influence of Enforcing Prediction Consistency
As reported in section 2.2.3 (see Eq. 1), the proposed loss function introduces a consistency term that allows to improve the accuracy of the predicted pain scores by increasing the consistency between multiple pain scales. Table 4 shows the the Pearson correlation coefficient between pain scores measured using the three self-reported pain scales (i.e., VAS, AFF, SEN) and the observer reported pain scores (i.e., OPI). As expected, the obtained correlation coefficients suggest a strong positive correlation (|r| > 0.5) between different pain scales [5]. Correlation is higher within self-reported pain scales compared to between self-reported and observer pain scales (i.e., perceived pain).
Table 4:
Coefficients of Pearson’s correlation between the scores in different pain scales
| AFF | OPI | SEN | VAS | |
|---|---|---|---|---|
|
| ||||
| AFF | 1 | |||
| OPI | 0.655 | 1 | ||
| SEN | 0.949 | 0.703 | 1 | |
| VAS | 0.898 | 0.664 | 0.922 | 1 |
To evaluate the added value of enforcing the consistency between different pain scales, we compared the proposed loss function (i.e., Eq. 1) to the standard loss (using only MAE and regularization terms) without the consistency term . Table 5 shows the obtained MAEs for the self-reported VAS pain scores, with and without the consistency term in the loss function (see Eq. 1, section 2.2.3). The consistency term significantly improves the MAE in the case of two scales (VAS+OPI) compared the regular loss without the the consistency (including the consistency term performs 7.7% better, W = 3351, p < 0.001).
Table 5:
MAEs for estimating VAS with and without (w/o) using the consistency term in the loss function
| Training Labels | Loss | MAE (VAS) |
|---|---|---|
|
| ||
| 2 Labels (VAS+OPI) | with | 2.53 |
| w/o | 2.74 | |
|
| ||
| 4 Labels (VAS+OPI+AFF+SEN) | with | 2.34 |
| w/o | 2.38 | |
As expected, the OPI results were different (see Table 6). The consistency term in the loss function does not improve the MAEs (p > 0.1, Table 6).
Table 6:
MAEs for estimating OPI with and without (w/o) using the consistency term in the loss function
| Training Labels | Loss | MAE (OPI) |
|---|---|---|
|
| ||
| 2 Labels (VAS+OPI) | with | 1.32 |
| w/o | 1.31 | |
|
| ||
| 4 Labels (VAS+OPI+AFF+SEN) | with | 1.38 |
| w/o | 1.36 | |
Overall our results show the usefulness of employing the consistency term in the loss function for estimating the self-reported VAS scores. Based on our results, we will continue using the consistency term (in the loss function) in the remaining experiments.
3.5. Visual Analysis of Pain Cues
Our goal is to get an insight on the visual cues learned by the trained model (best model, with all scales and with the consistency term (Eq. 1)). To do so, instead of estimating pain score at the end of the video, we generate pain score at each frame of the video as it was the end of the video sequence (by progressively combining all video frames from the start to the current frame). Consequently, the estimation of pain score for the last time step includes all frames of the input video (see section 2.2.2). In this way, we compute the regression score (i.e., corresponding pain intensity) at each time step such that:
| (4) |
where f represents our model, t is the number of frames per video, and xi is the normalized face image at time step ti. The model combines at each time step ti all previous images from the beginning until the current time step (or the end of the sequence) to refine and generate its pain prediction Yi. For each video, we plot the time series {Y1, Y2, ….,Yt} obtained as described above.
Figure 8 shows examples of the obtained pain scores over time. For each plot, we select the time steps that correspond to the global/local highest scores (P = pi) and plot the corresponding images (or the images in the surrounding +/−5 images window). One can see that pain communication is indeed dynamic with gradual and abrupt onsets and offsets within participants (see Figure 8 (c, d)) as well as between different participants (see Figure 8 (a–d)). As shown in Figure 8, our model reveals different facial cues for pain expression observed around the aforementioned maximas (pi). These facial cues include lips tightening (see the third image in Figure 8 (a) and the second images in Figure 8 (b, d)), brow lowering (see the second images in Figure 8 (b, d), eye closure (see the second images in Figure 8 (b, d) and the third images in Figure 8 (a, c)), and mouth opening (see the fourth images in Figure 8 (a, b)). The observed facial cues are consistent with the manual PSPI metric for pain intensity estimation from facial expression [21].
Figure 8:
Accumulative VAS scores for different participants in the UNBC-McMaster Pain Archive.
3.6. Comparison With the State of the Art
To further evaluate the proposed method for pain intensity measurement, we compare our model to the two only available models for self-reported pain intensity measurement from videos. First, [20] is a subject dependent approach that does not generalize to previously unseen participants while our method is a subject-independent one. We thus compare our model to the two stage personalized deep neural network DeepFaceLift (LIFT = Learning Important Features) [18]. The first stage of the DeepFaceLift model is a fully connected neural network that takes the AAM facial landmarks as input. The second stage is a Gaussian Process Regression model that takes the output of the first stage as input and outputs the VAS scores. The two settings to which we compare our model to are without personal features inserted in (a) 3rd Neural Net Layer and (b) in Neural Net Input. Notice that DeepFaceLift’s authors do not provide the code or the sampling strategy used to generate their results. For a fair comparison between the proposed approach and DeepFaceLift method [18], we would need to compare our results on the same train/test sample. To do so, we have implemented the DeepFaceLift method and run experiments on the same stratified data distribution we use for training and testing our model. As shown in Table 7, the minimum MAE using DeepFaceLift is 2.91. Our VAS result using four labels is 2.34, providing a significant improvement (p<0.05). The obtained results confirm the added value of combing multiple pain scales for a reliable prediction of self-reported VAS pain scores. Because DeepFaceLift is only trained and evaluated on VAS [18], OPI results are not reported for comparison.
Table 7:
Comparison of the proposed model with DeepFaceLIFT using single and multiple scales, respectively
| Model | Training Labels | MAE (VAS) |
|---|---|---|
|
| ||
| DeepFaceLift1 | VAS | 2.91 |
|
| ||
| VAS, OPI | 3.15 | |
|
| ||
| Proposed Model | VAS | 2.64 |
|
| ||
| VAS, OPI | 2.53 | |
|
| ||
| VAS, AFF, SEN | 2.48 | |
|
| ||
| VAS, AFF, SEN, OPI | 2.34 | |
For fair comparison, these results are based on our implementation of the DeepFaceLift method and ran on the same stratified train/test distribution as our model.
4. CONCLUSION
We have proposed a spatio-temporal approach for end-to-end self-reported and observer’s reported pain intensity measurement from videos. A new loss function has been introduced to increase the consistency between multiple pain scales and improve the prediction accuracy of pain scores. We have explored the added value of three self-reported pain scales, as well as an observer pain intensity scale for a reliable assessment of pain intensity from facial expressions. In summary, our results show that enforcing the consistency between multiple self-reported pain scales enhances the reliability of the subjective self-reported pain estimation. However, we have observed little difference in the more reliable observed pain estimation. Our work opens several additional directions for future investigations. One is to investigate other losses for measuring consistency such as the correlation instead of the variance. Two, even if the obtained results testing different hyper-parameters, different sampling strategies, and different loss functions (and different layers in our preliminary experiments) support our conclusions, the next step is to evaluate the proposed loss functions on additional deep spatio-temporal architectures.
CCS CONCEPTS.
• Computing methodologies → Computer vision; • Applied computing → Life and medical sciences; Health informatics.
ACKNOWLEDGMENTS
This study was supported in part by the National Institute of Nursing Research of the National Institutes of Health under Awards Number R21NR016510 and R01NR018451. The content is solely the responsibility of the authors and does not necessarily represent the official views of the National Institutes of Health.
Footnotes
11 point likert-type scale from 0 (No pain) to 10 (Pain as bad as it could be)
6 point likert-type scale from 0 (No pain) to 5 (Strong pain)
Given the wide use of the VAS in clinical practice, we used the AFF and the SEN scores for training purposes only to improve the accuracy of the VAS and the OPI predictions, respectively
MAEs distributions were not normally distributed, as per Shapiro-Wilks test
REFERENCES
- [1].Ashraf Ahmed Bilal, Simon Lucey, Cohn Jeffrey F, Chen Tsuhan, Ambadar Zara, Prkachin Kenneth M, and Solomon Patricia E. 2009. The painful face–pain expression recognition using active appearance models. Image and vision computing 27, 12 (2009), 1788–1796. [DOI] [PMC free article] [PubMed] [Google Scholar]
- [2].Bartlett Marian Stewart, Littlewort Gwen C, Frank Mark G, and Lee Kang. 2014. Automatic decoding of facial movements reveals deceptive pain expressions. Current Biology 24, 7 (2014), 738–743. [DOI] [PMC free article] [PubMed] [Google Scholar]
- [3].Chen Zhanli, Ansari Rashid, and Wilkie Diana J. 2012. Automated detection of pain from facial expressions: a rule-based approach using AAM. In Proceedings of SPIE – the International Society of Optical Engineering, Medical Imaging 2012: Image Processing. San Diego, CA, 1–17. [DOI] [PMC free article] [PubMed] [Google Scholar]
- [4].Chung Junyoung, Gülçehre Çaglar, Cho KyungHyun, and Bengio Yoshua. 2014. Empirical Evaluation of Gated Recurrent Neural Networks on Sequence Modeling. CoRR abs/1412.3555 (2014). [Google Scholar]
- [5].Cohen Jacob. 1988. Set correlation and contingency tables. Applied psychological measurement 12, 4 (1988), 425–434. [Google Scholar]
- [6].Craig Kenneth D, Prkachin Kenneth M, and Grunau Ruth VE. 1992. The facial expression of pain. Handbook of pain assessment 2 (1992), 257–276. [Google Scholar]
- [7].Craig Kenneth D, Versloot Judith, Goubert Liesbet, Vervoort Tine, and Crombez Geert. 2010. Perceiving pain in others: automatic and controlled mechanisms. The Journal of Pain 11, 2 (2010), 101–108. [DOI] [PubMed] [Google Scholar]
- [8].Ekman Rosenberg. 1997. What the face reveals: Basic and applied studies of spontaneous expression using the Facial Action Coding System (FACS). Oxford University Press, USA. [Google Scholar]
- [9].Hadjistavropoulos Thomas, Herr Keela, Prkachin Kenneth M, Craig Kenneth D, Gibson Stephen J, Lukas Albert, and Smith Jonathan H. 2014. Pain assessment in elderly adults with dementia. The Lancet Neurology 13, 12 (2014), 1216–1227. [DOI] [PubMed] [Google Scholar]
- [10].Hammal Zakia and Cohn Jeffrey. 2018. Automatic, Objective, and Efficient Measurement of Pain Using Automated Face Analysis. Springer International Publishing, 121–146. [Google Scholar]
- [11].Hammal Zakia and Cohn Jeffrey F. 2012. Automatic detection of pain intensity. In Proceedings of the 14th ACM international conference on Multimodal interaction. Santa Monica, CA, 47–52. [DOI] [PMC free article] [PubMed] [Google Scholar]
- [12].Hammal Zakia and Cohn Jeffrey F.. 2014. Towards Multimodal Pain Assessment for Research and Clinical Use. In Proceedings of the ACM 2014 Workshop on Roadmapping the Future of Multimodal Interaction Research Including Business Opportunities and Challenges. Association for Computing Machinery, New York, NY, 13–17. [Google Scholar]
- [13].Hammal Zakia and Kunz Miriam. 2012. Pain monitoring: A dynamic and context-sensitive system. Pattern Recognition 45, 4 (2012), 1265–1280. [Google Scholar]
- [14].Hammal Zakia, Kunz Miriam, Arguin Martin, and Gosselin Frédéric. 2008. Spontaneous pain expression recognition in video sequences. In Proceedings of Visions of Computer Science-BCS International Academic Conference. Swindon, UK, 191–210. [Google Scholar]
- [15].Kaltwang Sebastian, Rudovic Ognjen, and Pantic Maja. 2012. Continuous pain intensity estimation from facial expressions. In Proceedings of International Symposium on Visual Computing. Berlin, Germany, 368–377. [Google Scholar]
- [16].Littlewort Gwen C, Bartlett Marian Stewart, and Lee Kang. 2007. Faces of pain: automated measurement of spontaneous all facial expressions of genuine and posed pain. In Proceedings of the 9th international conference on Multimodal interfaces. Nagoya Aichi, Japan, 15–21. [Google Scholar]
- [17].Littlewort Gwen C, Bartlett Marian Stewart, and Lee Kang. 2009. Automatic coding of facial expressions displayed during posed and genuine pain. Image and Vision Computing 27, 12 (2009), 1797–1803. [Google Scholar]
- [18].Liu Dianbo, Peng Fengjiao, Ognjen (Oggi) Rudovic, and Picard Rosalind W.. 2017. DeepFaceLIFT: Interpretable Personalized Models for Automatic Estimation of Self-Reported Pain. In Proceedings of the 1st IJCAI Workshop on Artificial Intelligence in Affective Computing (Proceedings of Machine Learning Research). Melbourne, Australia, 1–16. [Google Scholar]
- [19].Lucey Patrick, Cohn Jeffrey F, Prkachin Kenneth M, Solomon Patricia E, and Matthews Iain. 2011. Painful data: The UNBC-McMaster shoulder pain expression archive database. In Proceedings of IEEE International Conference on Automatic Face and Gesture Recognition. Santa Barbara, CA, 57–64. [Google Scholar]
- [20].Martinez Daniel Lopez, Rudovic Ognjen, and Picard Rosalind. 2017. Personalized automatic estimation of self-reported pain intensity from facial expressions. In Proceedings of IEEE Conference on Computer Vision and Pattern Recognition Workshops (CVPRW). Honolulu, HI, 2318–2327. [Google Scholar]
- [21].Prkachin Kenneth M and Solomon Patricia E. 2008. The structure, reliability and validity of pain expression: Evidence from patients with shoulder pain. Pain 139, 2 (2008), 267–274. [DOI] [PubMed] [Google Scholar]
- [22].Rodriguez Pau, Cucurull Guillem, Gonzàlez Jordi, Gonfaus Josep M, Nasrollahi Kamal, Moeslund Thomas B, and Roca F Xavier. 2017. Deep pain: Exploiting long short-term memory networks for facial expression classification. IEEE transactions on cybernetics (2017), 1–11. [DOI] [PubMed] [Google Scholar]
- [23].Rudovic Ognjen, Pavlovic Vladimir, and Pantic Maja. 2013. Automatic pain intensity estimation with heteroscedastic conditional ordinal random fields. In Proceedings of 9th International Symposium on Visual Computing. Crete, Greece, 234–243. [Google Scholar]
- [24].Sikka Karan, Dhall Abhinav, and Marian Stewart Bartlett. 2014. Classification and weakly supervised pain localization using multiple segment representation. Image and vision computing 32 (2014), 659–670. [DOI] [PMC free article] [PubMed] [Google Scholar]
- [25].Tsai Fu-Sheng, Hsu Ya-Ling, Chen Wei-Chen, Weng Yi-Ming, Ng Chip-Jin, and Lee Chi-Chun. 2016. Toward Development and Evaluation of Pain Level-Rating Scale for Emergency Triage based on Vocal Characteristics and Facial Expressions. In Proceedings of Interspeech Conference. San Francisco, CA, 92–96. [Google Scholar]
- [26].Werner Philipp, Al-Hamadi Ayoub, Limbrecht-Ecklundt Kerstin, Walter Steffen, Gruss Sascha, and Traue Harald C. 2016. Automatic pain assessment with facial activity descriptors. IEEE Transactions on Affective Computing 8, 3 (2016), 286–299. [Google Scholar]
- [27].Werner Philipp, Al-Hamadi Ayoub, and Niese Robert. 2014. Comparative learning applied to intensity rating of facial expressions of pain. International Journal of Pattern Recognition and Artificial Intelligence 28, 05 (2014), 1451008. [Google Scholar]
- [28].Werner Philipp, Lopez-Martinez Daniel, Walter Steffen, Al-Hamadi Ayoub, Gruss Sascha, and Picard Rosalind. 2019. Automatic Recognition Methods Supporting Pain Assessment: A Survey. IEEE Transactions on Affective Computing (2019), 1–22. [Google Scholar]
- [29].Zhou Jing, Hong Xiaopeng, Su Fei, and Zhao Guoying. 2016. Recurrent convolutional neural network regression for continuous pain intensity estimation in video. In Proceedings of IEEE Conference on Computer Vision and Pattern Recognition Workshops. Las Vegas, NV, 84–92. [Google Scholar]


