

Abstract
Yellow fever (YF) is an acute viral hemorrhagic disease transmitted by infected mosquitoes. Large epidemics of YF occur when the virus is introduced into heavily populated areas with high mosquito density and low vaccination coverage. The lack of a specific small molecule drug treatment against YF as well as for homologous infections, such as zika and dengue, highlights the importance of these flaviviruses as a public health concern. With the advancement in computer hardware and bioactivity data availability, new tools based on machine learning methods have been introduced into drug discovery, as a means to utilize the growing high throughput screening (HTS) data generated to reduce costs and increase the speed of drug development. The use of predictive machine learning models using previously published data from HTS campaigns or data available in public databases, can enable the selection of compounds with desirable bioactivity and absorption, distribution, metabolism and excretion profiles. In this study, we have collated cell-based assays data for yellow fever virus from literature and public databases. The data was used to build predictive models with several machine learning methods that could prioritize compounds for in vitro testing. Five molecules were prioritized and tested in vitro, from which we have identified a new pyrazolesulfonamide derivative with EC50 3.2 μM and CC50 24 μM, which represents a new scaffold suitable for hit-to-lead optimization that can expand the available drug discovery candidates for YF.
Graphical Abstract

INTRODUCTION
The yellow fever virus (YFV) originated in Africa and is the causative agent of yellow fever (YF), which since the 17th century has caused numerous outbreaks in Central and South Americas.1 A modelling study based on YF data sources from Africa and South America estimated 67,000–173,000 severe cases and 31,000–82,000 deaths in these continents during 2018.2 Symptoms of the disease vary from mild in the initial stages to a visceral stage with mortality rates up to 50%.3 The YFV is a member of Flavivirus genus, which includes other notorious human pathogens such as Dengue, Zika, West Nile and Japanese encephalitis viruses.4 YF is prevented by an extremely effective vaccine, which is also safe and affordable.5 However, the constant expansion of urban areas, an increase in global travel, and growth of the unvaccinated population has always posed a threat for viral resurgence, as seen with the latest outbreaks in Brazil and Angola.6–8 Despite the efforts of the local authorities to contain the virus and vaccinate the population, the risk of a new epidemic is elevated. To date, there is no effective small molecule or other treatment against YFV infection and the majority of compounds tested in the YF animal models have been nucleoside analogs, such as ribavirin,9 sofosbuvir,10 galidesivir11 and favipiravir12.
One of the main challenges in drug discovery is the increasing costs and low efficiency in identifying new active molecular scaffolds.13 Machine learning methods were mainly introduced in drug discovery as another means to reduce costs and improve the attrition rate.14 Years of high throughput screening (HTS) research has generated massive amounts of screening data for different diseases and targets.15 To deter the high costs of lead discovery, many studies have shown that previous experimental data can be used to build predictive models that might increase the future screening success rate by prioritizing compounds with optimal absorption, distribution, metabolism and excretion profiles (ADME) and bioactivity properties.16 Similar studies using machine learning models for drug discovery have increased considerably over the past decade. Nowadays machine learning algorithms like deep learning are garnering considerable attention because of successes with complex data,17 while there are several classical machine learning approaches that are currently also being used with equal or similar predictive power on external sets.18,19 Among them, support vector machines (svm)20–22, naive-bayesian classifier23–25 and random forests (rf)26,27 are the most popular methods.
To identify new potential lead molecules for YF, we collated YFV cell-based assay data from public databases and the literature and then used this to generate different machine learning models. These were validated and used for prioritizing compounds for testing. We ultimately selected five compounds for testing in vitro and one molecule showed low micromolar potency against YFV which represents a new scaffold suitable for hit-to-lead optimization.
METHODS
Computing
Computational servers for machine learning calculations consisted of the components: Supermicro EATX DDR4 LGA 2011, Intel Computer CPU 2.1 8 BX80660E52620V4, Crucial 64GB Kit (16GB × 4) DDR4 2133 (PC42133) DR × 4 288 Pin Server Memory CT4K16G4RFD4213/CT4C16G4RFD4213, 10 × EVGA GeForce GTX 1080 Ti FOUNDERS EDITION GAMING, 11GB GDDR5X, Intel 730 SERIES 2.5 in. Solid State Drive SSDSC2BP480G410, WD Gold 4TB Datacenter Hard Disk Drive 7200 RPM Class SATA 6 Gb/s 128MB Cache 3.5 in. WD4002FYYZ, and Supermicro 920 W 4U Server. Software modules installed: nltk 3.2.2, scikit-learn 0.18.1, Python 3.5.2, Anaconda 4.2.0 (64-bit), Keras 1.2.1, Tensorflow 0.12.1, and Jupyter Notebook 4.3.1.
Data Curation
The training and testing YFV datasets were compiled from ChEMBL (version 26)28 and the literature, respectively. ChEMBL target ID 613731 was investigated for YFV cell-based assays and manually curated to exclude assays without compounds, standardizing molarity units and checking for chemical structure errors. Automated workflows described in the following section were used to further curate these datasets and build Bayesian machine learning models.
A literature review was also performed to collate an external test set with YFV cell-based assays, using the Molecular Notebook software (Molecular Materials Informatics, Inc., Montréal) to build the chemical structures. More details about the dataset building are described at the results section.
Principal Component Analysis
Principal Component Analysis (PCA) was computed for the data collated to evaluate its chemical space. The scikit-learn (0.22.2)29 PCA algorithm was used to reduce the extended connectivity fingerprints (ECFP6) fingerprints from 2048 bits to 2 or 3 dimensions. Molecular fingerprints were generated from the cheminformatics library RDkit (2020.03.1) (http://www.rdkit.org).
Murcko scaffold and clustering analysis
A scaffold analysis was performed to evaluate the structural diversity of the data collated. First, Murcko scaffolds were generated with the open source software DataWarrior30, then PCA was used to reduce the ECFP6 dimensionality to 2 dimensions as described above. Scaffolds in which frequency was greater than 1 were plotted with size proportional to its frequency, and colored according to the number of active molecules. To evaluate the structural diversity, the molecules were clustered with a similarity threshold of 0.8 with the DataWarrior30 software.
Assay Central®
Assay Central® (AC) has been described previously at length19,26–34. Briefly, AC employs a series of rules for the detection and correction of problem data, such as deletion of salts and low molecular weight molecules, mixtures and chemical depiction errors, leading to a high-quality data set that can be used to build machine learning models. The curated YFV ChEMBL datasets were applied to build Bayesian models using ECFP6 descriptors and 5-fold cross validation. For predictions, AC workflows assigned probability-like and applicability scores to the input compounds according to a user-specified model selection. The prediction score is a probability-like value of the compound being active at the modeled target, whereas the applicability is a measure of overlap with the training data. Molecules whose prediction score is greater than 0.5 are considered to be predicted active and molecules with a higher applicability score are deemed more reliable predictions.
Machine learning algorithm comparison
Several machine learning models (rf, svm, k-nearest neighbors (knn), Bernoulli naïve Bayesian (bnb), AdaBoosted decision trees (ada) and deep neural network of three layers (DNN)) were generated to evaluate how different algorithms would perform in classifying new compounds for YF activity. These methods were applied to the same training data, binarized to the same threshold as described in the results section using ECFP6 as descriptors. While AC initially prepared the training data, the scikit-learn library was used to build, tune and validate the models, the ECFP6 fingerprints were generated with the cheminformatics library RDkit (2020.03.1). The hyperparameters were tuned with grid search and 5-fold cross validation; optimization and description for all algorithms have been described in our earlier publications.18,31,32
Model performances were evaluated by metrics from both training and external test data validations. The performance of each machine learning method was compared using different statistical metrics in both training data, with 5-fold cross validation, as well as prediction accuracy for the external test data. The metrics used were: specificity, recall, precision, F1-score, accuracy, Cohen’s Kappa (CK), Mathew’s correlation coefficient (MCC) and area under receiver operating characteristic curve (AUC).
Virtual Screening
In order to prioritize compounds for testing, we performed virtual screening of our in-house compound library (264 cpds) as well as three commercial libraries: MicroSource (MicroSource Discovery Systems Inc, Connecticut) (2553 cpds), Prestwick (Prestwick Chemical Libraries) (1515 cpds) and Enamine Antiviral (Enamine, New Jersey) (3533 cpds). After evaluating multiple machine learning methods, all these compound libraries, totaling 7865 compounds, were predicted with the best three models (defined by better overall score with different metrics in the external test evaluation, comparing only methods with AUC, MCC and CK higher than 0.70, 0.3 and 0.3 respectively). Then, a consensus prediction was used where only molecules predicted active with all the three models were selected for purchase and in-vitro testing.
Compounds
Paroxetine, Cinoxacin, Ezetimibe, SB202190 were purchased from MedChemExpress (Monmouth Junction, NJ). Compound 11626003 was synthesized as described below (Scheme 1).
Scheme 1.

Synthesis of 11626003.
[[(4-fluorophenyl)amino](methylthio)methylene]malononitrile 2.
A solution of [bis(methylthio)methylene]malononitrile (10 mmol) and 4-fluoroanilyne (11 mmol) in 30 ml of ethanol was refluxed for 2.5 hours, the reaction mixture was treated with 100 ml of cold water. Formed precipitate was filtered off, washed with water and dried. The final product was recrystallized from ethanol. Yield of [[(4-fluorophenyl)amino](methylthio)methylene]malononitrile is 51%. Mass (EI), m/z (Irelat.(%)): 234.2658 [M]+ (76). C11HFN3S. 1H NMR (DMSO-d6): 2.43 (s, 3H, SCH3), 6.72 (s, 2H, 2CH), 7.10 (br s, 1H, NH), 7.31 (s, 2H, 2CH) ppm.
3-amino-5-[(4-fluorophenyl)amino]-1H-pyrazole-4-carbonitrile 3.
A suspension of [[(4-fluorophenyl)amino](methylthio)methylene]malononitrile (10 mmol) in 20 ml of ethanol was treated by hydrazine hydrate (20 mmol) at 0 °C, sustained at room temperature for 1 hour and reflux for 6 hours. The reaction mixture was treated with 100 ml of cold water. Formed precipitate was filtered off, washed well with water and dried. The final product was recrystallized from ethanol. Yield 76%. Mass (EI), m/z (Irelat.(%)): 218.2026 [M]+ (52). C10H8FN5. 1H NMR (DMSO-d6): 5.83 (br s, 1H, NH2), 7.15 (br s, 1H, NH), 7.28 (s, 2H, 2CH), 8.35 (s, 2H, 2CH) ppm.
N-{4-cyano-5-[(4-fluorophenyl)amino]-1H-pyrazol-3-yl}naphthalene-2-sulfonamide 11626003.
A solution of 3-amino-5-[(4-fluorophenyl) amino]-1H-pyrazole-4-carbonitrile (10 mmol) in 10 ml of pyridine was treated with solid naphthalene-2-sulfonyl chloride (11 mmol) at room temperature and refluxed for 2 hours. The reaction mixture was diluted with 100 ml of cold water. Formed precipitate was filtered off, washed well with water and dried. The final product was recrystallized from isopropanol. Yield 54%. Mass (EI), m/z (Irelat.(%)): 408.4221 [M]+ (37). C20H14FN5O2S. 1H NMR (DMSO-d6) δ 8.82 (s, 1H, NH), 8.74 (s, 1H, H-1), 8.25 (d, J = 7.8 Hz, 1H, H-5), 8.20 (d, J = 8.8 Hz, 1H, H-4), 8.06 (d, J = 7.9 Hz, 1H, H-8), 7.88 (d, J = 8.8 Hz, 1H, H-3), 7.81 – 7.71 (m, 2H, 2 t H-6 and H-7), 7.68 (s, 2H, NHPh, NH), 7.49 (dd, J = 8.9, 4.8 Hz, 2H, H-2‘, H-6‘), 7.07 (t, J = 8.9 Hz, 2H, H3‘, H-5‘) ppm (Figure S1). 13С NMR (DMSO-d6) δ 159.06, 156.08, 154.34, 153.08, 136.96, 135.10, 132.44, 131.37, 130.04, 129.89, 129.81, 129.58, 128.18, 127.99, 121.70, 119.19, 119.04, 115.24, 114.81, 112.55 and 65.21 ppm (Figure S2).
Inhibition assays in Huh7 cells
The inhibition assays were performed through the NIAID In Vitro Assessment for Antimicrobial Activity program. Four-concentration cytopathic effect (CPE) inhibition assays were performed. Confluent or near-confluent cell culture monolayers in 96-well disposable microplates were prepared. Huh7 cells were maintained in MEM or DMEM supplemented with FBS as required for each cell line. For antiviral assays the same medium was used but with FBS reduced to 2% or less and supplemented with 50μg/ml gentamicin. The test compound was prepared at four log10 final concentrations, 0.1, 1.0, 10, and 100 μg/ml or μM. Controls for the experiment consisted of six microwells that were infected (virus controls) and six that were untreated (cell controls). In parallel, Infergen was tested as a positive control drug using the same method applied for test compounds. The assay was initiated by first removing growth media from the 96-well plates of cells. Afterwards, the test compound was applied in 0.1 ml volume to wells at 2X concentration. The YFV 17D strain, normally at <100 50% cell culture infectious doses (CCID50) in 0.1 ml volume, was placed in those wells designated for virus infection. Medium devoid of virus was placed in toxicity control wells and cell control wells. Virus control wells were treated similarly with virus. Plates were incubated at 37°C with 5% CO2 until maximum CPE was observed microscopically in virus control wells. The plates were then stained with 0.011% neutral red for approximately two hours at 37°C in a 5% CO2 incubator. The neutral red medium was removed by complete aspiration, and the cells rinsed 1X with phosphate buffered solution (PBS) to remove residual dye. The PBS was completely removed, and the incorporated neutral red was eluted with 50% Sorensen’s citrate buffer/50% ethanol for at least 30 minutes. Neutral red dye penetrates into living cells, thus, the more intense the red color, the larger the number of viable cells present in the wells. The dye content in each well was quantified using a 96-well spectrophotometer at 540 nm wavelength. The dye content in each set of wells was converted to a percentage of dye present in untreated control wells. Both EC50 and CC50 concentrations were calculated by linear regression analysis of the data obtained. The quotient of CC50 divided by EC50 gives the selectivity index (S.I) value.
RESULTS
Data Curation
From the ChEMBL database, 20 cell-based assays of 643 molecules tested against YFV were collated (Table S1) and after cleaning and merging of identical compounds led to a set of 548 compounds (provided as a Supplemental file in SMILES format). The activity distribution is shown in Figure 1A: at least 60% of the molecules are inactive (EC50 ≥ 100 μM) with only 12% showing EC50 values of 0-20 μM. Most assays used BHK cells measuring antiviral activity with cytopathic effect assays.
Figure 1.
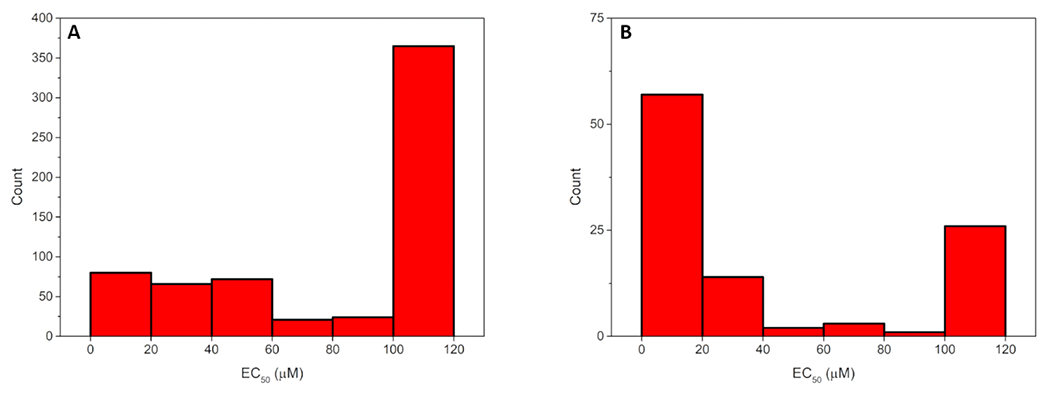
YFV EC50 distribution of data collated from ChEMBL (A) and the literature (B), respectively.
From the PubMed database, 16 papers with YFV cell-based assays were collated resulting in 100 compounds (Table S2). After merging of identical compounds, the data was reduced to 98 compounds. The activity distribution is shown in Figure 1B: at least 50% of the molecules have EC50 values between 0-20 μM. Most assays used Vero cells measuring antiviral activity with cytopathic effect assays.
Chemical Property Space and Scaffold Analysis
Due to the small number of screening campaigns for YFV, most data found are structure-activity relationship studies from lead compounds. Clustering the ChEMBL data by a similarity limit of 0.8, the data is reduced from 548 molecules to only 152 cluster representatives, while for the literature data from 98 to 33. The same occurs for Murcko scaffolds, with only 156 and 41 found in the ChEMBL and literature data, respectively. So, despite the high number of molecules collated from ChEMBL and literature, the small number of clusters and scaffolds found highlight the limited chemical diversity of the data (Figure 2 and 3).
Figure 2.

ChEMBL YFV data scaffold analysis. Murcko scaffolds were calculated and the ECFP6 descriptor was used as a 2048 bit array. The descriptor was reduced to two dimensions with PCA. The size of each scaffold is proportional to its frequency in the data set, whereas the color is proportional to the number of active molecules that have the scaffold.
Figure 3.

PCA of YFV ChEMBL (red) and literature (grey) molecules with ECFP6 descriptors. Percentage of explained variance by each component: PCA1 (19.40%), PCA2 (7.15%), PCA3 (6.55%).
In order to assess the bioactivity distribution, the average of active molecules within each scaffold was taken. First, molecules were considered active if had EC50 < 80 μM. Most active scaffolds are small with a frequency of 1-4 molecules and have similar positions in the PCA plot (Figure 2). There are 11 total active scaffolds (scaffolds with only active molecules) and 25 with active percentage between 0-1, which suggests scaffolds with both active and inactive molecules. If we change the active threshold to EC50 < 6.7 μM, the number of active scaffolds decreases, as well as those scaffolds with both active/inactive molecules. Consequently, most compounds are weak inhibitors or inactive, with more potent compounds sharing similar structures and positions in the PCA plot.
The PCA with three components of both ChEMBL and literature data using ECFP6 as descriptors reached a total explained variance of 33% (Figure 3). We can see that the distribution is not broad but restricted to specific regions where molecules are clustered together. Most of the literature and ChEMBL data lies together, thus, the model performance using both datasets were evaluated in a similar chemical space. The main disadvantage of the low diversity shown by the data collated, is that the model applicability will be restricted to molecules within this narrow chemical space, reducing the number of molecules that could be predicted with a high reliability.
Dataset building
The data collated from both ChEMBL and literature showed a high imbalance of potent compounds as well as a small chemical diversity (Figure 1 and 3). In order to increase the diversity of the active class, and reduce the imbalance of active/inactive instances, the training dataset was built with the ChEMBL data using a high threshold for classification of bioactivity. Molecules whose EC50 value was higher than 80 μM or had a S.I equal to 1 (EC50 equal to CC50) were considered inactive. Therefore, after the threshold classification, the training set consisted of 121/427 molecules in the active and inactive class, respectively.
The literature data was used to build an external test set, to evaluate how the machine learning models would perform with data outside of the training dataset. Due to the high similarity, the molecules were clustered to reduce the external test set redundancy. First, all molecules were clustered with a similarity threshold of 0.7 in DataWarrior30. Afterwards, each cluster representative compound was used to build the external test set, molecules were classified as active if had EC50 lower than 10.0 μM. The final external test set consisted of 15/15 molecules in the active and inactive class.
Machine Learning
The training performance was different according to the machine learning method used. All methods except ada had similar scores, with only metrics such as AUC, precision and recall having a difference greater than 0.1 between different methods (Table 1A).
Table 1.
Performance statistics of different YFV machine learning models in both training (A) and external test (B) data.
| A) | ACC | AUC | Kappa | MCC | Pr | Recall | Sp | F1 |
|---|---|---|---|---|---|---|---|---|
| AC | 0.83 | 0.87 | 0.56 | 0.57 | 0.59 | 0.77 | 0.84 | 0.67 |
| rf | 0.83 | 0.77 | 0.53 | 0.53 | 0.62 | 0.65 | 0.88 | 0.63 |
| knn | 0.85 | 0.77 | 0.56 | 0.57 | 0.69 | 0.62 | 0.92 | 0.65 |
| svm | 0.82 | 0.81 | 0.55 | 0.56 | 0.57 | 0.80 | 0.83 | 0.66 |
| bnb | 0.85 | 0.75 | 0.54 | 0.55 | 0.70 | 0.58 | 0.93 | 0.63 |
| ada | 0.83 | 0.68 | 0.43 | 0.45 | 0.70 | 0.41 | 0.95 | 0.52 |
| DNN | 0.85 | 0.76 | 0.55 | 0.56 | 0.70 | 0.61 | 0.92 | 0.64 |
| B) | ACC | AUC | Kappa | MCC | Pr | Recall | Sp | F1 |
| AC | 0.73 | 0.77 | 0.46 | 0.48 | 0.81 | 0.60 | 0.86 | 0.69 |
| rf | 0.66 | 0.71 | 0.33 | 0.33 | 0.70 | 0.60 | 0.73 | 0.64 |
| knn | 0.56 | 0.66 | 0.13 | 0.15 | 0.62 | 0.33 | 0.80 | 0.43 |
| svm | 0.66 | 0.82 | 0.33 | 0.36 | 0.62 | 0.86 | 0.46 | 0.72 |
| bnb | 0.70 | 0.82 | 0.40 | 0.40 | 0.75 | 0.60 | 0.80 | 0.66 |
| ada | 0.50 | 0.51 | 0.00 | 0.00 | 0.50 | 0.26 | 0.73 | 0.34 |
| DNN | 0.60 | 0.74 | 0.20 | 0.20 | 0.61 | 0.53 | 0.66 | 0.57 |
Abbreviations: ACC = Accuracy, AUC = Area Under Receiver Operating Characteristic Curve, Kappa = Cohen’s Kappa, MCC = Mathews Correlation Coefficient, Pr = Precision, Sp = Specificity, F1 = F1-score, AC = Assay Central® (Bayesian), rf = random forest, knn = k-nearest neighbors, svm = support vector machine, bnb = Bernoulli naïve bayes, ada = AdaBoosted decision trees, DNN = deep neural network.
Although the performance was similar in the training set, there was a clear difference in external validation (Table 1B). Considering all metrics used for evaluation, the best methods in external validation were svm, rf and naïve bayes-based classifiers (e.g., AC and bnb), followed by DNN, while knn and ada performed the worst. knn is a basic algorithm that does not work well with high dimensional data such as the sparse fingerprint array.33 Therefore, even though the method had good statistics in the training data, the low scores in the external evaluation shows that the method was not able to classify molecules outside the training data. ada is a method known to be sensitive to noisy data, since some molecules are similar but belong to different classes, the method cannot distinguish the important features that correctly classify them as active/inactive.34
Although DNN generally outperforms the other methods in several tasks, when dealing with a small dataset its performance can be similar or even worse as seen here. In summary , the results are in agreement with our and others previous machine learning studies applied to drug discovery, where the best methods are usually svm, rf or bayesian algorithms.32,35–37
The three methods with the highest overall score in the external evaluation were svm, AC and bnb. The values of AUC (0.77-0.82), MCC (0.36-0.48) and CK (0.33-0.46), show that those methods were able to predict and distinguish the active/inactive classes of compounds outside the training data with a reliability, higher than random guess, and slightly better than other methods evaluated. Besides, the similar F1 values (0.66-0.72), shows that despite the difference in precision and recall, the harmonic mean between the two metrics is similar for the best three models.
Considering the best performance of AC, bnb and svm in predicting compounds outside the training data, with higher values of AUC, MCC and CK than other methods, they were used to virtually screen different chemical libraries available to us in order to prioritize compounds for in vitro testing.
Virtual Screening
Consensus modelling has been widely used to minimize prediction errors in virtual screening campaigns.38–40 Herein, we applied the best three models (e.g. AC, bnb and svm; Table 1) to prioritize new molecules with consensus prediction. By combining these models, we aim to increase the chances of identifying active compounds.
From the 7865 compounds virtually screened, 142 were predicted active. Five molecules were then selected from the top 20 compounds ranked according to their AC prediction score. The selection criteria used was: molecules with previous antiviral activity reported (Ezetimibe41,42 and SB20219043), an FDA approved drug (paroxetine), a new synthetic compound (11626003) and a randomly selected compound (cinoxacin). Table 2 shows the molecules predicted active with all the three models and prioritized for testing; the applicability, a measure of the molecule overlap with the training data, was generated from AC predictions. We also identified the most similar molecules in the training set for each of these 5 molecules (Table S3). The computational method we have used was a ligand-based approach, therefore, it is expected that the predicted active molecules share some similarities with the active molecules of the training data. All five molecules prioritized for testing have some chemical groups or scaffolds similar to active molecules in the training data, for instance, most of them shares a fluorobenzene, 1,3-benzodioxoles or sulfonamides, all groups that are also present in active molecules of the training data. Therefore, despite having different pharmacophores, they all share some fragments of active molecules, as expected, since machine learning algorithms use the fingerprint space to define what features contribute or not to the active class.
Table 2.
Compounds prioritized for in vitro testing
| Molecule | Name | Applicability |
|---|---|---|

|
Paroxetine | 0.62 |

|
Cinoxacin | 0.61 |

|
Ezetimibe | 0.52 |

|
11626003 | 0.53 |

|
SB202190 | 0.73 |
Antiviral activity assays of predicted compounds
The compounds predicted with machine learning models were tested for antiviral activity against YFV infection in cell-based assays with Huh7 cell lines. From the five compounds, only 11626003 had significant antiviral activity, with an EC50 of 3.2 and 3.3 μM in visual and neutral red cytopathic effect assays, respectively (Table 3). The compound cytotoxicity was also evaluated with both visual and neutral red assays, resulting in CC50 values of 24 and 11 μM, respectively; therefore, the S.I for each assay was 7.5 and 3.3. Infergen® was used as positive control with EC50 < 0.01 ng/ml and CC50 > 10 ng/ml.
Table 3.
In vitro antiviral screening results in Huh7 cells, using YFV (strain 17D).
| Compound | EC50 (μM) (Visual/Neutral Red) |
CC50 (μM) (Visual/Neutral Red) |
S.I (Visual/Neutral Red) |
|---|---|---|---|
| 11626003 | 3.2 / 3.3 | 24 / 11 | 7.5 / 3.3 |
| Paroxetine | >3.2 / >3.1 | 3.2 / 3.1 | 0 |
| Ezetimibe | >32 / >29 | 32 / 29 | 0 |
| Cinoxacin | >100 / >100 | >100 / >100 | 0 |
| SB202190 | >100 / >100 | >100/ >100 | 0 |
DISCUSSION
Although flavivirus drug discovery has made advances in recent years, studies have tended to focus on Dengue and Zika infections with YFV being neglected.44 To our knowledge, there are no other machine learning studies applied specifically for YF drug discovery to date. Rajput and Kumar developed a regression model with data for many different flaviviruses available in ChEMBL, including YFV; however, only svm and rf algorithms were used to build the regression models and the YFV data in the training set was small when compared to the other flaviviruses.45 In order to expand the use of machine learning in drug discovery for YFV, in the current study a database was curated with cell-based inhibition assays available in ChEMBL and literature. These data were used to train and evaluate different machine learning models that could classify new compounds as active or inactive. The best validated machine learning models (after evaluation of an external test set, Table 1B) were used to prioritize compounds for testing by virtually screening several different commercial libraries.
The data dependence of machine learning is one of the main limitations in drug discovery for different diseases and targets. Most applications of machine learning are with diseases where datasets in the order of hundreds to thousands of molecules can be found, leaving behind diseases where data is relatively scarce, such as YFV.46,47 Nevertheless, even in small datasets, there is sufficient information that can be extracted with machine learning and used to subsequently propose new molecules.
The data collated for YFV however has some limitations such as, a very small percentage of the dataset with low EC50 (Figure 1) and a larger number of similar compounds or analogs (Figures 2 and 3). Despite the dataset issues, machine learning models could be built with reasonable statistics following external validation. AC and bnb, both Bayesian methods, had the highest AUC (0.82) and desirable metrics when predicting molecules outside the training data (Table 1B). The naïve bayes algorithm has been widely used for predicting bioactivity and ADME properties of new molecules for different targets and diseases.39,48–50 The small amount of training data required to estimate the test set and the ability to deal with irrelevant features, explain the successful use of these methods in the YFV dataset. In addition to that, the Bayesian algorithm also seems rather successful with different imbalanced datasets.49,51
The discovery of a novel hit compound 11626003 with the machine learning models we have developed shows that even for non-ideal datasets, information from the data available can be used to build models that can assist the discovery and optimization of new compounds. However, it should be noted that since predictions from machine learning models are limited to their training chemical property space, all molecules predicted generally need to be within the applicability domain in order to guarantee the prediction reliability.52 Therefore, even good machine learning models trained with small datasets will have the disadvantage of being reliable only in predictions within their small chemical space.
An important metric to evaluate the performance and reliability of a model is the hit rate (percentage of predicted molecules that are actually bioactive). In our study, 142 molecules were predicted active. Since only 5 compounds were tested (due to limited testing capabilities), with one being bioactive, we can assure that the hit rate is at least 0.7%, similar to the usual HTS hit rates (0.1-1%). However, in order to properly calculate the hit rate, all compounds predicted must be tested in vitro, which could increase the value obtained. Nevertheless, the discovery of a single hit compound out of the 5 molecules tested (hit percentage of 20%), shows that the machine learning models obtained are good tools to prioritize and likely enrich compounds for in vitro testing, but more experiments are needed to verify the reliability of all predictions.
11626003 is a new pyrazolesulfonamide derivative with no previous antiviral activity reported. The low micromolar potency against YFV together with a hit-like scaffold, presents the opportunity for hit-to-lead optimization that can potentially improve its potency and cell viability, as the compound proved to be slightly cytotoxic with an S.I of 7.5 or 3.3 depending on assay type (Table 3). Further investigation of the target for this molecule are ongoing while preliminary data suggest the compound is not active against the protease or polymerase for YFV (data not shown). Sulfonamides are a well-known class of drugs with antiviral activity, for example there are recent articles for HBV,53 HIV,54 HCV53. The dearth of new molecules for YFV as well as very little current research activity provides a unique opportunity to pursue this hit further. With viral pandemics becoming more common in recent years,55 there is an urgent need for broad-spectrum antivirals,56 hence further studies with different viruses for this compound could evaluate if it can also be used in the development of a broad-spectrum antiviral. In addition, we will need to assess the in vitro ADME properties before performing maximum tolerated dose, pharmacokinetics studies and ultimately testing the in vivo efficacy of this molecule or analogs in an animal model infected with YFV. The same machine learning approach used here can be utilized for different flaviviruses in the future, such as Zika and Dengue, which could assist the discovery of broad-spectrum antivirals for this specific group of viruses.
Supplementary Material
Acknowledgements
We kindly acknowledge Dr. Mindy Davis and colleagues for assistance with antiviral testing services through NIAID and Dr. Alex M. Clark (Molecular Materials Informatics, Inc.) for Assay Central® support.
We kindly acknowledge NIH funding: R44GM122196-02A1 from NIGMS (PI – Sean Ekins), NIH NINDS: 1R01NS102164-01, RFBR 20-54-80006, and FAPESP funding 2013/07600-3 and 2019/25407-2 (PI – Glaucius Oliva). Collaborations Pharmaceuticals, Inc. has utilized the non-clinical and pre-clinical services program offered by the National Institute of Allergy and Infectious Diseases.
Abbreviations
- AC
Assay Central®
- rf
random forest
- knn
k-nearest neighbors
- svm
support vector machine
- bnb
Bernoulli naïve bayes
- ada
AdaBoost decision trees
- DNN
Deep neural networks
- YFV
yellow fever virus
- YF
yellow fever
Footnotes
Competing interests
S.E. is owner, and D.H.F., A.C.P, K.M.Z. and T.R.L. are employees of Collaborations Pharmaceuticals, Inc. All others have no competing interests. We have submitted a provisional patent on this molecule.
Data and Software Availability
The molecules used in the model are provided as a supplemental file. The software are available from the author upon written request.
The supporting data describing assay ID’s as well as molecules used in the YFV model are available free of charge via the Internet at http://pubs.acs.org.
References
- (1).Frierson JG The Yellow Fever Vaccine: A History. Yale J. Biol. Med 2010, 83, 77–85. [PMC free article] [PubMed] [Google Scholar]
- (2).Gaythorpe KA; Hamlet A; Jean K; Garkauskas Ramos D; Cibrelus L; Garske T; Ferguson N The Global Burden of Yellow Fever. Elife 2021, 10. [DOI] [PMC free article] [PubMed] [Google Scholar]
- (3).Monath TP; Vasconcelos PFC Yellow Fever. J. Clin. Virol 2015, 64, 160–173. [DOI] [PubMed] [Google Scholar]
- (4).Kuno G; Chang GJ; Tsuchiya KR; Karabatsos N; Cropp CB Phylogeny of the Genus Flavivirus. J. Virol 1998, 72, 73–83. [DOI] [PMC free article] [PubMed] [Google Scholar]
- (5).Collins ND; Barrett ADT Live Attenuated Yellow Fever 17D Vaccine: A Legacy Vaccine Still Controlling Outbreaks In Modern Day. Curr. Infect. Dis. Rep 2017, 19, 14. [DOI] [PMC free article] [PubMed] [Google Scholar]
- (6).Chan M Yellow Fever: The Resurgence of a Forgotten Disease. Lancet 2016, 387, 2165–2166. [DOI] [PubMed] [Google Scholar]
- (7).Possas C; Lourenço-de-Oliveira R; Tauil PL; Pinheiro F de P; Pissinatti A; Cunha R. V. da; Freire M; Martins RM; Homma A Yellow Fever Outbreak in Brazil: The Puzzle of Rapid Viral Spread and Challenges for Immunisation. Mem. Inst. Oswaldo Cruz 2018, 113, 1–12. [DOI] [PMC free article] [PubMed] [Google Scholar]
- (8).Ahmed QA; Memish ZA Yellow Fever from Angola and Congo: A Storm Gathers. Trop. Doct 2017, 47, 92–96. [DOI] [PubMed] [Google Scholar]
- (9).Julander JG; Morrey JD; Blatt LM; Shafer K; Sidwell RW Comparison of the Inhibitory Effects of Interferon Alfacon-1 and Ribavirin on Yellow Fever Virus Infection in a Hamster Model. Antiviral Res. 2007, 73, 140–146. [DOI] [PMC free article] [PubMed] [Google Scholar]
- (10).de Freitas CS; Higa LM; Sacramento CQ; Ferreira AC; Reis PA; Delvecchio R; Monteiro FL; Barbosa-Lima G; James Westgarth H; Vieira YR; Mattos M; Rocha N; Hoelz LVB; Leme RPP; Bastos MM; Rodrigues L, G. O.; M. Lopes CE; Queiroz-Junior CM; Lima CX; Costa VV; Teixeira MM; Bozza FA; Bozza PT; Boechat N; Tanuri A; Souza TML Yellow Fever Virus Is Susceptible to Sofosbuvir Both in Vitro and in Vivo. PLoS Negl. Trop. Dis 2019, 13, e0007072. [DOI] [PMC free article] [PubMed] [Google Scholar]
- (11).Julander JG; Bantia S; Taubenheim BR; Minning DM; Kotian P; Morrey JD; Smee DF; Sheridan WP; Babu YS BCX4430, a Novel Nucleoside Analog, Effectively Treats Yellow Fever in a Hamster Model. Antimicrob. Agents Chemother 2014, 58, 6607–6614. [DOI] [PMC free article] [PubMed] [Google Scholar]
- (12).Julander JG; Shafer K; Smee DF; Morrey JD; Furuta Y Activity of T-705 in a Hamster Model of Yellow Fever Virus Infection in Comparison with That of a Chemically Related Compound, T-1106. Antimicrob. Agents Chemother 2009, 53, 202–209. [DOI] [PMC free article] [PubMed] [Google Scholar]
- (13).DiMasi JA; Grabowski HG; Hansen RW Innovation in the Pharmaceutical Industry: New Estimates of R&D Costs. J. Health Econ 2016, 47, 20–33. [DOI] [PubMed] [Google Scholar]
- (14).Ganesan A; Barakat K Applications of Computer-Aided Approaches in the Development of Hepatitis C Antiviral Agents. Expert Opin. Drug Discov 2017, 12, 407–425. [DOI] [PubMed] [Google Scholar]
- (15).Macarron R; Banks MN; Bojanic D; Burns DJ; Cirovic DA; Garyantes T; Green DVS; Hertzberg RP; Janzen WP; Paslay JW; Schopfer U; Sittampalam GS Impact of High-Throughput Screening in Biomedical Research. Nat. Rev. Drug Discov 2011, 10, 188–195. [DOI] [PubMed] [Google Scholar]
- (16).Bhhatarai B; Walters WP; Hop CECA; Lanza G; Ekins S Opportunities and Challenges Using Artificial Intelligence in ADME/Tox. Nat. Mater 2019, 18, 418–422. [DOI] [PMC free article] [PubMed] [Google Scholar]
- (17).Chen H; Engkvist O; Wang Y; Olivecrona M; Blaschke T The Rise of Deep Learning in Drug Discovery. Drug Discov. Today 2018, 23, 1241–1250. [DOI] [PubMed] [Google Scholar]
- (18).Korotcov A; Tkachenko V; Russo DP; Ekins S Comparison of Deep Learning With Multiple Machine Learning Methods and Metrics Using Diverse Drug Discovery Data Sets. Mol. Pharm 2017, 14, 4462–4475. [DOI] [PMC free article] [PubMed] [Google Scholar]
- (19).Zhavoronkov A; Ivanenkov YA; Aliper A; Veselov MS; Aladinskiy VA; Aladinskaya AV; Terentiev VA; Polykovskiy DA; Kuznetsov MD; Asadulaev A; Volkov Y; Zholus A; Shayakhmetov RR; Zhebrak A; Minaeva LI; Zagribelnyy BA; Lee LH; Soll R; Madge D; Xing L; Guo T; Aspuru-Guzik A Deep Learning Enables Rapid Identification of Potent DDR1 Kinase Inhibitors. Nat. Biotechnol 2019, 37, 1038–1040. [DOI] [PubMed] [Google Scholar]
- (20).Franke L; Byvatov E; Werz O; Steinhilber D; Schneider P; Schneider G Extraction and Visualization of Potential Pharmacophore Points Using Support Vector Machines: Application to Ligand-Based Virtual Screening for COX-2 Inhibitors. J. Med. Chem 2005, 48, 6997–7004. [DOI] [PubMed] [Google Scholar]
- (21).Smusz S; Kurczab R; Satała G; Bojarski AJ Fingerprint-Based Consensus Virtual Screening towards Structurally New 5-HT6R Ligands. Bioorg. Med. Chem. Lett 2015, 25, 1827–1830. [DOI] [PubMed] [Google Scholar]
- (22).Wei Y; Li J; Qing J; Huang M; Wu M; Gao F; Li D; Hong Z; Kong L; Huang W; Lin J Discovery of Novel Hepatitis C Virus NS5B Polymerase Inhibitors by Combining Random Forest, Multiple e-Pharmacophore Modeling and Docking. PLoS One 2016, 11, e0148181. [DOI] [PMC free article] [PubMed] [Google Scholar]
- (23).Ekins S; Freundlich JS; Clark AM; Anantpadma M; Davey RA; Madrid P Machine Learning Models Identify Molecules Active against the Ebola Virus in Vitro. F1000Research 2015, 4, 1091. [DOI] [PMC free article] [PubMed] [Google Scholar]
- (24).Ekins S; Lage de Siqueira-Neto J; McCall L-I; Sarker M; Yadav M; Ponder EL; Kallel EA; Kellar D; Chen S; Arkin M; Bunin BA; McKerrow JH; Talcott C Machine Learning Models and Pathway Genome Data Base for Trypanosoma Cruzi Drug Discovery. PLoS Negl. Trop. Dis 2015, 9, e0003878. [DOI] [PMC free article] [PubMed] [Google Scholar]
- (25).Wicht KJ; Combrinck JM; Smith PJ; Egan TJ Bayesian Models Trained with HTS Data for Predicting β-Haematin Inhibition and in Vitro Antimalarial Activity. Bioorg. Med. Chem 2015, 23, 5210–5217. [DOI] [PMC free article] [PubMed] [Google Scholar]
- (26).Weidlich IE; Filippov IV; Brown J; Kaushik-Basu N; Krishnan R; Nicklaus MC; Thorpe IF Inhibitors for the Hepatitis C Virus RNA Polymerase Explored by SAR with Advanced Machine Learning Methods. Bioorg. Med. Chem 2013, 21, 3127–3137. [DOI] [PMC free article] [PubMed] [Google Scholar]
- (27).Singh H; Singh S; Singla D; Agarwal SM; Raghava GPS QSAR Based Model for Discriminating EGFR Inhibitors and Non-Inhibitors Using Random Forest. Biol. Direct 2015, 10, 10. [DOI] [PMC free article] [PubMed] [Google Scholar]
- (28).Gaulton A; Hersey A; Nowotka M; Bento AP; Chambers J; Mendez D; Mutowo P; Atkinson F; Bellis LJ; Cibrián-Uhalte E; Davies M; Dedman N; Karlsson A; Magariños MP; Overington JP; Papadatos G; Smit I; Leach AR The ChEMBL Database in 2017. Nucleic Acids Res. 2017, 45, D945–D954. [DOI] [PMC free article] [PubMed] [Google Scholar]
- (29).Varoquaux G; Buitinck L; Louppe G; Grisel O; Pedregosa F; Mueller A Scikit-Learn. GetMobile Mob. Comput. Commun 2015, 19, 29–33. [Google Scholar]
- (30).Sander T; Freyss J; von Korff M; Rufener C DataWarrior: An Open-Source Program For Chemistry Aware Data Visualization And Analysis. J. Chem. Inf. Model 2015, 55, 460–473. [DOI] [PubMed] [Google Scholar]
- (31).Lane TR; Foil DH; Minerali E; Urbina F; Zorn KM; Ekins S Bioactivity Comparison across Multiple Machine Learning Algorithms Using over 5000 Datasets for Drug Discovery. Mol. Pharm 2021, 18, 403–415. [DOI] [PMC free article] [PubMed] [Google Scholar]
- (32).Lane T; Russo DP; Zorn KM; Clark AM; Korotcov A; Tkachenko V; Reynolds RC; Perryman AL; Freundlich JS; Ekins S Comparing and Validating Machine Learning Models for Mycobacterium Tuberculosis Drug Discovery. Mol. Pharm 2018, 15, 4346–4360. [DOI] [PMC free article] [PubMed] [Google Scholar]
- (33).Kouiroukidis N; Evangelidis G The Effects of Dimensionality Curse in High Dimensional KNN Search. In 2011 15th Panhellenic Conference on Informatics; IEEE, 2011; pp 41–45. [Google Scholar]
- (34).Dietterich TG Experimental Comparison of Three Methods for Constructing Ensembles of Decision Trees: Bagging, Boosting, and Randomization. Mach. Learn 2000, 40, 139–157. [Google Scholar]
- (35).Russo DP; Zorn KM; Clark AM; Zhu H; Ekins S Comparing Multiple Machine Learning Algorithms and Metrics for Estrogen Receptor Binding Prediction. Mol. Pharm 2018, 15, 4361–4370. [DOI] [PMC free article] [PubMed] [Google Scholar]
- (36).Zorn KM; Lane TR; Russo DP; Clark AM; Makarov V; Ekins S Multiple Machine Learning Comparisons of HIV Cell-Based and Reverse Transcriptase Data Sets. Mol. Pharm 2019, 16, 1620–1632. [DOI] [PMC free article] [PubMed] [Google Scholar]
- (37).Lenselink EB; ten Dijke N; Bongers B; Papadatos G; van Vlijmen HWT; Kowalczyk W; IJzerman AP; van Westen GJP Beyond the Hype: Deep Neural Networks Outperform Established Methods Using a ChEMBL Bioactivity Benchmark Set. J. Cheminform 2017, 9, 45. [DOI] [PMC free article] [PubMed] [Google Scholar]
- (38).Neves BJ; Dantas RF; Senger MR; Melo-Filho CC; Valente WCG; de Almeida ACM; Rezende-Neto JM; Lima EFC; Paveley R; Furnham N; Muratov E; Kamentsky L; Carpenter AE; Braga RC; Silva-Junior FP; Andrade CH Discovery of New Anti-Schistosomal Hits by Integration of QSAR-Based Virtual Screening and High Content Screening. J. Med. Chem 2016, 59, 7075–7088. [DOI] [PMC free article] [PubMed] [Google Scholar]
- (39).Klon AE; Glick M; Davies JW Combination of a Naive Bayes Classifier with Consensus Scoring Improves Enrichment of High-Throughput Docking Results. J. Med. Chem 2004, 47, 4356–4359. [DOI] [PubMed] [Google Scholar]
- (40).Bourel M; Crisci C; Martínez A Consensus Methods Based on Machine Learning Techniques for Marine Phytoplankton Presence–Absence Prediction. Ecol. Inform 2017, 42, 46–54. [Google Scholar]
- (41).Osuna-Ramos JF; Reyes-Ruiz JM; Bautista-Carbajal P; Cervantes-Salazar M; Farfan-Morales CN; De Jesús-González LA; Hurtado-Monzón AM; del Ángel RM Ezetimibe Inhibits Dengue Virus Infection in Huh-7 Cells by Blocking the Cholesterol Transporter Niemann–Pick C1-like 1 Receptor. Antiviral Res. 2018, 160, 151–164. [DOI] [PubMed] [Google Scholar]
- (42).Lucifora J; Esser K; Protzer U Ezetimibe Blocks Hepatitis B Virus Infection after Virus Uptake into Hepatocytes. Antiviral Res. 2013, 97, 195–197. [DOI] [PubMed] [Google Scholar]
- (43).Johnson JC; Martinez O; Honko AN; Hensley LE; Olinger GG; Basler CF Pyridinyl Imidazole Inhibitors of P38 MAP Kinase Impair Viral Entry and Reduce Cytokine Induction by Zaire Ebolavirus in Human Dendritic Cells. Antiviral Res. 2014, 107, 102–109. [DOI] [PMC free article] [PubMed] [Google Scholar]
- (44).Boldescu V; Behnam MAM; Vasilakis N; Klein CD Broad-Spectrum Agents for Flaviviral Infections: Dengue, Zika and Beyond. Nat. Rev. Drug Discov 2017, 16, 565–586. [DOI] [PMC free article] [PubMed] [Google Scholar]
- (45).Rajput A; Kumar M Anti-Flavi: A Web Platform to Predict Inhibitors of Flaviviruses Using QSAR and Peptidomimetic Approaches. Front. Microbiol 2018, 9, 3121. [DOI] [PMC free article] [PubMed] [Google Scholar]
- (46).Rifaioglu AS; Atas H; Martin MJ; Cetin-Atalay R; Atalay V; Doğan T Recent Applications of Deep Learning and Machine Intelligence on in Silico Drug Discovery: Methods, Tools and Databases. Brief. Bioinform 2019, 20, 1878–1912. [DOI] [PMC free article] [PubMed] [Google Scholar]
- (47).David L; Arús-Pous J; Karlsson J; Engkvist O; Bjerrum EJ; Kogej T; Kriegl JM; Beck B; Chen H Applications of Deep-Learning in Exploiting Large-Scale and Heterogeneous Compound Data in Industrial Pharmaceutical Research. Front. Pharmacol 2019, 10, 1–16. [DOI] [PMC free article] [PubMed] [Google Scholar]
- (48).Perryman AL; Stratton TP; Ekins S; Freundlich JS Predicting Mouse Liver Microsomal Stability with “Pruned” Machine Learning Models and Public Data. Pharm. Res 2016, 33, 433–449. [DOI] [PMC free article] [PubMed] [Google Scholar]
- (49).Clark AM; Dole K; Coulon-Spektor A; McNutt A; Grass G; Freundlich JS; Reynolds RC; Ekins S Open Source Bayesian Models. 1. Application to ADME/Tox and Drug Discovery Datasets. J. Chem. Inf. Model 2015, 55, 1231–1245. [DOI] [PMC free article] [PubMed] [Google Scholar]
- (50).Ekins S; Reynolds RC; Kim H; Koo M-S; Ekonomidis M; Talaue M; Paget SD; Woolhiser LK; Lenaerts AJ; Bunin BA; Connell N; Freundlich JS Bayesian Models Leveraging Bioactivity and Cytotoxicity Information for Drug Discovery. Chem. Biol 2013, 20, 370–378. [DOI] [PMC free article] [PubMed] [Google Scholar]
- (51).Clark AM; Ekins S Open Source Bayesian Models. 2. Mining a “Big Dataset” To Create and Validate Models with ChEMBL. J. Chem. Inf. Model 2015, 55, 1246–1260. [DOI] [PubMed] [Google Scholar]
- (52).Glavatskikh M; Leguy J; Hunault G; Cauchy T; Da Mota B Dataset’s Chemical Diversity Limits the Generalizability of Machine Learning Predictions. J. Cheminform 2019, 11, 69. [DOI] [PMC free article] [PubMed] [Google Scholar]
- (53).Vandyck K; Rombouts G; Stoops B; Tahri A; Vos A; Verschueren W; Wu Y; Yang J; Hou F; Huang B; Vergauwen K; Dehertogh P; Berke JM; Raboisson P Synthesis and Evaluation of N -Phenyl-3-Sulfamoyl-Benzamide Derivatives as Capsid Assembly Modulators Inhibiting Hepatitis B Virus (HBV). J. Med. Chem 2018, 61, 6247–6260. [DOI] [PubMed] [Google Scholar]
- (54).Kang D; Wang Z; Chen M; Feng D; Wu G; Zhou Z; Jing L; Zuo X; Jiang X; Daelemans D; De Clercq E; Pannecouque C; Zhan P; Liu X Discovery of Potent HIV-1 Non-Nucleoside Reverse Transcriptase Inhibitors by Exploring the Structure-Activity Relationship of Solvent-Exposed Regions I. Chem. Biol. Drug Des 2019, 93, 430–437. [DOI] [PubMed] [Google Scholar]
- (55).Morens DM; Fauci AS Emerging Pandemic Diseases: How We Got to COVID-19. Cell 2020, 182, 1077–1092. [DOI] [PMC free article] [PubMed] [Google Scholar]
- (56).Adalja A; Inglesby T Broad-Spectrum Antiviral Agents: A Crucial Pandemic Tool. Expert Rev. Anti. Infect. Ther 2019, 17, 467–470. [DOI] [PMC free article] [PubMed] [Google Scholar]
Associated Data
This section collects any data citations, data availability statements, or supplementary materials included in this article.