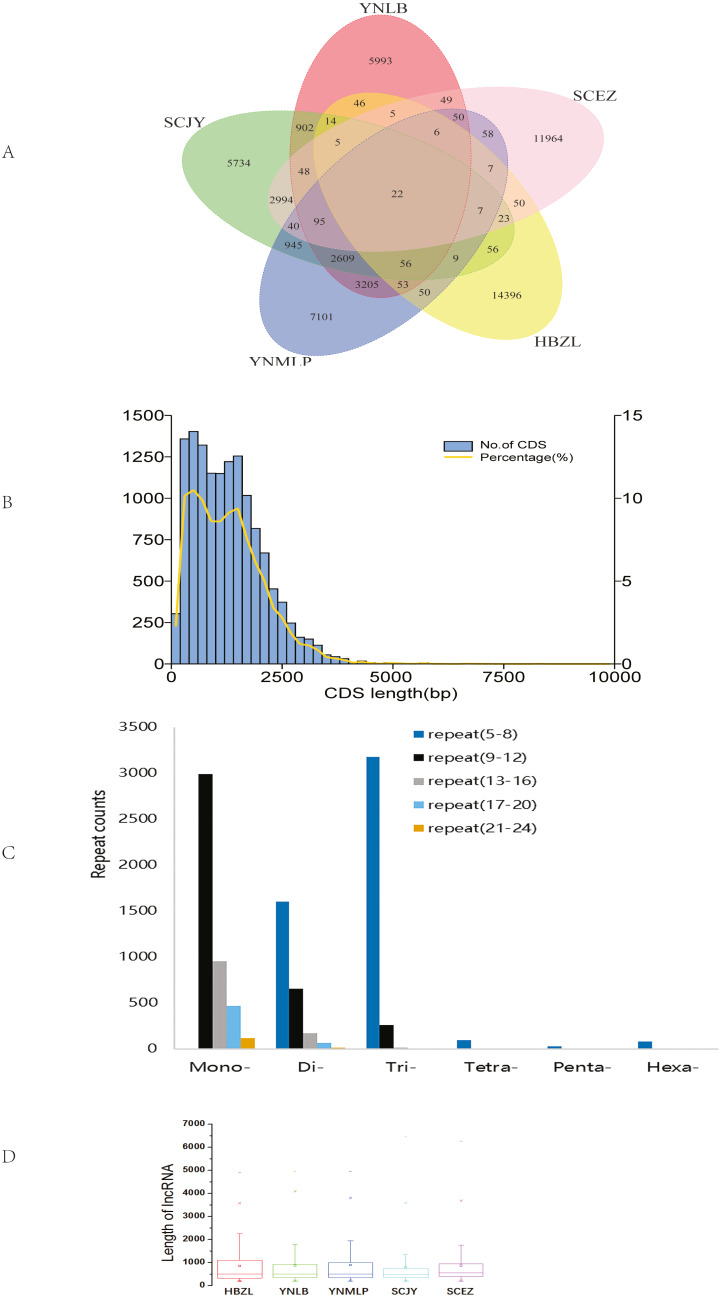
Figure 1. Data analyses of full-length Dichocarpum transcriptomes based on PacBio sequencing.
(A) Venn diagram showing the unique and common non-redundant transcripts among five Dichocarpum species. (B) CDS length distribution of D. basilare (SCJY). The other four species are similar. (C) SSR distribution of D. auriculatum (SCEZ). The other four species are similar. (D) Box plot showing the length of lncRNA. Boxes represent 25–75% of the data, middle lines the median, and the small boxes inside represent the average values; the ends represent the minimum and maximum values (1.5 times lesser or greater than the lower or upper quantiles); outliers greater than 1.5 times and thrice the spacing of quartile are indicated by “×” and “−”, respectively.

