

Abstract
A large number of genetic variations have been identified to be associated with Alzheimer’s disease (AD) and related quantitative traits. However, majority of existing studies focused on single types of omics data, lacking the power of generating a community including multi-omic markers and their functional connections. Because of this, the immense value of multi-omics data on AD has attracted much attention. Leveraging genomic, transcriptomic and proteomic data, and their backbone network through functional relations, we proposed a modularity-constrained logistic regression model to mine the association between disease status and a group of functionally connected multi-omic features, i.e. single-nucleotide polymorphisms (SNPs), genes and proteins. This new model was applied to the real data collected from the frontal cortex tissue in the Religious Orders Study and Memory and Aging Project cohort. Compared with other state-of-art methods, it provided overall the best prediction performance during cross-validation. This new method helped identify a group of densely connected SNPs, genes and proteins predictive of AD status. These SNPs are mostly expression quantitative trait loci in the frontal region. Brain-wide gene expression profile of these genes and proteins were highly correlated with the brain activation map of ‘vision’, a brain function partly controlled by frontal cortex. These genes and proteins were also found to be associated with the amyloid deposition, cortical volume and average thickness of frontal regions. Taken together, these results suggested a potential pathway underlying the development of AD from SNPs to gene expression, protein expression and ultimately brain functional and structural changes.
Keywords: Alzheimer’s disease, multi-omics analysis, modularity-constrained logistic regression, systems biology
1 Introduction
Alzheimer’s disease (AD) is a progressive and irreversible neurodegenerative disease characterized by gradual loss of memory and other cognitive functions. Older age is one of the most important risk factors for developing AD [14]. Based on this, the number of people aged 65 and older with AD is projected to reach 13.8 million [4]. Yet, our understanding of this complex disease is still very limited. Up to now, there is no clinically proved drugs to treat, slow down or prevent AD. Taken together, Alzheimer has become an urging public health crisis, which requires immediate attention and effort.
In the last decade, large-scale genome-wide association studies (GWASs) have tremendously advanced our understanding of AD. A large number of genetic variations [e.g. single-nucleotide polymorphism (SNP)] have been identified to be associated with AD and related quantitative traits, such as SNPs from APOE, TOMM40 and CLU genes [26]. Although enrichment analysis (e.g. on pathways, networks and gene ontologies) has been widely adopted to estimate their effect on the high-profile perturbations [2, 43, 47], the downstream biology through which they exert effect to the transcriptomic and proteomic levels and ultimately to the development of AD remains unknown.
Fast growing multi-omic data collected by large AD cohorts, like the Alzheimer’s Disease Neuroimaging Initiative (ADNI) [29] and the Religious Orders Study and Memory and Aging Project (ROS/MAP) [1], provides great opportunity for a deeper insight of the disease mechanism. Compared with single-omics data, multi-omic data (e.g. genotype, gene expression and protein expression) from coupled subjects are expected to have more power in capturing the characteristics of AD patients from multiple distinct yet connected perspectives. One common strategy to identify multi-omic markers is to examine each omics layer individually and then seek overlapped genetic markers across them [16]. For example, a gene is of particular interest if it contains risk genetic variant and its corresponding messenger RNA level and protein expression are both altered in patients. In this case, this gene is supported by evidences from multiple sources. Thus, it is less likely to be a false positive and will potentially serve as an ideal target for further experimental validation in the wet laboratory. However, due to the hidden biological interactions and environmental effects, biological system is so complicated that risk genetic variants in gene A do not necessarily co-occur with the expression change of gene A and its corresponding proteins. Therefore, it is more ideal to search for multi-omic markers (e.g. genetic variants, RNAs and proteins) with dense functional connections (e.g. forming a network module). Novel functionally connected biomarkers are recognized as potential key for the future therapeutic interventions [16, 20].
Leveraging the genotype, gene expression and protein expression data collected from the frontal cortex region in the ROS/MAP cohort, we proposed a modularity-constrained logistic regression model (M-Logistic) to identify functionally connected SNPs, genes and proteins predictive of AD status. In addition to different types of omics data, various biological networks capturing the functional relationships between SNPs, genes and proteins were collected, integrated and further incorporated into the model. On top of this, a new regularization term is introduced to enforce the modular structure of selected multi-omic features in the prior network. In other words, instead of individual features, this new method is expected to generate a list of multi-omic features that not only are predictive of disease status but also have dense functional connections as shown in the prior network. Tested on the real data collected in the ROS/MAP cohort, this new model yielded overall better prediction performance compared with other state-of-the-art methods. SNPs, genes and proteins selected by M-Logistic are more connected than those selected by other methods. In particular, we identified several trans-omic paths from SNPs to genes and proteins, suggesting that AD could be partially a result of genetic variations due to their cascade effect on the downstream transcriptomic and proteomic level. Upon further examination, these genes and proteins were found to be significantly associated with amyloid deposition, cortical volume and thickness of frontal cortex regions. Their brain-wide expression profiles in the Allen Human Brain Atlas (AHBA) are highly correlated with the brain activation patterns during vision tasks, a brain function partly controlled by frontal cortex [15, 28].
2 Methods
2.1 Study sample
All the data analyzed were obtained from the ROS and MAP. The ROS/MAP cohort was built by Rush University from religious communities to measure the progression of amnestic mild cognitive impairment (MCI, a prodromal stage of AD) to early probable AD. The combined ROS/MAP cohort includes around 600 participants under age 90, which constitute a very rich repository of multi-modal data, including GWAS data, whole-genome sequencing data, cognitive, behavioral and clinical data. The more detailed description could be found in [1]. In this paper, GWAS genotype data, quality-controlled RNA sequencing (RNA-Seq) gene expression and protein expression data collected from prefrontal cortex tissue inside the brain were downloaded. To perform the proposed joint analysis, only subjects with all three types of data were included. In total, we have 179 subjects with full set of data, including 77 cognitive normals (CNs), 46 MCIs and 56 AD patients. The detailed demographic information can be found in Table 1. We observed significantly higher female/male ratio in AD group, and AD patients are on average 3 years older than those in the CN group, consistent with existing findings that age and gender are two prominent risk factors for AD. For education years, although it has also been suspected as a confounding factor for AD, no significant difference was observed across diagnosis groups, possibly due to our small sample size.
Table 1.
Demographic information of the ROS/MAP participants included in this study
| Diagnosis | CN | MCI | AD |
|---|---|---|---|
| Subject Number | 77 | 46 | 56 |
| ROS/MAP | 47/30 | 19/27 | 28/28 |
| Male/Female | 35/42 | 21/25 | 22/34 |
| Education (mean ± std.) | 16.7 ± 3.2 | 16.8 ± 3.3 | 16.8 ± 3.7 |
| Age (mean ± std.) | 83.0 ± 4.5 | 84.6 ± 4.5 | 86.3 ± 3.5 |
2.2 GWAS genotype data preparation
ROS/MAP samples were genotyped on the Affymetrix GeneChip 6.0 platform [8]. Samples and SNPs of GWAS data were quality controlled with SNP call rate <95%, Hardy–Weinberg equilibrium test  in controls and minor allele frequency (MAF) <1%. After that, non-Hispanic Caucasian participants were selected by clustering with CEU (Utah residents with Northern and Western European ancestry from the Utah centre d'Etudes du polymorhisme humain (CEPH) collection) + TSI (Toscani in Italia) populations using HapMap 3 genotype data and the multi-dimensional scaling analysis [19]. Un-genotyped SNPs were imputed using Markov Chain framework for genotype imputation and haplotyping (MaCH) with 1000 Genomes Project as the reference panel [34]. Finally, we have the genotype data of 6 115 610 SNPs from 1709 subjects. All genotype data is coded as the number of minor alleles for the subsequent analysis.
2.3 RNA-Seq gene expression preparation
We downloaded the RNA-Seq gene expression data in the ROS/MAP cohort, which was collected from the prefrontal cortex tissue in the brain. The RNA-Seq data were reprocessed in parallel with other accelerating medicines partnership Alzheimer's disease (AMP-AD) RNA-Seq datasets. This second version, which is expected to have better quality, was downloaded for our subsequent analysis. The input data for the RNA-Seq reprocessing effort was aligned reads in bam files that were converted to fastq using the Picard SamToFastq function. Fastq files were re-aligned to the reference genome using STAR with twopassMode set as Basic. Gene counts were computed for each sample by STAR by setting quantMode as GeneCounts. These gene level counts further went through normalization and adjustment to remove the effects of relevant factors such as age, gender, education, batch, RNA integrity number and postmortem interval (PMI). Detailed reprocessing and normalization steps can be found in the AMP-AD knowledge portal (https://www.synapse.org/#!Synapse:syn9702085/). In total, we have the expression data of 15 582 genes from 632 subjects.
2.4 Protein expression data preparation
We downloaded the protein expression data from the same cohort, which was also collected from the prefrontal cortex tissue. Selected reaction monitoring (SRM) technique was used to quantify the proteins in the frozen tissue. The samples were prepared for liquid chromatography-selected reaction monitoring (LC-SRM) analysis using standard protocol [3, 35]. All the data were manually inspected to ensure correct peak assignment and peak boundaries. The abundance of endogenous peptides was quantified as a ratio to spiked-in synthetic peptides containing stable heavy isotopes. The “light/heavy” ratios were log2-transformed and shifted such that median log2-ratio is zero. Normalization was performed to adjust for differences in protein amounts between the samples. During that normalization, the log2-ratios were shifted for each sample to make sure the median is set at zero. Detailed processing steps can be found in the AMP-AD knowledge portal. Using the regression weights derived from the CN participants, peptide abundance data were further adjusted to remove the effects of age, gender, education, PMI and batch. Finally, we have the expression data of 186 peptides (corresponding to 126 unique genes) from 1227 subjects.
2.5 Selection of SNPs, genes and proteins
Given the difficulty of modeling all SNPs, genes and proteins, we narrowed down the total number of omics features by selecting only a subset of SNPs, genes and proteins with known functional connections. Considering that we have genome-wide genotype and transcriptome-wide gene expression data, the limited number of peptides measured made proteomic data a narrow bottleneck for the proposed integrative omics analysis. To address this problem, we took a bottom-up approach where proteins measured in the prefrontal cortex were used as seeds to select a subset of relevant SNPs and genes for subsequent analysis. As shown in Figure 1, in the proteomic layer, abundance level of 186 peptides, corresponding to 126 unique genes (gene set A), were measured in the ROS/MAP cohort. In the functional interaction network obtained from the REACTOME database, these 126 genes were found to interact with 954 genes (gene set B) and these interactions were all manually curated from known pathways [9]. Among these 1080 (126+954) candidate genes, 743 of them without missing RNA-seq data were included to represent the transcriptomic level. Of note, we did not further filter these genes based on their differential expression in AD. In the genomic level, we identified SNPs located on the upstream of these 743 genes within the boundary of 5K. To ensure the functional connection of selected SNPs and their downstream genes, we included only SNPs significantly affecting the transcription factor-binding activity, based on the single nucleotide polymorphisms to transcription factor binding sites (SNP2TFBS) database [25]. These relationships between SNPs, genes and proteins/peptides are used to build a trans-omic functional interaction network to guide the search of functionally connected features related to AD.
Figure 1 .
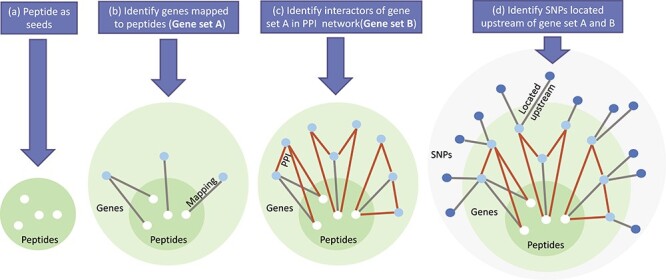
Major steps taken to pre-filter SNPs, genes and protein. (a) 186 peptides in the proteomic layer were used as seeds. (b) 186 peptides were mapped to 126 unique genes (gene set A). (c) 954 genes were found to interact with gene set A in Reactome functional protein interaction database. (d) For gene set A and B, we extract SNPs that are located within upstream 5K boundary and have potential effect on transcription factor binding activity according to SNP2TFBS database.
2.6 Prediction outcome
Extracted genotype, gene expression and protein expression data were used to classify AD patients from CNs. For all the participants included in this study, their final clinical diagnosis when the brain tissue was collected was used to indicate their disease status. Since the MCI participants in the ROS/MAP cohort were defined as nonsymptomatic group, we grouped MCI subjects with CNs so that we can have a relatively balanced case control dataset.
2.7 Modularity-constrained logistic regression
In this section, we denote matrices as boldface uppercase letters and vectors as boldface lowercase letters.  is a concatenated feature vector of genotype, gene expression and protein expression data for
  th subject, and
 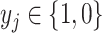 is the binary diagnosis status for
  th subject. Let
  be the predictors and
  be the binary disease status as outcome. The regression weight vector is denoted as
  , where
  is the bias.
Traditional logistic regression is a supervised machine learning model dedicated for classification tasks. It aims to classify two groups using a set of features. With the hypothesis  , where
 |
(1) |
It aims to find a  that can maximize the log-likelihood function as shown below:
 |
Later, to address the over-fitting problem,  norm was introduced into logistic regression as an extra penalty term as
 |
This additional  norm penalty minimizes the usual sum of the absolute values of the coefficients. With this constraint, minimizing the cost function is expected to select only a small set of relevant features without sacrificing the prediction performance. Compared with traditional logistic regression, where almost all features are considered to be outcome relevant, results from this constrained logistic regression are much easier to interpret. This
  norm penalty is particularly helpful when the predictors outnumbers the subjects/samples [33].
However, when dealing with a group of highly correlated features,  norm penalty will result in a random selection of features. That is, multiple runs of logistic regression on the same set of data will possibly generate different set of selected features, which presents challenges for replicating and interpreting the results.
To address this problem, it was proposed to incorporate both  and
and  norms together, known as elastic net penalty [10, 49]. Its penalized negative log-likelihood function is formulated as
 |
(2) |
where  indicate
  and
and  regularization, respectively. The
  norm is the sum of squared values of the coefficients. Compared with
  norm alone, its combination with
  norm (a.k.a, elastic net penalty) helps relax the sparsity constraint and encourage the selection of more correlated features.
Another strategy to handle the highly correlated predictors is to explicitly incorporate the correlation structure into the sparse prediction model. In this case, highly correlated features are encouraged to be selected/excluded together [13, 21, 23, 46]. One example is Graph Laplacian logistic using GraphNet penalty, where a graph  , indicating the correlation structure between predictors is used as a priori to guide the feature selection (Equation 3) [13].
 |
(3) |
Here,  is the corresponding Laplacian matrix of graph
  . With this constraint, pairs of features that are highly correlated in the prior network are expected to be selected or excluded together. Although this partly addressed the stability problem of feature selection, GraphNet penalty only accounts for the local topology information with a focus on pairwise similarity. For multi-omic analysis, this penalty may not be strong enough to enforce the dense functional connection of selected features in the prior network.
Inspired by the concept of network modularity [32], we propose a new modularity-constrained logistic regression (M-Logistic) that leverages a global network property to encourage the selection of a subnetwork rather than individual features scattered across the prior network. Given the trans-omic network capturing the functional relationships between SNPs, genes and proteins, we formulate it as a graph and its corresponding adjacency matrix is denoted as  . The modularity matrix is denoted as
  , where
  [32]. It evaluates whether the number of links between nodes
  and
and  is significantly more than expected.
  and
and  are the degrees of the
  th and
  th node in the prior network, and
  is the total number of links in the network. Following [7, 17], we propose a new penalty term as
  to impose a modular structure in the selected features. Here, <> is the Frobenius inner product defined by
  . Maximizing the Frobenius inner product between
  and the modularity matrix
  encourages the selection of features with dense functional connections in the prior multi-omic network. Taken together, the objective function of our new modularity-constrained logistic regression model is formulated as in Equation 4,
 |
(4) |
With the modified quadratic regularization term, this model aims to find functionally connected omics markers. Here,  and
and  are the parameters that control and balance the contribution from two regularization terms. Note that the objective function in Equation 4 is not convex because the modularity matrix
  used in
  is indefinite. To make
  negative-definite, we introduced an auxiliary function where
  is replaced by
  and
and  is the absolute maximum eigenvalue of
  .
.
This new model can be solved using a modified coordinate descent method. Following the algorithm in [10], which was originally proposed to solve Equation 2, a coordinate descent step can be taken to solve the proposed objective function. The gradient of Equation 4 at  is calculated as
 |
Similarly as in [10], we applied the iterative reweighted least squares method [18] to update the the regression weights as shown below:
 |
(5) |
Here,  is the soft-thresholding operator and is defined as
 |
On top of this, we introduced an iterative procedure to solve the objective function (Equation 4). The procedure stops when it satisfies a predefined stopping criterion. Algorithm 1 shows the pseudocode of the M-Logistic algorithm.
Algorithm 1: The M-Logistic algorithm

2.7.1 Parameter Tuning
Due to the limited number of samples, we performed nested 10-fold cross-validation (CV) to tune the parameters, where samples were split into training, validation and test datasets. More specifically, in each outer loop, 161 participants were selected as training and validation datasets and the rest 18 samples were kept as test dataset. In each inner loop, 90% of 161 participants were used to train the model and the rest 10% were used to validate the performance. For each fold, the portion of AD and CN participants was kept the same. We performed the grid search method, and hyperparameters that yielded best prediction performance on the validation dataset were selected as optimal parameters.
3 Result
3.1 Performance comparison with competing methods
We compared the performance of our proposed model with random forest and three state-of-the-art logistic-based classification models, using GraphNet, elastic net and Lasso as penalty terms, respectively. We focused on these three sparse logistic regression models because they can perform classification and feature selection at the same time. Classic classification models, such as support vector machine (SVM) and random forest, can not select outcome-relevant features, and therefore are not included for comparison. We denote our proposed modularity-constrained logistic model as M-Logistic, GraphNet-constrained logistic model as G-Logistic, elastic net-constrained logistic model as Elastic Logistic and Lasso-constrained logistic model as Lasso Logistic. Elastic Logistic and traditional Logistic regression with L1 norm were both implemented using glmnet R package. To provide an unbiased comparison of performance for each method, partition of subjects during the CV procedure was kept identical for all methods. After comparing the predicted labels and actual labels of all test subjects, prediction accuracy was calculated and used to compare the performance across different methods.
The prediction performance of all five methods on test dataset is shown in Table 2. We observed that, across all 10-fold, M-Logistic largely outperforms all other state-of-the-art logistic regression models. For the rest, it yielded the second best performance. G-Logistic model achieved overall similar classification accuracy as M-Logistic. Without the guidance of explicit data correlation structure, Elastic Logistic, random forest and Lasso Logistic models are not as accurate as other methods. Particularly, Lasso Logistic model gives the worst average prediction performance, which is expected considering its lack of power in handling correlated features. The same experiment was repeated with 5-fold nested CV, in which M-Logistic yielded classification accuracy around 78% on test dataset and still greatly outperformed other competing methods (Supplementary Table 1). It is worth noting that this performance is only based on a small set of functionally connected SNPs, genes and proteins, the number of which was further limited because of the bottleneck in protein data of the ROS/MAP cohort. Therefore, the classification performance shown here can not reflect the true predictive power of these three types of multi-omic data, which is expected to be much higher if more data is available.
Table 2.
Performance comparison on test set between M-Logistic and other methods
| fold 1 | fold 2 | fold 3 | fold 4 | fold 5 | fold 6 | fold 7 | fold 8 | fold 9 | fold 10 | Mean | |
|---|---|---|---|---|---|---|---|---|---|---|---|
| M-Logistic | 0.7059 | 0.7222 | 0.8333 | 0.8333 | 0.7222 | 0.7778 | 0.7222 | 0.7778 | 0.7222 | 0.7222 | 0.7539 |
| G-Logistic | 0.6471 | 0.7222 | 0.8333 | 0.7778 | 0.6667 | 0.7059 | 0.7222 | 0.8333 | 0.7778 | 0.6667 | 0.7353 |
| Elastic Logistic | 0.7059 | 0.6111 | 0.7778 | 0.8333 | 0.6667 | 0.7222 | 0.8333 | 0.7778 | 0.6667 | 0.6667 | 0.7262 |
| Random Forest | 0.7059 | 0.7222 | 0.7222 | 0.7778 | 0.6667 | 0.7778 | 0.7222 | 0.6667 | 0.6667 | 0.7778 | 0.7206 |
| Lasso Logistic | 0.7647 | 0.7222 | 0.7222 | 0.7222 | 0.6667 | 0.6667 | 0.7222 | 0.6667 | 0.6111 | 0.5000 | 0.6765 |
3.2 Functional connections between selected multi-omic features
For feature selection, M-Logistic identified around 305 features predictive of disease status, which appeared in ¿6-fold, including 74 SNPs, 173 genes and 58 proteins. Similarly, G-Logistic identified 147 frequently selected omics features. Elastic Logistic and Lasso Logistic identified 543 and 11 omics features, respectively. When mapped to the prior functional connectivity network, features selected by G-Logistic scatters across the network with few connections (Supplementary Figure 1), which suggests that the local topology information used in GraphNet penalty is not strong enough to form subnetwork structure among selected features. For Lasso Logistic, no functional interaction were found among those 11 frequently selected features. For Elastic Logistic, its selected multi-omic features are largely connected to each other in the prior network (Supplementary Figure 2). Multi-omic features selected by random forest also have a few functional connections surrounding MAPT and APP proteins, but are not as well connected as those selected by M-Logistic and Elastic-Logistic models (Supplementary Figure 3).
Out of 305 multi-omic features (74 SNPs, 173 genes and 58 proteins) selected by at least 6-fold in M-Logistic, 116 of them were found to have connections in the prior network and the rest were not directly connected with any other selected features. Shown in Figure 2 were all the subnetworks where 116 connected features were mapped back to the prior network. Size of each node was made proportional to the number of their connected edges. We observed three big subnetworks with ¿10 nodes. The largest connected network component involves 30 multi-omic features with 30 edges, including 5 SNPs, 20 genes and 5 proteins. The rest of the connected features mostly form small subnetworks, ranging in size from two to three. These features, as well as those not connected ones, are found predictive yet not well functionally connected, possibly due to the fact that they are false positives or their functional connections have not been previously studied yet.
Figure 2 .

116 connected features selected by M-Logistic were mapped to the prior network..
Since we are particularly interested in the multi-omic features that can potentially reveal the underlying functional mechanism of AD, in the subsequent sections, we focus on the 30 multi-omic features in the largest connected subnetwork, which are not only predictive of disease status but also functionally connected with strong evidence from prior knowledge (i.e. supported by existing findings).
In the largest subnetwork, we observed multiple trans-omic paths from SNPs to genes and then proteins, e.g. from rs2147471 to NCSTN gene and APP protein. Note that these SNPs were extracted from upstream of their connected genes and has significant effect on the transcription factor-binding activity. Thus, these SNPs are very likely to have an influence on the expression of their connected genes. Also, the functional interaction between genes and proteins are curated from the REACTOME pathways with direction information (e.g. activation and inhibition). Therefore, in this network, genes have a regulatory role toward the expression of their connected proteins. Taken together, these trans-omic paths suggest that development of AD can partly be a result of genetic variations (i.e. SNPs) due to their cascade effect on the expression of downstream genes, which further regulate the protein expression.
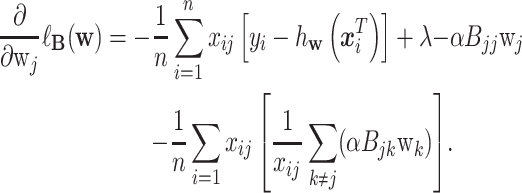
3.3 Association between degree and regression weights
Hub genes are known to be likely disease-associated genes. Therefore, features with higher degree in the identified subnetworks are expected to be more important with higher absolute regression weights. Therefore, we further examined the correlation between degree of selected multi-omic features and their absolute regression weights derived from M-Logistic. For the 30 omics features in the largest subnetwork, the average Pearson’s correlation between node degree and absolute weight is 0.5 across 10-fold (Figure 3). When we excluded the features with degree  , the average correlation across 10-fold increases significantly to 0.69. This indicates that the importance of identified multi-omic features is more proportional to their degree only when they have many known interactions in the prior network. Upon further examination, we observed that features with high degree have medium to high absolute regression weights, whereas features with low degree can have very small or very high weights. This is possibly due to the fact that their low degree may be a result of few functional interaction or few known interaction. That is, some genes/proteins may have interaction with many others but have not been previously studied much, leading to their low degree in the prior network. Therefore, the importance of those low-degree features is less determined than that of the hub ones.
Figure 3 .
Pearson's correlation coefficients between the absolute regression weight obtained from M-Logistic across 10 folds and node degree. Left: correlation is calculated using all selected features. Right: correlation is calculated using a subset of selected features with degree ≥ 3. Red: node degree obtained from the complete prior network. Blue: node degree obtained from the sub-network of selected features.
It is also worth noting that this strong correlation between degree and absolute regression weights was only observed using the subnetwork connecting selected features by M-Logistic, i.e. Figure 2. That is, the degree of selected features is calculated after removing those features with zero regression weights and their edges from prior network. The degree from the complete prior network is not as strongly correlated with the absolute regression weights. The correlation averages to 0.14 for all nodes across 10-fold and 0.12 for nodes with degree  (Figure 3). This suggests that the degree information in the prior network may not be indicative of the features’ importance. Hub genes only become important when many of their neighbors are also related to the disease.
3.4 Expression quantitative trait loci (eQTL) analysis of frequently selected SNPs
eQTL mapping is a widely used tool for identifying genetic variants that affect gene regulation [11]. SNPs significantly associated with gene expression are named as eQTLs. Details of the eQTL analysis can be found in [39]. For five SNPs in the largest subnetwork, we examined whether they are eQTLS with potential regulatory role in the downstream transcriptomic level in the Brain eQTL Almanac (BRAINEAC) database [39]. This database provides the association between SNPs and gene expression tested on 10 brain tissues of 134 neuropathologically confirmed control individuals of European descent. We focused on the frontal cortex brain region, where our gene and protein expression data were collected from. For five SNPs in the largest subnetwork, four of them (i.e. rs1886419, rs12413321, rs2147471 and rs3766382) were found to be eQTLs in the frontal cortex tissue (false discovery rate (FDR)-corrected  ).
).
3.5 Pathway enrichment analysis
For 20 genes, 5 proteins and 5 SNPs in the largest connected subnetwork, we performed pathway enrichment analysis using the Kyoto Encyclopedia of Genes and Genomes (KEGG) database [22]. The enrichment analysis was performed using EnrichR web server [6]. In total, 73 pathways were found to be significantly enriched by our gene/protein set, with corrected  -value ¡ 0.05 (Supplementary Table 1). Shown in Figure 4 was top 10 enriched KEGG pathways with smallest
  -values after correction. Top significant pathways include AD, pathways in cancer and a few unexpected pathways involved with virus infection, e.g. hepatitis B and human immunodeficiency virus 1 infection. Though not traditionally known to be associated with AD, these virus infection pathways have been increasingly reported in recent AD studies. For example, results from a recent study focusing on microglia-specific expression changes suggested a potential role of hepatitis B in the Alzheimer’s brain [27]. In a racially diverse old population, cytomegalovirus infection was found to be associated with an increased risk of AD and a faster rate of cognitive decline [5].
Figure 4 .

Top 10 pathways enriched by genes and proteins in the largest sub-network, ranked by -log10(p).
3.6 Association with brain function
Since the gene and protein expression data were collected from frontal cortex tissue, we further investigated whether identified genes and proteins were associated with any function of frontal cortex region using Neurosynth [45]. This platform takes thousands of published articles reporting the results of functional magnetic resonance imaging (fMRI) studies and performs large-scale, automated synthesis of fMRI data. For each of 1340 brain function terms, NeuroSynth provide an activation brain map by integrating the findings from related publications. After mapping proteins to genes, 20 unique genes were identified. For each of them, we performed individual query in the Neurosynth platform to identify its brain-wide gene expression profile [45], which is collected from the AHBA [42]. We then decoded these brain-wide gene expression profiles by comparing them with the brain activation map of 1340 brain function terms using Pearson’s correlation. Ultimately, we found the brain function term ‘vision’ to be highly correlated with most genes (Figure 5). Particularly, for PRKCB and APP, their brain-wide expression profiles are found to be highly correlated with the ‘vision’ activation map ( ), a brain function term known to be impaired in AD, in MCI and in individuals with cognitive complaints who do not have performance deficits [12, 31, 40].
Figure 5 .

The correlation between brain activation map of ``vision'' and the brain wide expression profile of 20 genes in the largest sub-network.
Although frontal cortex has been a traditionally disregarded brain region in vision, recent studies observed the activation of frontal cortex in specialized vision tests, which attributed the brain’s focusing ability [38]. Prefrontal cortex is known to help compress the visual space before eye movements [48]. More specifically, the exact location where the brain tissue is collected, dorsal lateral prefrontal cortex, is also having a role in vision, i.e. making eye movement at a memorized location and producing sequences eye movements [36]. Other top brain function terms enriched by these 20 genes are ‘information retrieval’, ‘recognition’, ‘memory’, all of which are well-known cognitive functions impaired in AD patients [45].
3.7 Association with neuroimaging phenotype
In addition to brain function, we also examined the association of those 20 genes in the largest subnetwork with neuroimaging phenotype of frontal regions. We downloaded the amyloid deposition, volume and thickness measures of six bilateral frontal cortex regions from the ADNI cohort (Figure 6) [30]. These measurements were extracted from AV45 positron emission tomography (PET) imaging and structural MRI imaging scans. Preprocessed and quality-controlled data were readily available (https://loni.usc.edu) . Using the regression weight derived from CNs, amyloid deposition data were preadjusted with baseline age, gender and education as covariates. Intracranial volume was applied as an additional covariate for cortical volume and average thickness. Finally, we have the amyloid deposition, cortical volume and average thickness measures for six bilateral frontal cortex regions, i.e. in total, 36 neuroimaging phenotypes. After extracting SNPs from those 20 genes and their upstream region (boundary: 5K), we performed the targeted association analysis between 8833 SNPs and those 36 neuroimaging phenotypes using PLINK [37].
Figure 6 .

Six bilateral frontal cortex regions in the ADNI cohort with amyloid deposition, cortical volume and average thickness data. Left: ventral view. Top right: lateral view. Bottom right: medial view.
Shown in Figure 7 is the heatmap for the FDR-corrected significance of each association. SNPs from CASP8 are mostly associated with the amyloid deposition of the frontal area. In contrast, SNPs from PRKCQ, PRKCB and CTNNA1 largely contribute to the changes in cortical volume and thickness, but not amyloid deposition. APP is the only gene with SNPs associated with both amyloid deposition and cortical thickness, but in different frontal regions. It is also worth noting that identified genetic association is not bilaterally symmetric, i.e. most SNPs are associated with the phenotype from either left hemisphere or right hemisphere, but not both. This is as expected considering the hemispheric asymmetry in both brain function and structure [24].
Figure 7 .

The association of SNPs from 20 genes in the largest sub-network with the phenotypes from 6 frontal cortex regions, including amyloid deposition (Left Panel), cortical volume (Middle Panel) and average thickness (Right Panel). Top panel is for left brain and bottom panel is for right brain. The color inside the heatmap indicates the -log10 transformed p-value (FDR corrected) of each association. Significant associations with corrected p ≤ 0.05 are highlighted with star.
4 Conclusion
We proposed a new modularity-constrained logistic model to jointly analyze genotype, gene expression and protein expression data for identification of functionally connected omics features related to AD. The newly introduced penalty term maximizes the global modularity of selected features in the prior network and encourages the selection of multi-omic features forming network modules. With this new penalty term, M-Logistic is advantageous in that features can be selected either because they are predictive of AD themselves or because they are closely connected with other predictive ones in the prior network. Compared with the GraphNet penalty that enforces local pairwise similarity, modularity-based penalty helps identify features with significantly improved functional connectivity. In particular, we found that some features form trans-omic paths from SNP to gene and then protein. This suggests that AD may be partly a result of genetic variation due to their potential cascade effect on the downstream transcriptome and proteome level. AD is the most significant pathway enriched by the genes and proteins identified by M-Logistic model. Although gene and protein expression data were collected from frontal cortex, AD-related genes identified by M-Logistic were found to be associated with both function and structure of frontal cortex. Taken together, it indicates a potential pathway underlying the development of AD from SNPs to gene expression, protein expression and ultimately brain functional and structural changes.
Despite the promising findings, this integrative omics approach is not capable in handling missing data, like many existing multi-view prediction models. It requires the genotype, gene expression and protein expression data collected from same set of subjects. As a result, a large portion of subjects had to be excluded. Also, this type of multi-omic data is still very limited, particularly in the brain tissues. We can hardly validate these findings using data from independent cohorts for now. This limitation can be addressed by solving the missing data problem. Small pieces of missing data can be imputed using methods such as singular value decomposition [41] and matrix completion [44]. In case of subjects with large chunk of missing data, one possible solution is to examine two types of data at a time to maximize the number of available subjects. However, none of these strategies will work in case of missing entire omics type. For example, for disease research, most projects are small scale and only collect one or two types of omics data. Our next step is to further improve this model to enable the integrative analysis of multi-omics data from decoupled subjects. In this case, we can leverage the omics data collected from different projects, which will give us access to more samples for external validation. , ,
Key Points
The proposed model enables jointly analyze genotype, gene expression and protein expression data and identification of functionally connected omics features related to disease.
Our method selected omics features that form trans-omic paths from SNP to gene and then protein, when evaluated on an Alzheimer dataset. This suggests that Alzheimer may be partly a result of genetic variation due to their potential cascade effect on the downstream transcriptome and proteome level.
SNPs and genes selected to be predictive of AD are associated with changes in both brain structure and function.
Supplementary Material
Acknowledgments
The results published here are in whole or in part based on data obtained from the AMP-AD Knowledge Portal. Study data were provided by the Rush Alzheimer’s Disease Center, Rush University Medical Center, Chicago. Data collection was supported through funding by NIA (grants P30AG10161, R01AG15819, R01AG17917, R01AG30146, R01AG36836, U01AG32984, U01AG46152), the Illinois Department of Public Health and the Translational Genomics Research Institute.
Linhui Xie is a graduate student in the Department of Electrical and Computer Engineering, Indiana University Purdue University Indianapolis, USA.
Bing He is a graduate student in the Department of BioHealth Informatics, School of Informatics and Computing, Indiana University Purdue University Indianapolis, USA.
Pradeep Varathan is a graduate student in the Department of BioHealth Informatics, School of Informatics and Computing, Indiana University Purdue University Indianapolis, USA.
Kwangsik Nho is an associate professor in the Department of Radiology and Imaging Sciences, Indiana University School of Medicine, USA.
Shannon L. Risacher is an assistant professor in the Department of Radiology and Imaging Sciences, Indiana University School of Medicine, USA.
Andrew J. Saykin is a professor in the Department of Radiology and Imaging Sciences, Indiana University School of Medicine, USA.
Paul Salama is a professor in the Department of Electrical and Computer Engineering, Indiana University Purdue University Indianapolis, USA.
Jingwen Yan is an assistant professor in the Department of BioHealth Informatics, School of Informatics and Computing, Indiana University Purdue University Indianapolis, USA.
Footnotes
Contributor Information
Linhui Xie, Department of Electrical and Computer Engineering, Indiana University Purdue University Indianapolis, 420 University Blvd, Indianapolis, IN 46204, USA.
Bing He, Department of BioHealth Informatics, Indiana University Purdue University Indianapolis, 420 University Blvd, Indianapolis, IN 46204, USA.
Pradeep Varathan, Department of BioHealth Informatics, Indiana University Purdue University Indianapolis, 420 University Blvd, Indianapolis, IN 46204, USA.
Kwangsik Nho, Department of Radiology and Imaging Sciences, Indiana University School of Medicine, IN 46204, USA.
Shannon L Risacher, Department of Radiology and Imaging Sciences, Indiana University School of Medicine, IN 46204, USA.
Andrew J Saykin, Department of Radiology and Imaging Sciences, Indiana University School of Medicine, IN 46204, USA.
Paul Salama, Department of Electrical and Computer Engineering, Indiana University Purdue University Indianapolis, 420 University Blvd, Indianapolis, IN 46204, USA.
Jingwen Yan, Department of BioHealth Informatics, Indiana University Purdue University Indianapolis, 420 University Blvd, Indianapolis, IN 46204, USA; Department of Radiology and Imaging Sciences, Indiana University School of Medicine, IN 46204, USA.
Data Availability
The source code is available through GitHub (https://github.com/linhui701/Modularity-Logistic) . Multi-omic data used in this analysis is from the ROS/MAP project and is available after application through the AMP-AD knowledge portal (https://adknowledgeportal.synapse.org).
5 Authors’ Contributions
L.X.: conceptualization, methodology, visualization, formal analysis, validation, writing—original draft, writing review and editing. B.H.: investigation, visualization, formal analysis. P.V.: conceptualization, visualization. S.R.: data curation, writing—review and editing. K.N.: data curation, writing—review and editing. A.S.: data curation, resource, writing—review and editing. P.S.: methodology, supervision. J.Y.: conceptualization, methodology, visualization, writing—original draft, writing review and editing, supervision, funding acquisition.
Funding
This research was supported by National Institutes of Health (grants R01 LM013463, R21 AG066135, R01 EB022574, R01 AG019771, P30 AG010133), and by National Science Foundation (grants CRII 1755836, CAREER 1942394).
Conflict of interest
The authors declare that they have no conflict of interests.
References
- 1. Bennett DA, Schneider JA, Arvanitakis Z, et al. Overview and findings from the religious orders study. Curr Alzheimer Res 2012; 9(6): 628–45. [DOI] [PMC free article] [PubMed] [Google Scholar]
- 2. Alexeyenko A, Lee W, Pernemalm M, et al. Network enrichment analysis: extension of gene-set enrichment analysis to gene networks. BMC bioinformatics 2012; 13(1): 226. [DOI] [PMC free article] [PubMed] [Google Scholar]
- 3. Andreev VP, Petyuk VA, Brewer HM, et al. Label-free quantitative lc–ms proteomics of alzheimer’s disease and normally aged human brains. J Proteome Res 2012; 11(6): 3053–67. [DOI] [PMC free article] [PubMed] [Google Scholar]
- 4. Alzheimer’s Association, et al. alzheimer’s disease facts and figures. Alzheimer’s & Dementia 2018, 2018; 14(3): 367–429. [Google Scholar]
- 5. Barnes LL, Capuano AW, Aiello AE, et al. Cytomegalovirus infection and risk of alzheimer disease in older black and white individuals. J Infect Dis 2015; 211(2): 230–7. [DOI] [PMC free article] [PubMed] [Google Scholar]
- 6. Bindea G, Mlecnik B, Hackl H, et al. Cluego: a cytoscape plug-in to decipher functionally grouped gene ontology and pathway annotation networks. Bioinformatics 2009; 25(8): 1091–3. [DOI] [PMC free article] [PubMed] [Google Scholar]
- 7. Chan YK, Yeung D-Y. A convex formulation of modularity maximization for community detection. In: Twenty-Second International Joint Conference on Artificial Intelligence, 2011.
- 8. De Jager PL, Shulman JM, Chibnik LB, et al. A genome-wide scan for common variants affecting the rate of age-related cognitive decline. Neurobiol Aging 2012; 33(5): 1017–e1. [DOI] [PMC free article] [PubMed] [Google Scholar]
- 9. Fabregat A, Jupe S, Matthews L, et al. The reactome pathway knowledgebase. Nucleic acids research 2018; 46(D1): D649–55. [DOI] [PMC free article] [PubMed] [Google Scholar]
- 10. Friedman J, Hastie T, Tibshirani R. Regularization paths for generalized linear models via coordinate descent. J Stat Softw 2010; 33(1): 1. [PMC free article] [PubMed] [Google Scholar]
- 11. Gilad Y, Rifkin SA, Pritchard JK. Revealing the architecture of gene regulation: the promise of eqtl studies. Trends Genet 2008; 24(8): 408–15. [DOI] [PMC free article] [PubMed] [Google Scholar]
- 12. Gilmore GC, Groth KE, Thomas CW. Stimulus contrast and word reading speed in alzheimer’s disease. Exp Aging Res 2005; 31(1): 15–33. [DOI] [PubMed] [Google Scholar]
- 13. Grosenick L, Klingenberg B, Katovich K, et al. Interpretable whole-brain prediction analysis with graphnet. Neuroimage 2013; 72:304–21. [DOI] [PubMed] [Google Scholar]
- 14. Guerreiro R, Bras J. The age factor in alzheimer’s disease. Genome Med 2015; 7(1): 1–3. [DOI] [PMC free article] [PubMed] [Google Scholar]
- 15. Halstead Ward C. Brain and intelligence; a quantitative study of the frontal lobes. 1947.
- 16. Hasin Y, Seldin M, Lusis A. Multi-omics approaches to disease. Genome Biol 2017; 18(1): 83. [DOI] [PMC free article] [PubMed] [Google Scholar]
- 17. Hildebrand Roland. Identification of community structure in networks with convex optimization arXiv preprint arXiv:0806.1896, 2008.
- 18. Holland PW, Welsch RE. Robust regression using iteratively reweighted least-squares. Communications in Statistics-theory and Methods 1977; 6(9): 813–27. [Google Scholar]
- 19. Horgusluoglu-Moloch E, Nho K, Risacher SL, et al. Targeted neurogenesis pathway-based gene analysis identifies adora2a associated with hippocampal volume in mild cognitive impairment and alzheimer’s disease. Neurobiology of aging 2017; 60:92–103. [DOI] [PMC free article] [PubMed] [Google Scholar]
- 20. Huang S, Chaudhary K, Garmire LX. More is better: recent progress in multi-omics data integration methods. Front Genet 2017; 8:84. [DOI] [PMC free article] [PubMed] [Google Scholar]
- 21. Jacob L, Obozinski G, Vert J-P. Group lasso with overlap and graph lasso. In: Proceedings of the 26th annual international conference on machine learning. ACM, 2009, 433–40. [Google Scholar]
- 22. Kanehisa M, Goto S. Kegg: kyoto encyclopedia of genes and genomes. Nucleic Acids Res 2000; 28(1): 27–30. [DOI] [PMC free article] [PubMed] [Google Scholar]
- 23. Kim S, Xing EP, et al. Tree-guided group lasso for multi-response regression with structured sparsity, with an application to eqtl mapping. The Annals of Applied Statistics 2012; 6(3): 1095–117. [Google Scholar]
- 24. Kong X-Z, Mathias SR, Guadalupe T, et al. Thompson, Clyde Francks, et al. Mapping cortical brain asymmetry in 17,141 healthy individuals worldwide via the enigma consortium. Proceedings of the National Academy of Sciences 2018; 115(22): E5154–63. [DOI] [PMC free article] [PubMed] [Google Scholar]
- 25. Kumar S, Ambrosini G, Bucher P. Snp2tfbs–a database of regulatory snps affecting predicted transcription factor binding site affinity. Nucleic Acids Res 2016; 45(D1): D139–44. [DOI] [PMC free article] [PubMed] [Google Scholar]
- 26. Lambert J-C, Ibrahim-Verbaas CA, Harold D, et al. Meta-analysis of 74,046 individuals identifies 11 new susceptibility loci for alzheimer’s disease. Nat Genet 2013; 45(12): 1452–8. [DOI] [PMC free article] [PubMed] [Google Scholar]
- 27. Mastroeni D, Nolz J, Sekar S, et al. Laser-captured microglia in the alzheimer’s and parkinson’s brain reveal unique regional expression profiles and suggest a potential role for hepatitis b in the alzheimer’s brain. Neurobiol Aging 2018; 63:12–21. [DOI] [PMC free article] [PubMed] [Google Scholar]
- 28. Miller EK, Cohen JD. An integrative theory of prefrontal cortex function. Annu Rev Neurosci 2001; 24(1): 167–202. [DOI] [PubMed] [Google Scholar]
- 29. Mueller SG, Weiner MW, Thal LJ, et al. The alzheimer’s disease neuroimaging initiative. Neuroimaging Clinics 2005; 15(4): 869–77. [DOI] [PMC free article] [PubMed] [Google Scholar]
- 30. Mueller SG, Weiner MW, Thal LJ, et al. Ways toward an early diagnosis in alzheimer’s disease: the alzheimer’s disease neuroimaging initiative (adni). Alzheimer’s & Dementia 2005; 1(1): 55–66. [DOI] [PMC free article] [PubMed] [Google Scholar]
- 31. Murphy C. Olfactory and other sensory impairments in alzheimer disease. Nat Rev Neurol 2019; 15(1): 11–24. [DOI] [PubMed] [Google Scholar]
- 32. Mark EJ. Newman. Modularity and community structure in networks. Proc Natl Acad Sci 2006; 103(23): 8577–82. [DOI] [PMC free article] [PubMed] [Google Scholar]
- 33. Ng Andrew Y. On feature selection: learning with exponentially many irreverent features as training examples. PhD thesis, Massachusetts Institute of Dent Tech, 1998. [Google Scholar]
- 34. Nho K, Corneveaux JJ, Kim S, et al. Whole-exome sequencing and imaging genetics identify functional variants for rate of change in hippocampal volume in mild cognitive impairment. Mol Psychiatry 2013; 18(7): 781. [DOI] [PMC free article] [PubMed] [Google Scholar]
- 35. Petyuk VA, Qian W-J, Smith RD, et al. Smith Mapping protein abundance patterns in the brain using voxelation combined with liquid chromatography and mass spectrometry Methods. 2010; 50(2): 77–84. [DOI] [PMC free article] [PubMed] [Google Scholar]
- 36. Pouget P. The cortex is in overall control of ‘voluntary’eye movement. Eye 2015; 29(2): 241–5. [DOI] [PMC free article] [PubMed] [Google Scholar]
- 37. Purcell S, Neale B, Todd-Brown K, et al. Plink: a tool set for whole-genome association and population-based linkage analyses. The American journal of human genetics 2007; 81(3): 559–75. [DOI] [PMC free article] [PubMed] [Google Scholar]
- 38. Rahnev D, Nee DE, Riddle J, et al. Causal evidence for frontal cortex organization for perceptual decision making. Proc Natl Acad Sci 2016; 113(21): 6059–64. [DOI] [PMC free article] [PubMed] [Google Scholar]
- 39. Ramasamy A, Trabzuni D, Guelfi S, et al. Cookson, et al. Genetic variability in the regulation of gene expression in ten regions of the human brain. Nat Neurosci 2014; 17(10): 1418–28. [DOI] [PMC free article] [PubMed] [Google Scholar]
- 40. Risacher SL, WuDunn D, Pepin SM, et al. Visual contrast sensitivity in alzheimer’s disease, mild cognitive impairment, and older adults with cognitive complaints. Neurobiol Aging 2013; 34(4): 1133–44. [DOI] [PMC free article] [PubMed] [Google Scholar]
- 41. Schneider T. Analysis of incomplete climate data: Estimation of mean values and covariance matrices and imputation of missing values. J Climate 2001; 14(5): 853–71. [Google Scholar]
- 42. Shen EH, Overly CC, Jones AR. The allen human brain atlas: comprehensive gene expression mapping of the human brain. Trends Neurosci 2012; 35(12): 711–4. [DOI] [PubMed] [Google Scholar]
- 43. Subramanian A, Tamayo P, Mootha VK, et al. Gene set enrichment analysis: a knowledge-based approach for interpreting genome-wide expression profiles. Proceedings of the National Academy of Sciences 2005; 102(43): 15545–50. [DOI] [PMC free article] [PubMed] [Google Scholar]
- 44. Thung K-H, Wee C-Y, Yap P-T, et al. Neurodegenerative disease diagnosis using incomplete multi-modality data via matrix shrinkage and completion. Neuroimage 2014; 91:386–400. [DOI] [PMC free article] [PubMed] [Google Scholar]
- 45. Tal Yarkoni RA, Poldrack TE, Nichols DC, et al. Large-scale automated synthesis of human functional neuroimaging data. Nat Methods 2011; 8(8): 665–70. [DOI] [PMC free article] [PubMed] [Google Scholar]
- 46. Yuan L, Liu J, Ye J. Efficient methods for overlapping group lasso. In: Advances in Neural Information Processing Systems, 2011, 352–60.
- 47. Qi Z, Wang X-J. Goeast: a web-based software toolkit for gene ontology enrichment analysis. Nucleic Acids Res 2008; 36(suppl_2): W358–63. [DOI] [PMC free article] [PubMed] [Google Scholar]
- 48. Zirnsak M, Steinmetz NA, Noudoost B, et al. Visual space is compressed in prefrontal cortex before eye movements. Nature 2014; 507(7493): 504–7. [DOI] [PMC free article] [PubMed] [Google Scholar]
- 49. Zou H, Hastie T. Regularization and variable selection via the elastic net. J R Stat Soc Series B Stat Methodology 2005; 67(2): 301–20. [Google Scholar]
Associated Data
This section collects any data citations, data availability statements, or supplementary materials included in this article.
Supplementary Materials
Data Availability Statement
The source code is available through GitHub (https://github.com/linhui701/Modularity-Logistic) . Multi-omic data used in this analysis is from the ROS/MAP project and is available after application through the AMP-AD knowledge portal (https://adknowledgeportal.synapse.org).