Dear Editor,
1.
Klebsiella pneumoniae (K. pneumoniae, Kpn) bloodstream infection (BSI) has a considerable prevalence and high mortality worldwide. 1 , 2 , 3 The emergence of carbapenem‐resistant BSI‐Kpns, especially those with hypervirulence, poses a challenge for BSI‐Kpn control worldwide. 4 , 5 , 6 We conducted a large‐scale multicenter epidemiological study and in‐depth genomic analysis of BSI‐Kpns in China, describing a complete molecular epidemiological picture (clinical features, sequence types (STs)/serotypes, antimicrobial resistance/hypervirulence, phenotype/genotype) of BSI‐Kpns. We also revealed the correlations between clinical characteristics and the genotypes of BSI‐Kpns.
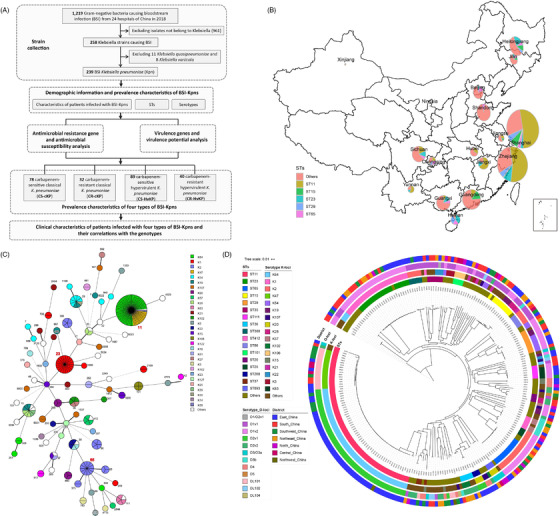
A total of 239 Kpns were identified by screening 1219 Gram‐negative bacteria causing BSI from 24 representative hospitals in different regions of China in 2018 (Table 1 and Figure 1; Table S1 and Figure S1). A total of 67.36% (161/239) infections were hospital‐onset (HO), and the others were community‐onset (CO). A total of 66.11% (158/239) patients were males, and middle‐aged (41–65 years, 118/239, 49.37%) and aged (>65 years, 81/239, 33.89%) patients accounted for a significantly higher percentage (p‐value < 0.0001) (Table 1; Table S2). We further sequenced the whole genomes of 239 BSI‐Kpns using Illumina Technology (Tables S3 and S4). ST analysis indicated that these strains covered 78 different STs, including seven new STs (Table S5). The most common STs were ST11, ST23 and ST65, together accounting for 41% (98/239) of BSI‐Kpns (Table 1). Sixty‐six (84.6%) STs were found in ≤ three BSI‐Kpns each. Serotypes of capsular (K) and lipopolysaccharide (O) antigens were also predicted (Table 1). We detected 50 different K‐loci, with K64 (53/239, 22.18%) predominating, followed by K1 (27/239, 11.30%), K2 (27/239, 11.30%), and K47 (11/239, 4.60%). Twelve O‐loci were detected, O1 and O2 were the most common, together accounting for 79.5% (190/239) of BSI‐Kpns (Table 1). The distribution of strains in different regions showed different characteristics: the majority of strains in East China are ST11/K64/O2v1, while the percentage of ST65/K2/O1v2 strains ranks first in North China and ST23/K1/O1v2 strains account for the most in Northeast China, respectively (Figure 1; Figures S2 and S3). Importantly, most ST11 strains were K64/O2v1 (49/65, 75.38%) and K47/OL101(14/65, 21.54%), all ST23 strains were K1/O1v2 and all ST65 strains were K2/O1v2 (Figure 1C,D; Figure S3). Moreover, strains of the same ST clustered in the same evolutionary branch and strains of different serotypes clustered in different sub‐branches inside of the same ST (Figure 1D).
TABLE 1.
Demographic information and characteristics of the BSI K. pneumoniae isolates
| HO | CO | Total | |
|---|---|---|---|
| All | 161 (67.36%) | 78 (32.64%) | 239 (100%) |
| Sex | |||
| Male | 101 (62.73%) | 57 (73.08%) | 158 (66.11%) |
| Female | 60 (37.27%) | 21 (26.92%) | 81 (33.89%) |
| Age | |||
| Children (0–6 years) | 14 (8.70%) | 1 (1.28%) | 15 (6.28%) |
| Early youth (7–17 years) | 1 (.62%) | 0 (.00%) | 1 (.42%) |
| Youth (18–40 years) | 15 (9.32%) | 9 (11.54%) | 24 (10.04%) |
| Middle (41–65 years) | 74 (45.96%) | 44 (56.41%) | 118 (49.37%) |
| Aged (>65 years) | 57 (35.40%) | 24 (30.77%) | 81 (33.89%) |
| Districts | |||
| East China | 74 (45.96%) | 35 (44.87%) | 109 (45.61%) |
| South China | 27 (16.77%) | 18 (23.08%) | 45 (18.83%) |
| Southwest China | 25 (15.53%) | 6 (7.69%) | 31 (12.97%) |
| Northeast China | 23 (14.29%) | 6 (7.69%) | 29 (12.13%) |
| North China | 7 (4.35%) | 6 (7.69%) | 13 (5.44%) |
| Central China | 5 (3.11%) | 4 (5.13%) | 9 (3.77%) |
| Northwest China | 0 (.00%) | 3 (3.85%) | 3 (1.26%) |
| Sequence type | |||
| ST11 | 56 (34.78%) | 9 (11.54%) | 65 (27.20%) |
| ST23 | 10 (6.21%) | 11 (14.10%) | 21 (8.79%) |
| ST65 | 9 (5.59%) | 3 (3.85%) | 12 (5.02%) |
| ST15 | 7 (4.35%) | 3 (3.85%) | 10 (4.18%) |
| ST29 | 6 (3.73%) | 3 (3.85%) | 9 (3.77%) |
| Other STs | 73 (45.34%) | 49 (62.82%) | 122 (51.05%) |
| Capsular (K) serotype | |||
| K64 | 44 (27.33%) | 9 (11.54%) | 53 (22.18%) |
| K1 | 12 (7.45%) | 15 (19.23%) | 27 (11.30%) |
| K2 | 18 (11.18%) | 9 (11.54%) | 27 (11.30%) |
| K47 | 12 (7.45%) | 2 (2.56%) | 14 (5.86%) |
| K54 | 7 (4.35%) | 4 (5.13%) | 11 (4.60%) |
| Other Ks | 68 (42.24%) | 39 (50.00%) | 107 (44.77%) |
| Lipopolysaccharide (O) serotype | |||
| O1v2 | 45 (27.95%) | 31 (39.74%) | 76 (31.80%) |
| O2v1 | 44 (27.33%) | 9 (11.54%) | 53 (22.18%) |
| O1v1 | 25 (15.53%) | 18 (23.08%) | 43 (17.99%) |
| O2v2 | 12 (7.45%) | 6 (7.69%) | 18 (7.53%) |
| OL101 | 13 (8.07%) | 4 (5.13%) | 17 (7.11%) |
| Other Os | 22 (13.66%) | 10 (12.82%) | 32 (13.39%) |
FIGURE 1.

Study design, geographic distribution and phylogenetic analysis of bloodstream infection (BSI) K. pneumoniae isolates included in this study. (A) Study design and working flow for this systematic epidemiological study. (B) Collection sites for all K. pneumoniae isolates coloured by chromosomal multilocus sequence types (STs) as in the pie chart. (C) Minimum spanning tree of STs as determined by multilocus sequence typing coloured by K‐loci. The size of the nodes reflects the number of isolates contained within that particular clade. (D) Phylogenetic tree of core gene SNPs. STs, K‐loci, O‐types, and different locations are marked with different colours from inside to outside
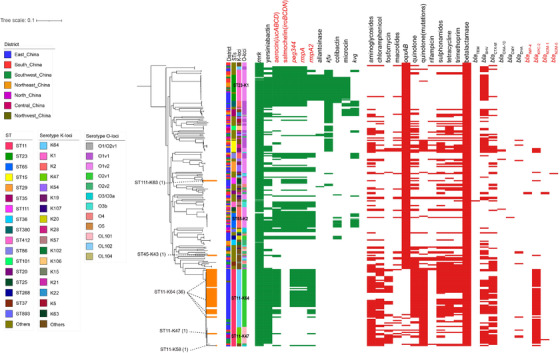
Acquired antimicrobial resistance (AMR) gene analysis showed that all 239 strains acquired AMR genes conferring resistance to more than three drug classes (Table S6; Figures S4 and S5). The prevalence of aminoglycosides/chloramphenicol/quinolone/sulph‐onamides/tetracycline/trimethoprim/beta‐lactamase resistance genes all exceeded 30%, with beta‐lactamase predominating (100%) (Table S7; Figure S4). Among beta‐lactamase, the prevalence of carbapenemase genes was 29.71% (71/239) (Table S8). All isolates with carbapenemase were predicted to be resistant to a median of eight drug classes (Figure S6). The most common carbapenemase was bla KPC‐2, varying widely between different STs/serotypes (93.85% [61/65] ST11, 100% [14/14] K47, 86.79% [46/53] K64 strains and 0% of ST23/ST65/K1/K2 strains) (Table S8, Figure S4C). The prevalence of extended‐spectrum beta‐lactamase genes was 63.6% (152/239), with the most common type being bla SHV and bla CTX‐M (Table S8). bla CTX‐M with the main subtypes of bla CTX‐M‐65 (56.18%, 50/89) and bla CTX‐M‐3 (16.85%, 15/89) varied between STs/serotypes, >73% in ST11/K64/K47 and <5% in ST23/ST65/K1/K2 (Table S8; Figure S4C). AmpC genes were present in only 4.6% (11/239) of strains with gene types bla CMY and bla DHA (Table S8). Eleven antibiotics were used for the antimicrobial susceptibility testing, and the resistant phenotype was consistent with the genotype (Table S9; Figure S4A).
Virulence determinant analysis (Table S10; Figure S7) showed that aerobactin (119/239, 49.79%)‐ and salmochelin (82/239, 34.31%)‐encoding genes, peg344 (113/239, 47.28%), rmpA (113/239, 47.28%) and rmpA2 (98/238, 41%), which have been suggested to be the most predictive for hypervirulence, 7 were detected in >30% BSI‐Kpns. They were more prevalent in ST23/ST65/K1/K2 (100% in ST23/ST65; 96.3% in K1/K2 except for rmpA2). ST23‐K1/ST65‐K2 contained almost all types of virulence genes, while ST11‐K64/ST11‐K47 strains had fewer (Table S10; Figure S7A,B). The yersiniabactin locus was present in 60.25% (144/239) of BSI‐Kpns, and its prevalence did not differ significantly among different STs/serotypes. Although allantoinase, colibactin and microcin genes were present in <30% of strains, they were more prevalent in ST23/K1 (p‐value < 0.001). Kvg genes, carried by 13.81% (33/239) of isolates, were more likely to be enriched in ST65/K2 (p‐value < 0.001) (Table S10; Figure S7A,B). Most virulence genes of the same type appeared together in clusters, such as the aerobactin‐encoding genes iucABCD (Figure S7C). Virulence potential tested by the Galleria mellonella infection model showed that 110 out of 129 strains carrying the predictive hypervirulence genes and showed a high virulence potential. There was no significant difference between carbapenem‐sensitive and carbapenem‐resistant strains carrying the predictive hypervirulence genes in virulence potential (Figure S8).
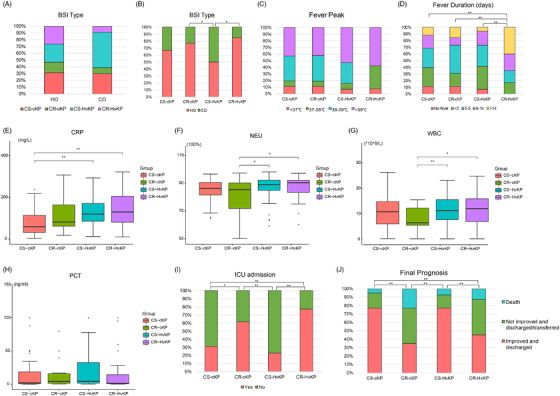
Through the above genotype analysis, four types of BSI‐Kpns possessing different incidence rates and ST/serotype characteristics were identified: carbapenem‐sensitive classical Kpns (organisms carrying no hypervirulence predictive genes 7 ) (CS‐cKPs, 78/239, 32.64%) had 49 STs and 38 serotypes; carbapenem‐resistant classical Kpns (CR‐cKPs, 32/239, 13.39%) were dominated by ST11/K64 and ST11/K47; carbapenem‐sensitive hypervirulent Kpns (CS‐HvKPs, 89/239, 37.24%) covered 29 STs and were dominated by ST23/K1 and ST65/K2; carbapenem‐resistant hypervirulent Kpns (CR‐HvKPs, 40/239, 16.74%) were dominated by ST11/K64 (36/40, 90%), and no ST23‐K1 or ST65‐K2 CR‐HvKPs were discovered (Figure 2, Figure S9, Table S11). Detail clinical data were further collated and compared among these four groups (Figure 3). There was a higher ratio of HvKPs in CO isolates (41/67, 61.2%) (Figure 3A,B), and there were no significant differences in the fever peak or procalcitonin among these four groups (Figure 3C,H). However, the values of C‐reactive protein (CRP), neutrophil percent (NEU) and total white blood cells in CR/CS‐HvKPs, especially CRP, were significantly higher than those in CR/CS‐cKPs (Figure 3E–G). The average CRP in CR‐HvKPs reached 140.92 mg/L. Fever duration, intensive care unit (ICU) admission and final prognosis were significantly related to CR‐c/HvKP (Figure 3D,I,J). Further correlation analysis between antimicrobial‐resistance/virulence genes and clinical symptoms (Figure S10) indicated that antimicrobial resistance genes, especially bla KPC‐2 and quinolone resistance mutations, had a significantly positive correlation with ICU admission and final prognosis but a significantly negative correlation with the BSI type of CO (Figure S10A,C). In contrast, virulence genes, especially rmpA, rmpA2, aerobactin (iucABCD) and peg344, were negatively related to the ratio of ICU admission but had a significantly positive correlation with CRP. Virulence genes microcin (mceABCDEIJ) and allantoinase (allABCDRS) had a significantly positive correlation with CO but were negatively related to the ratio of ICU admission. The yersiniabactin genes (ybtAEPQSTUX) had a significantly positive correlation with fever duration (Figure S10B,D).
FIGURE 2.

Distribution of virulence genes and antimicrobial resistance genes. Evolutionary relationships, virulence genes and antimicrobial resistance genes are shown from left to right, respectively. The strains not only contained carbapenemases genes (marked in red) but also the hypervirulence genes (marked in red) are highlighted in orange, and their STs and serotypes were also marked
FIGURE 3.

Differences in clinical symptoms and outcomes among patients infected with different types of isolates. (A and B) bloodstream infection (BSI) type, (C) fever peak, (D) fever duration, (E–H) CRP, NEU, PCT, and WBC distribution, (I) ICU admission, and (J) final prognosis. Abbreviations: WBC, total white blood cells; NEU, neutrophil percent; CRP, C‐reactive protein; PCT, procalcitonin; CO, community onset; ICU, intensive care unit. **p‐value < 0.01; *p‐value < 0.05
In conclusion, BSI‐Kpns from China showed a high prevalence of CRKP, HvKP and CR‐HvKP, and different types of strains possessed different STs/serotypes and prevalence features. Patients infected with different types of isolates also showed different clinical symptoms. ST11‐K64 CR‐HvKPs might be a general trend, and other types of CR‐HvKPs have also begun to appear sporadically. Our results provide a complete genomic epidemiological picture and reveal the correlations between clinical characteristics and the genotypes of BSI‐Kpns.
CONFLICT OF INTEREST
The authors declare no conflict of interest.
Supporting information
Supporting information
Supporting information
ACKNOWLEDGEMENTS
We would like to acknowledge and thank all staff involved in obtaining and processing the isolates including healthcare facility and laboratory staff.
Xinmiao Jia, Cuidan Li, Fei Chen, Xue Li, Peiyao Jia, and Ying Zhu contributed equally to this work.
REFERENCES
- 1. Fraenkel‐Wandel Y, Raveh‐Brawer D, Wiener‐Well Y, Yinnon AM, Assous MV. Mortality due to bla(KPC) Klebsiella pneumoniae bacteraemia. J Antimicrob Chemoth. 2016;71:1083‐1087. [DOI] [PubMed] [Google Scholar]
- 2. Liu YM, Li BB, Zhang YY, et al. Clinical and molecular characteristics of emerging hypervirulent Klebsiella pneumoniae bloodstream infections in mainland China. Antimicrob Agents Chemother. 2014;58:5379‐5385. [DOI] [PMC free article] [PubMed] [Google Scholar]
- 3. Wyres KL, Nguyen TNT, Lam MMC, et al. Genomic surveillance for hypervirulence and multi‐drug resistance in invasive Klebsiella pneumoniae from South and Southeast Asia. Genome Med. 2020;12:11. [DOI] [PMC free article] [PubMed] [Google Scholar]
- 4. Navon‐Venezia S, Kondratyeva K, Carattoli A. Klebsiella pneumoniae: a major worldwide source and shuttle for antibiotic resistance. FEMS Microbiol Rev. 2017;41(3):252‐275. [DOI] [PubMed] [Google Scholar]
- 5. Grundmann H, Glasner C, Albiger B, et al. Occurrence of carbapenemase‐producing Klebsiella pneumoniae and Escherichia coli in the European survey of carbapenemase‐producing Enterobacteriaceae (EuSCAPE): a prospective, multinational study. Lancet Infect Dis. 2017;17:153‐163. [DOI] [PubMed] [Google Scholar]
- 6. Gu D, Dong N, Zheng Z, et al. A fatal outbreak of ST11 carbapenem‐resistant hypervirulent Klebsiella pneumoniae in a Chinese hospital: a molecular epidemiological study. Lancet Infect Dis. 2018;18:37‐46. [DOI] [PubMed] [Google Scholar]
- 7. Russo TA, Olson R, Fang CT, et al. Identification of biomarkers for differentiation of hypervirulent Klebsiella pneumoniae from classical K. pneumoniae . J Clin Microbiol. 2018;56:e00776‐18. [DOI] [PMC free article] [PubMed] [Google Scholar]
Associated Data
This section collects any data citations, data availability statements, or supplementary materials included in this article.
Supplementary Materials
Supporting information
Supporting information


