

Abstract
Deregulation of gene expression is associated with the pathogenesis of numerous human diseases including cancer. Current data analyses on gene expression are mostly focused on differential gene/transcript expression in big data-driven studies. However, a poor connection to the proteome changes is a widespread problem in current data analyses. This is partly due to the complexity of gene regulatory pathways at the post-transcriptional level. In this study, we overcome these limitations and introduce a graph-based learning model, PTNet, which simulates the microRNAs (miRNAs) that regulate gene expression post-transcriptionally in silico. Our model does not require large-scale proteomics studies to measure the protein expression and can successfully predict the protein levels by considering the miRNA–mRNA interaction network, the mRNA expression, and the miRNA expression. Large-scale experiments on simulations and real cancer high-throughput datasets using PTNet validated that (i) the miRNA-mediated interaction network affects the abundance of corresponding proteins and (ii) the predicted protein expression has a higher correlation with the proteomics data (ground-truth) than the mRNA expression data. The classification performance also shows that the predicted protein expression has an improved prediction power on cancer outcomes compared to the prediction done by the mRNA expression data only or considering both mRNA and miRNA. Availability: PTNet toolbox is available at http://github.com/CompbioLabUCF/PTNet
Keywords: miRNA regulation, protein expression prediction, graph-based learning model, 3’-UTR APA
Introduction
Powered by high-throughput transcriptomic technologies, the RNA-seq method can comprehensively profile the transcriptome-wide changes of gene expression in various biological models including cancer cells [1, 2]. Currently, SRA-NCBI [3], the largest public repository for sequencing data, has more than 800 000 human RNA-seq samples and 730 000 mouse RNA-seq samples. These numbers are expected to grow rapidly due to the reduction in the RNA-seq cost per sample and the increased demand for RNA-seq experiments in biomedical research.
Currently, changes in gene expression in the transcriptome are mostly documented by differential gene/transcript expression analyses. This is based on the assumption that the amount of mRNAs and their corresponding protein are positively correlated in a given biological model. However, in reality, it is becoming evident that the correlation between the level of mRNA and the corresponding protein is weak; recent studies have shown that the correlation between the cellular protein levels and the abundance of their corresponding mRNAs is approximately 0.4, implying that  40% of the variations in protein abundance can be explained by measuring the changes of mRNA amounts [4]. Consistently, this weak correlation was also found in cancer tissues, and there are findings that question the validity of using the mRNA expression as a way to understand gene expression [5]. The multiple layers of regulatory mechanisms involved in gene expression after transcription is one explanation for this weak correlation. Although the mRNA expression analysis has its own value in understanding gene expression, it does not provide comprehensive information on the proteome. In an attempt to address this discrepancy, some studies [6, 7] have proposed the use of gene-specific RNA-to-protein (RTP) conversion factors. This method would allow for the estimation of protein expression from transcriptomic data; however such methods use the same RTP for all samples and therefore fail to realize the difference between different biological contexts leading to false approximations. Consequently, to draw accurate predictions about the proteome based on transcriptomic data, post-transcriptional regulatory mechanisms must be considered.
Post-transcriptional gene regulation includes but is not limited to splicing, polyadenylation, nuclear export and microRNA (miRNA)-regulated translation. Numerous bioinformatics pipelines are available to profile post-transcriptional events such as alternative splicing and alternative polyadenylation (APA). Particularly, APA can occur in the 3’-untranslated region (3’-UTR) of mRNAs and can produce an mRNA isoform with a different 3’-UTR length. Recent studies found that more than 70% of the human genes have the capacity to produce 3’-UTR APA isoforms, suggesting the prevalence of APA in the 3’-UTR [8]. Although APA in the 3’-UTR does not affect the coding capacity of a gene, this region contains binding sites for post-transcriptional regulatory mechanisms (e.g. miRNAs). Therefore, APA in the 3’-UTR potentially affects the mRNA stability or protein production [9, 10]. Several studies showed that proliferating or transformed cells favor the expression of mRNAs with shorter 3’-UTRs through APA and lead to the activation of oncogenes [11, 12]. In addition, highly expressed mRNAs in cancer cells feature a shorter 3’-UTR with fewer miRNA-binding sites and exhibit the decrease of miRNA-mediated translational repression [13, 14].
miRNA expression profiles differ between normal tissues and tumors in cancer patients [15, 16]. Recent studies have shown that miRNA can serve as a molecular marker for the early detection of cancer [17–19]. Therefore, it is important to investigate how miRNAs post-transcriptionally regulate gene expression in cancer. However, as the cancer transcriptome data and the miRNA expression data are available through high-throughput sequencing, the gene regulatory mechanism of miRNA can only be predicted using miRNA–mRNA interaction modeling. Three miRNA–mRNA interaction databases were built up recently [20–22], and they provide the positional information for each miRNA–mRNA interaction in the 3’-UTR. However, considering the dynamic regulation of 3’-UTR length by APA in cancer or perturbed cells, a simple one-dimensional mapping of miRNA–mRNA interaction based on the annotated gene structure may not provide a comprehensive picture of post-transcriptional regulation of mRNAs in cancer studies. In addition, the current competing endogenous RNA (ceRNA) model largely ignores the dynamics of 3’-UTR landscape for miRNA-binding sites caused by 3’-UTR APA [23].
In this study, we present a biologically motivated graph-based learning model, PTNet, to predict the protein expression by integrating the mRNA expression, the miRNA expression, the miRNA–mRNA interaction network and the dynamics of 3’-UTR in the transcriptome. The proposed model harnesses the mRNA and miRNA expression in cancer studies and can be applied to existing big data to predict the protein expression; it eliminates the need for a large-scale proteomics experiment. The experimental results confirm that our proposed framework provides a higher resolution of molecular signatures to better understand biological mechanisms that lead to the disease state. Our model also improves a cancer outcome prediction compared to the prediction made by considering the mRNA or miRNA expression only. An advanced deep learning method that integrates the mRNA and miRNA expression data through a controlled fusion layer is also proposed as a baseline method to compare the cancer outcome prediction performance to the proposed graph-based learning model.
Materials and methods
In this section, we first introduce a graph-based learning model, PTNet, which is motivated by miRNA-mediated regulation of gene expression to estimate the level of the corresponding protein. We also introduce the strategies to evaluate the quality of the estimated protein expression. Next, a deep learning-based fusion network model is introduced as a baseline method that integrates multi-omics data (i.e. mRNA and miRNA in this study) to predict patient outcome. This model considers the relation between the biological features within the same omics and across different omics profiles by the fusion network.
PTNet: graph-based learning model
miRNA–mRNA interaction and miRNA-mediated gene regulation
To estimate the protein expression from mRNA expression data, we first accessed the well-established miRNA–mRNA interaction database TargetScan [24] and collected the position information for all possible miRNA-binding sites in the 3’-UTR of target mRNAs. To establish the miRNA–mRNA interaction network, a miRNA was connected to the expressed mRNAs that contain the binding site in their 3’-UTRs. In the miRNA–mRNA interactive bipartite network, an interaction was valued as  to imitate the miRNA-induced silencing on target mRNA, whereas no interaction was valued as 1. However, this scoring is neglecting the scenario in which mRNA loses miRNA-binding sites due to 3’-UTR APA events. If the miRNA-binding site is located within the lost 3’-UTR, the shorter mRNA will bypass miRNA-mediated inhibitory regulation, whereas the longer isoform will be suppressed in translation.
Graph-based learning algorithm
The notations to define the graph-based learning algorithm are summarized in Table 1. Let  be the number of mRNAs, and
  be the number of miRNAs. The dimensions of the miRNA–mRNA interaction network
  , mRNA expression data
  , and miRNA expression data
  are
are  ,
,  , and
, and  , respectively, with
  being the number of samples. Predicted protein expression
  corresponds to the dimension of the mRNA expression dataset.
Table 1.
Notations for PTNet model
| Name | Definition |
|---|---|

|
mRNA expression,  = [ = [ ] ] |

|
miRNA expression,  = [ = [ ] ] |

|
estimated protein expression,  = [ = [ ] ] |

|
adjacency matrix of miRNA–mRNA interaction network |

|
diagonal matrix: 
|

|
diagonal matrix: 
|

|
normalized adjacency matrix,  = = 
|

|
hyper-parameter |
Given the values of mRNA expression  , miRNA expression
  , and interaction network
  , we applied a bipartite graph-based learning model PTNet to predict the abundance of protein expression
  . Let
. Let  denote an undirected bipartite graph, where
  and
and  are two disjoint vertex sets that represent miRNAs and mRNAs.
  is a set of edges that stands for the miRNA–mRNA interactions, and
  is the adjacency matrix of the network. Since the miRNAs negatively regulate the translation of mRNAs, the elements in the interaction network
  are either 1 (no connection) or -1 (connected).
For  th sample, the miRNA vertex set
  is initialized by the miRNA expression denoted by
  , which is learned from miRNA-seq data. Similarly, the mRNA vertex set
  is initialized by the mRNA expression denoted by
  , which is learned from RNA-seq data. Vector
  denotes the protein expression for sample
  which we desire to study and is shown in Figure 1. We also introduce a vector
  , which can be considered, as the available miRNA expression after mRNA blueis translated into its corresponding protein. In this context, the cost function over
  is defined as
 |
(1) |
where  is a normalized adjacency matrix based on
  as shown in Table 1 and
  is a regularization parameter for balancing the cost terms on the right side of the equation. The first three terms enforce the consistency between the connected vertex pairs in the miRNA–mRNA bipartite graph. They penalize the miRNA–mRNA interaction with a high estimated protein expression but have the available miRNA that can bind to the mRNA to further suppress its translation. The last two terms are fitting terms, which keep the estimated protein expression level and the final miRNA expression level consistent with the initial mRNA expression level and the miRNA expression level, respectively. Similar to the algorithm proposed by [25–28], the optimization problem in Equation (1) can be solved with an iterative label propagation algorithm as follow,
 |
where  = 1/(1+
 ),
),  denotes the propagation iteration,
  and
and  . The label propagation algorithm iteratively performs propagation between the vertices of mRNA and miRNA in both directions as shown in Figure 1 and will be converged to a closed-form solution to get the protein expression level. It imitates the post-transcriptional regulation events in cells to capture the protein expression changes due to miRNA regulation.
Figure 1 .

An illustration of the proposed graph-based learning model on miRNA–mRNA bipartite graph to estimate the protein expression levels. The miRNA–mRNA interaction networks are built up based on known miRNA-binding sites. The miRNA vertex and mRNA vertex are initialized with miRNA expression and mRNA expression, respectively. A graph-based learning model PTNet is applied to imitate the miRNA regulation on the network and to estimate the protein expression levels.
Evaluation methods
We used two criteria to evaluate the quality of the estimated protein expression proposed by PTNet and compare it to the mRNA expression data and the data resulting from the integration of mRNA and miRNA expression data. First, we measured the consistency between the ground-truth protein expression (proteomics data) and the estimated protein expression or mRNA expression by correlation coefficients (CC). Second, we designed cancer outcome classification tasks with the assumption that a better quality of the protein expression estimation will lead to better molecular signatures for disease phenotype prediction compared to the estimation when only considering mRNA and miRNA expressions.
Pearson CC
The protein expression was estimated for individual miRNA neighborhood networks by PTNet [Equation (1)]. The Pearson CC was applied to measure the consistency between the estimated protein expression or mRNA expression and the true protein expression. The formula of Pearson CC is defined as
 |
where  is the estimated protein expression or mRNA expression for one sample and
  is the ground-truth.
  and
and  denote the average expression levels and
  is the number of isoforms.
Classification model
A feed forward fully connected deep neural network was applied for binary cancer outcome classification on estimated protein expression, mRNA expression, or the integration of mRNA and miRNA expressions. The cost function of the deep learning model is
 |
(2) |
where  is the truth label of the disease patients and
  is the predicted labels. Adam optimizer was used with a learning rate of 0.01. 500 biological features that most correlated with the labels of the training samples were selected as the input for the learning model. This is a two-hidden layer neural network with 250 and 100 neurons in each layer respectively. Both hidden layers use the rectified linear unit as the activation function and the dropout with a probability of 0.2. The output layer uses Sigmoid as the activation function. The area under receiver operating characteristic curve score was applied to evaluate the performance of the classifiers and the quality of the input biological features.
Deep learning-based fusion network
The proposed PTNet model considered both mRNA and miRNA expressions in the analysis. To evaluate PTNet and make a fair comparison, we also propose a deep learning-based multi-omics feature extraction framework that considers the relations between different multi-omics features (i.e. mRNA expression and miRNA expression) for a disease outcome prediction as a baseline method (Figure 2). In this framework, one autoencoder for each input omics data is constructed to project the high dimension low sample size omics profile onto a low-dimensional embedding. The encoder encodes the data, whereas the decoder reconstructs the original data. The minimization of weighted reconstruction loss enforces the features learned from the omics profiles to be salient and robust. The autoencoders are designed with a loss function,
 |
where  and
and  are the original mRNA expression and reconstructed mRNA expression from the decoder for sample
  , respectively.
  denotes the number of samples.
  is enforced to be as close to the original features as possible so that maximum retention of information in the learned features is ensured. For miRNA expression (
 ), another autoencoder with the same loss function is applied.
Figure 2 .

Overview of the deep learning-based fusion network model. One autoencoder is constructed for each omics profiling data (left panel). Then, a fused network is learned across the outputs from multi-omics data to identify important multi-omics features (red nodes). Next, the fused multi-omics features are applied for disease phenotype prediction. The structure of network parameters  in the fusion network is shown at the top right corner.
Then, the learned features,  and
and  from each network are transformed into an input layer of a neural network by considering the relations between the extracted features within the same omics profile and across different omics profiles with a controlled fusion technique. Specifically, the network parameter
  in the fusion network in Figure 2 is learned upon the relation of the features within the mRNA expression data
  , the relation of the features between mRNA and miRNA expression data
  and so on. Different blocks in
  are weighted by different regularization coefficients
  and
and  . We apply
  -regularization on the off-diagonal blocks in
  with the assumption that the connections between the features extracted from different omics profiles are sparse. Thus, the loss function for this framework is
 |
(3) |
where  is the truth label of patient outcomes. The first term of the loss function is a binary cross-entropy loss whereas the last two terms enforce the desired sparsity of
  described above.
  ,
,  ,
,  and
and  are submatrices of
  that correspond to mRNA–mRNA, mRNA–miRNA, miRNA–mRNA and miRNA–miRNA interaction in the fusion network, respectively. The multi-omics features are the output of the fusion network and two more layers are added after the fusion network for a disease outcome prediction.
In summary, in this method section, a two-step framework toward the phenotype prediction is proposed: (i) learn the features (estimate protein expression) through the graph-based learning model PTNet and (ii) predict the disease phenotype using the learned features as input in the classifier as described in the ‘Classification model’ subsection. To predict disease outcomes using the mRNA expression, the same classifier is applied without the first step of the framework for comparison. A multi-omics deep learning-based fusion network is proposed to integrate these two steps allowing the mRNA and miRNA expression datasets as input and directly predicting the disease outcome as output. This model also learns new multi-omics features from mRNA and miRNA expression datasets similar to the graph-based learning model using a fusion network without considering the biological interactions between miRNAs and mRNAs ( ). Therefore, the new multi-omics features are learned from each modality separately, instead of incorporating the knowledge from post-transcriptional regulation.
Results
In the experiments, we first generated artificial datasets for two biological conditions to test if the PTNet can capture the changes of protein expression by considering the miRNA-mediated regulatory pathway. Next, we performed three experiments on The Cancer Genome Atlas datasets to evaluate the performance of PTNet. The first experiment was to compare the protein expression estimated by PTNet with the proteome data. The second experiment was to evaluate the prediction power of the estimated protein expression on cancer patient outcomes. The last experiment was to show the effects of 3’-UTR APA on the miRNA–mRNA interaction network and the level of protein expression.
Simulation
In this simulation experiment, we generated two artificial miRNA–mRNA bipartite networks which have different interactions due to 3’-UTR APA events between two biological conditions as shown in Figure 3A. Both bipartite networks consist of three miRNAs and four mRNAs. The expression values of those miRNAs and mRNAs in this simulation were randomized but the two conditions were set to maintain the expression value of corresponding RNAs the same. Due to the 3’-UTR APA events between two biological conditions, miRNA3 loses its binding sites on mRNA2 in Condition 1 and mRNA4 in Condition 2 as illustrated in Figure 3A. Theoretically, the expression of protein2 would then increase, whereas the expression of protein4 would decrease due to the reorganization of miRNA3-binding in Condition 1.
Figure 3 .
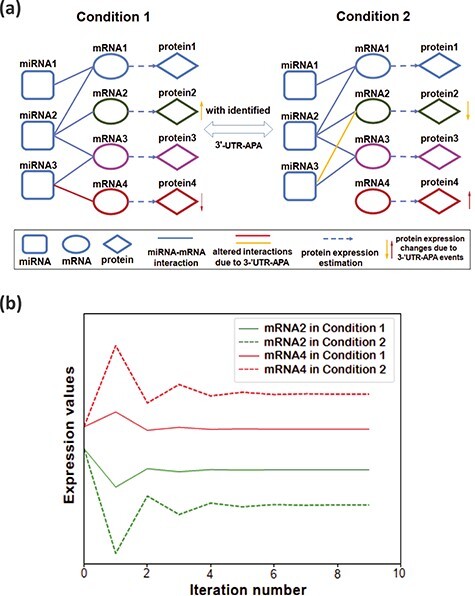
(A) Simulated miRNA–mRNA bipartite networks on two biological conditions. The altered interactions due to 3’-UTR APA between two conditions are highlighted as yellow and red lines. The miRNA vertex and mRNA vertex are initialized with miRNA expression and mRNA expression, respectively. (B) The changes of mRNA expression level. The initial value (iteration 0) of each plot represents the original mRNA expression and the final value of the plot is its corresponding estimated protein expression. The iteration number represents the iteration in the label propagation algorithm to solve the optimization algorithm in equation (1) as discussed in subsection ‘graph-based learning algorithm’.
Next, we imitate the miRNA regulation based on the neighboring relations of each miRNA and estimate the protein expression changes depending on the mRNA expression, miRNA expression and their role in post-transcriptional regulation as formulated in Equation (1). We run PTNet twice, first with the interactions corresponding to Condition 1 and second with two interactions altered to simulate Condition 2 in Figure 3A. The expression values of the mRNA2 and the mRNA4 are plotted in Figure 3B. The initial value (iteration 0) of each plot represents the original mRNA expression, whereas the final value of the plot is its corresponding estimation of the protein expression. From these experiments, we observed that the final estimated values of the protein expression are lower than their original mRNA values in Condition 1 since both mRNAs are bound by miRNAs. Then in Condition 2, the estimated expression of protein2 decreases further as a new miRNA (miRNA3) binds to the mRNA2, whereas the protein4 expression increases as the mRNA4 is free of miRNA-binding. In Figure 3B, the predicted changes of the protein expression between the two conditions are as we expected. The proposed model can imitate miRNA-mediated regulation of gene expression and predict the corresponding protein expression.
Experiments on TCGA datasets
Dataset
The proposed graph-based learning model PTNet and the baseline method were tested on TCGA breast cancer (BRCA) and ovarian cancer (OV) datasets [29, 30]. The RNA-seq gene expression and miRNA expression datasets were downloaded from UCSC Xena Hub [31]. For the gene expression, the  transformed RNA-Seq By Expectation-Maximization (RSEM) normalized count was used in the analyses and 20 531 genes were included in this study [32]. For the miRNA expression, the
  transformed RPM value was used in the analyses and 2166 miRNAs were included in this study. The clinical information of the cancer studies was downloaded from cBioPortal [33]. There are 185 Estrogen Receptor positive (ER+) and 54 ER negative (ER-) samples in the BRCA dataset and 51 cancer patients in the early stage (
 IIIA) and 359 cancer patients in the late stage (> IIIA) in the OV dataset. The protein spectral counts in the proteome data downloaded from National Cancer Institute data portal1 was used as the ground truth for the protein expression. The miRNA–mRNA interaction network was obtained from TargetScanHuman [24], which predicts effective miRNA target sites within mRNAs. A modified adjacency matrix with 163 568 interactions was applied to represent the network, where each interaction was valued as
  to imitate the miRNA-mediated negative regulation of targeted mRNAs. No interaction was valued as 1.
PTNet improved the estimation of the protein expression
To evaluate the proposed graph-based learning model, we first investigated the effect of an individual miRNA on its neighborhood network and estimated the protein expression of the corresponding mRNAs that bind to the miRNA. The neighborhood network is defined by a targeted miRNA, all mRNAs directly bound to the targeted miRNA (first-order neighbor of targeted miRNA), and all miRNAs directly connected to the first-order neighbor mRNAs. Interactions between the selected miRNAs and mRNAs from the original interaction network obtained from TargetScanHuman were applied as the interactions in the neighborhood network. We performed a comprehensive literature review of cancer related miRNAs and selected miRNAs that were associated with BRCA and OV pathogenesis (Tables 2 and 3). We then ran the proposed graph-based learning model to estimate the protein expression for the neighborhood networks. The predicted protein expression was compared with the ground truth spectral count in terms of Pearson CCs. Detailed results for TCGA BRCA and OV datasets are provided in Tables 2 and 3, respectively. The tables contain the name of the targeted miRNA, the references that describe the relevance of the miRNAs in BRCA or OV, the number of mRNAs in the neighborhood network, Pearson CC between mRNA and ground truth spectral count, and lastly, Pearson CC between our estimated protein expression and the ground truth spectral count. From the results, we can see that in most cases (i.e. 26 out of 29 in BRCA and 20 out of 24 in OV) the estimated protein expression by considering miRNA regulation achieved a higher correlation with the real protein expression than when only considering mRNA expression. We further show that the improvement in correlation is larger for the miRNAs with less mRNA connected to them in Figures S1 and S2 in the Supplementary document. The functions of these miRNAs in BRCA and OV are available in Tables S1 and S2. Two case studies in Figure S3 in the Supplementary document demonstrate that PTNet is robust to false-negative and false-positive interactions by randomly remove existing edges or add spurious edges to the miRNA–mRNA bipartite network. The overall results signify the ability of our model to reflect the miRNA regulation on mRNA expression on real patient datasets.
Table 2.
Protein abundance measured by proteomic data to evaluate the accuracy of estimated protein expression in BRCA dataset. The five columns in the table show the name of the miRNA, the reference of the BRCA study related to the miRNA, the number of the connected mRNA, CC between the real protein expression and the mRNA expression, and the CC between the real protein expression and the estimated protein expression.
| miRNA name | Literature | # of connected mRNA | CC of mRNA | CC of protein |
|---|---|---|---|---|
| hsa-miR-487b | [34] | 15 | 0.305 | 0.612 |
| hsa-miR-423-3p | [35] | 14 | 0.675 | 0.798 |
| hsa-miR-10b | [36] | 320 | 0.295 | 0.403 |
| hsa-miR-506-3p | [37] | 1262 | 0.285 | 0.314 |
| hsa-miR-1249 | [38] | 13 | 0.753 | 0.859 |
| hsa-miR-296-3p | [39] | 70 | 0.221 | 0.311 |
| hsa-miR-431 | [40] | 152 | 0.286 | 0.375 |
| hsa-miR-1224-5p | [41] | 197 | 0.348 | 0.372 |
| hsa-miR-191 | [42] | 59 | 0.231 | 0.309 |
| hsa-miR-376b | [43] | 243 | 0.398 | 0.469 |
| hsa-miR-324-5p | [44] | 142 | 0.272 | 0.341 |
| hsa-miR-145 | [45] | 849 | 0.254 | 0.322 |
| hsa-miR-127-3p | [46] | 22 | 0.615 | 0.675 |
| hsa-miR-382 | [47] | 206 | 0.257 | 0.313 |
| hsa-miR-488 | [48] | 412 | 0.317 | 0.373 |
| hsa-miR-154 | [49] | 162 | 0.325 | 0.38 |
| hsa-miR-423-5p | [35] | 209 | 0.351 | 0.403 |
| hsa-miR-451 | [50] | 28 | 0.446 | 0.498 |
| hsa-miR-802 | [51] | 362 | 0.299 | 0.35 |
| hsa-miR-140-5p | [52] | 419 | 0.301 | 0.35 |
| hsa-miR-21 | [53] | 363 | 0.315 | 0.329 |
| hsa-miR-29b | [54] | 1193 | 0.289 | 0.304 |
| hsa-miR-155 | [55] | 529 | 0.256 | 0.271 |
| hsa-miR-125b | [56] | 879 | 0.214 | 0.254 |
| hsa-miR-221 | [57] | 480 | 0.348 | 0.372 |
| hsa-miR-143-3p | [58] | 460 | 0.283 | 0.316 |
| hsa-miR-196b | [59] | 355 | 0.457 | 0.429 |
| hsa-miR-190 | [60] | 212 | 0.383 | 0.364 |
| hsa-miR-146 | [61] | 270 | 0.245 | 0.229 |
Table 3.
Protein abundance measured by proteomic data to evaluate the accuracy of estimated protein expression in OV dataset. The five columns in the table show the name of the miRNA, the reference of the OV study related to the miRNA, the number of the connected mRNA, CC between the real protein expression and the mRNA expression, and the CC between the real protein expression and the estimated protein expression.
| miRNA name | literature | # of connected mRNA | CC of mRNA | CC of protein |
|---|---|---|---|---|
| hsa-miR-487b | [62] | 15 | 0.172 | 0.545 |
| hsa-miR-423-3p | [63] | 14 | 0.355 | 0.678 |
| hsa-miR-1249 | [38] | 13 | 0.667 | 0.857 |
| hsa-miR-184 | [64] | 25 | 0.352 | 0.455 |
| hsa-miR-324-5p | [65] | 142 | 0.292 | 0.39 |
| hsa-miR-10b | [66] | 320 | 0.354 | 0.439 |
| hsa-miR-329 | [67] | 338 | 0.251 | 0.333 |
| hsa-miR-362-3p | [68] | 338 | 0.251 | 0.333 |
| hsa-miR-760 | [69] | 502 | 0.263 | 0.34 |
| hsa-miR-431 | [70] | 152 | 0.289 | 0.361 |
| hsa-miR-1197 | [71] | 239 | 0.29 | 0.359 |
| hsa-miR-138 | [72] | 660 | 0.268 | 0.334 |
| hsa-miR-502-3p | [73] | 196 | 0.283 | 0.348 |
| hsa-miR-382 | [74] | 206 | 0.27 | 0.33 |
| hsa-miR-107 | [75] | 783 | 0.264 | 0.324 |
| hsa-miR-145 | [76] | 849 | 0.318 | 0.376 |
| hsa-miR-21 | [77] | 363 | 0.326 | 0.341 |
| hsa-miR-221 | [78] | 480 | 0.295 | 0.311 |
| hsa-miR-29b | [79] | 1193 | 0.260 | 0.309 |
| hsa-miR-200c | [80] | 1144 | 0.312 | 0.366 |
| hsa-miR-191 | [81] | 59 | 0.484 | 0.461 |
| hsa-miR-152 | [82] | 759 | 0.277 | 0.265 |
| hsa-miR-1251 | [83] | 104 | 0.279 | 0.270 |
| hsa-miR-328 | [84] | 193 | 0.320 | 0.310 |
PTNet improved cancer outcome prediction
To provide an additional evaluation of the quality of the estimated protein expression, we designed two cancer outcome prediction tasks by the assumptions that (i) protein expression is a more direct mediator of cellular properties and it will provide more predictive power compared to mRNA expression and (ii) a better estimation of protein expression can provide better molecular signatures for cancer outcome prediction. In this experiment, the complete miRNA–mRNA interaction network from TargetScanHuman was applied to estimate the protein expression in the PTNet. The discriminative power of the estimated protein abundance was compared with mRNA expression and the integration of mRNA and miRNA expressions in the tasks. In each task, the dataset was divided into 5-folds with 3-folds for training, 1-fold for validation (parameter tuning), and 1-fold for test. A fully connected deep neural network [Equation (2)] described in the Materials and methods section was applied as the classifier for the estimated protein expression and mRNA expression datasets. The proposed deep learning-based fusion network [Equation (3)] was applied to integrate mRNA and miRNA expressions as another baseline for comparison. We repeated the 5-fold splitting 100 times by each method on each dataset.
Breast cancer: The average area under the curve (AUC) of receiver operating characteristic of the 100 repeats for predicting the ER status of the BRCA patients is reported in Figure 4. Each dot on the boxplot represents the results from one random splitting. Statistics (mean, median and SD) of the prediction performance of the splitting are shown above each boxplot. The protein expression estimated by PTNet achieved better average classification results (0.968) than the ones using mRNA expression (0.946) and the integration of mRNA and miRNA expression (0.961). Since the miRNA expression provides additional predictive signals for BRCA outcome prediction on top of the mRNA expression, the integration of both with the deep learning-based fusion network model improved the prediction performance compared to the use of mRNA expression only. However, the fusion network model does not consider the miRNA regulation mechanism in its formulation and the classification result is worse than the one using estimated protein expression. In Table 4, we also report the number of wins, ties, and losses. The classification results using the mRNA expression and the combination of mRNA and miRNA expression are compared with the results using estimated protein expression. Out of the 100 splittings, the mRNA expression-based prediction only has 11 better predictions than the estimated protein expression whereas the estimated protein expression does a better prediction in 84 splittings. The combination of miRNA and mRNA expressions yields a better prediction than considering the mRNA expression only. The model combining miRNA and mRNA expressions wins 30 splittings against the estimated protein expression but loses in 60 splittings. The overall result shows the consistent improvement of the prediction in BRCA clinical variables using the estimated protein abundance.
Figure 4 .
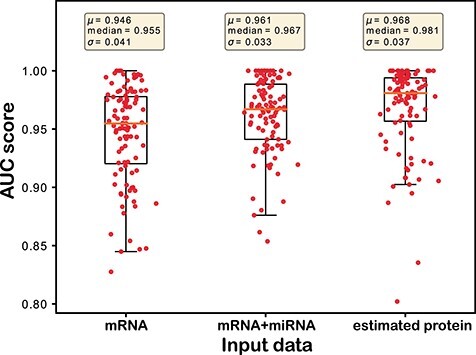
Prediction results of the ER status on TCGA BRCA patients. Each dot represents the AUC score from one splitting. Statistics (mean, median, and SD) of the prediction performance of the 100 splittings are shown above each boxplot.
Table 4.
The classification performance on TCGA BRCA dataset. Average AUC scores and the number of times of win/tie/loss on classification performance between estimated protein expression and the baselines (i.e. mRNA expression and integration of mRNA and miRNA expressions) on BRCA dataset.
| Input data | AUC score | win/tie/loss |
|---|---|---|
| mRNA | 0.946 | 11/5/84 |
| mRNA+miRNA | 0.961 | 30/10/60 |
| estimated protein expression | 0.968 | – |
Ovarian cancer: The results for cancer stage prediction on OV patients are illustrated in Figure 5. The results show the same trend as on the BRCA dataset (Figure 4), though the overall AUC score is lower than the prediction for the ER status in BRCA patients. Prediction using the estimated protein expression gives the best AUC score (0.752) followed by the combination of mRNA and miRNA expression (0.726) and mRNA expression (0.719), respectively. Numbers of wins, ties and losses are also reported in Table 5. The superior discriminative power of the estimated protein expression over the mRNA expression and the combination of mRNA and miRNA expression for both BRCA and OV is illustrated in this section. Therefore, estimated protein expression from PTNet is a more accurate predictor of both BRCA and OV phenotypes compared to mRNA expression and concatenated mRNA and miRNA expression. The improvement in cancer outcome prediction can be attributed to the miRNA-mediated regulation mechanism, which we combined with the mRNA expression.
Figure 5 .
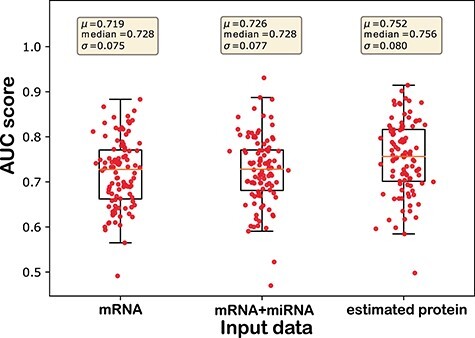
Prediction result of cancer stage on TCGA OV patients. Each dot represents the AUC score from one splitting. Statistics (mean, median, and SD) of the prediction performance of the 100 splittings are shown above each boxplot.
Table 5.
The classification performance on TCGA OV dataset. Average AUC scores and the number of times of win/tie/loss on classification performance between estimated protein expression and the baselines (i.e. mRNA expression and integration of mRNA and miRNA expressions) on OV dataset.
| Input data | AUC score | win/tie/loss |
|---|---|---|
| mRNA | 0.719 | 31/1/68 |
| mRNA+miRNA | 0.726 | 40/0/60 |
| estimated protein expression | 0.752 | – |
Effects of APA events
In this subsection, we explored the effects of 3’-UTR APA on miRNA-mediated regulation in 2-folds: (i) how it changes the miRNA–mRNA interaction and (ii) whether a loss of a sponging mRNA due to APA events reroutes miRNAs to other mRNAs and consequently regulate their expression.
To investigate the effects of 3’-UTR APA on the miRNA–mRNA interaction network, the BRCA patients were divided into the two groups, ER positive and ER negative, and then two lists of mRNAs undergoing APA events corresponding to each group were identified using pipeline APA-Scan [85] which takes aligned bam file for each sample as input. APA-Scan reports the accurate 3’-UTR cleavage site for each mRNA transcript. If the identified cleavage site is upstream of the miRNA-binding position, the transcript will avoid miRNA-mediated regulation and there will be no interactions between the miRNA and the transcript in the network.This process perfectly illustrates the functional relation between the miRNA-mediated gene regulation and 3’-UTR APA.
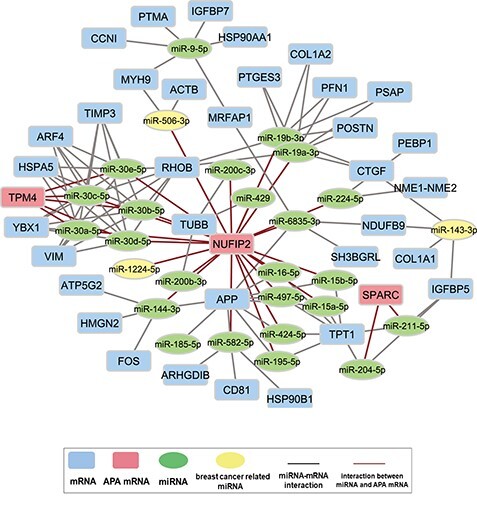
In the experiment, we randomly picked a target mRNA from either list of genes undergoing APA events in the ER positive samples or ER negative samples. A sub-network of its neighborhood was built from the complete mRNA-miRNA interaction network. The neighborhood network was defined by a targeted mRNA, all miRNAs directly bind to it (first-order neighbor of targeted mRNA), and mRNAs directly connected (second-order neighbor of targeted mRNA) to the first-order neighbor miRNAs. For presentation purposes, only 40 mRNAs that contain the highest number of interactions with the first-order neighbor miRNAs were selected as the second-order neighbor mRNAs. Interaction between the selected miRNAs and mRNAs followed the original interaction network. One network for each group (the ER positive or negative group) was then constructed from this sub-network. Figures 6 and 7 illustrate the two networks for the ER positive and ER negative samples, which were built from the same sub-network based on gene IGF2R by APA events. In this analysis, we crosschecked the mRNAs present in the sub-network with the list of mRNAs undergoing APA events for the ER positive and ER negative samples respectively. The mRNAs showing APA events in the ER positive samples were deleted from the network along with their miRNA interactions in Figure 6. On the other hand, the mRNAs showing APA events in the ER negative samples were marked by red color to indicate that it is only present in the ER positive network (Figure 6). The network for ER negative samples illustrated in Figure 7 was constructed in a similar procedure.
Figure 6 .

miRNA–mRNA interaction network for BRCA ER positive samples.
Figure 7 .
miRNA–mRNA interaction network for BRCA ER negative samples.
As mentioned above, the two networks for the ER positive (Figure 6) and ER negative (Figure 7) samples were generated from the same sub-network; therefore, they represent the same neighborhood with the exception of the connections with the mRNA undergoing 3’-UTR APA events. The mRNAs showing APA events are marked with red rectangles whereas all other mRNAs are marked with blue rectangles. Thus, mRNAs marked with red rectangles in Figure 6 will not exist in Figure 7 and vice-versa. All miRNA connections are denoted by gray lines except the mRNAs with APA events, which are marked with red lines. miRNAs are marked by green ovals. Three miRNAs, miR-506-3p, miR-143-3p and miR-1224-5p that are marked as yellow were listed in Table 2 and found as molecular signatures in BRCA studies. All other connections stay the same between the two networks. These two networks illustrate the dynamic nature of miRNA–mRNA interaction from sample to sample. For example, IGF2R marked by the red rectangle in Figure 6 is an mRNA undergoing APA in the ER negative samples. Therefore, this mRNA is present in the network of ER positive samples but absent in the network of ER negative samples. In the ER negative samples, this absence causes additional miRNAs to be available for binding to other mRNAs and provides negative regulation of their expression. The prognostic power of APA events in these genes in cancer are well documented in prior studies [86–89].
In Figure 6, miR-143-3p, which was shown to play a role in the inhibition of tumor cell proliferation and invasion (Table 2), is connected to genes IGF2R and IGFBP5. IGF2R undergoes 3’-UTR APA in the ER negative samples and consequently loses its binding to miR-143-3p. As a result, more miR-143-3p is available for regulatory binding to IGFBP5 mRNA. To investigate whether this loss of connection negatively regulates the expression of IGFBP5 by allowing more miR-143-3p to bind to IGFBP5 mRNA, the changes in the rank of the magnitude of IGFBP5 expression in the ER positive samples were compared to the ER negative samples. All ranks are calculated in a descending order of expression. First, in the ER positive samples, changes in the rank ( ) between IGFBP5 expression among all genes (
 ) and the corresponding protein among all proteins (
 ) is calculated. Then the same approach was taken to calculate the rank for the ER negative samples (
 ) and compared with each other. We found the change of rank in the ER negative samples to be higher than the change in the ER positive samples (–1955 versus –1344) (
 versus
  ), which signifies the negative regulatory effect of miRNA on the IGFBP5 expression. The ranking comparison can be interpreted in such a way that the drop of IGFBP5 expression ranking in the proteome of ER negative samples is higher than that of ER positive samples. IGF2R mRNA, on the other hand, being free from miRNA inhibition rose its ranking higher in the proteome of ER negative samples than the ER positive ones (902 versus 426) (
 versus
  ). Therefore, this experiment demonstrates how 3’-UTR APA events change the miRNA–mRNA interaction(s) and cause negative regulation on the expression of mRNAs.
Discussion
Although the proteome mostly determines biology and clinical outcomes in human disease pathogenesis, the application of current proteome profiling technologies is less exhaustive than transcriptome profiling due to technical limitations such as the dynamic range of data acquisition. Thus, transcriptome profiling using RNA-seq experiments is widely used instead to understand the gene expression in most big data-driven studies. Despite such popularity, the data analysis has been one-dimensional in such a way that differential gene expression analysis has been a standard procedure for most data processing. It limited a comprehensive understanding of the role of the transcriptome by excluding the post-transcriptional regulations and incurred a pervasive problem of poor correlation between the transcriptome and the proteome in big data-driven studies. In this study, we argue that PTNet, a multi-dimensional data analysis model, can overcome the problems in current data analyses and provide evidence that it performs better in assessing the proteome changes and improves the prediction of clinical outcomes compared to current data analysis tools.
Our model highly considers the changes of miRNA-binding sites in the transcriptome. Previously, it was suggested that ceRNAs can modulate the regulatory mechanism of miRNAs [90, 91]. However, in this model, the expression level of ceRNAs has been the major focus as miRNAs were known to target multiple mRNAs in cells. As miRNAs are known to bind to 3’-UTR of mRNAs for the regulation of gene expression, the qualitative and quantitative information on 3’-UTR APA events is critical to understand the regulatory network of miRNAs. So far, numerous bioinformatics pipelines for 3’-UTR APA events have been developed using RNA-seq or 3’-end biased RNA-seq [85, 92–94]. Although they provide a comprehensive profile of 3’-UTR APA events, we demonstrated that integrating two sequencing results (RNA-seq and 3’-end biased RNA-seq) could provide a better resolution of 3’-UTR APA profiling [93]. In this regard, it would be important to develop pipelines that could provide a higher resolution of 3’-UTR APA profiling by considering various RNA-seq resources.
Conclusion
In this study, we introduce a graph-based learning model to predict protein expression in cells. Our model focuses on two particular post-transcriptional regulatory mechanisms in gene expression; miRNA-mediated gene regulation and 3’-UTR APA events. A deep learning-based fusion network was also proposed to combine the mRNA and miRNA expression profiles without considering the miRNA–mRNA interactions as a baseline method. We observed the estimated protein expression is more consistent with the true protein expression and has more discriminative power to classify clinical variables of cancer patients compared to either the mRNA expression or the combination of mRNA and miRNA expression. We also analyzed the effect of 3’-UTR APA events on the ceRNA model where multiple targeting capacity of miRNAs can show the dynamic relationship with their target mRNAs with an intuition that an mRNA losing its miRNA-binding site will result in the regulation of other mRNAs by the same miRNA. Our results show the negative regulation caused by miRNA when one of its neighboring mRNAs undergo 3’-UTR APA. Our findings in this study signify the importance of considering post-transcriptional regulation in cancer research. The proposed efficient and scalable computational methods enable a better understanding of the molecular basis of cancer pathogenesis and provide a previously unrecognized perspective in cancer data mining.
Key Points
A new graph-based learning model is developed to imitate the miRNA regulation based on the neighboring relations of each miRNA in the miRNA–mRNA interaction network and predict the protein expression changes.
A new class of molecular signatures based on estimated protein expression provide more accurate cancer diagnostic and prognostic information compared to mRNA and miRNA expressions.
One mRNA loses its miRNA-binding sites due to 3’-UTR APA, the spare miRNA will bind to the other connected mRNAs in the miRNA–mRNA interaction network and negatively regulate their expression.
A deep learning-based multi-omics fusion network model that considers the relations between different multi-omics features is proposed as a baseline method.
Supplementary Material
Funding
This work was supported by National Science Foundation (NSF) [NSF-III1755761]; and National Institutes of Health (NIH) [2R01GM113952, DK097771]. Funding for open access charge: NIH and NSF.
Acknowledgments
The results are based upon data generated by The Cancer Genome Atlas established by the NCI and NHGRI. Information about TCGA and the investigators and institutions who constitute the TCGA research network can be found at http://cancergenome.nih.gov. The dbGaP accession number to the specific version of the TCGA dataset is phs000178.v8.p7.
Khandakar Tanvir Ahmed is currently a PhD student in Computer Science at the University of Central Florida. He received his BS in Electronic Engineering from Bangladesh University of Engineering and Technology, Bangladesh. His research interests include modeling post-transcriptional regulations and application of machine learning in computational biology.
Jiao Sun is currently a PhD candidate in Computer Science at the University of Central Florida. She received her BS in Electronic Science and Technology from University of Electronic Science and Technology, China. Her research interest include mRNA isoform quantification with NGS, post-transcriptional regulation and its application in human disease.
William Chen is currently a BS student in Computer Science and BA in History at the University of Central Florida. He is supported by NSF REU program. His research interests are in the applications of artificial intelligence in the fields of computational biology and natural language processing.
Irene Martinez is currently a MS student in Molecular Biotechnology at Universität Heidelberg. She received her BS in Molecular Biotechnology from Universität Heidelberg, Germany. Her research interests include medicinal chemistry and cell biology.
Sze Cheng is currently a PhD candidate in Biochemistry, Molecular Biology, and Biophysics at the University of Minnesota, Twin Cities. She received her BS in Biology from Lafayette College. Her research interests include post-transcription gene regulation by cellular signaling as well as RNA cancer biology.
Wencai Zhang is an assistant professor of Medicine at the University of Central Florida. He received his postdoctoral training at the Genome Institute of Singapore and Harvard Medical School. His research interests are broadly in miRNAs, cellular metabolism, tumorigenesis, and drug resistance.
Jeongsik Yong is an associate professor of Biochemistry, Molecular Biology and Biophysics at the University of Minnesota, Twin Cities. He received his PhD and postdoctoral training in Biochemistry and Biophysics at the University of Pennsylvania. His research interests are broadly in the plasticity of functional transcriptomics by cellular signaling.
Wei Zhang is an assistant professor in Computer Science at the University of Central Florida. He received his PhD in Computer Science from University of Minnesota Twin Cities. His research interests are broadly in cancer genomics, network-based learning in bioinformatics and disease phenotype prediction.
Footnotes
Contributor Information
Khandakar Tanvir Ahmed, Department of Computer Science, University of Central Florida, Orlando, FL 32816, USA.
Jiao Sun, Department of Computer Science, University of Central Florida, Orlando, FL 32816, USA.
William Chen, Department of Computer Science, University of Central Florida, Orlando, FL 32816, USA.
Irene Martinez, Department of Molecular Biotechnology, Universität Heidelberg, Heidelberg, 69120, Germany.
Sze Cheng, Department of Biochemistry, Molecular Biology and Biophysics, University of Minnesota Twin Cities, Minneapolis, MN 55455, USA.
Wencai Zhang, Division of Cancer Research, Burnett School of Biomedical Sciences, University of Central Florida, Orlando, FL 32827, USA.
Jeongsik Yong, Department of Biochemistry, Molecular Biology and Biophysics, University of Minnesota Twin Cities, Minneapolis, MN 55455, USA.
Wei Zhang, Department of Computer Science, University of Central Florida, Orlando, FL 32816, USA.
References
- 1. Marioni JC, Mason CE, Mane SM, et al. RNA-seq: an assessment of technical reproducibility and comparison with gene expression arrays. Genome Res 2008;18(9):1509–17. [DOI] [PMC free article] [PubMed] [Google Scholar]
- 2. Wang Z, Gerstein M, Snyder M. RNA-Seq: a revolutionary tool for transcriptomics. Nat Rev Genet 2009;10(1):57–63. [DOI] [PMC free article] [PubMed] [Google Scholar]
- 3. Leinonen R, Sugawara H, Shumway M, et al. The sequence read archive. Nucleic Acids Res 2010;39(suppl_1):D19–21. [DOI] [PMC free article] [PubMed] [Google Scholar]
- 4. Vogel C, Marcotte EM. Insights into the regulation of protein abundance from proteomic and transcriptomic analyses. Nat Rev Genet 2012;13(4):227. [DOI] [PMC free article] [PubMed] [Google Scholar]
- 5. Kosti I, Jain N, Aran D, et al. Cross-tissue analysis of gene and protein expression in normal and cancer tissues. Sci Rep 2016;6:24799. [DOI] [PMC free article] [PubMed] [Google Scholar]
- 6. Edfors F, Danielsson F, Hallström BM, et al. Gene-specific correlation of RNA and protein levels in human cells and tissues. Mol Syst Biol 2016;12(10):883. [DOI] [PMC free article] [PubMed] [Google Scholar]
- 7. Wilhelm M, Schlegl J, Hahne H, et al. Mass-spectrometry-based draft of the human proteome. Nature 2014;509(7502):582–7. [DOI] [PubMed] [Google Scholar]
- 8. Elkon R, Ugalde AP, Agami R. Alternative cleavage and polyadenylation: extent, regulation and function. Nat Rev Genet 2013;14(7):496–506. [DOI] [PubMed] [Google Scholar]
- 9. Chang J-W, Zhang W, Yeh H-S, et al. mRNA 3’-UTR shortening is a molecular signature of mTORC1 activation. Nat Commun 2015;6:7218. [DOI] [PubMed] [Google Scholar]
- 10. Yeh H-S, Zhang W, Yong J. Analyses of alternative polyadenylation: from old school biochemistry to high-throughput technologies. BMB Rep 2017;50(4):201. [DOI] [PMC free article] [PubMed] [Google Scholar]
- 11. Hoffman Y, Bublik DR, Ugalde AP, et al. 3’UTR shortening potentiates microRNA-based repression of pro-differentiation genes in proliferating human cells. PLoS Genet 2016;12(2):e1005879. [DOI] [PMC free article] [PubMed] [Google Scholar]
- 12. Lembo A, Di Cunto F, Provero P. Shortening of 3’ UTRs correlates with poor prognosis in breast and lung cancer. PloS one 2012;7(2):e31129. [DOI] [PMC free article] [PubMed] [Google Scholar]
- 13. Mayr C, Bartel DP. Widespread shortening of 3’ UTRs by alternative cleavage and polyadenylation activates oncogenes in cancer cells. Cell 2009;138(4):673–84. [DOI] [PMC free article] [PubMed] [Google Scholar]
- 14. Sandberg R, Neilson JR, Sarma A, et al. Proliferating cells express mRNAs with shortened 39 untranslated regions and fewer microRNA target sites. Science 2008;320(5883):1643–7. [DOI] [PMC free article] [PubMed] [Google Scholar]
- 15. Zhu J, Zheng Z, Wang J, et al. Different miRNA expression profiles between human breast cancer tumors and serum. Front Genet 2014;5:149. [DOI] [PMC free article] [PubMed] [Google Scholar]
- 16. Schooneveld E, Wouters MCA, Van Auwera I, et al. Expression profiling of cancerous and normal breast tissues identifies microRNAs that are differentially expressed in serum from patients with (metastatic) breast cancer and healthy volunteers. Breast Cancer Res 2012;14(1):R34. [DOI] [PMC free article] [PubMed] [Google Scholar]
- 17. Iorio MV, Ferracin M, Liu C-G, et al. MicroRNA gene expression deregulation in human breast cancer. Cancer Res 2005;65(16):7065–70. [DOI] [PubMed] [Google Scholar]
- 18. Matamala N, Vargas MT, González-Cámpora R, et al. Tumor microRNA expression profiling identifies circulating microRNAs for early breast cancer detection. Clin Chem 2015;61(8):1098–106. [DOI] [PubMed] [Google Scholar]
- 19. Wang Z-H, Cong-Jian X. Research progress of microRNA in early detection of ovarian cancer. Chin Med J (Engl) 2015;128(24):3363. [DOI] [PMC free article] [PubMed] [Google Scholar]
- 20. Dweep H, Gretz N. miRWalk2.0: a comprehensive atlas of microRNA-target interactions. Nat Methods 2015;12(8):697–7. [DOI] [PubMed] [Google Scholar]
- 21. Wong N, Wang X. miRDB: an online resource for microRNA target prediction and functional annotations. Nucleic Acids Res 2014;43(D1):D146–52. [DOI] [PMC free article] [PubMed] [Google Scholar]
- 22. Huang H-Y, Lin Y-C-D, Li J, et al. mirtarbase 2020: updates to the experimentally validated microrna–target interaction database. Nucleic Acids Res 2020;48(D1):D148–54. [DOI] [PMC free article] [PubMed] [Google Scholar]
- 23. Sen R, Ghosal S, Das S, et al. Competing endogenous RNA: the key to posttranscriptional regulation. Scientific World Journal 2014;2014. [DOI] [PMC free article] [PubMed] [Google Scholar]
- 24. Agarwal V, Bell GW, Nam J-W, et al. Predicting effective microRNA target sites in mammalian mRNAs. Elife 2015;4:e05005. [DOI] [PMC free article] [PubMed] [Google Scholar]
- 25. Zhou D, Bousquet O, Lal TN, et al. Learning with local and global consistency. In: Advances in Neural Information Processing Systems, Vancouver, British Columbia, Canada. 2004, 321–8.
- 26. Hwang TH, Sicotte H, Tian Z, et al. Robust and efficient identification of biomarkers by classifying features on graphs. Bioinformatics 2008;24(18):2023–9. [DOI] [PubMed] [Google Scholar]
- 27. Ahmed KT, Park S, Jiang Q, et al. Network-based drug sensitivity prediction. BMC Med Genomics 2020;13(11):1–10. [DOI] [PMC free article] [PubMed] [Google Scholar]
- 28. Zhang W, Johnson N, Wu B, et al. Signed network propagation for detecting differential gene expressions and DNA copy number variations. In: Proceedings of the ACM Conference on Bioinformatics, Computational Biology and Biomedicine. ACM, 2012, 337–44. [Google Scholar]
- 29. Cancer Genome Atlas Network TCGA, et al. Comprehensive molecular portraits of human breast tumours. Nature 2012;490(7418):61. [DOI] [PMC free article] [PubMed] [Google Scholar]
- 30. Cancer Genome Atlas Research Network TCGA, et al. Integrated genomic analyses of ovarian carcinoma. Nature 2011;474(7353):609. [DOI] [PMC free article] [PubMed] [Google Scholar]
- 31. Goldman MJ, Craft B, Hastie M, et al. Visualizing and interpreting cancer genomics data via the Xena platform. Nat Biotechnol 2020;1–4. [DOI] [PMC free article] [PubMed] [Google Scholar]
- Li B, Dewey CN. RSEM: accurate transcript quantification from RNA-Seq data with or without a reference genome. BMC Bioinformatics. 2011 Dec;12(1):1–6. [DOI] [PMC free article] [PubMed] [Google Scholar]
- 33. Gao J, Aksoy BA, Dogrusoz U, et al. Integrative analysis of complex cancer genomics and clinical profiles using the cBioPortal. Sci Signal 2013;6(269):pl1–1. [DOI] [PMC free article] [PubMed] [Google Scholar]
- 34. Souza KCB, Evangelista AF, Leal LF, et al. Identification of cell-free circulating microRNAs for the detection of early breast cancer and molecular subtyping. J Oncol 2019;2019:8393769–8393769. [DOI] [PMC free article] [PubMed] [Google Scholar]
- 35. Zhao H, Gao A, Zhang Z, et al. Genetic analysis and preliminary function study of miR-423 in breast cancer. Tumor Biology 2015;36(6):4763–71. [DOI] [PubMed] [Google Scholar]
- 36. Ma L. Role of miR-10b in breast cancer metastasis. Breast Cancer Res 2010;12(5):210. [DOI] [PMC free article] [PubMed] [Google Scholar]
- 37. Arora H, Qureshi R, Park W-Y. miR-506 regulates epithelial mesenchymal transition in breast cancer cell lines. PloS one 2013;8(5):e64273. [DOI] [PMC free article] [PubMed] [Google Scholar]
- 38. Chen X, Kaixuan Zeng MX, Liu X, et al. P53-induced miR-1249 inhibits tumor growth, metastasis, and angiogenesis by targeting VEGFA and HMGA2. Cell Death Dis 2019;10(2):1–15. [DOI] [PMC free article] [PubMed] [Google Scholar]
- 39. Luo W, Lin Y, Meng S, et al. miRNA-296-3p modulates chemosensitivity of lung cancer cells by targeting CX3CR1. American journal of translational research 2016;8(4):1848. [PMC free article] [PubMed] [Google Scholar]
- 40. Wang W, Dong Y, Li X, et al. MicroRNA-431 serves as a tumor inhibitor in breast cancer through targeting FGF9. Oncol Lett 2020;19(1):1001–7. [DOI] [PMC free article] [PubMed] [Google Scholar]
- 41. Li J, Peng W, Yang P, et al. MicroRNA-1224-5p inhibits metastasis and epithelial-mesenchymal transition in colorectal cancer by targeting SP1-mediated NF-κB signaling pathways. Front Oncol 2020;10:294. [DOI] [PMC free article] [PubMed] [Google Scholar]
- 42. Nagpal N, Ahmad HM, Chameettachal S, et al. HIF-inducible miR-191 promotes migration in breast cancer through complex regulation of TGF β-signaling in hypoxic microenvironment. Sci Rep 2015;5(1):1–14. [DOI] [PMC free article] [PubMed] [Google Scholar]
- 43. An N, Luo X, Zhang M, et al. MicroRNA-376b promotes breast cancer metastasis by targeting Hoxd10 directly. Exp Ther Med 2017;13(1):79–84. [DOI] [PMC free article] [PubMed] [Google Scholar]
- 44. Kuo W-T, Yu S-Y, Li S-C, et al. MicroRNA-324 in human cancer: miR-324-5p and miR-324-3p have distinct biological functions in human cancer. Anticancer Res 2016;36(10):5189–96. [DOI] [PubMed] [Google Scholar]
- 45. Wang S, Bian C, Yang Z, et al. miR-145 inhibits breast cancer cell growth through RTKN. Int J Oncol 2009;34(5):1461–6. [PubMed] [Google Scholar]
- 46. Chen J, Wang M, Guo M, et al. miR-127 regulates cell proliferation and senescence by targeting BCL6. PloS one 2013;8(11):e80266. [DOI] [PMC free article] [PubMed] [Google Scholar]
- 47. Ho J-Y, Hsu R-J, Liu J-M, et al. MicroRNA-382-5p aggravates breast cancer progression by regulating the RERG/Ras/ERK signaling axis. Oncotarget 2017;8(14):22443. [DOI] [PMC free article] [PubMed] [Google Scholar]
- 48. Masuda T, Shinden Y, Noda M, et al. Circulating pre-microRNA-488 in peripheral blood is a potential biomarker for predicting recurrence in breast cancer. Anticancer Res 2018;38(8):4515–23. [DOI] [PubMed] [Google Scholar]
- 49. Xu H, Fei D, Zong S, et al. MicroRNA-154 inhibits growth and invasion of breast cancer cells through targeting E2F5. American journal of translational research 2016;8(6):2620. [PMC free article] [PubMed] [Google Scholar]
- 50. Xi G, Xue J-Q, Han S-J, et al. Circulating microRNA-451 as a predictor of resistance to neoadjuvant chemotherapy in breast cancer. Cancer Biomark 2016;16(3):395–403. [DOI] [PMC free article] [PubMed] [Google Scholar]
- 51. Yuan F, Wang W. MicroRNA-802 suppresses breast cancer proliferation through downregulation of FoxM1. Mol Med Rep 2015;12(3):4647–51. [DOI] [PubMed] [Google Scholar]
- 52. Lu Y, Qin T, Li J, et al. MicroRNA-140-5p inhibits invasion and angiogenesis through targeting VEGF-A in breast cancer. Cancer Gene Ther 2017;24(9):386–92. [DOI] [PMC free article] [PubMed] [Google Scholar]
- 53. Yan L-X, Huang X-F, Shao Q, et al. MicroRNA miR-21 overexpression in human breast cancer is associated with advanced clinical stage, lymph node metastasis and patient poor prognosis. RNA 2008;14(11):2348–60. [DOI] [PMC free article] [PubMed] [Google Scholar]
- 54. Wang C, Bian Z, Wei D, et al. miR-29b regulates migration of human breast cancer cells. Mol Cell Biochem 2011;352(1–2):197–207. [DOI] [PubMed] [Google Scholar]
- 55. Kong W, He L, Richards EJ, et al. Upregulation of miRNA-155 promotes tumour angiogenesis by targeting VHL and is associated with poor prognosis and triple-negative breast cancer. Oncogene 2014;33(6):679–89. [DOI] [PMC free article] [PubMed] [Google Scholar]
- 56. Wang H, Tan G, Dong L, et al. Circulating MiR-125b as a marker predicting chemoresistance in breast cancer. PloS one 2012;7(4):e34210. [DOI] [PMC free article] [PubMed] [Google Scholar]
- 57. Miller TE, Ghoshal K, Ramaswamy B, et al. MicroRNA-221/222 confers tamoxifen resistance in breast cancer by targeting p27Kip1. J Biol Chem 2008;283(44):29897–903. [DOI] [PMC free article] [PubMed] [Google Scholar]
- 58. Ng EKO, Li R, Shin VY, et al. MicroRNA-143 is downregulated in breast cancer and regulates DNA methyltransferases 3A in breast cancer cells. Tumor Biology 2014;35(3):2591–8. [DOI] [PubMed] [Google Scholar]
- 59. Li Y, Zhang M, Chen H, et al. Ratio of miR-196s to HOXC8 messenger RNA correlates with breast cancer cell migration and metastasis. Cancer Res 2010;70(20):7894–904. [DOI] [PMC free article] [PubMed] [Google Scholar]
- 60. Yu Y, Luo W, Yang Z-J, et al. miR-190 suppresses breast cancer metastasis by regulation of TGF- β-induced epithelial–mesenchymal transition. Mol Cancer 2018;17(1):70. [DOI] [PMC free article] [PubMed] [Google Scholar]
- 61. Hurst DR, Edmonds MD, Scott GK, et al. Breast cancer metastasis suppressor 1 up-regulates miR-146, which suppresses breast cancer metastasis. Cancer Res 2009;69(4):1279–83. [DOI] [PMC free article] [PubMed] [Google Scholar]
- 62. Gattolliat CH, Thomas L, Ciafre SA, et al. Expression of miR-487b and miR-410 encoded by 14q32. 31 locus is a prognostic marker in neuroblastoma. Br J Cancer 2011;105(9):1352–61. [DOI] [PMC free article] [PubMed] [Google Scholar]
- 63. Smith RA, Jedlinski DJ, Gabrovska PN, et al. A genetic variant located in miR-423 is associated with reduced breast cancer risk. Cancer Genomics-Proteomics 2012;9(3):115–8. [PubMed] [Google Scholar]
- 64. Qin C-Z, Lou X-Y, Lv Q-L, et al. MicroRNA-184 acts as a potential diagnostic and prognostic marker in epithelial ovarian cancer and regulates cell proliferation, apoptosis and inflammation. Die Pharmazie 2015;70(10):668–73. [PubMed] [Google Scholar]
- 65. Xu HS, Zong HL, Shang M, et al. MiR-324-5p inhibits proliferation of glioma by target regulation of GLI1. Eur Rev Med Pharmacol Sci 2014;18(6):828–32. [PubMed] [Google Scholar]
- 66. Nakayama I, Shibazaki M, Yashima-Abo A, et al. Loss of HOXD10 expression induced by upregulation of miR-10b accelerates the migration and invasion activities of ovarian cancer cells. Int J Oncol 2013;43(1):63–71. [DOI] [PubMed] [Google Scholar]
- 67. Xiao B, Tan L, He B, et al. MiRNA-329 targeting E2F1 inhibits cell proliferation in glioma cells. J Transl Med 2013;11(1):172. [DOI] [PMC free article] [PubMed] [Google Scholar]
- 68. Kang H, Kim C, Lee H, et al. Downregulation of microRNA-362-3p and microRNA-329 promotes tumor progression in human breast cancer. Cell Death Different 2016;23(3):484–95. [DOI] [PMC free article] [PubMed] [Google Scholar]
- 69. Liao Y, Deng Y, Liu J, et al. MiR-760 overexpression promotes proliferation in ovarian cancer by downregulation of PHLPP2 expression. Gynecol Oncol 2016;143(3):655–63. [DOI] [PubMed] [Google Scholar]
- 70. Zhang S, Zhang X, Xueqi F, et al. Identification of common differentially-expressed miRNAs in ovarian cancer cells and their exosomes compared with normal ovarian surface epithelial cell cells. Oncol Lett 2018;16(2):2391–401. [DOI] [PMC free article] [PubMed] [Google Scholar]
- 71. Sun B, Hua J, Cui H, et al. MicroRNA-1197 downregulation inhibits proliferation and migration in human non-small cell lung cancer cells by upregulating HOXC11. Biomed Pharmacother 2019;117:109041. [DOI] [PubMed] [Google Scholar]
- 72. Yeh Y-M, Chuang C-M, Chao K-C, et al. MicroRNA-138 suppresses ovarian cancer cell invasion and metastasis by targeting SOX4 and HIF-1 α. Int J Cancer 2013;133(4):867–78. [DOI] [PubMed] [Google Scholar]
- 73. Wang Fan, Chang Jeremy T-H, Kao Chester Jingshiu, and Huang R Stephanie. High expression of miR-532-5p, a tumor suppressor, leads to better prognosis in ovarian cancer both in vivo and in vitro. Mol Cancer Ther, 15(5):1123–31, 2016. [DOI] [PMC free article] [PubMed] [Google Scholar]
- 74. Tan H, He Q, Gong G, et al. miR-382 inhibits migration and invasion by targeting ROR1 through regulating EMT in ovarian cancer. Int J Oncol 2016;48(1):181–90. [DOI] [PubMed] [Google Scholar]
- 75. Kim Y-W, Kim EY, Jeon D, et al. Differential microRNA expression signatures and cell type-specific association with Taxol resistance in ovarian cancer cells. Drug Des Devel Ther 2014;8:293. [DOI] [PMC free article] [PubMed] [Google Scholar]
- 76. Zhu X, Li Y, Xie C, et al. miR-145 sensitizes ovarian cancer cells to paclitaxel by targeting Sp1 and Cdk6. Int J Cancer 2014;135(6):1286–96. [DOI] [PubMed] [Google Scholar]
- 77. Chan JK, Blansit K, Kiet T, et al. The inhibition of miR-21 promotes apoptosis and chemosensitivity in ovarian cancer. Gynecol Oncol 2014;132(3):739–44. [DOI] [PubMed] [Google Scholar]
- 78. Wu Q, Ren X, Zhang Y, et al. MiR-221-3p targets ARF4 and inhibits the proliferation and migration of epithelial ovarian cancer cells. Biochem Biophys Res Commun 2018;497(4):1162–70. [DOI] [PubMed] [Google Scholar]
- 79. Flavin R, Smyth P, Barrett C, et al. miR-29b expression is associated with disease-free survival in patients with ovarian serous carcinoma. International Journal of Gynecologic Cancer 2009;19(4):641–7. [DOI] [PubMed] [Google Scholar]
- 80. Prislei S, Martinelli E, Mariani M, et al. MiR-200c and HuR in ovarian cancer. BMC Cancer 2013;13(1):72. [DOI] [PMC free article] [PubMed] [Google Scholar]
- 81. Tian X, Xu L, Wang P. MiR-191 inhibits TNF-α induced apoptosis of ovarian endometriosis and endometrioid carcinoma cells by targeting DAPK1. Int J Clin Exp Pathol 2015;8(5):4933. [PMC free article] [PubMed] [Google Scholar]
- 82. Zhou X, Zhao F, Wang Z-N, et al. Altered expression of miR-152 and miR-148a in ovarian cancer is related to cell proliferation. Oncol Rep 2012;27(2):447–54. [DOI] [PubMed] [Google Scholar]
- 83. Yang S, Liu X, Meng J, et al. MicroRNA-1251-5p promotes carcinogenesis and autophagy via targeting the tumor suppressor TBCC in ovarian cancer cells. Mol Ther 2019;27(9):1653–64. [DOI] [PMC free article] [PubMed] [Google Scholar]
- 84. Srivastava AK, Banerjee A, Cui T, et al. Inhibition of miR-328–3p Impairs Cancer Stem Cell Function and Prevents Metastasis in Ovarian Cancer. Cancer Res 2019;79(9):2314–26. [DOI] [PMC free article] [PubMed] [Google Scholar]
- 85. Fahmi NA, Chang J-W, Nassereddeen H, et al. APA-scan: detection and visualization of 3’-UTR APA with RNA-seq and 3′-end-seq data bioRxiv. 2020. [DOI] [PMC free article] [PubMed]
- 86. Oates AJ, Schumaker LM, Jenkins SB, et al. The mannose 6-phosphate/insulin-like growth factor 2 receptor (M6P/IGF2R), a putative breast tumor suppressor gene. Breast Cancer Res Treat 1998;47(3):269–81. [DOI] [PubMed] [Google Scholar]
- 87. Jeong SY, Lim SY, Schevzov G, et al. Loss of Tpm4. 1 leads to disruption of cell-cell adhesions and invasive behavior in breast epithelial cells via increased Rac1 signaling. Oncotarget 2017;8(20):33544. [DOI] [PMC free article] [PubMed] [Google Scholar]
- 88. Watkins G, Douglas-Jones A, Bryce R, et al. Increased levels of SPARC (osteonectin) in human breast cancer tissues and its association with clinical outcomes. Prostaglandins Leukot Essent Fatty Acids 2005;72(4):267–72. [DOI] [PubMed] [Google Scholar]
- 89. Sun Y, Bao X, Ren Y, et al. Targeting HDAC/OAZ1 axis with a novel inhibitor effectively reverses cisplatin resistance in non-small cell lung cancer. Cell Death Dis 2019;10(6):1–13. [DOI] [PMC free article] [PubMed] [Google Scholar]
- 90. Subramanian S. Competing endogenous RNAs (ceRNAs): new entrants to the intricacies of gene regulation. Front Genet 2014;5:8. [DOI] [PMC free article] [PubMed] [Google Scholar]
- 91. Liu Y, Xue M, Shaowei D, et al. Competitive endogenous RNA is an intrinsic component of EMT regulatory circuits and modulates EMT. Nat Commun 2019;10(1):1–12. [DOI] [PMC free article] [PubMed] [Google Scholar]
- 92. Xia Z, Donehower LA, Cooper TA, et al. Dynamic analyses of alternative polyadenylation from RNA-seq reveal 3’-UTR landscape across 7 tumor types. Nat Commun 2014;5:5274. [DOI] [PMC free article] [PubMed] [Google Scholar]
- 93. Chang J-W, Zhang W, Yeh H-S, et al. An integrative model for alternative polyadenylation, IntMAP, delineates mTOR-modulated endoplasmic reticulum stress response. Nucleic Acids Res 2018;46(12):5996–6008. [DOI] [PMC free article] [PubMed] [Google Scholar]
- 94. Ye C, Long Y, Ji G, et al. APAtrap: identification and quantification of alternative polyadenylation sites from RNA-seq data. Bioinformatics 2018;34(11):1841–9. [DOI] [PubMed] [Google Scholar]
Associated Data
This section collects any data citations, data availability statements, or supplementary materials included in this article.