Abstract
Background
Clear cell renal cell carcinoma (ccRCC) is the most common type of renal cell carcinoma (RCC). Immunotherapy, especially anti-PD-1, is becoming a pillar of ccRCC treatment. However, precise biomarkers and robust models are needed to select the proper patients for immunotherapy.
Methods
A total of 831 ccRCC transcriptomic profiles were obtained from 6 datasets. Unsupervised clustering was performed to identify the immune subtypes among ccRCC samples based on immune cell enrichment scores. Weighted correlation network analysis (WGCNA) was used to identify hub genes distinguishing subtypes and related to prognosis. A machine learning model was established by a random forest (RF) algorithm and used on an open and free online website to predict the immune subtype.
Results
In the identified immune subtypes, subtype2 was enriched in immune cell enrichment scores and immunotherapy biomarkers. WGCNA analysis identified four hub genes related to immune subtypes, CTLA4, FOXP3, IFNG, and CD19. The RF model was constructed by mRNA expression of these four hub genes, and the value of area under the receiver operating characteristic curve (AUC) was 0.78. Subtype2 patients in the independent validation cohort had a better drug response and prognosis for immunotherapy treatment. Moreover, an open and free website was developed by the RF model (https://immunotype.shinyapps.io/ISPRF/).
Conclusions
The current study constructs a model and provides a free online website that could identify suitable ccRCC patients for immunotherapy, and it is an important step forward to personalized treatment.
Keywords: Renal cell carcinoma (RCC), immune subtypes, machine learning, online website
Introduction
Renal cell carcinoma (RCC) accounts for over 90% of all kidney cancer, and clear cell renal cell carcinoma (ccRCC) is the most frequent histology subtype (1). ccRCC affects around 300,000 patients worldwide and causes over 100,000 deaths annually (2). The onset of symptoms of ccRCC is usually insidious, so the diagnosis occurs in the advanced stage (3). Besides, ccRCC tends to metastasis to distant organs, such as the lung and liver (4). Due to the resistance of ccRCC to radiotherapy and chemotherapy, the mortality rate of patients with metastatic ccRCC is still high (5). Thus, it is essential to supply novel therapeutic drugs.
Recently, the clinical trial results reported that immune checkpoint antibodies improved patient survival in some types of cancer, including ccRCC (6). The Food and Drug Administration (FDA) approved Nivolumab (PD-1 antibody) in November 2015 for use in metastatic ccRCC patients who progressed on an angiogenesis inhibitor. The FDA made its decision based on findings from the phase 3 CheckMate025 trial, in which the PD-1 antibody improved the median overall survival (OS) and reduced the risk of death versus Everolimus (Afinitor) (7). After that, FDA approved Pembrolizumab (PD-1 antibody) plus Axitinib for the first-line treatment of ccRCC patients by the benefit of OS in the Keynote426 trial (8). Besides, FDA approved Avelumab (PD-L1 antibody) combined with Axitinib for first-line treatment of ccRCC patients in May 2019 (9).
Immunotherapies including PD-1 or PD-L1 antibodies could significantly improve the prognosis of cancer patients, but the number of patients who showed consistent responses to the immunotherapy was limited (10,11). Moreover, side effects and adverse toxicities caused by immune checkpoint antibodies are reported (10). Thus, robust, reliable biomarkers/models that could select the appropriate patient for immune checkpoint antibodies are urgently needed. Currently, the clinical application of each FDA-approved PD-1/PD-L1 antibody depends on the PD-L1 immunohistochemistry assay results (12). However, in the CheckMate025 study, Nivolumab (PD-1 antibody) responses had no correlations with PD-L1 level, and patients with a high level of PD-L1 had a worse prognosis (10). Besides, PD-L1 appears to be a dynamic biomarker since its expression could be largely variable after therapies, including mTOR inhibitors (12). However, several subtypes have distinct clinical behaviors and drug response rates, and various genetic alterations among ccRCC patients (13). Thus, identifying potential immune subtypes could contribute to personalized medicine, reduced cost, and improved survival rate in ccRCC patients.
We aim to build a user-friendly webserver to select proper cancer patients for immunotherapy in the current study. Multiple genomic data of primary ccRCC samples were downloaded to identify immune subtypes that are more sensitive or resistant to immunotherapy. An independent cohort that contained patients treated with immunotherapy was used to confirm the correlation of immune subtypes with drug response and prognosis. After that, a web server based on a machine learning model was constructed to predict the immune subtype of kidney cancer samples by the mRNA expression of four genes. Besides, novel therapeutic targets and drugs need to be supplied for the subtype resistant to immunotherapy. We present the following article in accordance with the STARD reporting checklist (available at https://dx.doi.org/10.21037/tau-21-650).
Methods
Data acquisition
The inclusion criteria for each dataset were set as follows: (I) be generated from the ccRCC patients, (II) contain both diseased (at least 10) and matched healthy controls (at least 10) in the same experimental batch, and (III) come from the samples without any transfection or manipulation which would cover the real expression of genes. The searching deadline was January 2021. In the current study, seven independent cohorts were retrieved: (I) GSE15641 (32 ccRCC samples) (14), GSE36895 (29 ccRCC samples) (15), GSE40435 (101 ccRCC samples) (16), GSE46699 (67 ccRCC samples) (17), GSE53757 (72 ccRCC samples) (18) and The Cancer Genome Atlas (TCGA) (530 ccRCC samples) (19) were used for training datasets. (II) IMvigor210 (20) study, which contained 348 cancer patients treated with Atezolizumab (anti-PD-L1) were taken as the testing dataset. The expression matrix and the corresponding clinical information of these cohorts were downloaded. In each dataset, the missing values for a given gene were replaced by the average of the present expression values for that gene.
Calculation of immune cell infiltration levels
The algorithm single sample Gene Set Enrichment Analysis (ssGSEA), an extension of the Gene Set Enrichment Analysis (GSEA) method, could compute the specific cell enrichment scores by the cell-specific-genes, including immune cell-specific genes. In the current study, immune cell-specific marker genes were downloaded from the supplementary data of the previous article (21). A total of 28 immune cell enrichment scores were calculated by the ssGSEA method from the ‘GSVA’ package in the R language (22). Then, we normalized the immune cell enrichment scores by the equation x = (x − xmin)/(xmax − xmin), where xmin and xmax denoted the minimum and maximum of the score.
The assignment of immune subtypes
Consensus clustering (CC) could find the potential clusters/subtypes within the RNA sequencing dataset and assess the stability of these subtypes (23). The normalized immune cell enrichment score was eligible for CC analysis since the normalized data was necessary for CC analysis. In the current study, the package ‘ConsensusClusterPlus’ (24) in R language was implemented for CC analysis. The key parameters for were set as following: maxK =6, clusterAlg = “hc”, distance = “pearson”. Once CC analysis was performed and the final clusters (immune subtypes) were generated, the proper number of final clusters (K) could be estimated by commonly used methods, including tracking plot, cumulative density function, and relative change in area under cumulative density function (25).
Differentially expressed genes (DEGs) and enrichment analysis
Based on ‘edgeR’ package (26), fold-change (FC) and P value for each mRNA were obtained. Then, the Benjamini and Hochberg method was used to calculate the adjusted P values. The significant DEGs were characterized by false discovery rate (FDR) <0.05 and |Log2(FC)|>1. The GSEA software was downloaded, and the enrichment analysis (27) was conducted in the TCGA dataset between immune subtypes. In the current study, enrichment analysis was completed on the reference gene sets (c2.cp.kegg.v6.1.symbols.gmt) that come from the Molecular Signatures Database.
Construction of a co-expression network
To identify the modules and genes highly associated with the obtained ccRCC immune subtypes, a co-expression network that contains the genes (points) and their correlations (lines) were built by the weighted correlation network analysis (WGCNA) method from the ‘WGCNA’ package of R language (28). In the current study, only immune subtype DEGs (1,136 genes) obtained in the last step were selected for WGCNA analysis since the necessary calculation resources would be reduced, and the modules with higher correlations with the immune subtype would be found. The construction steps of the network in this study contained: (I) filtering outliers and bad samples; (II) selecting the β value to ensure a scale-free network; (III) calculating the correlation matrix; (IV) setting the minimum size of a module; (V) calculating the relationships between modules and immune subtypes. The module with the strongest association with the immune subtype was selected for further analysis.
Construction of a random forest (RF) model for predicting immune subtypes
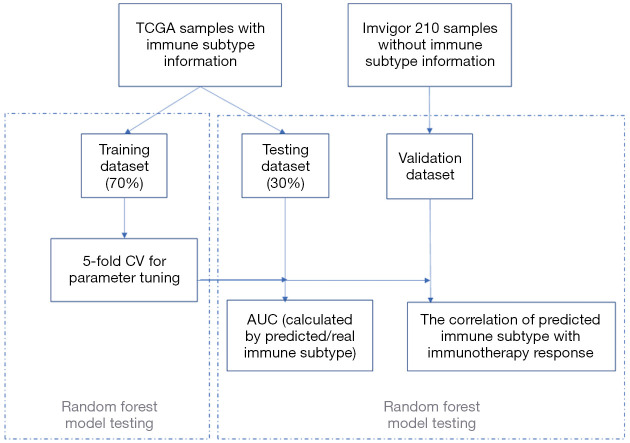
The RF model, one of the most accurate supervised learning methods, was used to construct a model for predicting immune subtypes. The data used for the RF model was the hub genes expression matrix of TCGA samples. Step 1: the input data was randomly separated into the training dataset (70%) and the testing dataset (30%). Step 2: the best parameters for the RF model were selected by 5-fold cross-validation (CV) in the training dataset. Step 3: after setting the best parameter, the prediction accuracy of the RF model for the immune subtype prediction was tested in the testing dataset. Step 4: an independent dataset (IMvigor210) was selected to validate the correlation of predicted immune subtype with the immunotherapy response rates and prognosis (20).
Construction of a user-friendly website for immune subtype prediction
Shiny is a framework from the R language and could build web applications. In the current study, the machine learning (RF) model was implemented in the ‘Rshiny’ package in the R language. The web application was named Immune Subtype Prediction by Random Forest (ISPRF) and could be accessed via the URL (https://immunotype.shinyapps.io/ISPRF/). Any user or organization could freely use ISPRF App without limitations. The ISPRF App has been tested in different environments (Linux, Windows, and Mac OS) and is also compatible with popular web browsers, including Chrome, Firefox, and Internet Explorer.
Potential drugs for the immunotherapy-resistant subtype
Drugs targeting immunotherapy-resistant subtype hub genes were selected using the Drug-Gene Interaction Database (DGIdb; https://www.dgidb.org/) (29). For the drugs from DGIdb, only the FDA-approved drugs were retained. Discovery Studio software could predict the pharmacologic properties of small molecules. These pharmacologic properties, including aqueous solubility level, blood-brain barrier (BBB) level, CYP2D6 binding, hepatotoxicity, human intestinal absorption level, and plasma protein binding (PPB) properties, directly determine the viability of a drug candidate (30).
Statistical analysis and ethical statement
OS plus progression-free survival (PFS) were selected to compare survival time between groups using the Kaplan-Meier model in the R package ‘survival’ (31). We obtained immune cytolytic activity (CYT) according to the summation of two cytolytic effectors’ expression values (GZMA and PRF1) (32). The Wilcoxon rank-sum test was used to compare the average value for analyzing the levels of immunotherapy indicators in different immune subtypes.
All the expression data and clinical information were retrieved from publicly available datasets, which were free to download and analyze without limitations. Investigators of each study obtained approval from their local ethics committee and informed patient consent. The study was conducted in accordance with the Declaration of Helsinki (as revised in 2013).
Results
Molecular immune subtypes in ccRCC patients
Six datasets, GSE15641 (32 ccRCC samples), GSE36895 (29 ccRCC samples), GSE40435 (101 ccRCC samples), GSE46699 (67 ccRCC samples), GSE53757 (72 ccRCC samples) and TCGA (530 ccRCC samples) were downloaded. The gene expression matrix of these six datasets was used to calculate the immune cells enrichment scores (ssGSEA score) by adopting the ssGSEA method. The survival analysis of immune cells enrichment scores in the TCGA dataset showed that six immune cells, including activated CD4 T cells, activated CD8 T cells, were significant survival-related biomarkers, and the patients with high levels had worse OS than those in the low levels group (Figure S1). The PCA results of these six datasets gene expression matrix indicated the obvious batch effects since these datasets displayed a significant difference (Figure S2A). However, the PCA results of these six datasets’ immune cells’ enrichment scores (normalized ssGSEA score) showed that differences between datasets were eliminated (Figure S2B).
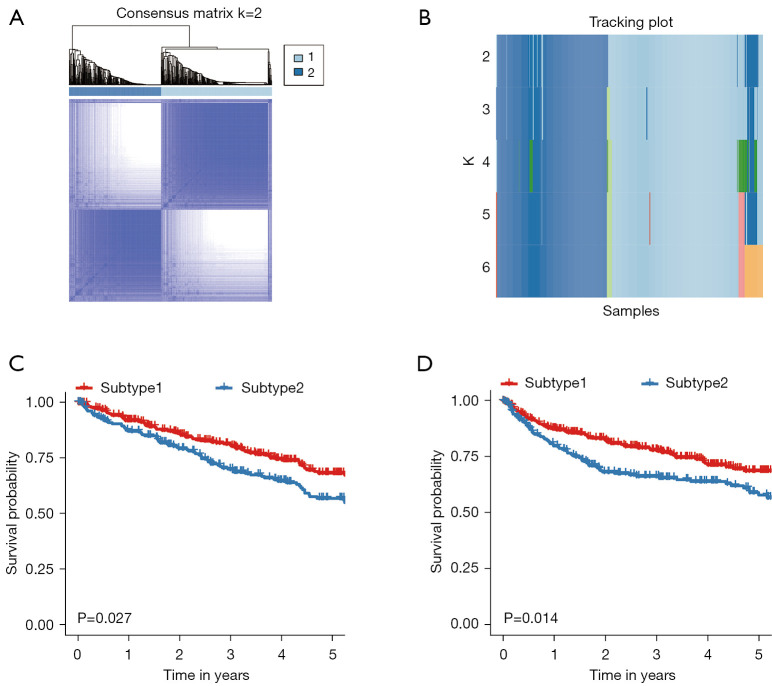
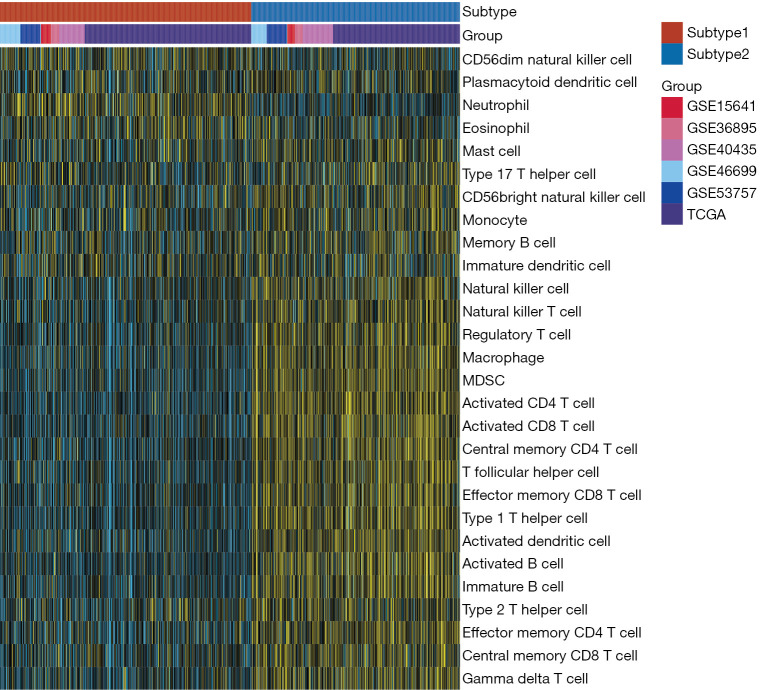
CC of 831 ccRCC patients from six datasets using immune cells enrichment scores was performed. Two main immune subtypes were identified and named subtype1/subtype2 (Figure 1A). The tracking plots showed that two was the best value of subtypes number (Figure 1B), while cumulative distribution function (CDF) results indicated 3 (Figure S3A,S3B). Since the sample numbers in subtypes 3 to subtype 6 were too small (Figure 1B), two main immune subtypes were finally identified. The distribution of immune subtypes (subtype1 and subtype2) among different datasets was shown in Table 1. As shown in Figure 1C,1D, both in the OS and PFS analysis, differences in the survival curves between the subtype1 and subtype2 were statistically significant (P=0.027 and P=0.014, respectively). Patients in subtype1 had a better prognosis than subtype2 patients. Subsequently, ssGSEA scores indicated that subtype2 samples were highly infiltrated with innate and adaptive immune cells, including B cells, CD8 T cells, CD4 T cells, macrophages, NK cells, and regulatory T cells (Tregs), while subtype1 samples only showed a high level of neutrophils (Figure 2). Besides, some immune checkpoint therapy biomarkers, including CD8A, PDL1, PD1, and tumor mutational burden (TMB), were also enriched in subtype2 (Figure S4).
Figure 1.
CC for the ccRCC by combining six datasets GSE15641, GSE36895, GSE40435, GSE46699, GSE53757, and TCGA). (A) Consensus matrix heatmap plots when k=2. (B) Tracking plot for k=2 to 6. In the tracking plot, the colors in each row represented the samples in different subtypes (C) Five-year Kaplan-Meier curves for OS of ccRCC patients stratified by the immune subtypes. (D) Five-year Kaplan-Meier curves for PFS of ccRCC patients stratified by the immune subtypes. The log-rank test calculated the P value among subtypes. CC, consensus clustering; ccRCC, clear cell renal cell carcinoma; TCGA, The Cancer Genome Atlas; OS, overall survival; PFS, progression-free survival.
Table 1. The distribution of immune subtypes among different datasets.
| Immune subtypes | GSE15641 | GSE36895 | GSE40435 | GSE46699 | GSE53757 | TCGA |
|---|---|---|---|---|---|---|
| ccRCC samples | 32 | 29 | 101 | 67 | 72 | 530 |
| Subtype1 | 18 | 15 | 46 | 38 | 36 | 301 |
| Subtype2 | 14 | 14 | 55 | 29 | 36 | 229 |
TCGA, The Cancer Genome Atlas; ccRCC, clear cell renal cell carcinoma.
Figure 2.
The gene expression scores of 28 immune signatures in two subtypes are displayed by heatmap.
DEGs and enriched pathways between immune subtypes
DEGs between immune subtypes were analyzed. A total of 614 DEGs were highly expressed in subtype2, and 522 DEGs were defined as down-regulated DEGs in subtype2. The volcano plot of the TCGA cohort was shown in Figure S5. Metabolism pathways including oxidative phosphorylation, fatty acid metabolism, retinol metabolism, and tyrosine metabolism were mostly enriched in subtype1 (Table S1). However, immune-related pathways involving natural killer cell-mediated cytotoxicity, T cell receptor signaling pathway, antigen processing, and presentation were mostly enriched in subtype2 (Table S2).
Construction of co-expression network
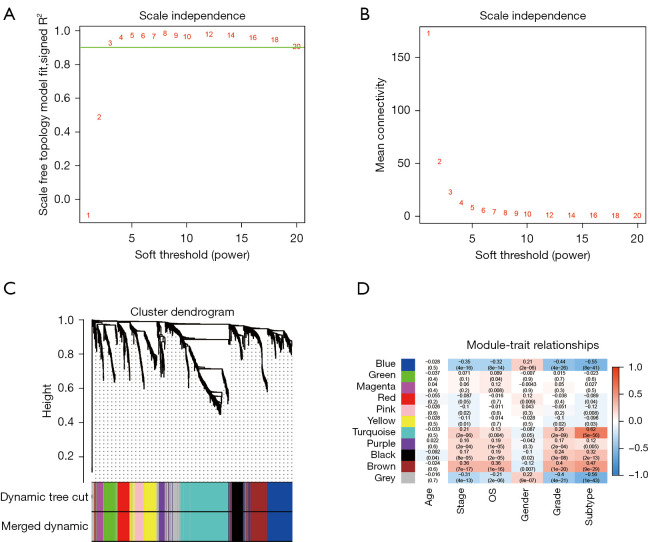
The TCGA dataset was selected for WGCNA since the clinical information of other datasets was not available, and the expression matrix of DEGs from TCGA was used to construct the co-expression network. Based on the results of scale-free topology fitting indices R2 and mean connectivity (Figure 3A,3B), the best value of β was 3 since it could construct a scale-free network. A total of 11 different modules, ranging in size from 30 to 525 genes, was provided by WGCNA results (Figure 3C). Among these modules, the turquoise module was selected, as it had the highest correlation value with the immune subtype (correlation =0.62; P<0.01) (Figure 3D). Besides, the blue module was selected since it had a significantly negative correlation with the immune subtype (correlation =−0.55; P<0.01) (Figure 3D).
Figure 3.
Identification of key modules connected with clinical features and immune subtypes through WGCNA. (A,B) The scale-free fit index and the mean connectivity for various soft-thresholding powers, respectively. When the soft-thresholding powers (β) equaled three, the average degree of connectivity was close to zero. (C) The cluster dendrogram of 5,000 module eigengenes from the TCGA dataset. Each branch in the figure represented one gene, and every color below represented one co-expression module. (D) Heatmap of the correlation between module eigengenes and clinical traits, including molecular subtypes. The color of cells in the heatmap represented the correlation coefficients of different sizes. Specifically, red colors represented the positive correlations, and green colors stood for the negative correlations. The figure without brackets in each cell indicated the clinical feature correlation coefficients. The corresponding P value was shown below in parentheses. WGCNA, weighted correlation network analysis; TCGA, The Cancer Genome Atlas.
Identification of protein-protein interactions (PPIs) and hub genes
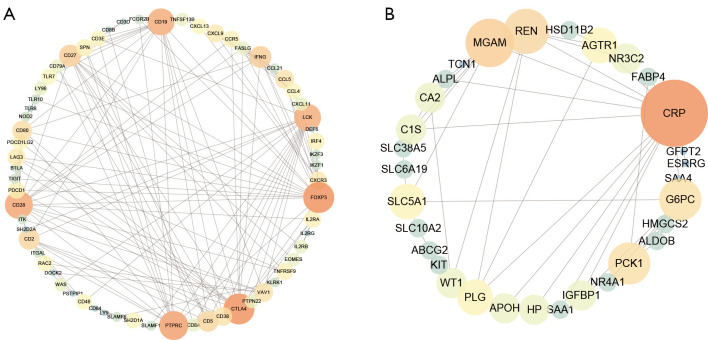
The PPI networks of the turquoise module and the blue module were individually retrieved from the STRING database and then visualized by Cytoscape software. Subsequently, 10 hub genes (FOXP3, CTLA4, PTPRC, CD28, CD19, LCK, CD27, CD2, IFNG, and CD5) from the network of the turquoise module were selected with the cut-off value of degree >10, using the cytoHubba plug of Cytoscape (Figure 4A). The survival analysis results of these hub genes revealed that high expression levels of CTLA4, FOXP3, IFNG, and CD19 were associated with the worse OS (Figure S6). Similarly, 10 hub genes (AGTR1, CRP, G6PC, IGFBP1, MGAM, PCK1, PLG, REN, SLC5A1, and WT1) from the network of the blue module were identified with the cut-off value of degree >4 (Figure 4B). The survival analysis result revealed that high expression levels of three genes (CRP, IGFBP1, and WT1) and low expression levels of seven genes (AGTR1, G6PC, MGAM, PCK1, PLG, REN, and SLC5A1) were associated with the worse OS (Figure S7).
Figure 4.
PPI network of genes in selected modules. The color intensity and the size of nodes were positively correlated with the degree score. (A) Turquoise module. (B) Blue module. PPI, protein-protein interaction.
Validation of immune subtypes in the independent cohort
The two subtypes were further validated in an external cohort of IMvigor210, using a RF model. The hub genes (CTLA4, FOXP3, IFNG, and CD19) from the turquoise module were selected to construct a RF model for predicting immune subtypes by gene expression. IMvigor210 contains 348 tumor patients who received treatment with the immune checkpoint inhibitor therapy (Atezolizumab). Clinical data of these 348 tumor patients were described in Table S3.
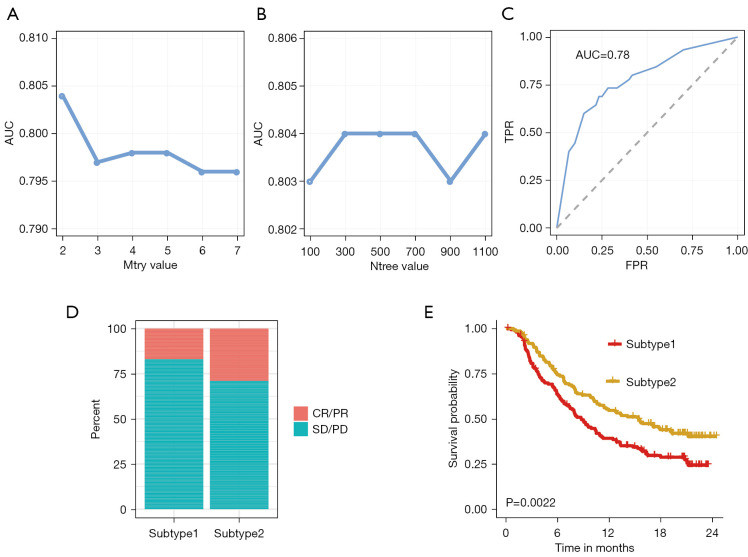
The pipeline of machine learning (RF) workflow was plotted in Figure 5. In the training phase, the input data (TCGA dataset samples with their subtype information and four genes expression matrix) was randomly separated into the training dataset (70%) and the testing dataset (30%). Based on the median value, the expression values of CTLA4, FOXP3, IFNG, and CD19 were divided into ‘high’ and ‘low’ groups, respectively. Eight variables including ‘CTLA4_high’, ‘CTLA4_low’, ‘FOXP3_high’, ‘FOXP3_low’, ‘IFNG_high’, ‘IFNG_low’, ‘CD19_high’, and ‘CD19_low’ were generated, thus the four genes expression matrix was transformed into eight variables matrix. The parameter tuning results showed that 2 and 300 were the best value for ‘mtry’ and ‘ntree’ due to their highest value of area under the receiver operating characteristic curve (AUC) (Figure 6A,6B). The RF is then trained with the best parameter (mtry =2, ntree =300). The rank of importance value in the constructed model for these eight variables were FOXP3_high (0.99), IFNG_high (0.97), IFNG_low (0.94), FOXP3_low (0.82), CTLA4_low (0.47), CTLA4_high (0.27), CD19_high (0.06) and CD19_low (0.01). In the testing phase, the AUC value in the testing dataset indicated a good prediction performance with 0.78 (Figure 6C). Subsequently, the immune subtype of patients from the IMvigor210 cohort was predicted by their expression data profiles of four hub genes (CTLA4, FOXP3, IFNG, and CD19). Patients in subtype2 behaved a better overall response rate to Atezolizumab, about 29%, whereas subtype1 worst objective response rate (ORR), about 16% (Figure 6D). The OS analysis results in the IMvigor210 cohort confirmed that patients with subtype2 had better prognoses than subtype1 patients (Figure 6E). Consistent with results from the TCGA cohort, subtype2 in the IMvigor210 cohort was characterized as high expression of various immunotherapy indicators (CD8A, PDL1, TIGIT, CTLA4, CYT, IFNG, LAG3, PDCD1, TMB) in Figure S8.
Figure 5.
The pipeline of machine learning (RF) workflow. RF, random forest; TCGA, The Cancer Genome Atlas; CV, cross-validation; AUC, area under the receiver operating characteristic curve.
Figure 6.
Parameter tuning and model validation. (A) The ‘mtry’ with the highest AUC was selected as the optimal value of the RF algorithm. (B) The ‘ntree’ with the highest AUC was selected as the optimal value of the RF algorithm. (C) Validation of model in the testing dataset. (D) The correlation of predicted immune subtype with the response rate to immunotherapy in the IMvigor210 dataset. (E) The correlation of predicted immune subtype with the survival analysis in the IMvigor210 dataset. AUC, area under the receiver operating characteristic curve; RF, random forest; CR, complete response; PR, partial response; SD, stable disease; PD, progressive disease.
Web tool development
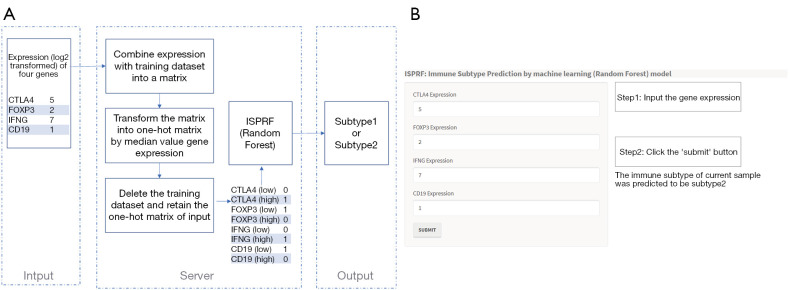
Using the RStudio shiny package, a web application (https://immunotype.shinyapps.io/ISPRF/) was built to predict immune subtypes. In this web application, expression profiles of four hub genes (CTLA4, FOXP3, IFNG, and CD19) were required as input data (Figure 7A). The input data will be sent to the servers where the application pre-processes the data, including four steps: (I) combining the input data with the training dataset; (II) transforming the matrix into the one-hot matrix by the median value of each gene; (III) deleting the training dataset. (IV) After pre-processing the input data, this application predicts the probability of immune subtypes using the RF model. Then, the immune subtype that results in the highest probability is picked as the predicted immune subtype. In Figure 7B, the interface shows an example of predicting the immune subtype by four genes expression.
Figure 7.
The workflow and homepage of Shiny APP. (A) The workflow of RF model in Shiny APP (https://immunotype.shinyapps.io/ISPRF/). (B) The interface shows an example of predicting the immune subtype by four genes expression. RF, random forest.
Identification of potential drugs for the immunotherapy-resistant subtype
Since patients from immune subtype1 might have a low response rate to immune checkpoint antibodies, some potential drugs are needed. Thus, hub genes in the blue module, which had a negative correlation with the immune subtype, could be the targets for identifying potential drugs. According to the above significant survival prognosis results, three hub genes from the blue module (CRP, IGFBP1, and WT1) were selected for further analysis due to their negative effect on the prognosis. A total of 6 small molecules, 1 monoclonal antibody, and 1 synthetic peptide for targeting these hub genes were provided by the DGIdb website that contained drug-gene interactions (Table 2). Pharmacologic properties of six small molecule drugs were unearthed under Discovery Studio 2019 software (Table 3): (I) the aqueous solubility results showed no drug was characterized with low aqueous solubility ability; (II) only one drug was high penetrant for BBB; (III) all small molecules drugs were non-inhibitor of CYP2D6, which was responsible for drug metabolism; (IV) two drugs, ZINC150338696 and ZINC169294721, were non-toxic drugs based on hepatotoxicity prediction results; (V) one drug had the good intestinal absorption level; (VI) as to PPB, three drugs were predicted to be absorbent strong. Based on the above results, ZINC169294721 was selected as the potential small molecule drug for immune subtype1 patients since it had good aqueous-solubility ability and was non-toxic.
Table 2. The drugs from DGIdb.
| Gene | Drug | Zinc ID | Type | Interaction | PMID |
|---|---|---|---|---|---|
| CRP | Adalimumab | Not available | Monoclonal antibody | Inhibitor | 23517933 |
| Fenofibrate | ZINC584092 | Small molecule | Inhibitor | 21939559 | |
| Rosuvastatin | ZINC1535101 | Small molecule | Inhibitor | 21641360 | |
| WT1 | Sirolimus | ZINC169294721 | Small molecule | Inhibitor | 18927120 |
| Daunorubicin | ZINC3917708 | Small molecule | Inhibitor | 30837363 | |
| IGFBP1 | Buserelin | Not available | Synthetic peptide | Promoter | 1721621 |
| Octreotide | ZINC150338696 | Small molecule | Inhibitor | 9604870 | |
| Streptozocin | ZINC3995968 | Small molecule | Promoter | 1698152 |
DGIdb, Drug-Gene Interaction Database.
Table 3. The pharmacologic properties of drugs.
| Compounds | Solubility level | BBB level | CYP2D6 | Hepatotoxicity | Absorption level | PPB level |
|---|---|---|---|---|---|---|
| ZINC3917708 | 2 | 4 | 0 | 1 | 3 | 0 |
| ZINC150338696 | 1 | 4 | 0 | 0 | 3 | 0 |
| ZINC3995968 | 4 | 4 | 0 | 1 | 3 | 0 |
| ZINC584092 | 2 | 1 | 0 | 1 | 0 | 1 |
| ZINC1535101 | 3 | 4 | 0 | 1 | 2 | 1 |
| ZINC169294721 | 3 | 4 | 0 | 0 | 3 | 1 |
Aqueous-solubility level: 0, extremely low; 1, very low, but possible; 2, low; 3, good. BBB level: 0, very high penetrant; 1, high; 2, medium; 3, low; 4, undefined. CYP2D6 level: 0, noninhibitor; 1, inhibitor. Hepatotoxicity: 0, nontoxic; 1, toxic. Human-intestinal absorption level: 0, good; 1, moderate; 2, poor; 3, very poor. PPB: 0, absorbent weak; 1, absorbent strong. BBB, blood-brain barrier; CYP2D6, cytochrome P-450 2D6; PPB, plasma protein binding.
Discussion
Immunotherapies, including PD-1/PD-L1 antibodies, are considered promising tumor intervention methods since immunotherapies prolonged the OS time of ccRCC patients in different clinical trials (33). However, the response rate of cancer patients to immunotherapy is still limited and unsatisfactory (34). Since the tumor heterogeneity exists among cancer samples, identifying potential immune subtypes with different immunotherapy drug responses could contribute to the individualized immunotherapy treatment. Currently, some indicators, including PD-L1 and TMB, were recommended for selecting appropriate immunotherapy candidates (35,36). However, PD-L1 is a dynamic biomarker since its expression could be remodeled using antiangiogenic drugs (37). TMB, defined as the total number of nonsynonymous mutations per coding area of a tumor genome, is determined using whole-exome sequencing, which is cost-effective and needs a long turnaround time (38). Thus, robust biomarkers and prediction models for selecting the patients for immune checkpoint therapies are urgently needed.
We pooled data from TCGA and GEO datasets in the current study to enlarge our sample size and used immune cells enrichment scores to eliminate the batch effect among different datasets successfully. Using the immune cells enrichment scores from multiple datasets (a total of 831 samples) and the CC method, we subdivided the ccRCC samples into two immune subtypes. These two immune subtypes were named subtype1 and subtype2, demonstrating distinct prognoses. In the TCGA dataset, subtype1 patients had a better prognosis than subtype2 patients with the surgical treatment. The immune-related characteristics or immunotherapy biomarkers, including T-cell cytolytic activity, immune checkpoints, and active IFN signaling, were significantly higher in subtype2. Thus, subtype2 patients were recommended to receive immunotherapy.
By bioinformatical methods including DEG analysis and WGCNA, four hub genes (CTLA4, FOXP3, IFNG, and CD19) were selected. These four hub genes have deep and complicated associations with tumor microenvironment such as immune cells. A previous study found that CTLA4 expression value was strongly correlated with the levels of T cells in 33 cancer types (39). But CTLA4 usually negatively regulates T cell activation and was accompanied by an immunosuppressed phenotype (40). FOXP3 could reprogram T cell metabolism, improve the T-regulatory cells (Tregs), and suppress the cell function and proliferation of CD8+ T cells (41). In contrast, IFNG could serve as the CD8+ T cell differentiation signal and induce the CD8+ T cell proliferation. CD4 T cells and macrophages could also be activated by IFNG, while Th2 cells were inhibited by IFNG (42). CD19 could activate the B cells by decreasing its threshold for receptor-dependent signaling (43).
Usually, drug response prediction requires robust models based on many samples, effective biomarkers, and efficient computational tools. In the current study, we built a RF model to predict the immune subtype by inputting the expression levels of only four mRNAs. The model indicated a good prediction performance in the testing dataset by the value of AUC (0.78). Moreover, the drug response and prognosis of subtype2 patients in the validation cohort, which contains patients treated with immune checkpoint inhibitors, were better than subtype1 patients. In the previous study, a total of 12 immune-associated lncRNAs were identified, and a risk score model was built to predict the prognosis of ccRCC patients (44). However, a convenient web server that is built by a smaller number of genes is needed. We have developed the open and free online website of ISPRF to make the RF model available for organizations or individuals. The ISPRF offers an appropriate framework to employ machine learning algorithms on four mRNAs expression to predict a patient’s immune subtype and thus provide the advice for the immunotherapy treatment choice.
To identify more potential drugs for the immunotherapy-resistant subtype, eight candidate drugs were obtained from the prediction of the DGIdb dataset depending on hub genes. Among the eight drugs, Sirolimus was the most promising drug. Sirolimus (rapamycin) is a macrolide and is usually produced by Streptomyces hygroscopicus. Sirolimus could reduce cell proliferative action by binding with FK-binding protein-12 and inhibiting mTORC1 (45). Moreover, Sirolimus can inhibit the growth of renal cancer cells (46). For the target of Sirolimus, the expression of WT1 is extremely low in kidney normal epithelial cells but higher in kidney cancer cells (47). Besides, WT1 can promote the survival of various cancer cells through anti-apoptotic functions (48).
Of note, the immune subtypes of ccRCC were constructed based on the TCGA and GEO cohorts, which were treated with surgery and did not receive immune checkpoint therapies. Although we validated the identified immune subtypes in an independent cohort (IMvigor210), these two immune subtypes still require to be tested in clinical trials that focus on the correlation of immune subtypes and drug responses. Secondly, functional research of hub genes that could elucidate the underlying potential mechanisms is needed. Besides, the hub genes and the selected drug for immunotherapy-resistant subtype need validation by in vitro and in vivo experiments, and it will be implemented in our future practice and research.
Conclusions
We identified two ccRCC immune subtypes with distinct clinical behavior and prognosis. Furthermore, a machine learning model to predict the ccRCC immune subtype by four mRNAs expression was constructed, and the model was also implemented on the online website and available for organizations and individuals. Our study has important clinical significance, and clinicians could take the model as a reference for individualized treatment.
Supplementary
The article’s supplementary files as
Acknowledgments
Funding: The project was supported by Early Diagnosis and Recurrence Monitoring of Upper Urothelial Tumors Based on Non-Invasive Urine Genomics (Science and Technology Research of Henan Provincial Health and Health Commission SBGJ202002002).
Ethical Statement: The authors are accountable for all aspects of the work in ensuring that questions related to the accuracy or integrity of any part of the work are appropriately investigated and resolved. All the expression data and clinical information were retrieved from publicly available datasets, which were free to download and analyze without limitations. Investigators of each study obtained approval from their local ethics committee and informed patient consent. The study was conducted in accordance with the Declaration of Helsinki (as revised in 2013).
Reporting Checklist: The authors have completed the STARD reporting checklist. Available at https://dx.doi.org/10.21037/tau-21-650
Conflicts of Interest: All authors have completed the ICMJE uniform disclosure form (available at https://dx.doi.org/10.21037/tau-21-650). The authors have no conflicts of interest to declare.
(English Language Editor: J. Chapnick)
References
- 1.Hsieh JJ, Purdue MP, Signoretti S, et al. Renal cell carcinoma. Nat Rev Dis Primers 2017;3:17009. 10.1038/nrdp.2017.9 [DOI] [PMC free article] [PubMed] [Google Scholar]
- 2.Siegel RL, Miller KD, Jemal A. Cancer statistics, 2019. CA Cancer J Clin 2019;69:7-34. 10.3322/caac.21551 [DOI] [PubMed] [Google Scholar]
- 3.Waalkes S, Kramer M, Herrmann TR, et al. Present state of target therapy for disseminated renal cell carcinoma. Immunotherapy 2010;2:393-8. 10.2217/imt.10.14 [DOI] [PubMed] [Google Scholar]
- 4.Cáceres W, Cruz-Chacón A. Renal cell carcinoma: molecularly targeted therapy. P R Health Sci J 2011;30:73-7. [PubMed] [Google Scholar]
- 5.Siegel RL, Miller KD, Jemal A. Cancer statistics, 2018. CA Cancer J Clin 2018;68:7-30. 10.3322/caac.21442 [DOI] [PubMed] [Google Scholar]
- 6.Barata PC, Rini BI. Treatment of renal cell carcinoma: current status and future directions. CA Cancer J Clin 2017;67:507-24. 10.3322/caac.21411 [DOI] [PubMed] [Google Scholar]
- 7.Motzer RJ, Escudier B, McDermott DF, et al. Nivolumab versus everolimus in advanced renal-cell carcinoma. N Engl J Med 2015;373:1803-13. 10.1056/NEJMoa1510665 [DOI] [PMC free article] [PubMed] [Google Scholar]
- 8.Rini BI, Plimack ER, Stus V, et al. Pembrolizumab plus axitinib versus sunitinib for advanced renal-cell carcinoma. N Engl J Med 2019;380:1116-27. 10.1056/NEJMoa1816714 [DOI] [PubMed] [Google Scholar]
- 9.Motzer RJ, Penkov K, Haanen J, et al. Avelumab plus axitinib versus sunitinib for advanced renal-cell carcinoma. N Engl J Med 2019;380:1103-15. 10.1056/NEJMoa1816047 [DOI] [PMC free article] [PubMed] [Google Scholar]
- 10.Shen X, Zhao B. Efficacy of PD-1 or PD-L1 inhibitors and PD-L1 expression status in cancer: meta-analysis. BMJ 2018;362:k3529. 10.1136/bmj.k3529 [DOI] [PMC free article] [PubMed] [Google Scholar]
- 11.Lin H, Chen L, Li W, et al. Novel therapies for tongue squamous cell carcinoma patients with high-grade tumors. Life (Basel) 2021;11:813. 10.3390/life11080813 [DOI] [PMC free article] [PubMed] [Google Scholar]
- 12.Lopez-Beltran A, Henriques V, Cimadamore A, et al. The identification of immunological biomarkers in kidney cancers. Front Oncol 2018;8:456. 10.3389/fonc.2018.00456 [DOI] [PMC free article] [PubMed] [Google Scholar]
- 13.Chen F, Zhang Y, Şenbabaoğlu Y, et al. Multilevel genomics-based taxonomy of renal cell carcinoma. Cell Rep 2016;14:2476-89. 10.1016/j.celrep.2016.02.024 [DOI] [PMC free article] [PubMed] [Google Scholar]
- 14.Jones J, Otu H, Spentzos D, et al. Gene signatures of progression and metastasis in renal cell cancer. Clin Cancer Res 2005;11:5730-9. 10.1158/1078-0432.CCR-04-2225 [DOI] [PubMed] [Google Scholar]
- 15.Peña-Llopis S, Brugarolas J. Simultaneous isolation of high-quality DNA, RNA, miRNA and proteins from tissues for genomic applications. Nat Protoc 2013;8:2240-55. 10.1038/nprot.2013.141 [DOI] [PMC free article] [PubMed] [Google Scholar]
- 16.Wozniak MB, Le Calvez-Kelm F, Abedi-Ardekani B, et al. Integrative genome-wide gene expression profiling of clear cell renal cell carcinoma in Czech Republic and in the United States. PLoS One 2013;8:e57886. 10.1371/journal.pone.0057886 [DOI] [PMC free article] [PubMed] [Google Scholar]
- 17.Eckel-Passow JE, Serie DJ, Bot BM, et al. Somatic expression of ENRAGE is associated with obesity status among patients with clear cell renal cell carcinoma. Carcinogenesis 2014;35:822-7. 10.1093/carcin/bgt485 [DOI] [PMC free article] [PubMed] [Google Scholar]
- 18.von Roemeling CA, Radisky DC, Marlow LA, et al. Neuronal pentraxin 2 supports clear cell renal cell carcinoma by activating the AMPA-selective glutamate receptor-4. Cancer Res 2014;74:4796-810. 10.1158/0008-5472.CAN-14-0210 [DOI] [PMC free article] [PubMed] [Google Scholar]
- 19.Ricketts CJ, De Cubas AA, Fan H, et al. The Cancer Genome Atlas comprehensive molecular characterization of renal cell carcinoma. Cell Rep 2018;23:313-326.e5. 10.1016/j.celrep.2018.03.075 [DOI] [PMC free article] [PubMed] [Google Scholar]
- 20.Balar AV, Galsky MD, Rosenberg JE, et al. Atezolizumab as first-line treatment in cisplatin-ineligible patients with locally advanced and metastatic urothelial carcinoma: a single-arm, multicentre, phase 2 trial. Lancet 2017;389:67-76. Erratum in: Lancet 2017;390:848. 10.1016/S0140-6736(16)32455-2 [DOI] [PMC free article] [PubMed] [Google Scholar]
- 21.Charoentong P, Finotello F, Angelova M, et al. Pan-cancer immunogenomic analyses reveal genotype-immunophenotype relationships and predictors of response to checkpoint blockade. Cell Rep 2017;18:248-62. 10.1016/j.celrep.2016.12.019 [DOI] [PubMed] [Google Scholar]
- 22.Hänzelmann S, Castelo R, Guinney J. GSVA: gene set variation analysis for microarray and RNA-seq data. BMC Bioinformatics 2013;14:7. 10.1186/1471-2105-14-7 [DOI] [PMC free article] [PubMed] [Google Scholar]
- 23.Monti S, Tamayo P, Mesirov J, et al. Consensus clustering: a resampling-based method for class discovery and visualization of gene expression microarray data. Machine Learning 2003;52:91-118. 10.1023/A:1023949509487 [DOI] [Google Scholar]
- 24.Wilkerson MD, Hayes DN. ConsensusClusterPlus: a class discovery tool with confidence assessments and item tracking. Bioinformatics 2010;26:1572-3. 10.1093/bioinformatics/btq170 [DOI] [PMC free article] [PubMed] [Google Scholar]
- 25.Șenbabaoğlu Y, Michailidis G, Li JZ. Critical limitations of consensus clustering in class discovery. Sci Rep 2014;4:6207. 10.1038/srep06207 [DOI] [PMC free article] [PubMed] [Google Scholar]
- 26.Robinson MD, McCarthy DJ, Smyth GK. edgeR: a Bioconductor package for differential expression analysis of digital gene expression data. Bioinformatics 2010;26:139-40. 10.1093/bioinformatics/btp616 [DOI] [PMC free article] [PubMed] [Google Scholar]
- 27.Subramanian A, Tamayo P, Mootha VK, et al. Gene set enrichment analysis: a knowledge-based approach for interpreting genome-wide expression profiles. Proc Natl Acad Sci U S A 2005;102:15545-50. 10.1073/pnas.0506580102 [DOI] [PMC free article] [PubMed] [Google Scholar]
- 28.Langfelder P, Horvath S. WGCNA: an R package for weighted correlation network analysis. BMC Bioinformatics 2008;9:559. 10.1186/1471-2105-9-559 [DOI] [PMC free article] [PubMed] [Google Scholar]
- 29.Cotto KC, Wagner AH, Feng YY, et al. DGIdb 3.0: a redesign and expansion of the drug-gene interaction database. Nucleic Acids Res 2018;46:D1068-73. 10.1093/nar/gkx1143 [DOI] [PMC free article] [PubMed] [Google Scholar]
- 30.Andrade EL, Bento AF, Cavalli J, et al. Non-clinical studies in the process of new drug development - Part II: Good laboratory practice, metabolism, pharmacokinetics, safety and dose translation to clinical studies. Braz J Med Biol Res 2016;49:e5646. 10.1590/1414-431x20165646 [DOI] [PMC free article] [PubMed] [Google Scholar]
- 31.Lin H, Zelterman D. Modeling survival data: extending the Cox model. Technometrics 2002;44:85-6. 10.1198/tech.2002.s656 [DOI] [Google Scholar]
- 32.Rooney MS, Shukla SA, Wu CJ, et al. Molecular and genetic properties of tumors associated with local immune cytolytic activity. Cell 2015;160:48-61. 10.1016/j.cell.2014.12.033 [DOI] [PMC free article] [PubMed] [Google Scholar]
- 33.Hahn AW, Drake C, Denmeade SR, et al. A phase I study of alpha-1,3-galactosyltransferase-expressing allogeneic renal cell carcinoma immunotherapy in patients with refractory metastatic renal cell carcinoma. Oncologist 2020;25:121-e213. 10.1634/theoncologist.2019-0599 [DOI] [PMC free article] [PubMed] [Google Scholar]
- 34.Bai R, Chen N, Li L, et al. Mechanisms of cancer resistance to immunotherapy. Front Oncol 2020;10:1290. 10.3389/fonc.2020.01290 [DOI] [PMC free article] [PubMed] [Google Scholar]
- 35.Spencer KR, Wang J, Silk AW, et al. Biomarkers for immunotherapy: current developments and challenges. Am Soc Clin Oncol Educ Book 2016;35:e493-503. 10.1200/EDBK_160766 [DOI] [PubMed] [Google Scholar]
- 36.Chen Z, Liu G, Liu G, et al. Defining muscle-invasive bladder cancer immunotypes by introducing tumor mutation burden, CD8+ T cells, and molecular subtypes. Hereditas 2021;158:1. 10.1186/s41065-020-00165-7 [DOI] [PMC free article] [PubMed] [Google Scholar]
- 37.Kammerer-Jacquet SF, Deleuze A, Saout J, et al. Targeting the PD-1/PD-L1 Pathway in Renal Cell Carcinoma. Int J Mol Sci 2019;20:1692. 10.3390/ijms20071692 [DOI] [PMC free article] [PubMed] [Google Scholar]
- 38.Meléndez B, Van Campenhout C, Rorive S, et al. Methods of measurement for tumor mutational burden in tumor tissue. Transl Lung Cancer Res 2018;7:661-7. 10.21037/tlcr.2018.08.02 [DOI] [PMC free article] [PubMed] [Google Scholar]
- 39.Zhang C, Chen J, Song Q, et al. Comprehensive analysis of CTLA-4 in the tumor immune microenvironment of 33 cancer types. Int Immunopharmacol 2020;85:106633. 10.1016/j.intimp.2020.106633 [DOI] [PubMed] [Google Scholar]
- 40.Liu S, Wang F, Tan W, et al. CTLA4 has a profound impact on the landscape of tumor-infiltrating lymphocytes with a high prognosis value in clear cell renal cell carcinoma (ccRCC). Cancer Cell Int 2020;20:519. 10.1186/s12935-020-01603-2 [DOI] [PMC free article] [PubMed] [Google Scholar]
- 41.Angelin A, Gil-de-Gómez L, Dahiya S, et al. Foxp3 reprograms t cell metabolism to function in low-glucose, high-lactate environments. Cell Metab 2017;25:1282-1293.e7. 10.1016/j.cmet.2016.12.018 [DOI] [PMC free article] [PubMed] [Google Scholar]
- 42.Castro F, Cardoso AP, Gonçalves RM, et al. Interferon-gamma at the crossroads of tumor immune surveillance or evasion. Front Immunol 2018;9:847. 10.3389/fimmu.2018.00847 [DOI] [PMC free article] [PubMed] [Google Scholar]
- 43.Wang K, Wei G, Liu D. CD19: a biomarker for B cell development, lymphoma diagnosis and therapy. Exp Hematol Oncol 2012;1:36. 10.1186/2162-3619-1-36 [DOI] [PMC free article] [PubMed] [Google Scholar]
- 44.Zhong W, Chen B, Zhong H, et al. Identification of 12 immune-related lncRNAs and molecular subtypes for the clear cell renal cell carcinoma based on RNA sequencing data. Sci Rep 2020;10:14412. 10.1038/s41598-020-71150-3 [DOI] [PMC free article] [PubMed] [Google Scholar]
- 45.Sehgal SN. Sirolimus: its discovery, biological properties, and mechanism of action. Transplant Proc 2003;35:7S-14S. 10.1016/S0041-1345(03)00211-2 [DOI] [PubMed] [Google Scholar]
- 46.Bissler JJ, McCormack FX, Young LR, et al. Sirolimus for angiomyolipoma in tuberous sclerosis complex or lymphangioleiomyomatosis. N Engl J Med 2008;358:140-51. 10.1056/NEJMoa063564 [DOI] [PMC free article] [PubMed] [Google Scholar]
- 47.Campbell CE, Kuriyan NP, Rackley RR, et al. Constitutive expression of the Wilms tumor suppressor gene (WT1) in renal cell carcinoma. Int J Cancer 1998;78:182-8. [DOI] [PubMed] [Google Scholar]
- 48.Hastie ND. Wilms' tumour 1 (WT1) in development, homeostasis and disease. Development 2017;144:2862-72. 10.1242/dev.153163 [DOI] [PubMed] [Google Scholar]
Associated Data
This section collects any data citations, data availability statements, or supplementary materials included in this article.
Supplementary Materials
The article’s supplementary files as


