Abstract
Super-resolution activity imaging maps the biochemical architecture of living cells, yet currently overlooks the locations of collaborating regulators/effectors. Building on the fluorescence fluctuation increase by contact (FLINC) principle, here we devise Dronpa-chromophore-removed FLINC (DrFLINC), where the nonfluorescent Dronpa can nevertheless enhance TagRFP-T fluorescence fluctuations. Exploiting DrFLINC, we develop a superior red label and a next-generation activity sensor for context-rich super-resolution biosensing.
Graphical Abstract
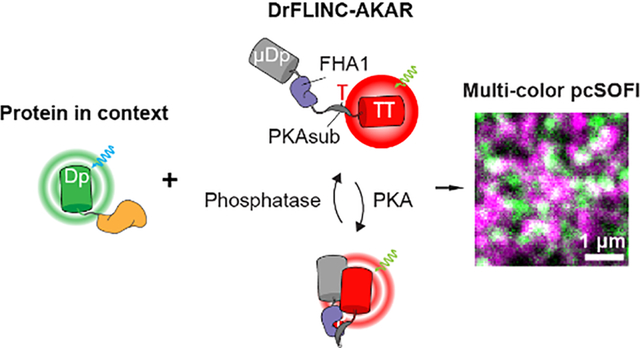
Super-resolution fluorescence imaging has become a powerful mode for investigating the cellular organization of molecular machineries1–2. We previously discovered a phenomenon called Fluorescence fLuctuation INcrease by Contact (FLINC)3, where the reversibly switchable fluorescent protein (RSFP) Dronpa4 can specifically and quantitatively enhance the fluorescence fluctuations of TagRFP-T5 when the two proteins are in molecular proximity. By coupling such a FLINC pair with kinase activity-dependent molecular switches from our FRET-based kinase activity reporters (KARs), we developed FLINC-based kinase activity reporters that achieved super-resolution activity imaging. As FLINC-AKAR revealed protein kinase A (PKA) activity microdomains on the plasma membrane and laid a foundation for mapping biochemical activity architecture in living cells6–7, the need quickly emerged to identify at a comparable resolution the regulatory or effector components that influenced or inherited the spatial organization of PKA signaling architecture.
Photochromic stochastic optical fluctuation imaging (pcSOFI)8 is an imaging modality that achieves sub-diffraction-limit resolution using correlated fluctuations3, 9. Its advantages include technical simplicity, compatibility with living cells, and a temporal resolution suited to signaling dissection. Theoretically, using pcSOFI in distinct colors to highlight both protein location and biochemistry with sub-diffraction resolution, we can reveal the context surrounding the activity of interest8. Yet despite recent development of new variants10–12, the number of spectrally distinct genetically encoded fluorescent labels exhibiting robust fluctuations remain limited. A suitable dual-color scheme that achieves synchronized live-cell imaging of both dynamic biochemical activities with associated regulators and effectors at super-resolution remains out of reach.
We reason that a new generation of FLINC probe can address both challenges. We previously showed that FLINC is mediated by external residues on Dronpa, not by internal residues or the Dronpa chromophore itself3. Thus, we surmised that FLINC can be maintained while removing Dronpa fluorescence (Figure 1A). We identified several residues important for Dronpa fluorescence13: Cys62-Tyr63-Gly64 (CYG) autocatalytically form the chromophore; His193 forms π-π stacking with the p-hydroxyphenyl ring of the ON-state; Ser142 is stabilized by a hydrogen bond to the hydroxyl group of the p-hydroxyphenyl ring in the ON-state. Thus, we hypothesized that introducing three types of mutations: a) CYG to GGG to abolish the chromophore, b) S142D for large steric/charge perturbation, or c) H193T to remove π-π stacking stabilization, will disable Dronpa fluorescence but not affect FLINC. To test this idea, we fused TagRFP-T with wildtype or mutant Dronpa through an 8-amino-acid linker, termed DpTT, DpH193TTT, DpGGGTT and DpS142DTT, and characterized the resulting plasma membrane-targeted14 tandem constructs using pcSOFI. Compared to DpTT, all three mutant pairs show robust, pcSOFI-compatible single-molecule fluctuations with 561-nm excitation, with minimal green fluorescence under 488-nm excitation (Figure 1B and Figure S1). We chose DpH193TTT, hereafter designated μDpTT, as the Dronpa-chromophore-removed FLINC (DrFLINC) pair for all subsequent experiments (Figure S1C). Single-pixel fluctuation profiling showed that both DpTT and μDpTT exhibit higher dynamic-range fluctuations than TagRFP-T alone (Figure 1C). Illumination at 561 nm generated red fluorescence fluctuations in a laser-power-dependent manner (Figure S2), and μDpTT outperformed TagRFP-T over a range of laser powers, especially in the low-intensity range. As shown in Figure 1D, quantification of fluctuations by normalized pcSOFI values indicated enhanced performance by DpTT and μDpTT compared with TagRFP-T (Figure 1D). These results indicate that the proximity of mutant Dronpa without a functional fluorophore still significantly increases the fluorescence fluctuations of TagRFP-T and permits high-contrast imaging using pcSOFI.
Figure 1.
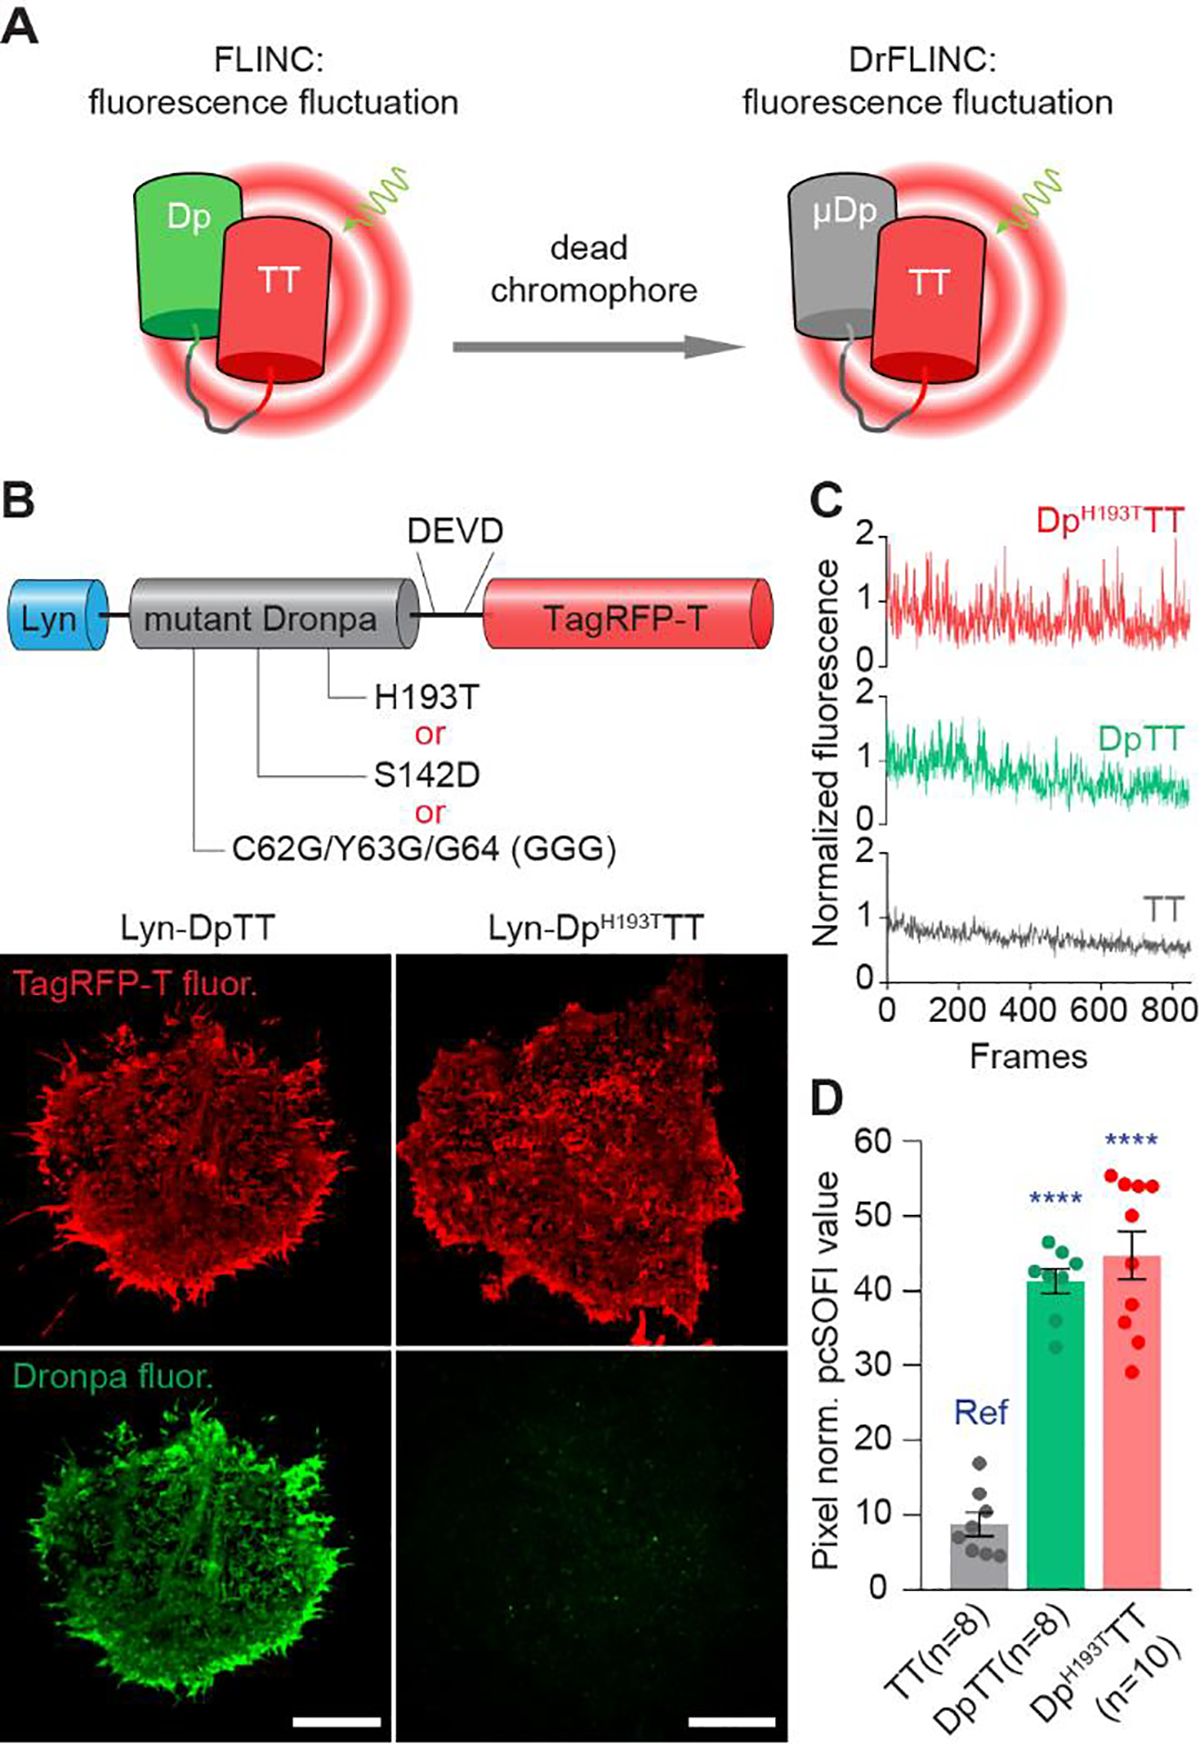
Development and characterization of Dronpa-chromophore-removed FLINC (DrFLINC). (A) Schematic of DrFLINC design. Despite mutations to internal residues to disable the fluorophore, non-fluorescent Dronpa still triggers fluorescence fluctuations in TagRFP-T. (B) The domain structure of plasma membrane-targeted DrFLINC and representative 2nd order pcSOFI images of Lyn-DpTT and Lyn-DpH193TTT, illuminated by 561-nm and 488-nm lasers. Scale bars are 10 μm. (C) Single-pixel fluctuations of TT only, as well as TT linked to wildtype Dronpa (DpTT) or to DronpaH193T (DpH193TTT) with 561 nm illumination. (D) Comparison of quantified fluctuations in TT only, DpTT and DpH193TTT suggests that dead-chromophore Dronpa can still induce FLINC behavior. The error bars represent mean ± s.e.m.
Since μDpTT can generate robust single molecule fluctuations in living cells, we next tested its utility as a reversibly photoswitchable red-fluorescent label for super-resolution imaging and co-imaging. We chose to focus on imaging PKA RIIα, a regulatory subunit of PKA that is expressed in most tissues and is anchored by various A-kinase anchor proteins (AKAPs) to different intracellular compartments15. Comparing μDpTT to Dronpa and rsTagRFP10, the most commonly used RSFPs in pcSOFI, we found that RIIα-Dronpa and RIIα-μDpTT generated sub-diffraction images that clearly illustrated the plasma membrane localization of RIIα, while RIIα-rsTagRFP yielded blurry, low-contrast images (Figure S3A/B), partly due to the low switching contrast and the poor photostability of rsTagRFP (Figure S3C). We next tested fusion of μDpTT for targeting to different subcellular compartments using TIRF, HILO16 or epifluorescence microscopy (Figure 2A and Figure S4). 2nd and 3rd order pcSOFI analyses showed that μDpTT could generate super-resolution images of filamentous actin, microtubules, nucleus, endoplasmic reticulum (ER), and mitochondria when fused to Lifeact, tau, Histone 2B (H2B), and CYP450- and DAKAP1-derived targeting motifs, respectively. We could also observe the plasma membrane localization of β−2 adrenergic receptor (B2AR) at super-resolution. Fourier ring correlation (FRC) estimation of the mean resolution revealed 127 nm, 124 nm and 132 nm for the 2nd order pcSOFI calculated by ImageJ or Localizer with or without deconvolution (Figure S5), which are consistent with previous report8. Furthermore, we examined the influence of target expression level on the performance of μDpTT and found that clear super-resolution images of microtubules were obtained across a wide range of tau-μDpTT expression (Figure S6); although we note that imaging targets at low endogenous expression levels could be challenging when the labeling density is too low. These results suggest that μDpTT is an advantageous red label in live-cell pcSOFI.
Figure 2.
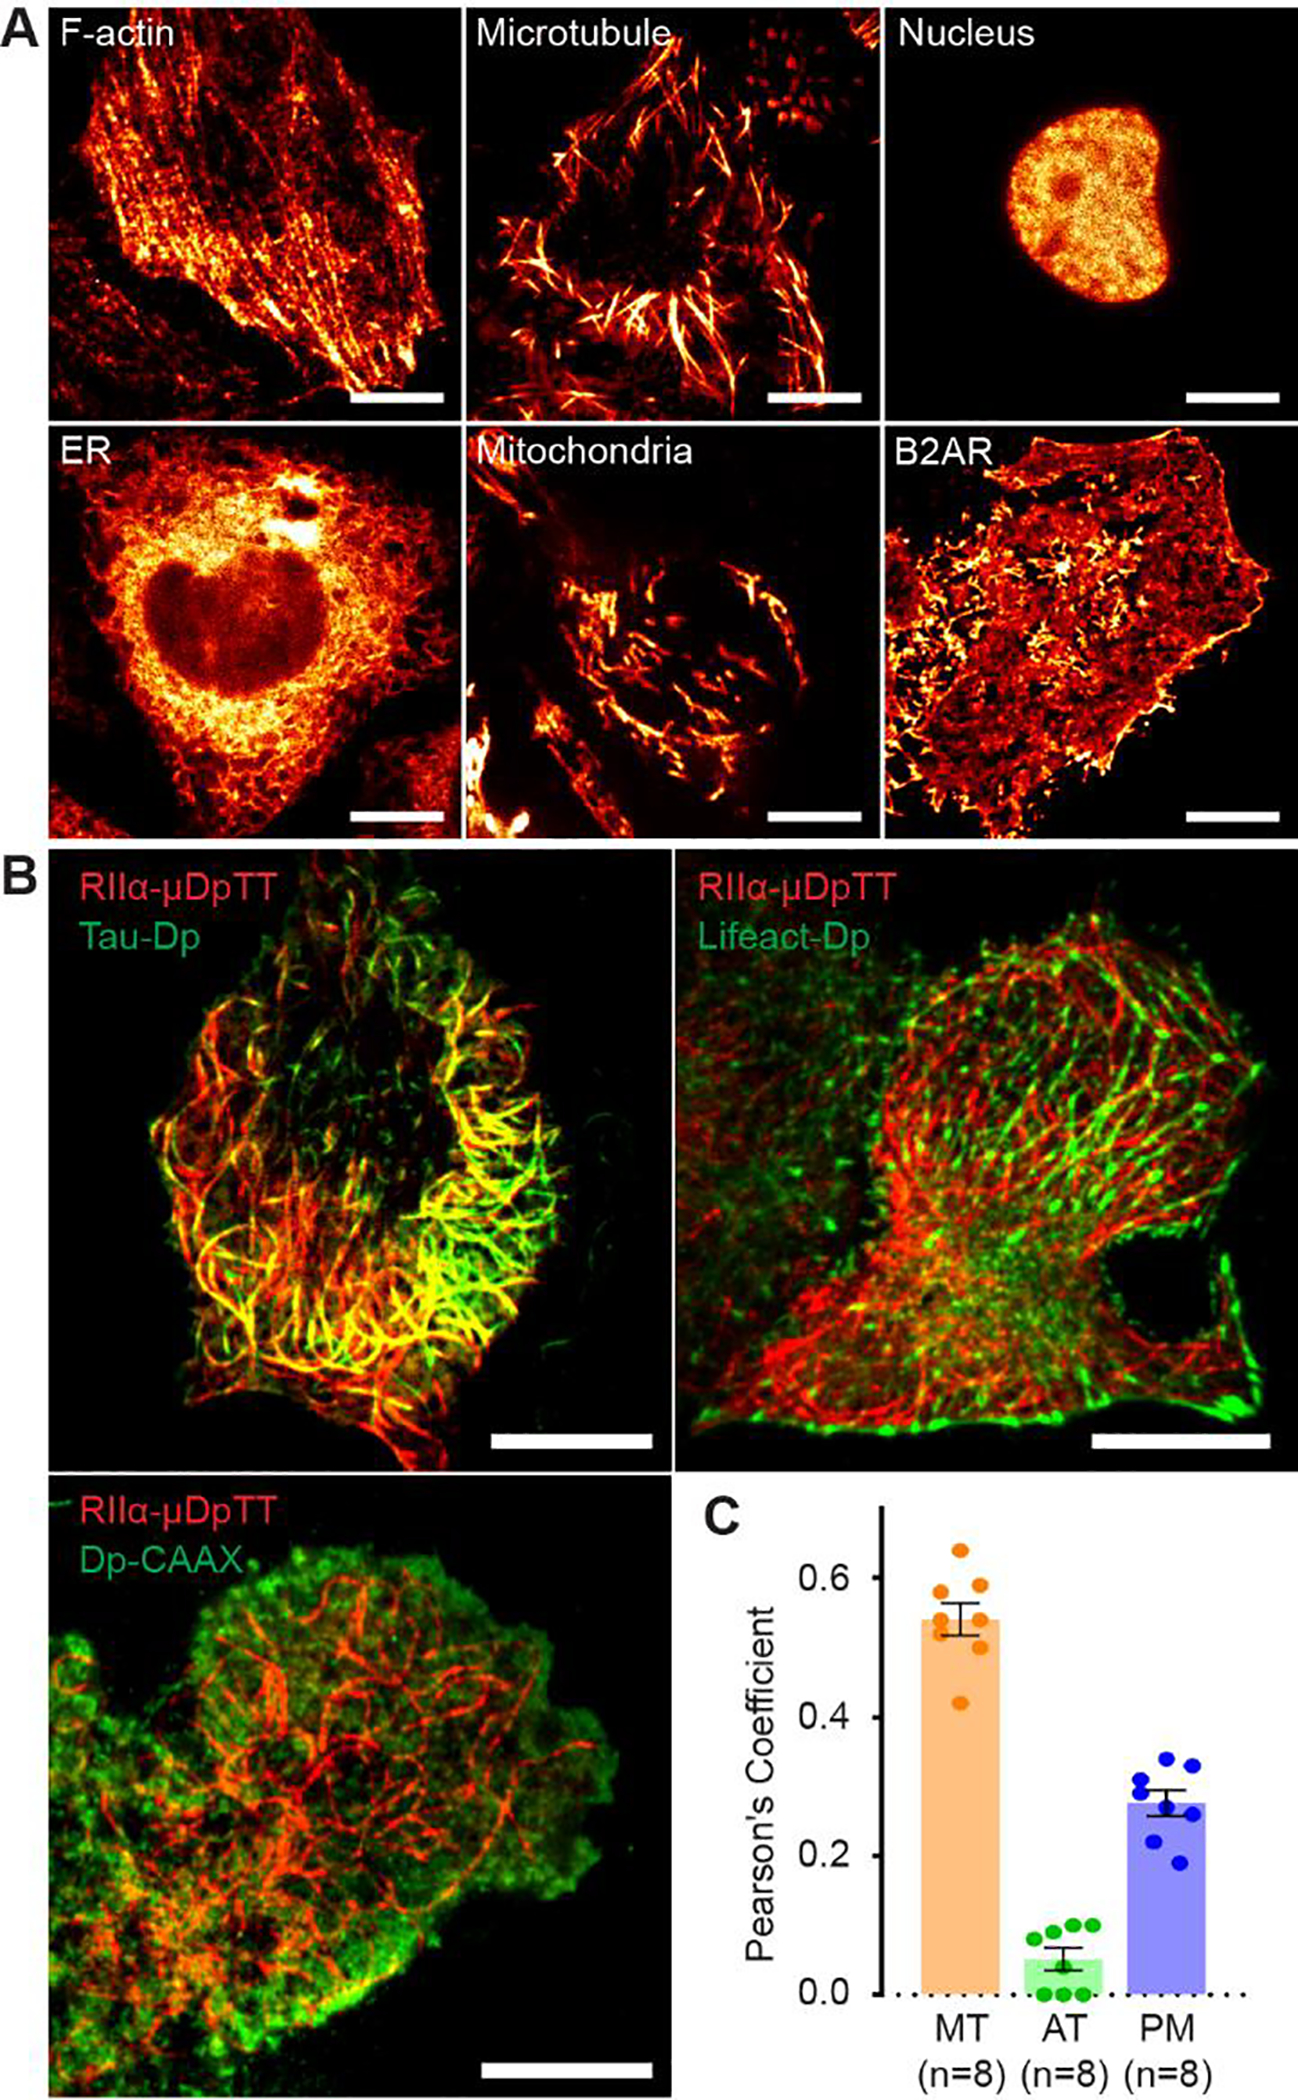
μDpTT is an enhanced, red-photoswitchable FP for multicolor pcSOFI. (A) 2nd order pcSOFI images of HeLa cells expressing μDpTT-labeled subcellular structures, F-actin (Lifeact), microtubules (tau), nucleus (H2B), ER (CYP450 N-terminal), and mitochondria (DAKAP1 N-terminal), as well as a target protein (B2AR). (B) RIIα-μDpTT was co-expressed with tau-Dp, Lifeact-Dp, or Dp-CAAX in MIN6 cells to perform dual-color sequential imaging. (C) Quantitative analysis using Pearson’s coefficient indicates that PKA RIIα mainly localizes on microtubules (MT), but not actin (AT), while a minor pool localizes to the plasma membrane (PM). The error bars represent mean ± s.e.m. Scale bars are all 10 μm.
The improved imaging of RIIα localization using μDpTT further revealed cytoskeleton-like structures in MIN6 β cells. To determine the nature of these structures and demonstrate the suitability of μDpTT in multi-color pcSOFI, we next co-imaged PKA RIIα-μDpTT with Dronpa-fused subcellular markers tau, Lifeact, CAAX for microtubules, actin, and plasma membrane, respectively. Dual-color imaging indicated that fibrous RIIα structures co-localized with microtubules, but not actin or plasma membrane (Figure 2B–C). Furthermore, Nocodazole treatment led to 54% dissociation of fibrous RIIα structures, concurrent with microtubule depolymerization (Figure S7), conforming that RIIα localizes on microtubules in MIN6 β cells.
We next examined whether the new DrFLINC pair in μDpTT, namely DronpaH193T and TagRFP-T, could also be used to develop a next-generation super-resolution kinase activity biosensor. Introducing the H193T mutation into Dronpa on FLINC-AKAR1, we constructed a new biosensor where the molecular switch consisting of a PKA-specific substrate and phospho-amino-acid binding FHA1 domain17 joined by an EV linker18 is sandwiched between DronpaH193T and TagRFP-T. Named DrFLINC-AKAR, this sensor reported PKA activity via an increase in red fluorescence fluctuations, which can be quantified by pcSOFI (Figure 3A). Plasma membrane-targeted DrFLINC-AKAR generated a super-resolution map of PKA activity (FRC estimation: 106 nm) with clearly visible high-activity microdomains, consistent with previous findings3. DrFLINC-AKAR showed similar responses to FLINC-AKAR1 under the current microscopy setting (Supplementary information), clearly outperforming a variant containing DpGGG (Figure S8). The average normalized pcSOFI value showed a 13% increase upon forskolin (Fsk) and 3-isobutyl-1-methylxanthine (IBMX) treatment to activate adenylyl cyclase and inhibit phosphodiesterases, respectively (Figure 3B/C). Addition of the selective PKA inhibitor H89 gradually decreased the normalized pcSOFI value, demonstrating the reversibility of DrFLINC-AKAR. The negative-control biosensor that cannot be phosphorylated (Figure 3B/C) demonstrated that the response was dependent on phosphorylation of the biosensor. Activation of PKA induced a two-fold increase in microdomain coverage over the basal membrane, and the PKA activity puncta were clearly resolved on the plasma membrane (Figure 3D), similar to what was observed with the original FLINC-AKAR13.
Figure 3.
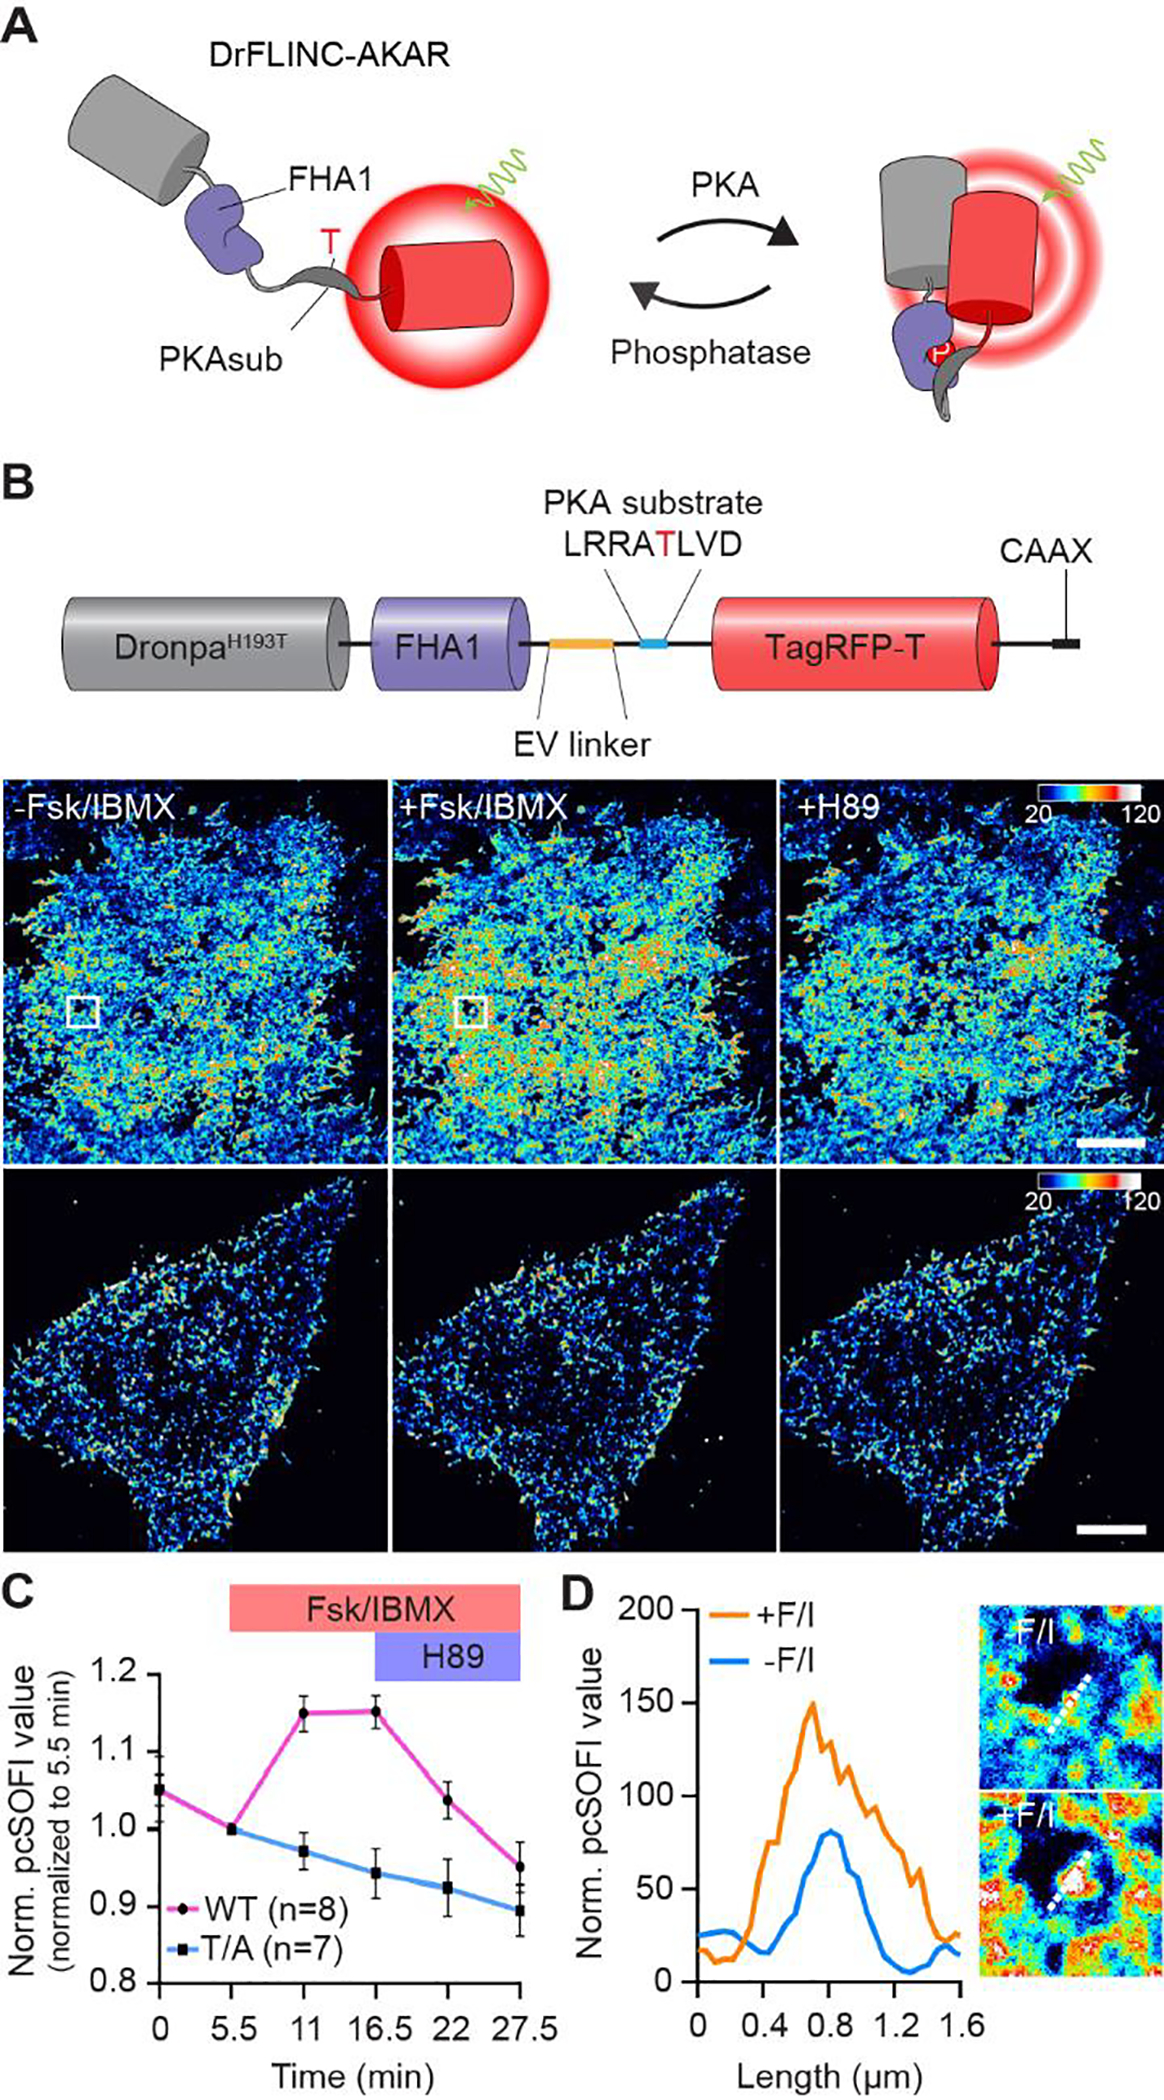
DrFLINC-AKAR enables pcSOFI imaging of PKA activity microdomains in living cells. (A) Schematic of DrFLINC-AKAR design. (B) The domain structure of plasma membrane-targeted DrFLINC-AKAR and super-resolution images of PKA activity (Upper: WT DrFLINC-AKAR; lower: nonphosphorylatable mutant (TA)). The images clearly resolve the response to Fsk/IBMX stimulation (50 μM Fsk and 100 μM IBMX) and H89 inhibition (20 μM). Color scales are identical. Scale bars are 10 μm. (C) Average traces showing the mean normalized pcSOFI response time course from live HeLa cells expressing WT or TA DrFLINC-AKAR, after PKA stimulation and inhibition. The error bars represent mean ± s.e.m. (D) A line profile, marked by white dash lines in zoomed-in views, demonstrates sensing of PKA activity at super-resolution.
Anchoring proteins like AKAPs can host kinases, phosphodiesterases, phosphatases, channels, and adenylyl cyclases within the signaling microdomain. Identifying the localization of both upstream and downstream signaling components at super-resolution and relating them to PKA activity is therefore important in understanding the effective functions of distinct PKA microdomains. Conveniently, the above Dronpa-removal allows co-imaging with another Dronpa fusion at super-resolution. Thus, we can now resolve the context of live-cell PKA activity at super-resolution via dual-color pcSOFI. We first examined the colocalization of stimulated PKA activity microdomains with plasma membrane AKAP79, which we previously showed via STORM imaging to be co-clustered3. We co-expressed plasma membrane-targeted DrFLINC-AKAR and AKAP79-Dronpa in HeLa cells and performed sequential pcSOFI under TIRF conditions. Nanoclusters of AKAP79 molecules were observed on the plasma membrane, a majority of which were colocalized with PKA activity microdomains (Figure 4A/D and Figure S9A), confirming the presence of AKAP-mediated PKA activity architecture in living cells. AKAP nano-clustering likely plays a critical role in organizing this activity architecture, not only by increasing the effective concentration of PKA regulatory subunits to enable micro-compartmentalized PKA activity3 but also by recruiting and concentrating adenylyl cyclases19.
Figure 4.
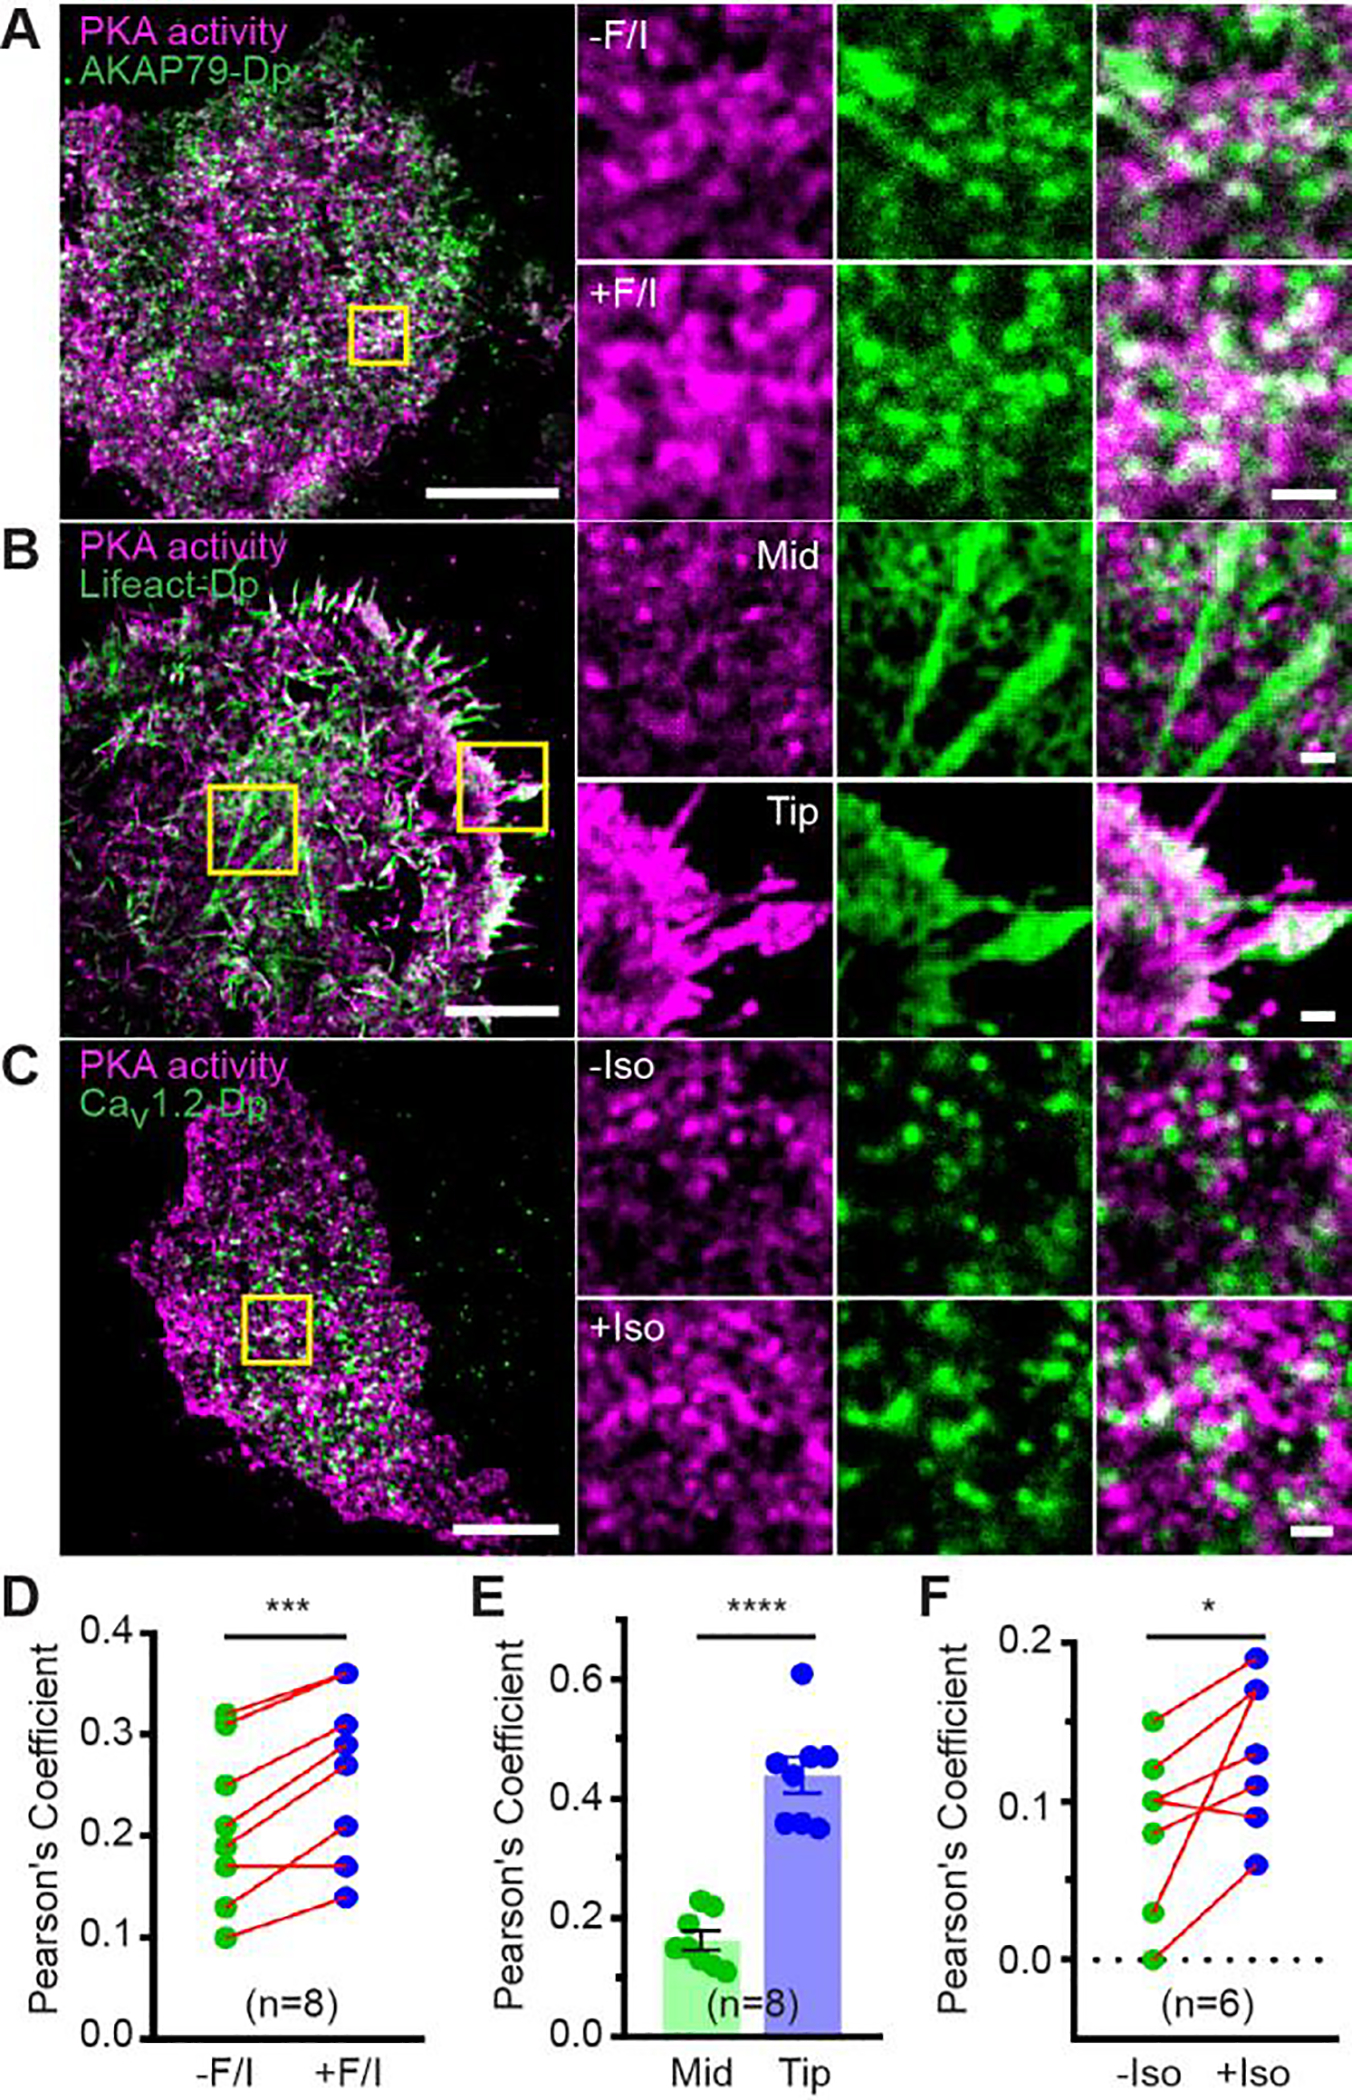
Dual-color pcSOFI imaging of stimulated PKA activity microdomains with regulatory components in living cells. (A-C) The colocalization of stimulated PKA activity microdomains with AKAP79 in HeLa cells (A), F-actin fibers in HeLa cells (B), and the Ca2+ channel protein Cav1.2 in HEK293T cells (C). Zoomed-in views of the boxed regions are shown, where white color indicates colocalization. Scale bars are 10 μm (Zoom in: 1 μm). (D-F) Quantitative analysis using Pearson’s coefficient indicates an increase in colocalization of PKA activities with AKAP79 (D) upon Fsk/IMBX (F/I) stimulation, a higher colocalization at edge protrusions (tip) versus more central (mid) areas (E), and an increase in colocalization of PKA activities with Cav1.2 upon β-adrenergic stimulation (Iso) (F). The error bars represent mean ± s.e.m.
Next, we examined the spatial interplay between stimulated PKA activity microdomains and potential effectors. AKAPs have been shown to link actin and PKA through β-catenin20. We performed two-color pcSOFI with DrFLINC-AKAR and Lifeact-Dronpa in HeLa cells and found that with the exception of filopodia, the majority of PKA activity microdomains did not colocalize with actin (Figure 4B/E). These data suggest that PKA activity microdomains are not generally organized along actin networks, but instead more specifically targeted to sub-regions that are involved in migration and mechano-sensing21–22.
PKA plays a critical role in the complex, tissue-specific regulation of the voltage-dependent L-type calcium channel Cav1.223, which is itself a PKA substrate. Previous experiments examined the colocalization of Cav1.2 and PKA24, but co-imaging of PKA activity microdomains and Cav1.2 was not possible in a live-cell context. Employing DrFLINC-AKAR and Cav1.2-Dronpa, we observed the formation of Cav1.2 nanoclusters on the plasma membrane of living cells, whereupon β-adrenergic stimulation increased the number of Cav1.2 nanoclusters that colocalized with PKA activity microdomains (Figure 4C/F and Figure S9B and S10). Consistent with previous findings24, we found that PKA activity microdomains colocalize with only a subset of Cav1.2 nanoclusters. Thus, micro-compartmentalization of PKA signaling is maintained and re-shaped from the signaling enzyme to specific downstream substrates. These data suggest that DrFLINC-AKAR can be applied in multiplexed imaging to investigate the context of PKA activity at the super-resolution level in living cells.
In this study, we introduced DrFLINC as both a red fluctuating fluorescent label and a super-resolution activity reporter unit amenable to dual-color imaging. Since μDpTT uses two fluorescent protein domains, we expect the typical caveats associated with using larger fusion tags such as tdTomato25. We envision that with the modular design of fluorescent biosensors26 and general applicability of pcSOFI27–28, DrFLINC-based biosensors and dual-color super-resolution imaging should help reveal the complex activity architectures of the cell6–7.
Supplementary Material
ACKNOWLEDGMENT
This project was supported by NIH R35 CA197622 and R01 DK073368 (to J.Z).
Footnotes
The authors declare no competing financial interests.
ASSOCIATED CONTENT
Supporting Information
The Supporting Information is available free of charge on the ACS Publications website.
Supporting figures and experimental procedures.
REFERENCES
- (1).Huang B; Bates M; Zhuang X, Super-resolution fluorescence microscopy. Annu. Rev. Biochem. 2009, 78, 993–1016. [DOI] [PMC free article] [PubMed] [Google Scholar]
- (2).Sigal YM; Zhou R; Zhuang X, Visualizing and discovering cellular structures with super-resolution microscopy. Science 2018, 361 (6405), 880–887. [DOI] [PMC free article] [PubMed] [Google Scholar]
- (3).Mo GC; Ross B; Hertel F; Manna P; Yang X; Greenwald E; Booth C; Plummer AM; Tenner B; Chen Z, et al. , Genetically encoded biosensors for visualizing live-cell biochemical activity at super-resolution. Nat. Methods 2017, 14 (4), 427–434. [DOI] [PMC free article] [PubMed] [Google Scholar]
- (4).Ando R; Mizuno H; Miyawaki A, Regulated fast nucleocytoplasmic shuttling observed by reversible protein highlighting. Science 2004, 306 (5700), 1370–1373. [DOI] [PubMed] [Google Scholar]
- (5).Shaner NC; Lin MZ; McKeown MR; Steinbach PA; Hazelwood KL; Davidson MW; Tsien RY, Improving the photostability of bright monomeric orange and red fluorescent proteins. Nat. Methods 2008, 5 (6), 545–551. [DOI] [PMC free article] [PubMed] [Google Scholar]
- (6).Mehta S; Zhang J, Illuminating the Cell’s Biochemical Activity Architecture. Biochemistry (Mosc.) 2017, 56 (39), 5210–5213. [DOI] [PMC free article] [PubMed] [Google Scholar]
- (7).Mehta S; Zhang J, Biochemical Activity Architectures Visualized-Using Genetically Encoded Fluorescent Biosensors to Map the Spatial Boundaries of Signaling Compartments. Acc. Chem. Res. 2021, 54 (10), 2409–2420. [DOI] [PMC free article] [PubMed] [Google Scholar]
- (8).Dedecker P; Mo GC; Dertinger T; Zhang J, Widely accessible method for superresolution fluorescence imaging of living systems. Proc. Natl. Acad. Sci. U. S. A. 2012, 109 (27), 10909–10914. [DOI] [PMC free article] [PubMed] [Google Scholar]
- (9).Hertel F; Mo GC; Duwe S; Dedecker P; Zhang J, RefSOFI for Mapping Nanoscale Organization of Protein-Protein Interactions in Living Cells. Cell Rep. 2016, 14 (2), 390–400. [DOI] [PMC free article] [PubMed] [Google Scholar]
- (10).Subach FV; Zhang L; Gadella TW; Gurskaya NG; Lukyanov KA; Verkhusha VV, Red fluorescent protein with reversibly photoswitchable absorbance for photochromic FRET. Chem. Biol. 2010, 17 (7), 745–755. [DOI] [PMC free article] [PubMed] [Google Scholar]
- (11).Lavoie-Cardinal F; Jensen NA; Westphal V; Stiel AC; Chmyrov A; Bierwagen J; Testa I; Jakobs S; Hell SW, Two-color RESOLFT nanoscopy with green and red fluorescent photochromic proteins. Chemphyschem 2014, 15 (4), 655–663. [DOI] [PubMed] [Google Scholar]
- (12).Pennacchietti F; Serebrovskaya EO; Faro AR; Shemyakina II; Bozhanova NG; Kotlobay AA; Gurskaya NG; Boden A; Dreier J; Chudakov DM, et al. , Fast reversibly photoswitching red fluorescent proteins for live-cell RESOLFT nanoscopy. Nat. Methods 2018, 15 (8), 601–604. [DOI] [PubMed] [Google Scholar]
- (13).Andresen M; Stiel AC; Trowitzsch S; Weber G; Eggeling C; Wahl MC; Hell SW; Jakobs S, Structural basis for reversible photoswitching in Dronpa. Proc. Natl. Acad. Sci. U. S. A. 2007, 104 (32), 13005–13009. [DOI] [PMC free article] [PubMed] [Google Scholar]
- (14).Zacharias DA; Violin JD; Newton AC; Tsien RY, Partitioning of lipid-modified monomeric GFPs into membrane microdomains of live cells. Science 2002, 296 (5569), 913–916. [DOI] [PubMed] [Google Scholar]
- (15).Logue JS; Scott JD, Organizing signal transduction through A-kinase anchoring proteins (AKAPs). FEBS J. 2010, 277 (21), 4370–4375. [DOI] [PMC free article] [PubMed] [Google Scholar]
- (16).Tokunaga M; Imamoto N; Sakata-Sogawa K, Highly inclined thin illumination enables clear single-molecule imaging in cells. Nat. Methods 2008, 5 (2), 159–161. [DOI] [PubMed] [Google Scholar]
- (17).Zhang J; Hupfeld CJ; Taylor SS; Olefsky JM; Tsien RY, Insulin disrupts beta-adrenergic signalling to protein kinase A in adipocytes. Nature 2005, 437 (7058), 569–573. [DOI] [PubMed] [Google Scholar]
- (18).Komatsu N; Aoki K; Yamada M; Yukinaga H; Fujita Y; Kamioka Y; Matsuda M, Development of an optimized backbone of FRET biosensors for kinases and GTPases. Mol. Biol. Cell 2011, 22 (23), 4647–4656. [DOI] [PMC free article] [PubMed] [Google Scholar]
- (19).Tenner B; Getz M; Ross B; Ohadi D; Bohrer CH; Greenwald E; Mehta S; Xiao J; Rangamani P; Zhang J, Spatially compartmentalized phase regulation of a Ca(2+)-cAMP-PKA oscillatory circuit. Elife 2020, 9. [DOI] [PMC free article] [PubMed] [Google Scholar]
- (20).Gorski JA; Gomez LL; Scott JD; Dell’Acqua ML, Association of an A-kinase-anchoring protein signaling scaffold with cadherin adhesion molecules in neurons and epithelial cells. Mol. Biol. Cell 2005, 16 (8), 3574–3590. [DOI] [PMC free article] [PubMed] [Google Scholar]
- (21).Howe AK, Regulation of actin-based cell migration by cAMP/PKA. Biochim. Biophys. Acta 2004, 1692 (2–3), 159–174. [DOI] [PubMed] [Google Scholar]
- (22).McKenzie AJ; Svec KV; Williams TF; Howe AK, Protein kinase A activity is regulated by actomyosin contractility during cell migration and is required for durotaxis. Mol. Biol. Cell 2020, 31 (1), 45–58. [DOI] [PMC free article] [PubMed] [Google Scholar]
- (23).Man KNM; Bartels P; Horne MC; Hell JW, Tissue-specific adrenergic regulation of the L-type Ca2+ channel CaV1.2. Sci. Signal 2020, 13 (663). [DOI] [PMC free article] [PubMed] [Google Scholar]
- (24).Nystoriak MA; Nieves-Cintron M; Patriarchi T; Buonarati OR; Prada MP; Morotti S; Grandi E; Fernandes JD; Forbush K; Hofmann F, et al. , Ser1928 phosphorylation by PKA stimulates the L-type Ca2+ channel CaV1.2 and vasoconstriction during acute hyperglycemia and diabetes. Sci. Signal 2017, 10 (463). [DOI] [PMC free article] [PubMed] [Google Scholar]
- (25).Shaner NC; Campbell RE; Steinbach PA; Giepmans BN; Palmer AE; Tsien RY, Improved monomeric red, orange and yellow fluorescent proteins derived from Discosoma sp. red fluorescent protein. Nat. Biotechnol. 2004, 22 (12), 1567–1572. [DOI] [PubMed] [Google Scholar]
- (26).Greenwald EC; Mehta S; Zhang J, Genetically Encoded Fluorescent Biosensors Illuminate the Spatiotemporal Regulation of Signaling Networks. Chem. Rev. 2018, 118 (24), 11707–11794. [DOI] [PMC free article] [PubMed] [Google Scholar]
- (27).Duwe S; De Zitter E; Gielen V; Moeyaert B; Vandenberg W; Grotjohann T; Clays K; Jakobs S; Van Meervelt L; Dedecker P, Expression-Enhanced Fluorescent Proteins Based on Enhanced Green Fluorescent Protein for Super-resolution Microscopy. ACS Nano 2015, 9 (10), 9528–9541. [DOI] [PubMed] [Google Scholar]
- (28).Zhang X; Chen X; Zeng Z; Zhang M; Sun Y; Xi P; Peng J; Xu P, Development of a reversibly switchable fluorescent protein for super-resolution optical fluctuation imaging (SOFI). ACS Nano 2015, 9 (3), 2659–2667. [DOI] [PubMed] [Google Scholar]
Associated Data
This section collects any data citations, data availability statements, or supplementary materials included in this article.


