Abstract
Background
Ferroptosis has been found to affect the prognosis and immunotherapy of hepatocellular carcinoma (HCC). However, the association between ferroptosis-related genes and infiltrating immune cells in tumor immune microenvironment (TIME) has not been fully elucidated. This study aimed at establishing a prediction model for the progression of HCC using ferroptosis-associated genes based on immune score.
Methods
Transcriptomic, mutation and clinicopathological information were downloaded from TCGA and International Cancer Genome Consortium (ICGC) for this study. Construction of the prediction model was done by Lasso regression analysis. Estimation of the clustering ability of the prediction model was done by t-distributed stochastic neighbor embedding (t-SNE) and principal component analysis (PCA) analyses. Assessment of the accuracy of the prediction model was done by receiver operating characteristic (ROC) and Kaplan-Meier curves.
Results
A prediction model was formulated utilizing three ferroptosis-related genes (G6PD, SAT1 and SLC1A5). The model independently predicted the overall survival (OS). Differentially expressed genes (DEGs) linked to based on Kyoto Encyclopedia of Genes and Genomes (KEGG) and gene ontology (GO) analyses immune-associated pathways and functions. Single-sample gene set enrichment analysis (ssGSEA) strategy further confirmed the model was related to immune-associated functions as well as immune cell infiltration.
Conclusions
The three ferroptosis-associated gene-based prediction model was good at predicting the OS outcomes of HCC, improve HCC prognostication and treatment in the clinic.
Keywords: Hepatocellular carcinoma (HCC), The Cancer Genome Atlas (TCGA), ferroptosis, signature, prognosis
Introduction
Globally, the prevalence of hepatocellular carcinoma (HCC), a malignant tumor, is high and is associated with poor prognostic outcomes and high mortality globally (1). Worldwide, HCC ranks sixth highest in terms of morbidity and fourth highest in terms of mortality (2). Generally, HCC is linked to almost 90% of primary liver cancers (3). Risk factors for HCC include infection by hepatitis B virus, cirrhosis, as well as alcohol abuse (4). Due to the insidious symptoms at an early stage of HCC and the rapid deterioration of HCC, most patients are diagnosed when they are in the fatal stages of the disease, at which point they are not suitable for surgical treatment (5). It is even scaring regarding that some studies have reported that about 70% of cases treated surgically develop tumor recurrence within 5 years. Although multiple therapeutic approaches for HCC like hepatectomy, liver transplantation, transcatheter arterial chemoembolization and molecular-targeted therapy with sorafenib have progressed in recent years, HCC prognosis has not improved markedly (6). The carcinogenesis of HCC is a multi-step complex process involving the aberrant accumulation of genetic and epigenetic factors (7). In recent years, specific biomarkers have been hypothesized as promising therapeutic alternative in early screening, diagnosis, and prognosis of HCC. One such biomarker is ferroptosis-related genes. However, the impact of these ferroptosis-associated genes on the clinical progression of HCC has not been well unraveled. Therefore, investigating the underlying molecular mechanisms for HCC occurrence as well as progression is necessary to improve prognosis through early diagnosis and treatment.
Ferroptosis is characterized by iron-dependent peroxidation of lipids that is distinct from apoptosis, autophagy, and necrosis (8-10). Since the concept of ferroptosis was first proposed in 2012, accumulating evidence show that, ferroptosis participate in pathological process of various diseases, including cancers (8). Currently, increasing studies have linked ferroptosis to the prognosis of HCC. Yuan et al. demonstrated that collectrin (CLTRN) enhances radiation sensitivity of HCC cells through increasing ferroptosis (11). Additionally, Wang et al. reported that RNA binding protein DAZAP1 could inhibit ferroptosis via positively regulating the stability of SLC7A11 mRNA (12). On the other hand, overexpression of DAZAP1 could reduce HCC cells sensitivity to sorafenib (12). Interestingly, as immunotherapies gain increasing attention, ferroptosis is expected to provide novel ideas and targets for improving efficacy of cancer immunotherapy. Lang et al. reported that radio- as well as immune-therapy could enhance tumor ferroptosis through synergistically regressing SLC7A11 to improve tumor control rates (13). Immunotherapy based CD8+ T cells activation in the tumor immune microenvironment (TIME) enhances tumor lipid peroxidation and ferroptosis through releasing interferon γ (IFN-γ). Tumor cell death induced by ferroptosis further releases tumor-associated antigens which promotes the effect of immunotherapy (14,15). Additionally, other immune cells in TIME may get involved in the maintenance of iron homeostasis, such as monocytes, macrophages, and natural killer T (NKT) cells (16). Therefore, a better understanding of the relationship between ferroptosis and infiltration levels of immune cells in TIME is beneficial to improve prognosis and guide treatment of patients with HCC.
We screened differentially expressed genes (DEGs) based on infiltration levels of immune cells in TIME and further obtained ferroptosis-related genes in The Cancer Genome Atlas (TCGA) cohort. Identification of ferroptosis-associated genes with independent prognostic values of overall survival (OS) outcomes in HCC patients was done by univariate Cox regression analysis. Overlapping ferroptosis-related genes with DEGs was conducted through the Lasso regression analysis for constructing a predictive model. The model predictive capacity was verified with data from ICGC database. Finally, the clinical significance of ferroptosis-associated genes used for prediction model construction in distinguishing clinicopathologic features and guiding immunotherapy were further investigated.
We present the following article in accordance with the STROBE reporting checklist (available at https://dx.doi.org/10.21037/jgo-21-237).
Methods
Data processing
Transcriptome, mutation as well as their matching clinicopathologic data for 377 HCC patients were retrieved from the TCGA database (https://portal.gdc.cancer.gov/) (training cohort). Similarly, the transcriptome and their corresponding clinicopathologic information of 231 HCC specimens (validation cohort) were obtained from the ICGC database (https://dcc.icgc.org/releases). Immune scores for 373 HCC samples were obtained from the Estimation of Stromal and Immune cells in Malignant Tumor tissues using Expression data (ESTIMATE) website (https://bioinformatics.mdanderson.org/estimate/) that quantifies the immune cell infiltration level of every HCC specimen in the TIME (17). A total of 60 ferroptosis-associated genes were collected from previously published studies. The study was conducted in accordance with the Declaration of Helsinki (as revised in 2013).
Prognostic ferroptosis-associated gene identification in the TCGA cohort
HCC samples were assigned into low- and high-immune score groups in reference to immune score median value. “Limma” package in R was used for screening differentially expressed ferroptosis-related genes in high- as well as low-immune score groups. The parameters of |log2FC| >0 and FDR <0.05 were used as the screening criteria (FDR, false discovery rate; FC, fold change). Univariate Cox regression was applied to determine ferroptosis-associated genes that could predict OS. Intersection of these ferroptosis-associated genes was done using the “Venn” package in R.
Estimation and validation of predictive ability of the prediction model
Overlapping ferroptosis-related genes were used to conduct Lasso regression analysis using the R package “glmnet” for a prediction model construction. Lasso is a penalized regression method that selected variables and calculated the coefficients of selected variables. Calculation of the risk score for each sample was done using:
| [1] |
Whereby β represents the regression coefficient while Exp represents levels of gene expression. Sample allocation into high- and low-risk group in the TCGA cohort was based on the median risk score. Kaplan-Meier survival and receiver operating characteristic curves (ROC) were established, using the “survival” and “survival ROC” packages, respectively, to assess the model’s predictive abilities. Using the “prcomp” and “Rtsne” packages, t-distributed stochastic neighbor embedding (t-SNE) and principal component analysis (PCA) analyses were employed respectively for assessing the ability of the prediction model to cluster. Meanwhile, as shown in risk score calculation formula, the prediction performance of the model was determined using samples from the ICGC database.
Estimation of independent prognostic value of the ferroptosis-associated risk score signature
Compared to conventional clinicopathologic characteristics, the risk signature’s independent prognostic value was estimated using univariate as well as multivariate Cox regression analyses.
Functional enrichment analysis
Using the “clusterProfiler” R package, the DEGs were subjected to GO and KEGG enrichment analyses. DEGs screening was done using |log2FC| ≥1 and FDR <0.05. GO term enrichment analysis included cellular components (CC), biological processes (BP), and molecular functions (MF).
Single-sample gene set enrichment analysis (ssGSEA)
The proportions of sixteen infiltrating immune cell types and activities of thirteen immune-associated functions or pathways were quantified using “gsva” in R package based on the ssGSEA strategy.
Investigating the clinical significance of ferroptosis-associated genes in distinguishing clinicopathologic features and guiding immunotherapy in the TCGA cohort
To present the relationship between the expression levels of ferroptosis-associated genes, different clinicopathologic features as well as survival prognosis, Sankey diagram was plotted using R package “ggalluvial”. Furthermore, the association between expressed distribution of ferroptosis-associated genes and different clinicopathologic features in HCC tissues and normal tissues were analyzed.
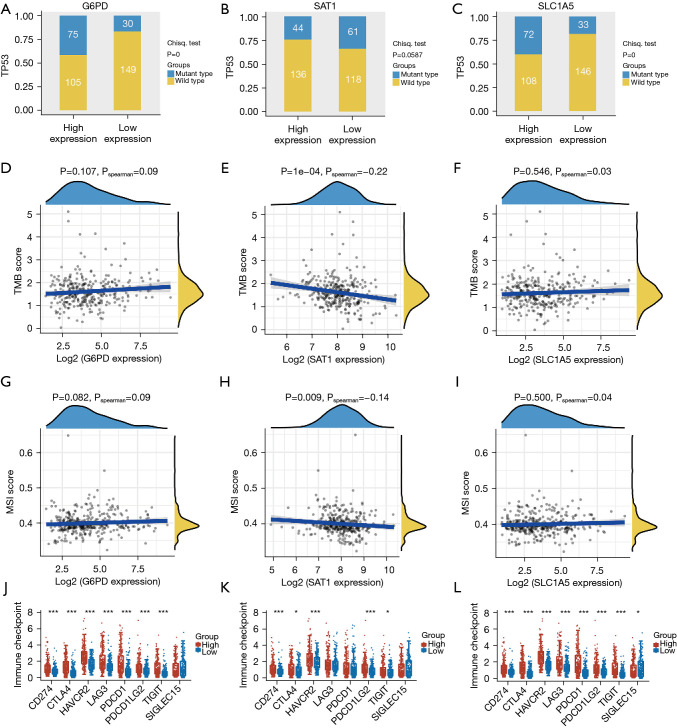
Additionally, to estimate the significance of ferroptosis-related genes in guiding immunotherapy, correlation analysis for ferroptosis-associated gene expressions and TP53 mutation, tumor mutation burden (TMB), microsatellite instability (MSI) and immune checkpoints related molecules were performed using R packages “ggstatsplot” and “ggplot2”.
Statistical analysis
The R software (version 4.0.2) was used for the analyses. Comparisons of two groups to determine significance was done by the Wilcox test, and the significance among more than three groups was identified using the Kruskal-Wallis test. Immune cell ssGSEA scores or functions low- and high-risk groups were quantified using Mann-Whitney test. Differences in survival times between low- and high-risk groups were assessed by Kaplan-Meier curves and log-rank tests. Evaluation of the models’ predictive accuracy was done using ROC curves and the corresponding area under ROC curve (AUC) values. Independent OS outcome predictors for HCC patients were identified by univariate as well as multivariate Cox regression analyses. Spearman’s correlation analysis was employed for description of correlations between quantitative variables that were not normally distributed. Two tailed P≤0.05 was the threshold for significance.
Results
Identifying prognostic ferroptosis-associated DEGs in TCGA cohort
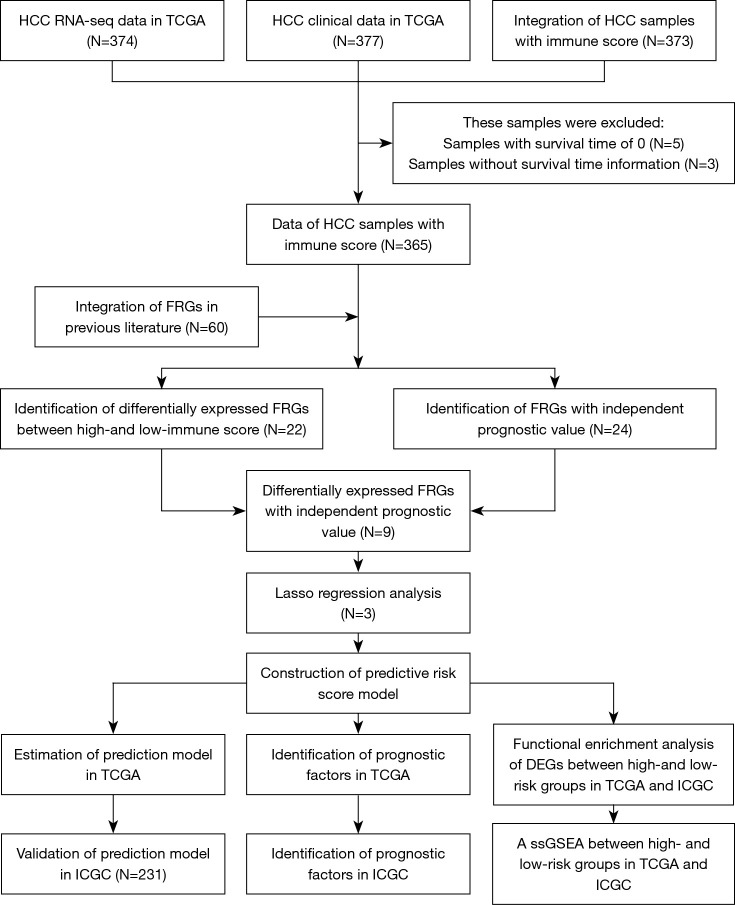
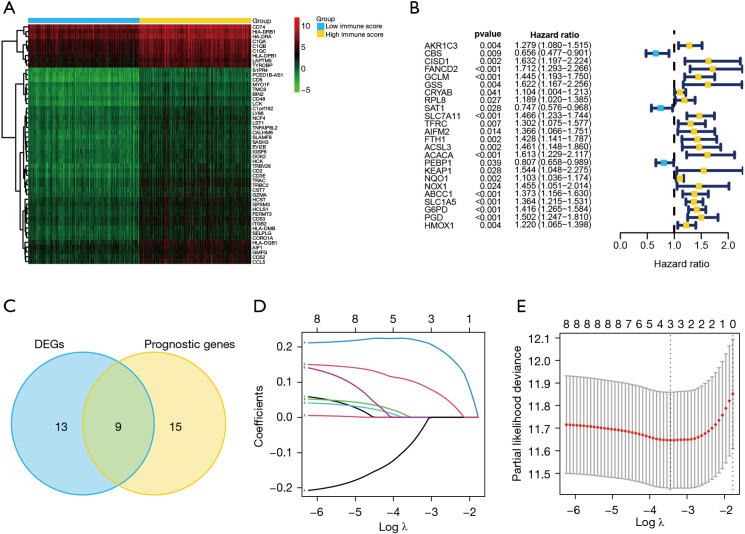
Figure 1 illustrates data analysis procedures. In this study, 6,546 DEGs (3,566 downregulated and 2,980 upregulated) between low- and high-immune score groups were screened. Top 50 genes are shown in Figure 2A. Subsequently, 22 ferroptosis-related DEGs were obtained, including ABCC1, ACSF2, ACSL4, ALOX5, CD44, CRYAB, DPP4, FTH1, G6PD, GCLC, HMGCR, HMOX1, HSBP1, NCOA4, NFS1, PEBP1, PGD, PHKG2, SAT1, SLC1A5, SQLE, and TP53. Based on the samples containing immune score and survival time, univariate Cox regression analysis indicated that 24 ferroptosis-associated genes had a significant correlation with OS (P<0.05), of which nine were DEGs (Figure 2B,2C).
Figure 1.
The study work flow diagram. TCGA, The Cancer Genome Atlas; HCC, hepatocellular carcinoma; ICGC, International Cancer Genome Consortium.
Figure 2.
Establishment of the prediction model using ferroptosis-related genes. (A) Heatmap of DEGs in low- and high-immune scores samples. (B) Forest plots of ferroptosis-associated genes that had significant independent prognostic values for OS in patients with HCC. (C) Venn plot of differentially expressed ferroptosis-associated genes and the independent prognostic values. (D) Determination of the Lasso model coefficient. Each curve represents a variable. The ordinate represents the regression coefficients of the variables used to construct the prediction model. (E) Selection of the number of factors by Lasso Cox regression analysis. The X axis represents the log value of the penalty parameter, lambda. The Y axis represents the partial likelihood deviance error. Partial likelihood deviance was plotted versus log (lambda). The lowest partial likelihood deviance had a correspondence to the optimal number of variables. The two dotted lines correspond to lambda.min on the left and lambda.1se on the right, respectively. The results of the analysis show that three variables are finally used in prediction model establishment. DEGs, differentially expressed genes; HCC, hepatocellular carcinoma.
Establishment of a prediction model for the TCGA cohort
To minimize over-fitting risk, the nine ferroptosis-related genes were subjected to Lasso regression analysis to develop prediction model, of which three genes were chosen to build the model (Figure 2D,2E). Sample risk scores were calculated as:
| [2] |
Evaluating predictive ability of prediction model in the TCGA cohort
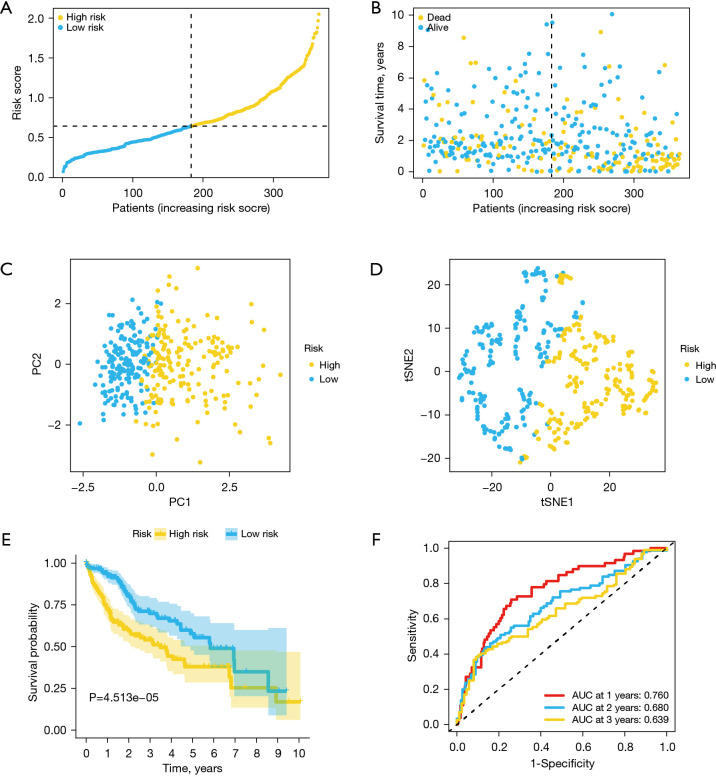
Based on median risk score, TCGA cohort samples were first assigned into low-risk (N=183) and high-risk (N=182) groups for evaluating the models’ predictive abilities (Figure 3A). The risk plot revealed that patients with high-risk scores had shorter survival outcomes than low-risk score patients (Figure 3B). In addition, t-SNE and PCA analyses indicated that the groups had dissimilar layout modes (Figure 3C,3D). Kaplan-Meier analysis associated the high-risk group with poor OS than the low-risk group (P=4.513e−05) (Figure 3E). The AUC values determined by ROC curve analysis were 0.760, 0.680 and 0.639 for 1-, 2-, and 3-year OS (Figure 3F).
Figure 3.
Estimation of ferroptosis-related risk signature for the TCGA cohort. (A) Risk score distribution. (B) Survival status distribution. (C) PCA analysis of the risk scores. (D) t-SNE analysis of risk scores. (E) Kaplan-Meier curves for OS of patients in low- and high-risk groups. (F) ROC curves and area under ROC curves estimating the risk signature’s predictive accuracy. TCGA, The Cancer Genome Atlas; t-SNE, t-distributed stochastic neighbor embedding; PCA, principal component analysis; ROC, receiver operating characteristic.
Validating predictive ability of the model using the ICGC cohort
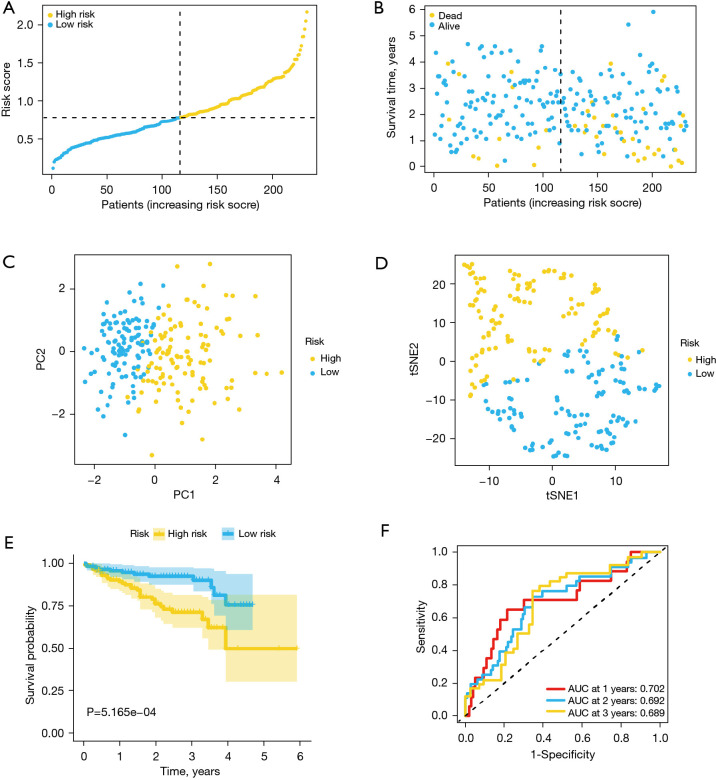
According to the formula generated by TCGA cohort, ICGC cohort samples were assigned into low-risk (N=116) and high-risk (N=115) groups (Figure 4A). Similar to the results of TCGA cohort, the risk plot revealed that high-risk score patients had short survival times than low-risk score patients (Figure 4B). Dimensionality reduction analysis with both t-SNE and PCA indicated that patients in the various risk groups were distributed in 2 directions (Figure 4C,4D). Likewise, Kaplan-Meier revealed that patients with high-risk scores exhibited poor prognostic outcomes than those with low-risk score (P=5.165e−04) (Figure 4E). Besides, ROC curve analysis indicated that respective AUC values at 1, 2 and 3 years were 0.702, 0.692 and 0.689 (Figure 4F).
Figure 4.
Validation of the ferroptosis-associated risk signature using the ICGC cohort. (A) Risk score distribution. (B) The survival status distribution. (C) PCA analysis of the risk scores. (D) t-SNE analysis of the risk scores. (E) Kaplan-Meier curves for OS outcomes of low- and high-risk patients. (F) ROC curves and area under ROC curves estimating the risk signature’s predictive accuracy. ICGC, International Cancer Genome Consortium; PCA, principal component analysis; t-SNE, t-distributed stochastic neighbor embedding; OS, overall survival; ROC, receiver operating characteristic.
Assessing the independent prognostic significance of ferroptosis-associated risk signature scores in ICGC and TCGA cohorts
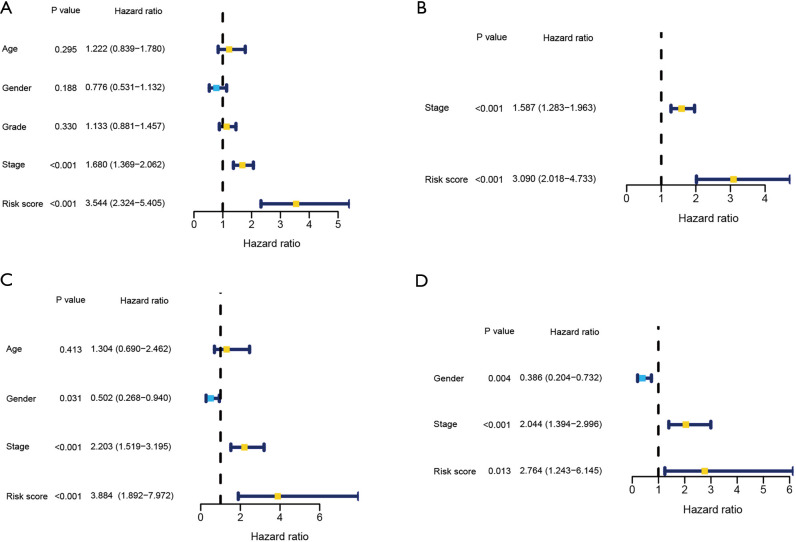
Compared to conventional clinicopathologic characteristics (age, grade, gender, and stage), univariate as well as multivariate Cox regression analyses were used to assess the independent OS prognostic significance of the ferroptosis-related risk signature. In the TCGA cohort, risk score and stage were found to be independent predictors of OS (Figure 5A,5B). Similarly, results of the ICGC cohort demonstrated that risk score and stage were independent predictors of OS (Figure 5C,5D).
Figure 5.
Determination of the independent prognosis prediction performance of the model. (A,C) Results from univariate Cox regression analysis of OS for TCGA (A) and ICGC (C) cohorts. (B,D) Results of multivariate Cox regression analysis of OS for TCGA (B) and ICGC (D) cohorts.
Investigating functional enrichment of DEGs between the low- and high-risk groups in the ICGC and TCGA cohorts
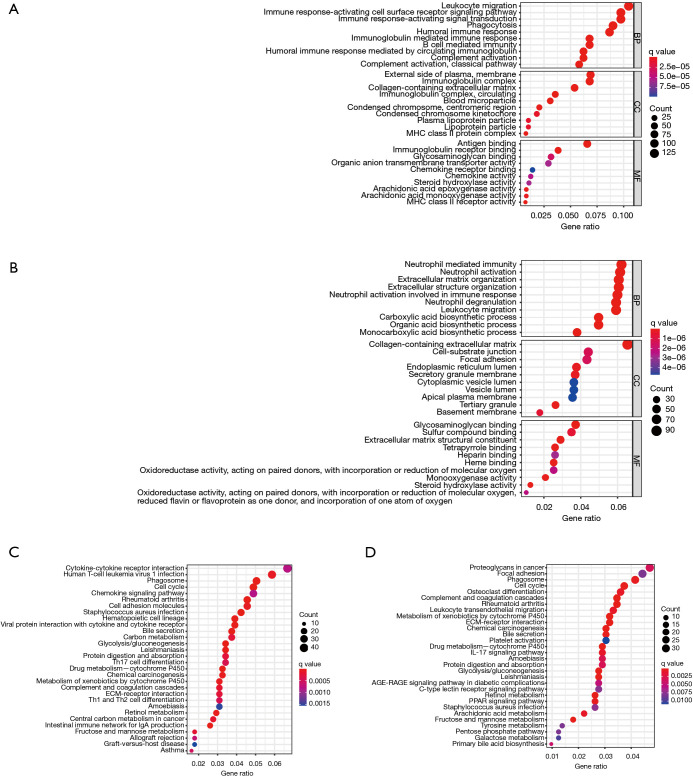
GO analysis revealed that DEGs were enhanced in several immune-related BP, including leukocyte migration, neutrophil activation, phagocytosis, chemokine activity and immunoglobulin mediated immune response (Figure 6A,6B). Similarly, the results of KEGG analysis revealed that these DEGs were correlated with immune-associated pathways, including cytokine-cytokine receptor interaction, IL-17 and chemokine signaling pathways, Th1, Th17 as well as Th2 cell differentiation and leukocyte trans-endothelial migration (Figure 6C,6D). In addition, DEGs were found to be enriched in cell cycle, glycolysis/gluconeogenesis, and cytochrome P450 pathways. These results suggest that there was a close association between ferroptosis-related genes and immune cells infiltration or function in TIME.
Figure 6.
Pathway and functional enrichment results. GO enrichment findings for the TCGA (A) and ICGC (B) cohorts. KEGG pathway analysis results for the TCGA (C) and ICGC (D) cohorts. GO, gene ontology; TCGA, The Cancer Genome Atlas; ICGC, International Cancer Genome Consortium; KEGG, Kyoto Encyclopedia of Genes and Genomes.
Immune status differences in low- and high-risk groups in the ICGC and TCGA cohorts
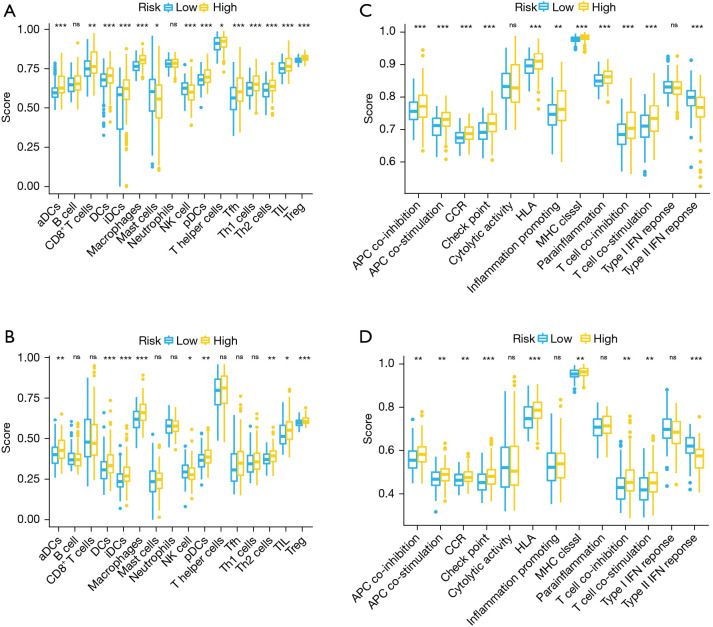
The enrichment score of immune cell subtypes and immune-associated pathways or functions were assessed using the ssGSEA strategy which explored correlations between immune status and the risk signature. Regarding infiltration of immune cells, the scores of dendritic cells (DCs), macrophages, activated dendritic cells (aDCs), inhibited dendritic cells (iDCs), plasmacytoid dendritic cells (pDCs), regulatory T cells (Treg), T helper 2 cells (Th2Cs), and tumor infiltrating lymphocytes (TIL) were higher in the high- than the low-risk group (Figure 7A,7B). On the other hand, compared to low-risk group, natural killer cells (NKCs) were low in the high-risk group (Figure 7A,7B). Regarding immune-associated functions or pathways, scores for antigen-presenting cell (APC) co-inhibition, human leukocyte antigen (HLA), check point, APC co-stimulation, T cell co-inhibition, chemokine-chemokine receptor (CCR), major histocompatibility complex (MHC) class I, and T cell co-stimulation in the high-risk group were higher than in the low-risk group (Figure 7C,7D). Besides, compared to low-risk group, type II IFN response was lower in the high-risk group (Figure 7C,7D). ssGSEA analysis further confirmed that there was a close association between ferroptosis-related genes as well as immune cell infiltration and function in TIME.
Figure 7.
Comparison of the enrichment scores for immune cells infiltration and immune-associated functions or pathways between low- and high-risk groups according to the ssGSEA strategy. (A,B) The enrichment scores of 16 immune cells infiltration in the TCGA (A) and ICGC (B) cohorts. (C,D) The enrichment scores of 13 immune-associated functions or pathways in the TCGA (C) and ICGC (D) cohorts. CCR-cytokine-cytokine receptor. *, P<0.05; **, P<0.01; ***, P<0.001. aDCs, activated dendritic cells; APC, antigen-presenting cell; CCR, chemokine-chemokine receptor; DCs, dendritic cells; HLA, human leukocyte antigen; ICGC, International Cancer Genome Consortium; iDCs, inhibited dendritic cells; IFN, interferon; MHC, major histocompatibility complex; pDCs, plasmacytoid dendritic cells; ssGSEA, single-sample gene set enrichment analysis; TCGA, The Cancer Genome Atlas; TIL, tumor infiltrating lymphocytes; Treg, regulatory T cells
Investigating the clinical significance of ferroptosis-associated genes in distinguishing clinicopathologic characteristics and guiding immunotherapy in the TCGA cohort
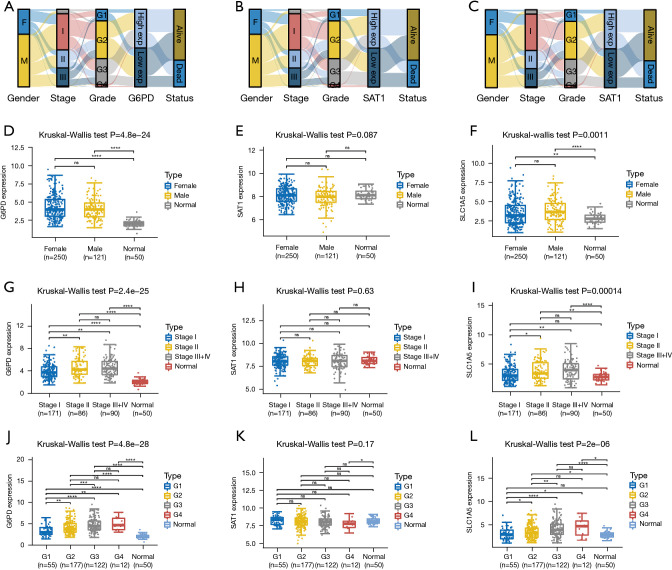
Distribution of expressions of 3 genes, clinicopathologic characteristics and survival prognosis are shown in Figure 8A-8C. There was no significant correlation between expressions of the three genes and gender (Figure 8D-8F). However, relative to normal tissues, the expression levels of G6PD and SLC1A5 were significantly elevated in tumor tissues. Besides, there was a significantly positive association between expression levels of G6PD, SLC1A5 and pathological stage and grade (Figure 8G-8L).
Figure 8.
The correlation between the expression levels of ferroptosis-related genes and the clinicopathological characteristics as well as survival status. (A-C) Represent the Sankey diagram showing the expressions of three ferroptosis-associated genes, different clinicopathological characteristics and survival status. Each column denotes a characteristic variable, dissimilar colors denote different groups, while lines denote the sample distribution in different characteristic variables. (D-L) Represent the expression distribution of three ferroptosis-associated genes in tumor samples and normal samples for different clinicopathological characteristics. The horizontal axis denotes dissimilar sample groups; the vertical axis denotes gene expression distribution while colors represent dissimilar groups. *, P<0.05; **, P<0.01; ***, P<0.001; ****, P<0.0001.
The association between expressions of G6PD, SLC1A5 and TP53 mutation were significant (Figure 9A-9C). Moreover, there was a positive correlation between G6PD and SLC1A5 expressions and TMB/MSI, while the expression level of SAT1 was negatively associated with TMB/MSI (Figure 9D-9I). Besides, there was a significant association between G6PD and SLC1A5 expressions with immune checkpoints related molecules like CD274, CTLA4, and PDCD1 (Figure 9J-9L). These results suggest that G6PD, SLC1A5 and SAT1 could be used as new biomarkers for estimating survival prognosis and guiding immunotherapy.
Figure 9.
The correlation between expressions of ferroptosis-associated genes and TP53 mutation, TMB, MSI and immune checkpoints molecules. (A-C) The distribution of TP53 mutation in high- and low-expression groups. The horizontal axis represents the samples of different groups; the vertical axis represents the distribution of the TP53 mutation and different colors represent different mutation types. (D-I) Correlation analysis of three ferroptosis-related genes expression and TMB/MSI. Horizontal axis denotes expression distributions of the gene while the ordinate denotes expression distributions of TMB/MSI scores. Density curve on the right denotes distribution trend of TMB/MSI score; upper density curve denotes distribution trend of the gene. (J-L) The distribution of immune checkpoints related molecules in low- and high-expression groups. The horizontal axis denotes dissimilar sample groups; vertical axis denotes gene expression distributions while different colors denote dissimilar groups. *, P<0.05; ***, P<0.001. TMB, tumor mutation burden; MSI, microsatellite instability.
Discussion
HCC, a highly heterogeneous disease, poses a threat to human health and life globally. Despite the continuously advancement of medical technology, multi-step complex pathogenesis of HCC is still an obstacle to the improvement of, the already limited, treatment and prognosis strategies. Therefore, there is need to establish novel prognostic models for HCC.
We constructed a predictive model using three ferroptosis-associated genes namely G6PD, SAT1, and SLC1A5. The G6PD was significantly up-regulated in HCC cells whereby it contributed to the migration as well as invasion of HCC cells through epithelial to mesenchymal transition (EMT) induction via STAT3 pathway activation (18). Likewise, Wang et al. reported that overexpressed G6PD was positively correlated with HCC cells proliferation (19). Additionally, another study confirmed that deficiency of G6PD may reduce susceptibility to cancer of endodermal origin, including HCC (20). The p53, a tumor suppressor protein, was found to have the potential to promote the expression of SAT1, sensitize cells to ferroptosis and inhibit tumor growth (21). Additionally, previous studies have reported that overexpression of SAT1 could inhibit growth and lead to mitochondrial apoptosis through depleting cellular spermidine and spermine (22). The SLC1A5, a Na+ dependent transporter, was significantly increased in HCC tissues and its up-regulation of contributed to proliferation of HCC cells through enhancement of capacity of uptake of glutamine (23). Our findings were in line with these studies.
In this research, TNM stage and risk signature were independent OS predictors both in TCGA and ICGC cohorts. In clinical practice, the TNM staging system has been widely used by clinicians to predict prognosis and guide treatment. However, the TNM staging system is not always able to predict the prognosis of patients, because same stage patients may present different prognoses (24). Thus, it is urgent to build novel molecular markers to assist and complement the TNM staging system for the diagnosis as well as treatment of HCC. For example, Zhang et al. established a predictive model that was based on three hypoxia-related genes (25). This model reliably predicted the prognosis of HCC patients and provided innovative ideas for molecular targeted therapy (25). Our ferroptosis-associated risk signature, which was an independent predictor of OS in HCC patients, also presented a high predictive ability.
We further investigated enrichment functions of DEGs. They were found to be enriched in some pathways involved in cell cycle, glycolysis/gluconeogenesis, and cytochrome P450. These pathways play vital roles in tumor progression. Yan et al. reported that, aberrant expression of cell cycle associated genes is associated with progression of HCC, which was in line with a previous finding that disturbed regulation of cell cycle check points, one of the causes of carcinogenesis in the cancer (26,27). Glycolysis is often used to provide energy to meet the requirements for rapid proliferation of HCC cells (28). Compared to adjacent normal cells, Cytochrome P450, a major xenobiotic-metabolizing enzyme, was reported to decrease in HCC tissues (29). Furthermore, patients with down-regulated Cytochrome P450 were more vulnerable to drug toxicity (29). Moreover, DEGs were also enriched in immune-associated BP.
Therefore, we performed ssGSEA to investigate the correlations between the ferroptosis-related risk signature immune cells infiltration and immune-related functions in the TIME. It revealed that the enrichment scores of macrophages, Treg and check point were higher in high-risk than in low-risk group. These findings were in accordance with previous evidences (30). Tumor-associated macrophages (TAM) with high infiltration in TIME enhance invasiveness of HCC cells correlating with progression and poor prognosis of HCC (31). Treg, an immunosuppressive cell in TIME, enhanced immunosuppressive environment via release of inhibitory cytokines (32). For example, it was reported that Treg can contribute to cancer cell immune escape via contact-dependent interactions between check-point molecules and their ligands (33). Moreover, previous study has demonstrated that TAM may attract Treg cells to cancer sites through release of chemokines, which may lead to a positive feedback loop and impeding cytotoxic T cell activation (34,35). Besides, high expressions of G6PD and SLC1A5 were significantly correlated with high level of TP53 mutation and immune check point molecules. These results imply that ferroptosis-related genes, are the likely predictors and targets for immunotherapy. Therefore, understanding the underlying mechanisms of how ferroptosis-related genes affect immune cells infiltration and immune-associated functions may provide new strategies for immunotherapy.
We first established a three-gene risk signature that was based on infiltration levels of immune cells in TIME using ferroptosis-related genes. This risk signature can well predict survival outcomes and guide clinical decision making for patients with HCC. This risk signature has the ability to distinguish functional enrichment of immune cells and immune-related pathways. Importantly, ferroptosis-related genes are potential markers as well as targets for the diagnosis and immunotherapy of HCC. However, this study is associated with some limitations. For instance, our prediction model was built based on retrospective data from public databases and therefore require a large-scale prospective study to validate its clinical utility. Furthermore, these bioinformatics findings require further validation via experimental studies.
Conclusions
In conclusion, three ferroptosis-associated genes were used to construct a prediction model which effectively and independently predicted the OS of HCC. The model genes are likely to be applied as biomarkers, treatment, and diagnostic targets for HCC.
Acknowledgments
We thank Home for Researchers editorial team (www.home-for-researchers.com) for editing the language of this manuscript.
Funding: This work was supported by the Beijing Hospitals Authority Youth Programme (QMS20200803 to CZ), and the National Natural Science Foundation of China (No. 81800483).
Ethical Statement: The authors are accountable for all aspects of the work in ensuring that questions related to the accuracy or integrity of any part of the work are appropriately investigated and resolved. The study was conducted in accordance with the Declaration of Helsinki (as revised in 2013). Institutional ethical approval and informed consent were waived.
Open Access Statement: This is an Open Access article distributed in accordance with the Creative Commons Attribution-NonCommercial-NoDerivs 4.0 International License (CC BY-NC-ND 4.0), which permits the non-commercial replication and distribution of the article with the strict proviso that no changes or edits are made and the original work is properly cited (including links to both the formal publication through the relevant DOI and the license). See: https://creativecommons.org/licenses/by-nc-nd/4.0/.
Footnotes
Reporting Checklist: The authors have completed the STROBE reporting checklist. Available at https://dx.doi.org/10.21037/jgo-21-237
Peer Review File: Available at https://dx.doi.org/10.21037/jgo-21-237
Conflicts of Interest: All authors have completed the ICMJE uniform disclosure form (available at https://dx.doi.org/10.21037/jgo-21-237). The authors have no conflicts of interest to declare.
References
- 1.Yu R, Tan Z, Xiang X, et al. Effectiveness of PIVKA-II in the detection of hepatocellular carcinoma based on real-world clinical data. BMC Cancer 2017;17:608. 10.1186/s12885-017-3609-6 [DOI] [PMC free article] [PubMed] [Google Scholar]
- 2.Bray F, Ferlay J, Soerjomataram I, et al. Global cancer statistics 2018: GLOBOCAN estimates of incidence and mortality worldwide for 36 cancers in 185 countries. CA Cancer J Clin 2018;68:394-424. 10.3322/caac.21492 [DOI] [PubMed] [Google Scholar]
- 3.Llovet JM, Zucman-Rossi J, Pikarsky E, et al. Hepatocellular carcinoma. Nat Rev Dis Primers 2016;2:16018. 10.1038/nrdp.2016.18 [DOI] [PubMed] [Google Scholar]
- 4.Fujiwara N, Friedman SL, Goossens N, et al. Risk factors and prevention of hepatocellular carcinoma in the era of precision medicine. J Hepatol 2018;68:526-49. 10.1016/j.jhep.2017.09.016 [DOI] [PMC free article] [PubMed] [Google Scholar]
- 5.Sun VC, Sarna L. Symptom management in hepatocellular carcinoma. Clin J Oncol Nurs 2008;12:759-66. 10.1188/08.CJON.759-766 [DOI] [PMC free article] [PubMed] [Google Scholar]
- 6.Giannini EG, Farinati F, Ciccarese F, et al. Prognosis of untreated hepatocellular carcinoma. Hepatology 2015;61:184-90. 10.1002/hep.27443 [DOI] [PubMed] [Google Scholar]
- 7.Aravalli RN, Steer CJ, Cressman EN. Molecular mechanisms of hepatocellular carcinoma. Hepatology 2008;48:2047-63. 10.1002/hep.22580 [DOI] [PubMed] [Google Scholar]
- 8.Dixon SJ, Lemberg KM, Lamprecht MR, et al. Ferroptosis: an iron-dependent form of nonapoptotic cell death. Cell 2012;149:1060-72. 10.1016/j.cell.2012.03.042 [DOI] [PMC free article] [PubMed] [Google Scholar]
- 9.Yang WS, Stockwell BR. Ferroptosis: Death by Lipid Peroxidation. Trends Cell Biol 2016;26:165-76. 10.1016/j.tcb.2015.10.014 [DOI] [PMC free article] [PubMed] [Google Scholar]
- 10.Hirschhorn T, Stockwell BR. The development of the concept of ferroptosis. Free Radic Biol Med 2019;133:130-43. 10.1016/j.freeradbiomed.2018.09.043 [DOI] [PMC free article] [PubMed] [Google Scholar]
- 11.Yuan Y, Cao W, Zhou H, et al. CLTRN, Regulated by NRF1/RAN/DLD Protein Complex, Enhances Radiation Sensitivity of Hepatocellular Carcinoma Cells Through Ferroptosis Pathway. Int J Radiat Oncol Biol Phys 2021;110:859-71. 10.1016/j.ijrobp.2020.12.062 [DOI] [PubMed] [Google Scholar]
- 12.Wang Q, Guo Y, Wang W, et al. RNA binding protein DAZAP1 promotes HCC progression and regulates ferroptosis by interacting with SLC7A11 mRNA. Exp Cell Res 2021;399:112453. 10.1016/j.yexcr.2020.112453 [DOI] [PubMed] [Google Scholar]
- 13.Lang X, Green MD, Wang W, et al. Radiotherapy and Immunotherapy Promote Tumoral Lipid Oxidation and Ferroptosis via Synergistic Repression of SLC7A11. Cancer Discov 2019;9:1673-85. 10.1158/2159-8290.CD-19-0338 [DOI] [PMC free article] [PubMed] [Google Scholar]
- 14.Wang W, Green M, Choi JE, et al. CD8+ T cells regulate tumour ferroptosis during cancer immunotherapy. Nature 2019;569:270-4. 10.1038/s41586-019-1170-y [DOI] [PMC free article] [PubMed] [Google Scholar]
- 15.Zhang F, Li F, Lu GH, et al. Engineering Magnetosomes for Ferroptosis/Immunomodulation Synergism in Cancer. ACS Nano 2019;13:5662-73. 10.1021/acsnano.9b00892 [DOI] [PubMed] [Google Scholar]
- 16.Ganz T, Nemeth E. Iron homeostasis in host defence and inflammation. Nat Rev Immunol 2015;15:500-10. 10.1038/nri3863 [DOI] [PMC free article] [PubMed] [Google Scholar]
- 17.Yoshihara K, Shahmoradgoli M, Martínez E, et al. Inferring tumour purity and stromal and immune cell admixture from expression data. Nat Commun 2013;4:2612. 10.1038/ncomms3612 [DOI] [PMC free article] [PubMed] [Google Scholar]
- 18.Lu M, Lu L, Dong Q, et al. Elevated G6PD expression contributes to migration and invasion of hepatocellular carcinoma cells by inducing epithelial-mesenchymal transition. Acta Biochim Biophys Sin (Shanghai) 2018;50:370-80. 10.1093/abbs/gmy009 [DOI] [PubMed] [Google Scholar]
- 19.Wang A, Chen B, Jian S, et al. miR-206-G6PD axis regulates lipogenesis and cell growth in hepatocellular carcinoma cell. Anticancer Drugs 2021;32:508-16. 10.1097/CAD.0000000000001069 [DOI] [PubMed] [Google Scholar]
- 20.Pes GM, Errigo A, Soro S, et al. Glucose-6-phosphate dehydrogenase deficiency reduces susceptibility to cancer of endodermal origin. Acta Oncol 2019;58:1205-11. 10.1080/0284186X.2019.1616815 [DOI] [PubMed] [Google Scholar]
- 21.Ou Y, Wang SJ, Li D, et al. Activation of SAT1 engages polyamine metabolism with p53-mediated ferroptotic responses. Proc Natl Acad Sci U S A 2016;113:E6806-12. 10.1073/pnas.1607152113 [DOI] [PMC free article] [PubMed] [Google Scholar]
- 22.Mandal S, Mandal A, Park MH. Depletion of the polyamines spermidine and spermine by overexpression of spermidine/spermine N1-acetyltransferase 1 (SAT1) leads to mitochondria-mediated apoptosis in mammalian cells. Biochem J 2015;468:435-47. 10.1042/BJ20150168 [DOI] [PMC free article] [PubMed] [Google Scholar]
- 23.Zhang P, Wang Q, Lin Z, et al. Berberine Inhibits Growth of Liver Cancer Cells by Suppressing Glutamine Uptake. Onco Targets Ther 2019;12:11751-63. 10.2147/OTT.S235667 [DOI] [PMC free article] [PubMed] [Google Scholar]
- 24.Choi JR, Yong KW, Tang R, et al. Lateral Flow Assay Based on Paper-Hydrogel Hybrid Material for Sensitive Point-of-Care Detection of Dengue Virus. Adv Healthc Mater 2017. doi: . 10.1002/adhm.201600920 [DOI] [PubMed] [Google Scholar]
- 25.Zhang B, Tang B, Gao J, et al. A hypoxia-related signature for clinically predicting diagnosis, prognosis and immune microenvironment of hepatocellular carcinoma patients. J Transl Med 2020;18:342. 10.1186/s12967-020-02492-9 [DOI] [PMC free article] [PubMed] [Google Scholar]
- 26.Yan H, Li Z, Shen Q, et al. Aberrant expression of cell cycle and material metabolism related genes contributes to hepatocellular carcinoma occurrence. Pathol Res Pract 2017;213:316-21. 10.1016/j.prp.2017.01.019 [DOI] [PubMed] [Google Scholar]
- 27.Kastan MB, Bartek J. Cell-cycle checkpoints and cancer. Nature 2004;432:316-23. 10.1038/nature03097 [DOI] [PubMed] [Google Scholar]
- 28.Hu H, Zhu W, Qin J, et al. Acetylation of PGK1 promotes liver cancer cell proliferation and tumorigenesis. Hepatology 2017;65:515-28. 10.1002/hep.28887 [DOI] [PubMed] [Google Scholar]
- 29.Nekvindova J, Mrkvicova A, Zubanova V, et al. Hepatocellular carcinoma: Gene expression profiling and regulation of xenobiotic-metabolizing cytochromes P450. Biochem Pharmacol 2020;177:113912. 10.1016/j.bcp.2020.113912 [DOI] [PubMed] [Google Scholar]
- 30.Lu C, Rong D, Zhang B, et al. Current perspectives on the immunosuppressive tumor microenvironment in hepatocellular carcinoma: challenges and opportunities. Mol Cancer 2019;18:130. 10.1186/s12943-019-1047-6 [DOI] [PMC free article] [PubMed] [Google Scholar]
- 31.Shwartz A, Goessling W, Yin C. Macrophages in Zebrafish Models of Liver Diseases. Front Immunol 2019;10:2840. 10.3389/fimmu.2019.02840 [DOI] [PMC free article] [PubMed] [Google Scholar]
- 32.Sakaguchi S, Miyara M, Costantino CM, et al. FOXP3+ regulatory T cells in the human immune system. Nat Rev Immunol 2010;10:490-500. 10.1038/nri2785 [DOI] [PubMed] [Google Scholar]
- 33.Langhans B, Nischalke HD, Krämer B, et al. Role of regulatory T cells and checkpoint inhibition in hepatocellular carcinoma. Cancer Immunol Immunother 2019;68:2055-66. 10.1007/s00262-019-02427-4 [DOI] [PMC free article] [PubMed] [Google Scholar]
- 34.Wang D, Yang L, Yue D, et al. Macrophage-derived CCL22 promotes an immunosuppressive tumor microenvironment via IL-8 in malignant pleural effusion. Cancer Lett 2019;452:244-53. 10.1016/j.canlet.2019.03.040 [DOI] [PubMed] [Google Scholar]
- 35.Mamrot J, Balachandran S, Steele EJ, et al. Molecular model linking Th2 polarized M2 tumour-associated macrophages with deaminase-mediated cancer progression mutation signatures. Scand J Immunol 2019;89:e12760. 10.1111/sji.12760 [DOI] [PMC free article] [PubMed] [Google Scholar]


