

Abstract
Weight loss or lower body mass index (BMI) could be an early symptom of Alzheimer disease (AD), but when this begins to emerge is difficult to estimate with traditional observational data. In an extension of Mendelian randomization, we leveraged variation in genetic risk for late-onset AD risk to estimate the causal effect of AD on BMI and the earliest ages at which AD-related weight loss (or lower BMI as a proxy) occurs. We studied UK Biobank participants enrolled in 2006–2010, who were without dementia, aged 39–73, with European genetic ancestry. BMI was calculated with measured height/weight (weight (kg)/height (m)2). An AD genetic risk score (AD-GRS) was calculated based on 23 genetic variants. Using linear regressions, we tested the association of AD-GRS with BMI, stratified by decade, and calculated the age of divergence in BMI trends between low and high AD-GRS. AD-GRS was not associated with BMI in 39- to 49-year-olds (β = 0.00, 95% confidence interval (CI): −0.03, 0.03). AD-GRS was associated with lower BMI in 50- to 59-year-olds (β = −0.03, 95% CI: −0.06, −0.01) and 60- to 73-year-olds (β = −0.09, 95% CI:−0.12, −0.07). Model-based BMI age curves for high versus low AD-GRS began to diverge after age 47 years. Sensitivity analyses found no evidence for pleiotropy or survival bias. Longitudinal replication is needed; however, our findings suggest that AD genes might begin to reduce BMI decades prior to dementia diagnosis.
Keywords: Alzheimer disease, body mass index, disease natural history, Mendelian randomization
Abbreviations
- AD
Alzheimer disease
- AD-GRS
Alzheimer disease genetic risk score
- BMI
body mass index
- CI
confidence interval
- GWAS
genome-wide association study
- IGAP
International Genomics of Alzheimer’s Project
- MR
Mendelian randomization
- PC
principal component
- SNP
single nucleotide polymorphism
Given the long, insidious development of dementia and the subtle nature of early cognitive changes, it remains unclear at what age the earliest manifestations of Alzheimer disease (AD) emerge. Growing evidence of brain changes occurring decades prior to dementia diagnosis might help explain the failure of recent AD clinical trials, which enroll older adults with cognitive impairment (1–3). Identifying early indicators of emerging AD pathophysiology could point to a critical window when the disease trajectory might be modifiable (e.g., prior to substantial neurodegeneration). Weight loss might be an early indicator of incipient AD (4–7). Neurodegenerative changes (8, 9); changes in metabolism, appetite, and nutrition (10); or other metabolic factors could have an impact on body mass index (BMI) prior to clinical dementia onset. The age at which weight loss emerges in patients who go on to develop AD is unclear but might point to the earliest manifestations of AD.
Identifying the earliest age of AD-related weight loss is challenging because higher midlife BMI might increase the risk of AD (11–14). Thus, the earliest weight loss resulting from developing AD might not be detectable when comparing earlier BMI values of people subsequently diagnosed with AD. Alternative study designs such as Mendelian randomization (MR), which uses genetic variants as instruments to evaluate the causal effect of a risk factor on a health outcome (15–17), might be useful to evaluate the age when AD-related weight loss begins. Several prior MR studies have found no evidence that BMI causes AD (18–20); however, to our knowledge no study has focused on the reverse (e.g., that AD reduces BMI).
MR approaches can provide stronger causal inference than traditional observational studies by using genetic risk, which is determined at conception, prior to disease onset, but identifies individuals who are at high risk of developing AD in the future. Thus, any association between AD-related genetic variants and BMI cannot be attributed to the influence of early or midlife BMI on AD or other unmeasured confounding. An association between AD genetic risk and reduced BMI would suggest that a biological process associated with the AD genetic risk score (AD-GRS) modifies BMI. Any age-related changes in the association between AD-GRS and BMI could indicate at what age AD biological changes begin to affect BMI. Such an inference would be possible only if we can plausibly assume there is not pleiotropy of genetic risk for AD and BMI (15) or biases such as selective survival bias (21, 22) that could account for results (Figure 1).
Figure 1.
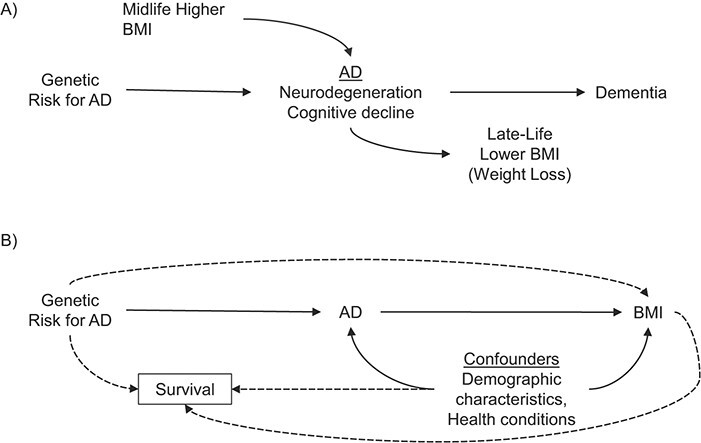
Hypothesized relationships between genetic risk for Alzheimer disease (AD) and body mass index (BMI). Based on our conceptual model (A), we hypothesized that there would be an association between AD genetic risk score (AD-GRS) and lower late-life BMI but no association between the AD-GRS and midlife BMI. Individuals with higher genetic risk for AD are at higher likelihood of developing AD, which we conceptualize as beginning with neurodegeneration and early cognitive decline and subsequently leading to dementia. High midlife BMI might also promote AD/cognitive decline through alternative pathways. However, AD-related changes might also lead to lower late-life BMI or weight loss. The age at which an association between AD-GRS and lower BMI emerges could also point to an early manifestation of AD-related BMI change. This interpretation requires several assumptions, violations of which are represented by dashed lines (B): that there are no pleiotropic or independent effects of the AD-GRS on BMI via mechanisms unrelated to AD and that survival factors do not strongly affect the composition of the analytical sample.
The objective of the present study was to take advantage of known genetic variation in late-onset AD risk (23) to identify the earliest ages at which genetic risk for AD is associated with lower BMI (as a proxy for weight loss). In this study, we evaluated the association between late-onset AD genetic risk and BMI across mid- to late-life participants in UK Biobank. We also used an innovative approach to estimate the age of divergence in BMI trajectories for those with high compared with low risk of late-onset AD.
METHODS
Study setting and participants
We obtained data from the UK Biobank, an ongoing study of over 500,000 adults. Participants aged 39–73 years were recruited in 2006–2010 from across the United Kingdom to provide detailed information about themselves via computerized questionnaires, provide biological samples, undergo clinical measurements, and have their health followed prospectively (24). For these analyses, we excluded those with missing genetic information (n = 15,221) or who were flagged as recommended for genetic analysis exclusion (n = 378) and those with missing BMI (n = 1,295). We also excluded participants classified as of non-European genetic ancestry (n = 78,336) based on genetic ancestry principal components, because genetic predictors of AD might differ by ancestry/population stratification (25). After exclusions, 407,386 participants were included in the analytical sample. Ethical approval for the UK Biobank was obtained from the National Health Service National Research Ethics Service, and all participants provided written informed consent. The present study was approved by the UK Biobank under application #34507 and by the University of California San Francisco institutional review board.
Genotyping and genetic risk scores for AD
Genotyping of UK Biobank samples was conducted with 2 closely related arrays (Affymetrix using a bespoke BiLEVE Axiom array and Affymetrix UK Biobank Axiom array (Affymetrix, Santa Clara, California) and is described in detail elsewhere (26, 27). Briefly, all genetic data were quality controlled and imputed by UK Biobank (downloaded on December 1, 2017) to a reference panel that merged the 1000 Genomes Phase 3 and UK10K reference panels. A secondary imputation was completed using the Haplotype Reference Consortium reference panel, and results from the Haplotype Reference Consortium imputation were preferentially used at single nucleotide polymorphisms (SNPs) present in both panels. Before the release of the UK Biobank genetic data, a stringent quality control protocol (described elsewhere) was applied at the Wellcome Centre for Human Genetics (28).
To construct the AD-GRS in UK Biobank data, we used summary results from the 2013 International Genomics of Alzheimer’s Project (IGAP) meta-analyzed genome-wide association study (GWAS) on late-onset AD in European populations (23) to calculate an AD genetic risk score (AD-GRS) for each participant. The IGAP study identified 23 loci associated with AD, including 2 SNPs used to characterize apolipoprotein E (APOE) ε4 allele status. The AD-GRS was based on the meta-analyzed β coefficients obtained in the IGAP’s stage 1 study, which included genotyped and imputed data (7,055,881 single nucleotide polymorphisms, 1000G phase 1 alpha imputation, Build 37, Assembly Hg19) of 17,008 Alzheimer disease cases and 37,154 controls. We calculated the AD-GRS by multiplying each individual’s risk allele count for each locus by the β coefficient (expressed as the log odds ratio) for that polymorphism (Web Table 1, available at https://doi.org/10.1093/aje/kwab103) and adding the products for all 23 loci. This step weights each SNP in proportion to the observed association with AD risk (either positive or negative). The scores can be interpreted as the log odds ratio for AD conferred by that individual’s profile on the 23 SNPs compared with a person who had the nonrisk allele at each locus. We converted the AD-GRS into a standardized z score based on the sample mean and variance. This score has previously been shown to predict cognition and dementia-related death in the UK Biobank (29). We also calculated a secondary score of 27 SNPs using summary results from the 2019 IGAP meta-analyzed genome-wide association study (Web Table 2) (30).
Body mass index
BMI was calculated based on height and weight (kg/m2) measured at the baseline assessment.
Other characteristics
Age, sex, and education were reported at the baseline assessment. UK Biobank provides principal components (PCs) related to genetic population stratification; we used the first 10 PCs in our analyses to adjust for population stratification. Educational level (less than high school, high-school graduate, professional or vocational qualification, college graduate) and smoking status (never, past, current) were used as covariates for sensitivity analyses.
Participants completed several touchscreen-based cognitive tests; we used reaction time (i.e., simple processing speed) as a measure of cognition to confirm previously established associations between BMI and cognition (12). Reaction time was available on the largest number of participants (99.3% of the present sample) and was correlated with other cognitive tests (31). Participants were timed at pressing a button as soon as 2 identical cards were seen on the touchscreen; mean duration to first press of snap-button was summed over rounds in which both cards matched. Participants completed 12 rounds. Some values were excluded when forming the average: rounds 0–4, which were regarded as “training”; times under 50 milliseconds, which must be due to anticipation rather than reaction; and times over 2,000 milliseconds, because the cards had disappeared by then. Values in milliseconds were rounded to the nearest whole number (32).
Statistical analysis
First, we evaluated the association between BMI and reaction time to confirm expected associations seen in prior research: specifically, that higher BMI in midlife is associated with worse cognitive outcomes but higher BMI in late life is associated with better cognitive outcomes (12). We conducted analyses stratified by age at assessment (in years: 39–49, 50–59, and 60–73). For each age stratum, we used linear regressions to predict reaction time using BMI (continuous) adjusted for age, age2, sex, and education.
Our primary analyses parallel the general approach of a MR study (15–17), which leverages the fact that genetic variants have an established temporal order (i.e., determined at conception, prior to disease onset). Furthermore, one’s genotype is not as susceptible to traditional confounders in observational studies such as one’s socioeconomic status or health status in midlife. If AD-related genetic variants influence age trends in BMI, this provides evidence that could inform whether and when AD or shared genetics affect BMI (Figure 1).
We estimated separate age-stratified linear regressions with the AD-GRS (23 SNPs based on 2013 IGAP data) (23) as the primary predictor and BMI as the outcome. Models included adjustment for age, age2, sex, and PCs. Next, we estimated nonlinear trends for age using one linear regression model for the whole sample with AD-GRS, age, and age2 as primary predictors. We tested whether age trends differed by AD-GRS using interaction terms between the linear and quadratic age terms and AD-GRS. Based on this regression equation we calculated the age at which curves began to diverge. To illustrate difference between low and high AD genetic risk we calculated predicted BMI curves for the 10th percentile (low risk) and 90th percentile (high risk) of the AD-GRS, from our prior model. Based on these same percentiles we also estimated the earliest age at which high AD-GRS was associated with a significantly lower BMI compared with low AD-GRS. We repeated primary analyses using the secondary AD-GRS score (27 SNPs) updated with 2019 IGAP summary data (30).
We conceptualize that the association of the AD-GRS and BMI represents an effect of incipient AD on BMI; however, this requires the assumption that there are not alternative pathways through which pleiotropic effects of AD genes affect BMI (15–17). Our main hypothesis was that in older ages the AD-GRS would be inversely associated with BMI and that in younger ages the AD-GRS would have no association with BMI (this latter finding would also help rule out potential for pleiotropy of the AD-GRS on midlife BMI). We also performed MR-Egger regression as a sensitivity analysis to test for any horizontal pleiotropy (e.g., independent associations of genetic variants on both BMI and AD) (33). We report intercept terms and the intercept test from MR-Egger analysis; a nonzero intercept is suggestive of horizontal pleiotropy.
Finally, selection and survival bias might be present in MR studies, particularly if the AD-GRS has pleiotropic effects on survival or if the exposure, outcome, and/or confounders have strong effects on survival (21, 22). Additionally, a healthy volunteer bias might influence enrollment in the UK Biobank (34). We conducted several sensitivity analyses to investigate this. First, we included additional adjustment in our primary models of smoking status and educational level, which might influence both BMI and survival. Next, we used inverse probability weighting (35) to attempt to account for potential selection factors that might be present in older ages by upweighting characteristics of younger adults and those who died early (21, 36). Stabilized weights were inverse predicted probabilities based on logistic regression models for younger age (ages 40–50 vs. ages ≥50) with age, sex, smoking status, educational level, PCs, the AD-GRS, and BMI and their interactions as predictors. We calculated 95% confidence intervals based on 1,000 bootstrapped replications (37). Finally, we performed a negative control analysis, an analysis in which we a priori expected a null association with the AD-GRS but it would be susceptible to selection bias. We evaluated for potential survival bias by examining whether we observed similar trends in the association between AD-GRS and smoking status, a factor strongly associated with survival (38, 39) but that we would not expect to be strongly associated with the AD-GRS. We examined both ever-smoking and current smoking because we can expect differential propensity for selection bias and because there might be unexpected associations with AD genes (pleiotropy) or early AD. We tested for significant age × AD-GRS interactions and plotted probability of smoking low versus high AD-GRS by age.
All regression models included adjustment for sex and PCs as described above. Analyses were conducted in R, version 3.6.2 (R Core Team, R Foundation for Statistical Computing, Vienna, Austria). All tests were 2-sided with α = 0.05, and we report 95% confidence intervals.
RESULTS
Participant baseline characteristics are shown in Table 1; 21.8% of the sample was aged 39–49 years, 32.9% aged 50–59 years, and 45.3% was aged 60–73 years at time of baseline assessment. Of the sample, 54.1% were female. Most participants had BMIs in the normal (32.5%) or overweight (42.8%) range.
Table 1.
Characteristics of Participants Included in Analyses of Alzheimer Disease Risk and Body Mass Index (n = 407,386), UK Biobank, United Kingdom, 2006–2010
| Participant Characteristic | No. | % | Mean (SD) |
|---|---|---|---|
| Age group, years | 56.9 (8.0) | ||
| 39–49 | 88,758 | 21.8 | |
| 50–59 | 134,163 | 32.9 | |
| 60–73 | 184,465 | 45.3 | |
| Female sex | 220,319 | 54.1 | |
| High-school graduatea | 191,394 | 47.5 | |
| AD-GRS (z score) | 0 (1) | ||
| At least one APOE ε4 allele | 117,478 | 28.8 | |
| Reaction time, millisecondsa | 535 (113.2) | ||
| Body mass indexb | 27.4 (4.7) | ||
| Underweight (<18.5) | 2,042 | 0.5 | |
| Normal (18.5–24.9) | 132,315 | 32.5 | |
| Overweight (25.0–29.9) | 174,204 | 42.8 | |
| Obese (30.0–39.9) | 98,825 | 24.3 | |
| Morbidly obese (≥40.0) | 7,632 | 1.9 |
Abbreviations: AD-GRS, Alzheimer disease genetic risk score; APOE, apolipoprotein E; SD, standard deviation.
a Missing data: education, 3,701 (<1%); reaction time, 2,484 (<1%).
b Weight (kg)/height (m)2.
Age-stratified results for the association between BMI and cognition (reaction speed) are shown in Table 2. The association between BMI and cognition (reaction speed) differed by age. For ages 39–49 years, a higher BMI was associated with worse reaction time (0.13-milliseconds slower reaction time, with 95% confidence interval (CI): 0.01, 0.26; P = 0.03). In ages 50–59 a higher BMI was associated with faster reaction time (0.12-milliseconds faster reaction time for ages 50–59 (95% CI: 0.23, 0.0002; P = 0.045), and this effect estimate was even stronger for ages 60–73 years (0.20-milliseconds faster reaction time (95% CI: 0.32, 0.08); P = 0.001).
Table 2.
Association Between Body Mass Index and Reaction Timea, UK Biobank, United Kingdom, 2006–2010
| Age Group, years | No. |

|
95% CI |
|---|---|---|---|
| 39–49 | 87,973 | 0.13 | 0.01, 0.26 |
| 50–59 | 132,613 | −0.12 | −0.23, −0.0002 |
| 60–73 | 180,611 | −0.20 | −0.32, −0.08 |
Abbreviation: CI, confidence interval.
a Higher values = slower reaction time; based on linear regression models adjusted for age, age2, sex, and education.
Age-stratified results for the association between BMI and the AD-GRS are shown in Table 3. For ages 39–49 years, AD-GRS was not significantly associated with BMI (0.00 per 1 standard deviation in AD-GRS, 95% CI: −0.03, 0.03; P = 0.94). For ages 50–59 years AD-GRS was associated with lower BMI (−0.03 per 1 standard deviation in AD-GRS, 95% CI: −0.06, −0.01; P = 0.01), and this association was stronger and significant for ages 60–70 years (−0.09 per 1 standard deviation in AD-GRS, 95% CI: −0.12, −0.07; P < 0.001). MR-Egger regressions for each age grouping found no evidence for horizontal pleiotropy: MR-Egger intercept β = −0.008 (standard error = 0.011), P = 0.49, for ages 39–49 years; β = 0.001 (standard error = 0.012), P = 0.91, for ages 50–59 years; and β = 0.003 (standard error = 0.001), P = 0.66, for ages 60–73 years.
Table 3.
Association Between AD-GRS and Body Mass Index Stratified by Agea, UK Biobank, United Kingdom, 2006–2010
| Primary AD-GRS 2013 Score b | 2019 Score c | ||||
|---|---|---|---|---|---|
| Age Group, years | No. |

|
95% CI |

|
95% CI |
| 39–49 | 88,758 | 0.00 | −0.03, 0.03 | 0.00 | −0.04, 0.02 |
| 50–59 | 134,163 | −0.03 | −0.06, −0.01 | −0.04 | −0.07, −0.01 |
| 60–73 | 184,465 | −0.09 | −0.12, −0.07 | −0.09 | −0.11, −0.07 |
Abbreviations: AD-GRS, Alzheimer’s disease genetic risk score; CI, confidence interval; GWAS, genome-wide association study; SNP, single nucleotide polymorphism.
a Reaction time was measured in milliseconds. Models adjusted for age, age2, sex, and principle components to account for confounding by population stratification.
b AD-GRS of 23 SNPs using estimates from 2013 GWAS meta-analysis.
c AD-GRS of 27 SNPs using estimates from 2019 GWAS meta-analysis.
Model-based BMI age curves showed an increasing trajectory of average BMI for individuals aged 40–50, which slowed and finally reversed so that by age 65 each additional year of age was associated with lower BMI (Figure 2). For participants with the average AD-GRS, age was associated with increased BMI (0.92 points per decade, 95% CI: 0.85, 1.00), but for each decade after 40 this estimate decreased (age2 term) by −0.21 (95% CI: −0.06, −0.01) points. This slowing of the age-related BMI curve occurred earlier in people with high AD-GRS scores (P < 0.001 for overall age by AG-GRS interactions). One standard deviation in AD-GRS was associated with an additional slowing of the BMI curve of −0.02 (95% CI: −0.04, 0.00) points per decade. The BMI of individuals with high versus low AD-GRS scores began to diverge after age 47 years, and the curves further diverged after age 65 (Figure 2). Comparing the 10th to 90th percentile of AD-GRS, differences in BMI curves were statistically significant after age 56.
Figure 2.
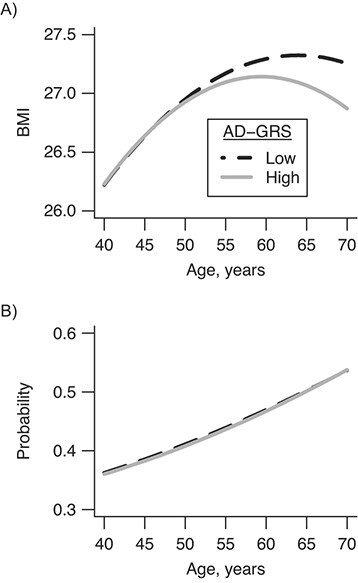
Age-related curves for body mass index (BMI) (A) and smoking (negative control) (B) for high and low Alzheimer disease genetic risk score (AD-GRS), UK Biobank, United Kingdom, 2006–2010. Predicted curves for 10th (low) versus 90th (high) percentile of genetic risk for AD began to diverge at age 47 years and were significantly different by age 56 years.
Sensitivity analyses did not appreciably change results. Estimates for primary models were unchanged with adjustment for smoking status and educational level, and they were similar when including inverse probability of selection weights, although confidence intervals were wider (Web Table 3). Results were very similar but slightly stronger using the secondary AD-GRS based on updated 2019 results (Table 3). Using this updated AD-GRS score, the age of divergence was 46, and BMI differences were statistically significant by age 55 years. Using smoking status as a negative control for selection bias, we found no evidence for age by AD-GRS interactions (all P >0.10). Plots for having ever smoked (Figure 2B) and current smoking (Web Figure 1) showed little evidence for divergence.
DISCUSSION
We found evidence that higher AD-GRS is associated with lower BMI in older adults. We found that the age at which BMI curves begin to diverge is in midlife (age 47 years, with a statistically detectable difference by the late 50s). Age-stratified analyses mirrored this finding. Likewise, a higher BMI was associated with worse cognition in midlife and then flipped to the inverse in older ages. These findings are consistent with the hypothesis that reduced BMI or weight loss is an early manifestation of the AD process that can begin over 20 years prior to disease diagnosis.
This study expands upon prior work showing that weight loss is a predictor of subsequent AD diagnosis (4–6, 12, 40) and AD neuropathologic burden (41). The majority of prior studies have been based on observational data in which it is not possible to establish temporal ordering of BMI relative to established markers of preclinical AD. A number of studies examining BMI in mid- to late life give conflicting estimates of the age at which lower BMI is associated with AD, ranging from 20 to 8 years prior to AD diagnosis (13, 42, 43). Alternative analytical approaches, such as ours, can help triangulate evidence around the timing of BMI change in preclinical AD (44). By examining genetic risk, which is determined at birth, we provide evidence that some biological process associated with AD genetic risk reduces BMI as early as age 50 years. The average age of late-onset AD diagnosis is mid-70s to -80s even in those with higher genetic risk (45, 46). Thus, we find that BMI might begin to diverge between high and low AD genetic risk up 20–30 years prior to dementia diagnosis. This work focuses on late-onset or sporadic AD but complements evidence on early-onset AD, where the Dominantly Inherited Alzheimer Network (DIAN) study on autosomal dominant AD found that BMI curves for mutation carriers diverged from noncarriers as early as 17.8 years prior to expected symptom onset (7). Together these studies add to increasing evidence that pathologic processes related to AD begin to manifest clinically many decades prior to diagnosis (1). Furthermore, these findings suggest that midlife or earlier could be a critical window for prevention of AD (e.g., prior to substantial neurodegeneration). Currently, there are few effective disease modification strategies for AD; perhaps one reason for clinical trial failures is that we might be intervening too late in the disease process. To effectively prevent AD or modify the earliest events in the AD pathologic cascade, interventions (whether AD drug treatments or lifestyle changes) might be needed by midlife.
There is some possibility that our findings are driven by mechanisms other than the effect of AD-related disease on BMI. Some genes for AD, such as apolipoprotein E ε4, could affect BMI through alternative pathways (e.g., pleiotropy) rather than via neurodegeneration, such as cardiovascular disease (46), and might promote survival in earlier life. However, we did not find strong evidence for horizontal pleiotropy (e.g., independent effects of the AD-GRS on BMI) in sensitivity analyses. Autopsy studies have found that AD genetic loci are associated with AD neuropathology but not with vascular pathologies, suggesting that AD genes do increase risk for AD specifically (47). It is still possible that metabolic changes represent an upstream factor (e.g., vertical pleiotropy) that contributes to accumulation of AD pathology or factors closely linked to AD development but that affects BMI independently (48). There is also concern for selection bias due to selective survival, particularly for late-life outcomes such as AD (21, 22), which is also associated with dementia-related mortality (29). Selection bias could be built into our AD-GRS in that it was based on GWAS of the older IGAP sample (mean age approximately 74 years). However, our sensitivity analyses, including our negative control evaluation of smoking, did not show evidence of substantial survival or selection bias. Survival bias could be stronger in studies with ages over 70, when the AD-GRS and other factors are more strongly associated with mortality (49). Future studies will be needed to verify that these findings represent early AD affecting BMI and to clarify the mechanisms through which AD genes might affect BMI.
Several plausible factors could promote weight loss in early AD. Nutritional habits are worse in individuals with cognitive impairment (10), and neurodegeneration changes in AD are associated with lower BMI and weight loss (9, 41). Brain regions and pathways important for metabolism, appetite, and weight maintenance might become disrupted early in the disease process (8, 50). Our findings particularly of age-related differences in the association between AD and lower BMI lends further support to the hypothesis that pathophysiological processes that culminate in AD diagnosis also lead to weight loss decades earlier (16). Although we cannot conclusively say the association between AD-GRS and lower BMI is due to a clear manifestation of AD, our findings confirm that lower BMI as early as midlife is associated with higher risk of AD and cognitive decline.
There are several important limitations to our analysis. Our measurement of BMI is cross-sectional; future studies with longitudinal BMI measurements will be needed to verify age at which weight loss can begin to occur in preclinical AD. We cannot completely rule out selection bias or pleiotropy of the AD-GRS or the GWAS for AD genes; however, sensitivity analyses suggest that these biases do not have a substantial impact on our results. Genetic risk for AD explains only a small percentage of variation in cognitive impairment and AD diagnosis; thus, there is substantial variation in risk for AD that is not captured by our risk score. This variation reduces the ability to detect associations. These analyses were conducted among participants of European ancestry who were generally healthy and well educated; this could limit generalizability. However, there are also considerable strengths to this study, particularly the large sample size, the use of BMI from measurements, an innovative analytical approach, and consistent findings across multiple sensitivity analyses. By using genetic risk, we circumvent a central challenge in interpreting prior results on weight loss, BMI, and AD.
We estimated that genetic factors that increase sporadic AD risk reduce BMI as early as age 47, many years prior to the average age of AD diagnosis (approximately 80 years). Our findings are consistent with the hypothesis that weight loss manifests as a very early pathophysiological change associated with AD. Additional longitudinal studies are needed to confirm the exact mechanisms and earliest detectable physiological changes resulting from AD.
Supplementary Material
ACKNOWLEDGMENTS
Author affiliations: Department of Epidemiology and Biostatistics, University of California, San Francisco, California, United States (Willa D. Brenowitz, Scott C. Zimmerman, Kristine Yaffe, Thomas J. Hoffmann, M. Maria Glymour); Department of Psychiatry and Behavioral Sciences, Weill Institute for Neurosciences, University of California, San Francisco, San Francisco, California, United States (Willa D. Brenowitz, Kristine Yaffe); 23andMe, Mountain View, California, United States (Teresa J. Filshtein); San Francisco VA Health Care System, San Francisco, California, United States (Kristine Yaffe); Department of Neurology, Weill Institute for Neurosciences, University of California, San Francisco, California, United States (Kristine Yaffe); Department of Medicine and Public Health, Rey Juan Carlos University, Madrid, Spain (Stefan Walter); Institute for Human Genetics, University of California, San Francisco, San Francisco, California, United States (Thomas J. Hoffmann); Regeneron Pharmaceuticals, Inc, Tarrytown, New York, United States (Eric Jorgenson); Public Health Sciences, Division of Epidemiology, University of California Davis School of Medicine, Davis, California, United States (Rachel A. Whitmer); and Alzheimer’s Disease Research Center, University of California Davis School of Medicine, Davis, California, United States (Rachel A. Whitmer).
This work was supported by the National Institute on Aging (grants T32AG049663 (W.D.B.), K01AG062722 (W.D.B.), R01AG057869 (S.C.Z. and M.M.G.), K24AG031155 (K.Y.), RF1AG052132 (R.A.W. and M.M.G.), and R01AG059872 (M.M.G.)) and Community of Madrid (grant 2018-T1/BMD-11226 (S.W.)).
We thank UK Biobank participants and staff. The UK Biobank project is funded by the Medical Research Council, The Wellcome Trust, Department of Health for England and Wales, North West Regional Development Agency and the Scottish Executive.
Data is available for approved research from UK Biobank (https://www.ukbiobank.ac.uk/enable-your-research/apply-for-access).
None of the authors’ funding organizations contributed to the design and conduct of the study; collection, management, analysis, or interpretation of the data; preparation, review, or approval of the manuscript; or decision to submit the manuscript for publication. All authors are independent from the funders. T.J.F. currently works at 23andMe but conducted the work while at the University of California, San Francisco. E.J. currently works at Regeneron Pharmaceuticals, Inc, but conducted the work while at Kaiser Permanente Northern California Division of Research, Oakland, California.
Conflict of interest: none declared.
REFERENCES
- 1. Sperling RA, Aisen PS, Beckett LA, et al. Toward defining the preclinical stages of Alzheimer’s disease: recommendations from the National Institute on Aging–Alzheimer’s Association workgroups on diagnostic guidelines for Alzheimer’s disease. Alzheimers Dement. 2011;7(3):280–292. [DOI] [PMC free article] [PubMed] [Google Scholar]
- 2. Sperling R, Mormino E, Johnson K. The evolution of preclinical Alzheimer’s disease: implications for prevention trials. Neuron. 2014;84(3):608–622. [DOI] [PMC free article] [PubMed] [Google Scholar]
- 3. Younes L, Albert M, Moghekar A, et al. Identifying changepoints in biomarkers during the preclinical phase of Alzheimer’s disease. Front Aging Neurosci. 2019;11:74. [DOI] [PMC free article] [PubMed] [Google Scholar]
- 4. Alhurani RE, Vassilaki M, Aakre JA, et al. Decline in weight and incident mild cognitive impairment: Mayo Clinic Study of Aging. JAMA Neurol. 2016;73(4):439–446. [DOI] [PMC free article] [PubMed] [Google Scholar]
- 5. Jimenez A, Pegueroles J, Carmona-Iragui M, et al. Weight loss in the healthy elderly might be a non-cognitive sign of preclinical Alzheimer’s disease. Oncotarget. 2017;8(62):104706–104716. [DOI] [PMC free article] [PubMed] [Google Scholar]
- 6. Kitamura K, Watanabe Y, Nakamura K, et al. Weight loss from 20 years of age is associated with cognitive impairment in middle-aged and elderly individuals. PloS One. 2017;12(10):e0185960. [DOI] [PMC free article] [PubMed] [Google Scholar]
- 7. Müller S, Preische O, Sohrabi HR, et al. Decreased body mass index in the preclinical stage of autosomal dominant Alzheimer’s disease. Sci Rep. 2017;7(1):1225. [DOI] [PMC free article] [PubMed] [Google Scholar]
- 8. Hiller AJ, Ishii M. Disorders of body weight, sleep and circadian rhythm as manifestations of hypothalamic dysfunction in Alzheimer’s disease. Front Cell Neurosci. 2018;12:471. [DOI] [PMC free article] [PubMed] [Google Scholar]
- 9. Pegueroles J, Jiménez A, Vilaplana E, et al. Obesity and Alzheimer’s disease, does the obesity paradox really exist? A magnetic resonance imaging study. Oncotarget. 2018;9(78):34691–34698. [DOI] [PMC free article] [PubMed] [Google Scholar]
- 10. Doorduijn AS, Visser M, van de Rest O, et al. Associations of AD biomarkers and cognitive performance with nutritional status: the NUDAD project. Nutrients. 2019;11(5):1161. [DOI] [PMC free article] [PubMed] [Google Scholar]
- 11. Whitmer RA, Gunderson EP, Barrett-Connor E, et al. Obesity in middle age and future risk of dementia: a 27 year longitudinal population based study. BMJ. 2005;330(7504):1360. [DOI] [PMC free article] [PubMed] [Google Scholar]
- 12. Emmerzaal TL, Kiliaan AJ, Gustafson DR. 2003–2013: a decade of body mass index, Alzheimer’s disease, and dementia. J Alzheimers Dis. 2015;43(3):739–755. [DOI] [PubMed] [Google Scholar]
- 13. Singh-Manoux A, Dugravot A, Shipley M, et al. Obesity trajectories and risk of dementia: 28 years of follow-up in the Whitehall II Study. Alzheimers Dement. 2018;14(2):178–186. [DOI] [PMC free article] [PubMed] [Google Scholar]
- 14. Livingston G, Sommerlad A, Orgeta V, et al. Dementia prevention, intervention, and care. Lancet. 2017;390(10113):2673–2734. [DOI] [PubMed] [Google Scholar]
- 15. Lawlor DA, Harbord RM, Sterne JAC, et al. Mendelian randomization: using genes as instruments for making causal inferences in epidemiology. Stat Med. 2008;27(8):1133–1163. [DOI] [PubMed] [Google Scholar]
- 16. Glymour MM, Tchetgen Tchetgen EJ, Robins JM. Credible Mendelian randomization studies: approaches for evaluating the instrumental variable assumptions. Am J Epidemiol. 2012;175(4):332–339. [DOI] [PMC free article] [PubMed] [Google Scholar]
- 17. Burgess S, Butterworth AS, Thompson JR. Beyond Mendelian randomization: how to interpret evidence of shared genetic predictors. J Clin Epidemiol. 2016;69(suppl C):208–216. [DOI] [PMC free article] [PubMed] [Google Scholar]
- 18. Mukherjee S, Walter S, Kauwe JSK, et al. Genetically predicted body mass index and Alzheimer’s disease related phenotypes in three large samples: Mendelian randomization analyses. Alzheimers Dement. 2015;11(12):1439–1451. [DOI] [PMC free article] [PubMed] [Google Scholar]
- 19. Nordestgaard LT, Tybjærg-Hansen A, Nordestgaard BG, et al. Body mass index and risk of Alzheimer’s disease: a Mendelian randomization study of 399,536 individuals. J Clin Endocrinol Metab. 2017;102(7):2310–2320. [DOI] [PMC free article] [PubMed] [Google Scholar]
- 20. Zhou Y, Sun X, Zhou M. Body shape and Alzheimer’s disease: a Mendelian randomization analysis. Front Neurosci. 2019;13:1084. [DOI] [PMC free article] [PubMed] [Google Scholar]
- 21. Gkatzionis A, Burgess S. Contextualizing selection bias in Mendelian randomization: how bad is it likely to be? Int J Epidemiol. 2019;48(3):691–701. [DOI] [PMC free article] [PubMed] [Google Scholar]
- 22. Schooling CM, Lopez PM, Yang Z, et al. Use of multivariable Mendelian randomization to address biases due to competing risk before recruitment. Front Genet. 2021;11:610852. [DOI] [PMC free article] [PubMed] [Google Scholar]
- 23. Lambert JC, Ibrahim-Verbaas CA, Harold D, et al. Meta-analysis of 74,046 individuals identifies 11 new susceptibility loci for Alzheimer’s disease. Nat Genet. 2013;45(12):1452–1458. [DOI] [PMC free article] [PubMed] [Google Scholar]
- 24. Sudlow C, Gallacher J, Allen N, et al. UK Biobank: an open access resource for identifying the causes of a wide range of complex diseases of middle and old age. PLoS Med. 2015;12(3):e1001779. [DOI] [PMC free article] [PubMed] [Google Scholar]
- 25. Marden JR, Walter S, Tchetgen Tchetgen EJ, et al. Validation of a polygenic risk score for dementia in black and white individuals. Brain Behav. 2014;4(5):687–697. [DOI] [PMC free article] [PubMed] [Google Scholar]
- 26. Thermo Fisher Scientific . UKB_WCSGAX: UK Biobank 500K Samples Genotyping Data Generation by the Affymetrix Research Services Laboratory. 2017. https://biobank.ctsu.ox.ac.uk/crystal/crystal/docs/affy_data_generation2017.pdf. Accessed September 1, 2018.
- 27. Thermo Fisher Scientific . UKB_WCSGAX: UK Biobank 500K Samples Processing by the Affymetrix Research Services Laboratory. 2017. https://biobank.ctsu.ox.ac.uk/crystal/crystal/docs/affy_lab_process2017.pdf. Accessed September 1, 2018.
- 28. Bycroft C, Freeman C, Petkova D, et al. Genome-wide genetic data on ~500,000 UK biobank participants [preprint]. bioRxiv. 2017. (doi: 10.1101/166298). Accessed August, 8, 2018. [DOI] [Google Scholar]
- 29. Filshtein TJ, Brenowitz WD, Mayeda ER, et al. Reserve and Alzheimer’s disease genetic risk: effects on hospitalization and mortality. Alzheimers Dement. 2019;15(7):907–916. [DOI] [PMC free article] [PubMed] [Google Scholar]
- 30. Kunkle BW, Grenier-Boley B, Sims R, et al. Genetic meta-analysis of diagnosed Alzheimer’s disease identifies new risk loci and implicates Aβ, tau, immunity and lipid processing. Nat Genet. 2019;51(3):414–430. [DOI] [PMC free article] [PubMed] [Google Scholar]
- 31. Lyall DM, Cullen B, Allerhand M, et al. Cognitive test scores in UK Biobank: data reduction in 480,416 participants and longitudinal stability in 20,346 participants. PLoS One. 2016;11(4):e0154222. [DOI] [PMC free article] [PubMed] [Google Scholar]
- 32. UK Biobank . Touch-screen test of reaction time (Snap), Version 1.1. 2015. https://biobank.ndph.ox.ac.uk/showcase/showcase/docs/Snap.pdf. Accessed December 15, 2020.
- 33. Rees JMB, Wood AM, Burgess S. Extending the MR-Egger method for multivariable Mendelian randomization to correct for both measured and unmeasured pleiotropy. Stat Med. 2017;36(29):4705–4718. [DOI] [PMC free article] [PubMed] [Google Scholar]
- 34. Fry A, Littlejohns TJ, Sudlow C, et al. Comparison of sociodemographic and health-related characteristics of UK Biobank participants with those of the general population. Am J Epidemiol. 2017;186(9):1026–1034. [DOI] [PMC free article] [PubMed] [Google Scholar]
- 35. Little RJA, Rubin DB. Statistical Analysis With Missing Data. New York, NY: Wiley; 1987. [Google Scholar]
- 36. Haneuse S, Schildcrout J, Crane P, et al. Adjustment for selection bias in observational studies with application to the analysis of autopsy data. Neuroepidemiology. 2009;32(3):229–239. [DOI] [PMC free article] [PubMed] [Google Scholar]
- 37. Efron B, Tibshirani R. An Introduction to the Bootstrap. New York: Chapman & Hall; 1994. [Google Scholar]
- 38. Chang C-CH, Zhao Y, Lee C-W, et al. Smoking, death, and Alzheimer’s disease: a case of competing risks. Alzheimer Dis Assoc Disord. 2012;26(4):300–306. [DOI] [PMC free article] [PubMed] [Google Scholar]
- 39. Hernán MA, Alonso A, Logroscino G. Cigarette smoking and dementia: potential selection bias in the elderly. Epidemiology. 2008;19(3):448–450. [DOI] [PubMed] [Google Scholar]
- 40. Besser LM, Gill DP, Monsell SE, et al. Body mass index, weight change, and clinical progression in mild cognitive impairment and Alzheimer disease. Alzheimer Dis Assoc Disord. 2014;28(1):36–43. [DOI] [PMC free article] [PubMed] [Google Scholar]
- 41. Alosco ML, Duskin J, Besser LM, et al. Modeling the relationships among late-life body mass index, cerebrovascular disease, and Alzheimer’s disease neuropathology in an autopsy sample of 1,421 subjects from the National Alzheimer’s Coordinating Center data set. J Alzheimers Dis. 2017;57(3):953–968. [DOI] [PMC free article] [PubMed] [Google Scholar]
- 42. Kivimäki M, Luukkonen R, Batty GD, et al. Body mass index and risk of dementia: analysis of individual-level data from 1.3 million individuals. Alzheimers Dement. 2018;14(5):601–609. [DOI] [PMC free article] [PubMed] [Google Scholar]
- 43. Qizilbash N, Gregson J, Johnson ME, et al. BMI and risk of dementia in two million people over two decades: a retrospective cohort study. Lancet Diabetes Endocrinol. 2015;3(6):431–436. [DOI] [PubMed] [Google Scholar]
- 44. Lawlor DA, Tilling K, Davey Smith G. Triangulation in aetiological epidemiology. Int J Epidemiol. 2016;45(6):1866–1886. [DOI] [PMC free article] [PubMed] [Google Scholar]
- 45. Sando SB, Melquist S, Cannon A, et al. APOE epsilon 4 lowers age at onset and is a high risk factor for Alzheimer’s disease; a case control study from Central Norway. BMC Neurol. 2008;8:9. [DOI] [PMC free article] [PubMed] [Google Scholar]
- 46. Lahoz C, Schaefer EJ, Cupples LA, et al. Apolipoprotein E genotype and cardiovascular disease in the Framingham heart study. Atherosclerosis. 2001;154(3):529–537. [DOI] [PubMed] [Google Scholar]
- 47. Beecham GW, Hamilton K, Naj AC, et al. Genome-wide association meta-analysis of neuropathologic features of Alzheimer’s disease and related dementias. PLoS Genet. 2014;10(9):e1004606. [DOI] [PMC free article] [PubMed] [Google Scholar]
- 48. Chornenkyy Y, Wang W-X, Wei A, et al. Alzheimer’s disease and type 2 diabetes mellitus are distinct diseases with potential overlapping metabolic dysfunction upstream of observed cognitive decline. Brain Pathol. 2019;29(1):3–17. [DOI] [PMC free article] [PubMed] [Google Scholar]
- 49. Kulminski AM, Culminskaya I, Ukraintseva SV, et al. Trade-off in the effects of the apolipoprotein E polymorphism on the ages at onset of CVD and cancer influences human lifespan. Aging Cell. 2011;10(3):533–541. [DOI] [PMC free article] [PubMed] [Google Scholar]
- 50. Baloyannis SJ, Mavroudis I, Mitilineos D, et al. The hypothalamus in Alzheimer’s disease: a Golgi and electron microscope study. Am J Alzheimers Dis Other Demen. 2015;30(5):478–487. [DOI] [PMC free article] [PubMed] [Google Scholar]
Associated Data
This section collects any data citations, data availability statements, or supplementary materials included in this article.