

Abstract
The magnitude, timing, and etiology of morbidity associated with tropical cyclones remains incompletely quantified. We examined the relative change in cause-specific emergency department (ED) visits among residents of New York City during and after Hurricane Sandy, a tropical cyclone that affected the northeastern United States in October 2012. We used quasi-Poisson constrained distributed lag models to compare the number of ED visits on and after Hurricane Sandy with all other days, 2005–2014, adjusting for temporal trends. Among residents aged ≥65 years, Hurricane Sandy was associated with a higher rate of ED visits due to injuries and poisoning (relative risk (RR) = 1.19, 95% confidence interval (CI): 1.10, 1.28), respiratory disease (RR = 1.35, 95% CI: 1.21, 1.49), cardiovascular disease (RR = 1.10, 95% CI: 1.02, 1.19), renal disease (RR = 1.44, 95% CI: 1.22, 1.72), and skin and soft tissue infections (RR = 1.20, 95% CI: 1.03, 1.39) in the first week following the storm. Among adults aged 18–64 years, Hurricane Sandy was associated with a higher rate of ED visits for renal disease (RR = 2.15, 95% CI: 1.79, 2.59). Among those aged 0–17 years, the storm was associated with lower rates of ED visits for up to 3 weeks. These results suggest that tropical cyclones might result in increased health-care utilization due to a wide range of causes, particularly among older adults.
Keywords: cyclonic storms, emergency service, hospital, morbidity, New York City
Abbreviations
- CI
confidence interval
- ED
emergency department
- ICD-9
International Classification of Diseases, Ninth Revision
- RR
relative risk
Tropical cyclones are rotating storm systems that form over warm ocean waters and are characterized by strong winds and heavy rainfall (1). These storms—which are referred to as hurricanes when they occur in the Atlantic Ocean and reach a maximum sustained wind speed of at least 119 km per hour—can result in substantial impacts on human health. For example, evidence from public health surveillance systems as well as from epidemiologic studies suggests acute increases in mortality following tropical cyclones, as well as increases in morbidity due to injury (2–5).
Hurricane Sandy was a tropical cyclone that affected the northeastern United States in October 2012 after previously making landfall in both Jamaica and Cuba. Although technically no longer classified as a hurricane when it made landfall for the third time in New Jersey on the evening of October 29, Sandy caused widespread damage to the region. In New York City, Hurricane Sandy’s physical hazards—which included high winds, a record-breaking storm surge, and widespread flooding—resulted in 43 documented deaths as well as substantial damage to homes, hospitals, transportation systems, power stations, wastewater treatment facilities, and other critical infrastructure (6).
While the health impacts of tropical cyclones such as Sandy have been well-documented for mortality and for some specific causes of morbidity, the magnitude, timing, and etiology of morbidity associated with such storms remains incompletely quantified. Prior studies of Hurricane Sandy have considered only one or a few specific causes of morbidity (4, 7–11), associations in the first few days following the storm (12, 13), and/or impacts on adult populations (12, 14, 15), and many have not properly accounted for the potential influence of seasonal or long-term trends in health-care utilization. Here, we examine the relative change in the incidence rate of all-cause and cause-specific emergency department (ED) visits among all individuals living in New York City from 2 days before to 28 days after Hurricane Sandy, adjusting for temporal trends. To provide a more comprehensive assessment of the association between Sandy and emergency health-care utilization, we examined 6 broad categories of disease that we hypothesized could be associated with storm-related hazards and present results stratified by age group.
METHODS
Data sources
We obtained information on all ED visits occurring in the state of New York from the New York State Department of Health Statewide Planning and Research Cooperative System (SPARCS), a comprehensive data reporting system that collects information on hospital admissions and ED visits within the state of New York. SPARCS collects individual-level information on approximately 98% of all hospitalizations in nonfederal acute care facilities regardless of insurance status. We obtained information on all ED visits occurring between 2005 (the earliest year for which ED visit data are available in SPARCS) and 2014 (the most recent year for which we had access to data). We restricted our analysis to ED visits among individuals whose residential zip code corresponded to a zip code tabulation area (ZCTA) at least partially located within New York City.
We aggregated the individual-level records into daily counts of the number of ED visits occurring from any cause, as well as from 6 categories of causes that we hypothesized would be associated with either the environmental hazards arising from Hurricane Sandy (e.g., high winds, flooding) or the impacts of those hazards on infrastructure and access to medical care. We defined these 6 categories using International Classification of Diseases, Ninth Revision (ICD-9), principal/primary diagnosis codes, as follows: injuries and poisoning (ICD-9 codes ≥800), respiratory disease (ICD-9 codes 460–519), cardiovascular disease (ICD-9 codes 390–429), renal disease (ICD-9 codes 580–589), common infectious gastrointestinal disease (ICD-9 codes 001–009, 558.9, 787.0, 787.01, 787.03, 787.4, 787.9, 787.91), and skin and soft tissue infections (ICD-9 codes 35, 376.01, 457.2, 528.5, 566, 607.2, 614.4, 680–682, 684, 686.9, 704.8). The definitions for infectious gastrointestinal disease and skin and soft tissue infections were based on prior literature examining morbidity associated with exposure to untreated wastewater (16). We created daily all-cause and cause-specific time series for each of 3 age groups: 0–17 years, 18–64 years, and 65 years or older.
For descriptive purposes, we obtained daily meteorological observations from LaGuardia International Airport for the time period immediately before, during, and after Hurricane Sandy from the National Oceanic and Atmospheric Administration’s National Centers for Environmental Information (NOAA NCEI) (17).
We obtained approval from the Columbia University Medical Center Institutional Review Board. The requirement for consent was waived due to the deidentified nature of the data.
Statistical analysis
We used distributed lag regression models (18) with a quasi-Poisson distribution to compare the number of ED visits occurring on and around the date of Hurricane Sandy’s closest approach to New York City (October 29, 2012) with the number of ED visits occurring on all other days between 2005 and 2014. For each cause of disease and each age group, we regressed the daily count of ED visits on a daily time series consisting of a binary variable that was equal to 1 on the date of Hurricane Sandy’s closest approach (October 29, 2012) and 0 on all other days. Because ED visit rates could change over time due to a variety of factors other than the storm—such as population growth, changes in the size of the uninsured population, and season- or weekday-dependent variation in ED utilization—we adjusted our models for year, week of year, and day of week with indicator variables. We did not build models for the cardiovascular and renal categories among those aged 0–17 years due to low daily counts.
As a first analysis (hereafter, “4-week analysis”), we used the approach described above to examine the association between Hurricane Sandy and ED visits on the day of the storm’s closest approach and on each of the subsequent 28 days. We constrained the lag function using the “strata” function with breaks at lag days 1, 8, 15, and 22. This placement of breaks imposes the assumption that the association between Hurricane Sandy and ED visits is homogeneous within each of the 4 weeks following the storm but allows the association to be distinct on the day of the storm (lag day 0).
In the second phase of our analysis (hereafter, “10-day analysis”), we relaxed our assumption about the shape of the lag structure to examine the time course of the association between Hurricane Sandy and ED visits in the first week following the storm in more detail. Specifically, we modeled the association between Hurricane Sandy and ED visits on the 2 days before, the day of, and 7 days after the storm’s closest approach using an unconstrained distributed lag structure to avoid imposing assumptions about the shape of the lag structure. We included the 2 days before the storm in this model because we hypothesized that actions taken to prepare for the storm could be associated with changes in health-care utilization. The resulting model included 10 separate terms, one for each day from 2 days before to 7 days after the storm. Hereafter, we refer to this time period as the “peri-storm period”.
Using the results from the 10-day analysis, we calculated the number of excess ED visits attributable to Hurricane Sandy on each lag day using the equation:
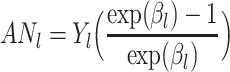 |
where ANl is the number of excess ED visits attributable to the storm on lag day l, Yl is the observed number of ED visits on lag day l, and βl is the coefficient from the unconstrained distributed lag model for lag day l (19). We summed the estimates of the attributable number on each of the 10 days from 2 days before to 7 days after the storm to yield an estimate of the total attributable number over the 10-day lag period (October 27 to November 5, 2012). We calculated a 95% empirical confidence interval for the 10-day total attributable number using Monte Carlo simulations, as previously described (20, 21). We limited the calculation of the 10-day total attributable number to disease categories and age groups for which Hurricane Sandy was associated with higher rates of ED visits on at least 1 day.
In sensitivity analyses, we evaluated the robustness of our results to 2 alternative forms of adjustment for seasonal and long-term temporal trends. First, we repeated our main analysis but used a natural cubic spline with 8 degrees of freedom per year to adjust for time trends instead of indicator variables for year and week of year. Second, we implemented a case-crossover design in which we matched on month and then adjusted for year and day of week using indicator variables in conditional Poisson models with a quasi-Poisson distribution (22). Additionally, for the 4-week analysis, we explored alternative assumptions about shape of the lag function by modeling it with a natural cubic spline with 3 internal knots placed at equally spaced intervals on the log scale.
All analyses were performed using R (R Foundation for Statistical Computing, Vienna, Austria), version 3.6.3 (23).
RESULTS
On October 29, 2012, the date of Hurricane Sandy’s closest approach to New York City, the average wind speed measured over the course of the day at LaGuardia International Airport was 15.7 m/second (approximately 56.5 km/hour), with higher average speeds observed over shorter periods of time. Temperature ranged from a minimum of 12.2 to a maximum of 17.2 °C, and the total amount of rainfall was 13.7 mm. Wind speeds were lower on the 2 days before and 2 days after October 29, and little to no rainfall was observed on those days (Table 1).
Table 1.
Meteorological Characteristics of the 5 Days Centered on the Date of Hurricane Sandy’s Closest Approach to New York City (October 27–31, 2012), as Observed at LaGuardia International Airport
| Date | Rainfall, mm | Average Daily Wind Speed, m/second | Maximum 2-Minute Wind Speed, m/second | Maximum 5-Second Wind Speed, m/second | Minimum Temperature, °C | Maximum Temperature, °C |
|---|---|---|---|---|---|---|
| October 27, 2012 | 0 | 4.2 | 7.6 | 9.4 | 15.0 | 18.3 |
| October 28, 2012 | 0 | 9.6 | 16.5 | 20.1 | 13.3 | 15.6 |
| October 29, 2012 | 13.7 | 15.7 | 28.6 | 33.1 | 12.2 | 17.2 |
| October 30, 2012 | 1 | 8.2 | 13.4 | 19.2 | 8.9 | 15.0 |
| October 31, 2012 | 0 | 4.4 | 6.3 | 7.6 | 7.2 | 12.8 |
Between 2005 and 2014, a total of 34,767,771 all-cause ED visits occurred among individuals living in New York City, or an average of 9,520 ED visits per day. Among the 6 categories of disease considered in this study, the average daily rate of all-ages ED visits ranged from 26 visits per day for renal disease to 1,503 visits per day for injuries and poisoning. For most causes, there were fewer ED visits on October 29, 2012, than on adjacent days (Figure 1).
Figure 1.

Daily emergency department (ED) visits occurring among individuals of all ages in New York City between October 1 and November 30, 2012, by cause. The vertical dotted line is placed on October 29, 2012, the date of Hurricane Sandy’s closest approach to New York City. In order of descending value on October 1, 2012, causes are represented with the following line types: injury and poisoning (dot dash), respiratory (long dash), cardiovascular (short dash), skin and soft tissue infections (dotted line), gastrointestinal (solid line), renal (alternating short and long dash).
All-cause ED visits
We first examined the association between Hurricane Sandy and all-cause ED visits stratified by age group (Figure 2). In the 4-week analysis, Hurricane Sandy was associated with an 11% increase in the rate of ED visits on days during the first week after the storm among those aged 65 or older (relative risk (RR) = 1.11, 95% confidence interval (CI): 1.07, 1.16), with no evidence of an association in subsequent weeks (Figure 2A). Looking more closely at the peri-storm period in the 10-day analysis, we found a lower rate of ED visits on the day of the storm (RR = 0.63, 95% CI: 0.54, 0.72) but higher rates of ED visits 2–5 days after the storm in this age group. We did not observe evidence of an association on either of the 2 days leading up to the storm (Figure 2B).
Figure 2.

Age-group–specific relative risks and 95% confidence intervals for the association between Hurricane Sandy and all-cause emergency department (ED) visits in New York City, 2005–2014. Results are shown from constrained distributed lag models examining associations on the day of and in the 28 days following the storm, assuming associations are homogeneous within each week after the storm (``4-week analysis''), as well as from unconstrained distributed lag models examining associations from 2 days before to 7 days after the storm (``10-day analysis''). The top row shows plots for individuals aged 65 or older: 4-week analysis (A) and 10-day analysis (B). The middle row shows plots for individuals aged 18 to 64 years: 4-week analysis (C) and 10-day analysis (D). The bottom row shows plots for individuals aged 0–17 years: 4-week analysis (E) and 10-day analysis (F). Associations on the 2 days before Hurricane Sandy are plotted in gray. All results were estimated from models comparing the number of ED visits occurring on and around the date of Hurricane Sandy's closest approach to New York City with the number of ED visits occurring on all other days between 2005 and 2014.
Among adults aged 18–64 years, Hurricane Sandy was associated with a lower rate of all-cause ED visits in each of the 4 weeks following the storm (Figure 2C), including markedly lower rates of ED visits on the day of and the day after the storm (Figure 2D) Results were similar but more pronounced for children aged 0–17 years (Figure 2E and 2F).
Cause-specific ED visits
Among individuals aged 65 years or older, Hurricane Sandy was associated with higher rates of ED visits for several specific causes in the first week after the storm: injury and poisoning, respiratory disease, cardiovascular disease, renal disease, and skin and soft tissue infections (Table 2). The associations were most pronounced for renal (RR = 1.44, 95% CI: 1.22, 1.72) and respiratory (RR = 1.35, 95% CI: 1.21, 1.49) disease and least pronounced for cardiovascular disease (RR = 1.10, 95% CI: 1.02, 1.19). Focusing on the peri-storm period, in the 10-day analysis Hurricane Sandy was associated with higher rates of ED visits on multiple days after the storm for injury and poisoning (lag days 2 through 4), respiratory disease (lag days 1 through 3), and renal disease (lag days 2 and 4) (Figure 3, and in tabular form in Web Table 1, available at https://doi.org/10.1093/aje/kwab127). Hurricane Sandy was associated with ED visits due to cardiovascular disease and skin and soft tissue infections on single days (lag days 3 and 4, respectively). Cardiovascular disease associations were also elevated on lag days 2, 5, and 6, but with the lower bound of the confidence interval at or just below 1. With the exception of respiratory disease, we did not observe evidence of higher rates of ED visits in the 2 days before the storm.
Table 2.
Relative Risks for the Association Between Hurricane Sandy and Emergency Department Visits According to Age Group on the Date of the Storm’s Closest Approach and in the 28 Days Afterwarda in New York City, 2005–2014
| Cause and Age Group, years | Mean No. of Daily ED Visits | Day 0 | Days 1–7 | Days 8–14 | Days 15–21 | Days 22–28 | |||||
|---|---|---|---|---|---|---|---|---|---|---|---|
| RR | 95% CI | RR | 95% CI | RR | 95% CI | RR | 95% CI | RR | 95% CI | ||
| Injuries/poisoning | |||||||||||
| 0–17 | 426.5 | 0.33 | 0.23, 0.48 | 0.67 | 0.61, 0.75 | 0.79 | 0.71, 0.87 | 0.98 | 0.90, 1.07 | 0.91 | 0.83, 1.00 |
| 18–64 | 922.5 | 0.58 | 0.48, 0.69 | 0.92 | 0.87, 0.97 | 1.00 | 0.95, 1.06 | 0.99 | 0.94, 1.04 | 0.96 | 0.90, 1.01 |
| ≥65 | 153.6 | 0.55 | 0.42, 0.72 | 1.19 | 1.10, 1.28 | 1.07 | 0.99, 1.16 | 1.07 | 0.99, 1.16 | 0.97 | 0.90, 1.06 |
| Respiratory | |||||||||||
| 0–17 | 489.0 | 0.46 | 0.28, 0.75 | 0.80 | 0.69, 0.93 | 0.62 | 0.53, 0.74 | 0.76 | 0.65, 0.88 | 0.88 | 0.76, 1.01 |
| 18–64 | 507.8 | 0.60 | 0.41, 0.86 | 1.06 | 0.95, 1.19 | 0.96 | 0.85, 1.08 | 0.95 | 0.84, 1.07 | 1.01 | 0.90, 1.14 |
| ≥65 | 122.6 | 0.82 | 0.60, 1.12 | 1.35 | 1.21, 1.49 | 1.02 | 0.91, 1.15 | 0.97 | 0.86, 1.10 | 1.00 | 0.89, 1.13 |
| Cardiovascularb | |||||||||||
| 0–17 | 1.8 | ||||||||||
| 18–64 | 129.8 | 0.66 | 0.52, 0.84 | 1.05 | 0.97, 1.13 | 0.92 | 0.85, 1.00 | 0.98 | 0.90, 1.06 | 0.94 | 0.86, 1.02 |
| ≥65 | 135.4 | 0.69 | 0.55, 0.87 | 1.10 | 1.02, 1.19 | 0.92 | 0.85, 1.00 | 1.00 | 0.92, 1.08 | 0.99 | 0.91, 1.07 |
| Renalb | |||||||||||
| 0–17 | 0.7 | ||||||||||
| 18–64 | 9.4 | 0.43 | 0.17, 1.10 | 2.15 | 1.79, 2.59 | 1.15 | 0.90, 1.47 | 1.10 | 0.86, 1.41 | 0.83 | 0.63, 1.10 |
| ≥65 | 15.4 | 0.78 | 0.45, 1.36 | 1.44 | 1.22, 1.72 | 1.12 | 0.92, 1.36 | 1.04 | 0.85, 1.27 | 1.03 | 0.83, 1.26 |
| Gastrointestinal | |||||||||||
| 0–17 | 132.1 | 0.33 | 0.16, 0.67 | 0.75 | 0.62, 0.90 | 0.71 | 0.59, 0.85 | 0.80 | 0.68, 0.94 | 0.89 | 0.76, 1.03 |
| 18–64 | 123.1 | 0.59 | 0.40, 0.85 | 0.94 | 0.84, 1.06 | 0.89 | 0.79, 1.00 | 0.93 | 0.83, 1.04 | 0.96 | 0.87, 1.08 |
| ≥65 | 25.5 | 0.77 | 0.48, 1.24 | 0.90 | 0.76, 1.08 | 0.93 | 0.79, 1.11 | 0.95 | 0.80, 1.13 | 1.05 | 0.90, 1.24 |
| Skin/soft tissue infections | |||||||||||
| 0–17 | 31.3 | 0.38 | 0.21, 0.66 | 0.86 | 0.74, 1.01 | 0.73 | 0.61, 0.87 | 0.84 | 0.71, 0.99 | 0.87 | 0.74, 1.04 |
| 18–64 | 131.1 | 0.45 | 0.34, 0.59 | 0.88 | 0.81, 0.95 | 0.95 | 0.88, 1.02 | 0.97 | 0.89, 1.05 | 0.99 | 0.91, 1.07 |
| ≥65 | 22.1 | 0.83 | 0.54, 1.27 | 1.20 | 1.03, 1.39 | 1.02 | 0.86, 1.19 | 0.99 | 0.84, 1.17 | 0.92 | 0.77, 1.09 |
| All-cause | |||||||||||
| 0–17 | 2,263.8 | 0.41 | 0.30, 0.56 | 0.77 | 0.70, 0.84 | 0.73 | 0.66, 0.80 | 0.84 | 0.77, 0.92 | 0.86 | 0.79, 0.94 |
| 18–64 | 5,972.5 | 0.58 | 0.52, 0.65 | 0.96 | 0.92, 0.99 | 0.93 | 0.89, 0.96 | 0.96 | 0.92, 0.99 | 0.94 | 0.91, 0.98 |
| ≥65 | 1,283.8 | 0.62 | 0.54, 0.72 | 1.11 | 1.07, 1.16 | 0.99 | 0.95, 1.04 | 1.01 | 0.96, 1.05 | 0.99 | 0.94, 1.03 |
Abbreviations: CI, confidence interval; ED, emergency department; RR, relative risk.
a The associations presented here were estimated from constrained distributed lag regression models comparing the number of ED visits occurring on and around the date of Hurricane Sandy’s closest approach to New York City with the number of ED visits occurring on all other days between 2005 and 2014. These models assume that the association between Hurricane Sandy and ED visits is homogeneous within each week after the storm (days 1–7, 8–14, 15–21, and 22–28).
b Models for cardiovascular and renal disease among those aged 0–17 years were not constructed due to low daily counts.
Figure 3.

Relative risks and 95% confidence intervals for the association between Hurricane Sandy and cause-specific emergency department (ED) visits among those aged 65 or older in New York City, 2005–2014, from 2 days before to 7 days after the storm. Plots are shown for injury and poisoning (A), respiratory disease (B), cardiovascular disease (C), renal disease (D), gastrointestinal disease (E), and skin and soft tissue infections (F). Note that ED visits due to renal disease (D) are presented with a larger range of values on the y-axis than the other causes. Associations on the 2 days before Hurricane Sandy are plotted in gray. The associations presented here were estimated from unconstrained distributed lag regression models comparing the number of ED visits occurring on and around the date of Hurricane Sandy’s closest approach to New York City with the number of ED visits occurring on all other days between 2005 and 2014.
Among adults aged 18–64 years, Hurricane Sandy was associated with higher rates of ED visits for renal disease in the first week after the storm (RR = 2.15, 95% CI: 1.79, 2.59) but not with other causes (Table 2). Higher rates of ED visits for renal disease were evident 1–4 days after the storm, with the peak association occurring on lag day 2 (RR = 3.52, 95% CI: 2.50, 4.95) (Web Table 1). Among children aged 0–17 years, Hurricane Sandy was associated with fewer cause-specific ED visits on the day of the storm, in the days after the storm, and up to the second or third week after the storm (Table 2 and Web Table 1).
Sensitivity analyses
Results from sensitivity analyses examining alternative forms of adjustment for temporal trends were similar to results from the main analysis for both the 4-week (Web Tables 2–4) and the 10-day (Web Figures 1–3) models. Results from the sensitivity analysis in which the lag function for the 4-week model was constrained using a natural cubic spline were also generally similar to the main analysis. For example, associations between Hurricane Sandy and higher rates of ED visits among adults aged 65 or older were largely limited to the first week following the storm in both the main analysis and the sensitivity analysis (Web Figure 4).
Attributable number
We estimate that among those aged 65 years or older, Hurricane Sandy was associated with 660 (95% empirical CI: 74, 1,187) excess all-cause ED visits over the 10-day time period from 2 days before to 7 days after the storm, with a large number due to respiratory disease (294 excess ED visits, 95% empirical CI: 176, 383) (Table 3).
Table 3.
Number of Excess Emergency Department Visits Among Those Aged 65 Years or Older Attributable to Hurricane Sandy During the 10-Day Period From 2 Days Before to 7 Days After the Storma in New York City
| Cause | Attributable Number | 95% Empirical CI |
|---|---|---|
| Injuries and poisoning | 148 | 15, 256 |
| Respiratory disease | 294 | 176, 383 |
| Cardiovascular disease | 40 | −72, 132 |
| Renal disease | 54 | 18, 76 |
| Skin and soft tissue infections | 30 | −12, 56 |
| All-cause | 660 | 74, 1,187 |
Abbreviation: CI, confidence interval.
a The attributable numbers presented here were calculated from distributed lag regression models comparing the number of ED visits occurring on and around the date of Hurricane Sandy’s closest approach to New York City with the number of ED visits occurring on all other days between 2005 and 2014. Results are shown for causes of disease that were associated with higher rates of ED visits on at least 1 day during the 10-day window from 2 days before to 7 days after the storm.
DISCUSSION
In this comprehensive analysis of ED visits among residents of New York City between 2005 and 2014, we found that Hurricane Sandy had a profound impact on rates of health-care utilization. Specifically, we found that Hurricane Sandy was associated with lower rates of all-cause and cause-specific ED visits on the day of the storm and associated with changes in ED visit rates on the days and weeks following the storm with varying direction, magnitude, and timing by age group and cause. Among residents aged 65 or older, Hurricane Sandy was associated with higher rates of all-cause ED visits in the first week following the storm, as well as with ED visits due to several specific causes. In contrast, among adults aged 18–64 years Hurricane Sandy was associated only with higher rates of ED visits for renal diseases, and lower rates of ED visits were observed for children 0–17 years following the storm. For the most part, we did not find evidence of a change in the rate of ED visits in the 2 days leading up to Hurricane Sandy.
Several prior studies have estimated the impact of Hurricane Sandy on measures of emergency health-care utilization using different methods. Lee et al. (12) compared the number of all-cause ED visits occurring on and in the days after Hurricane Sandy with a baseline ED visit rate computed from all days in 2012 prior to the storm. Results from this analysis, which included adults aged 18 or older living in New York City, suggest a decline in all-cause ED visits on the day of the storm, followed by higher ED visit rates on each of the 4 days following the storm (12). While we examined finer strata of age, the direction and timing of these results are largely consistent with our all-cause findings for individuals aged 65 or older. In another study, Kim et al. (24) calculated prevalence ratios comparing all-ages ED visits that occurred during and after Hurricane Sandy with ED visits that occurred in the month before the storm in Nassau and Suffolk counties, which are located to the east of New York City. In this study, ED visits due to physical health conditions were higher in the 3 days following the storm (October 30 to November 1, prevalence ratio = 1.01, 95% CI: 1.01, 1.02) as well as during the remainder of November 2012 (prevalence ratio = 1.004: 95% CI: 1.001, 1.01), but not on the day of the storm itself (October 29, prevalence ratio = 1.01, 95% CI: 0.995, 1.02) (24). In contrast, we found that Hurricane Sandy was associated with lower ED visits on the day of the storm, and we did not find evidence of higher all-cause ED visit rates beyond the first week after the storm in any age group.
A potentially important difference between our study and the 2 analyses described above is consideration of time trends. Both of these prior studies, as well as others examining the health impacts of Hurricane Sandy (4, 13), compared the rate of adverse events (e.g., ED visits, hospitalizations) that occurred during and after the storm with the rate of adverse events that occurred during a baseline time period. However, seasonal or longer-term time trends in the daily event rate could result in biased estimates. In contrast, we constructed regression models adjusted for year, week of year, and day of week, diminishing the possibility that our findings are influenced by time trends.
In addition to the adjustment for time trends, another strength and novel feature of our analysis was the examination of multiple categories of cause-specific ED visits. We found that Hurricane Sandy was associated with higher rates of ED visits due to injury and poisoning, respiratory disease, cardiovascular disease, renal disease, and skin and soft tissue infections among those aged 65 or older during the first week following the storm. These results add further support to the hypothesis that tropical cyclones affect health through multiple pathways, which could include exposure to the storm’s physical hazards (e.g., high winds, flood waters), psychosocial stress, lack of access to routine medical care and medications, and exposure to hazards present after the storm (e.g., mold growth due to flooding) (25, 26). While differences in methods make it difficult to directly compare results across studies, previous analyses of Hurricane Sandy have documented associations with a range of cause-specific outcomes, including all-ages admissions to a trauma center (4), all-ages ED visits due to respiratory disease (24), hospital admissions for respiratory disease among the predominantly older population of Medicare beneficiaries (27), ED visits for chronic obstructive pulmonary disease in adults (12), all-ages hospital admissions for myocardial infarction (7), and both ED visits and hospital admissions among individuals with end-stage renal disease (8). Studies examining hurricanes other than Sandy have also documented associations with several causes of noninjury morbidity, including cardiovascular disease (28) as well as both respiratory disease generally (29) and asthma specifically (3). We are not aware of other studies documenting an association between Hurricane Sandy and health-care utilization due to skin and soft tissue infections, although such infections have been reported in the wake of other hurricanes and other hydrologic disasters such as floods (30).
Among adults aged 18–64 years, Hurricane Sandy was associated with a somewhat lower rate of all-cause ED visits in the weeks following the storm. We hypothesize that altered activity patterns as well as evacuation out of New York state following the storm could contribute to these lower rates. However, in contrast to our results for all-cause ED visits in this age group, Hurricane Sandy was associated with a higher rate of renal ED visits in the first week following the storm (RR = 2.15, 95% CI: 1.79, 2.59). One factor that might have contributed to this finding is disrupted access to dialysis care (31). Lending further support to this hypothesis, Kelman et al. (8) found that end-stage renal disease patients who lived in an area affected by Hurricane Sandy were more likely to visit the ED and more likely to become hospitalized in the week after the storm than either patients who lived in unaffected areas or patients who lived in affected areas a year before the storm.
Among children aged 0–17 years, Hurricane Sandy was associated with lower rates of ED visits for several weeks following the storm. Other studies examining ED visits specifically among children have documented mixed results. At a children’s hospital in Florida, ED visits were higher in the week after Hurricane Andrew than in the week before the storm (32). However, in a study of 2 Florida EDs, visits among children were lower in the days after Hurricane Jeanne when compared with a baseline time period in the prior year (5). Notably, neither of these studies included adjustment for time trends. We hypothesize that the lower rates in our study could be due in part to altered activity patterns among children, given that many New York City schools were closed the week after Hurricane Sandy (6).
In addition to adjusting for time trends, other strengths of our study include the detailed characterization of the time course of the association between Hurricane Sandy and ED visits at up to 4 weeks following the storm and the examination of associations stratified by age group. However, our study also has several limitations. First, our results might be sensitive to different choices about the form of the adjustment for seasonal and long-term time trends. However, we found that our results were not materially different in sensitivity analyses using alternative modeling approaches. Second, we have no information about how the storm affected the population at risk (i.e., risk pool) in the city. For example, if a large number of residents evacuated New York City before the storm, our results might underestimate the true association between Hurricane Sandy and higher ED visit rates. Third, we are not able to determine the extent to which altered access to other sources of care (e.g., urgent care centers, primary care) during or after the storm might have contributed to the increased rate of ED visits we observed among some age groups and for some causes. Additional research examining the role of population movement, access to medical care, and altered activity patterns would lend context both to our findings and to the larger body of work on tropical cyclones and health. Finally, our results might not be generalizable to other communities or to other storms.
In summary, we found that Hurricane Sandy was associated with higher rates of ED visits due to a number of specific causes, predominately among those aged 65 or older and in the first week after the storm. These results add to a growing body of literature on the health impacts of tropical cyclones beyond mortality and morbidity due to injury. If our results are causal, they might be useful to public health professionals and physicians in identifying individuals who are more likely to require emergency medical care during such storms.
Supplementary Material
ACKNOWLEDGMENTS
Author affiliations: Division of Occupational and Environmental Health, School of Population and Public Health, University of British Columbia, Vancouver, British Columbia, Canada (Kate R. Weinberger); Department of Epidemiology, Brown University School of Public Health, Providence, Rhode Island, United States (Kate R. Weinberger, Erin R. Kulick, Shengzhi Sun, Gregory A. Wellenius); Department of Epidemiology and Biostatistics, Temple University College of Public Health, Philadelphia, Pennsylvania, United States (Erin R. Kulick); Department of Neurology, Vagelos College of Physicians and Surgeons, Columbia University, New York, New York, United States (Amelia K. Boehme); Department of Epidemiology, Mailman School of Public Health, Columbia University, New York, New York, United States (Amelia K. Boehme); Department of Environmental Health, Boston University School of Public Health, Boston, Massachusetts, United States (Shengzhi Sun, Gregory A. Wellenius); and Department of Biostatistics, Harvard T. H. Chan School of Public Health, Boston, Massachusetts, United States (Francesca Dominici).
This work was supported by the National Institutes of Health (grants F32-ES027742 (K.R.W.), T32-HL134625 (E.R.K.), R01-ES029950 (G.A.W., F.D.), R01-MD012769 (F.D.), R01-ES028033 (F.D.), and R01-AG066793 (F.D.)) and by a grant from the Climate Change Solutions Fund, Office of the Vice Provost for Research, Harvard University (F.D.).
Data availability statement: The ED visit data used in this analysis may be obtained by making a request to the New York State Department of Health.
Conflict of interest statement: G.A.W. has received consulting fees from the Health Effects Institute (Boston, Massachusetts) and recently served as a paid visiting scientist at Google Research (Mountain View, California). The other authors report no conflicts.
REFERENCES
- 1. National Oceanic and Atmospheric Administration . Tropical cyclone climatology. https://www.nhc.noaa.gov/climo/#overview. Accessed May 13, 2020.
- 2. Shultz JM, Russell J, Espinel Z. Epidemiology of tropical cyclones: the dynamics of disaster, disease, and development. Epidemiol Rev. 2005;27(1):21–35. [DOI] [PubMed] [Google Scholar]
- 3. Hendrickson LA, Vogt RL, Goebert D, et al. Morbidity on Kauai before and after Hurricane Iniki. Prev Med. 1997;26(5 Pt 1):711–716. [DOI] [PubMed] [Google Scholar]
- 4. Curran T, Bogdanovski DA, Hicks AS, et al. The effects of Hurricane Sandy on trauma center admissions. Eur J Trauma Emerg Surg. 2018;44(1):137–141. [DOI] [PubMed] [Google Scholar]
- 5. Platz E, Cooper HP, Silvestri S, et al. The impact of a series of hurricanes on the visits to two Central Florida emergency departments. J Emerg Med. 2007;33(1):39–46. [DOI] [PubMed] [Google Scholar]
- 6. City of New York . A Stronger, More Resilient New York. 2013. https://www1.nyc.gov/site/sirr/report/report.page. Accessed April 18, 2021.
- 7. Swerdel JN, Janevic TM, Cosgrove NM, et al. The effect of Hurricane Sandy on cardiovascular events in New Jersey. J Am Heart Assoc. 2014;3(6):e001354. [DOI] [PMC free article] [PubMed] [Google Scholar]
- 8. Kelman J, Finne K, Bogdanov A, et al. Dialysis care and death following Hurricane Sandy. Am J Kidney Dis. 2015;65(1):109–115. [DOI] [PubMed] [Google Scholar]
- 9. He FT, Lundy de la Cruz N, Olson D, et al. Temporal and spatial patterns in utilization of mental health services during and after Hurricane Sandy: emergency department and inpatient hospitalizations in New York City. Disaster Med Public Health Prep. 2016;10(3):512–517. [DOI] [PubMed] [Google Scholar]
- 10. Swerdel JN, Rhoads GG, Cosgrove NM, et al. Rates of hospitalization for dehydration following Hurricane Sandy in New Jersey. Disaster Med Public Health Prep. 2016;10(2):188–192. [DOI] [PubMed] [Google Scholar]
- 11. Licciardi K, Bodic M, Taub A, et al. Rising to the challenge: the response to Hurricane Sandy in a psychiatric emergency room. J Psychiatr Pract. 2016;22(2):141–148. [DOI] [PubMed] [Google Scholar]
- 12. Lee DC, Smith SW, Carr BG, et al. Geographic distribution of disaster-specific emergency department use after Hurricane Sandy in New York City. Disaster Med Public Health Prep. 2016;10(3):351–361. [DOI] [PMC free article] [PubMed] [Google Scholar]
- 13. Greenstein J, Chacko J, Ardolic B, et al. Impact of Hurricane Sandy on the Staten Island University Hospital Emergency Department. Prehosp Disaster Med. 2016;31(3):335–339. [DOI] [PubMed] [Google Scholar]
- 14. Gotanda H, Fogel J, Husk G, et al. Hurricane Sandy: impact on emergency department and hospital utilization by older adults in lower Manhattan, New York (USA). Prehosp Disaster Med. 2015;30(5):496–502. [DOI] [PubMed] [Google Scholar]
- 15. McQuade L, Merriman B, Lyford M, et al. Emergency department and inpatient health care services utilization by the elderly population: Hurricane Sandy in the state of New Jersey. Disaster Med Public Health Prep. 2018;12(6):730–738. [DOI] [PubMed] [Google Scholar]
- 16. Brokamp C, Beck AF, Muglia L, et al. Combined sewer overflow events and childhood emergency department visits: a case-crossover study. Sci Total Environ. 2017;607-608:1180–1187. [DOI] [PMC free article] [PubMed] [Google Scholar]
- 17. National Centers for Environmental Information . Global Historical Climate Network daily. https://www.ncdc.noaa.gov/ghcn-daily-description. Accessed April 22, 2020.
- 18. Gasparrini A. Distributed lag linear and non-linear models in R: the package dlnm. J Stat Softw. 2011;43(8):1–20. [PMC free article] [PubMed] [Google Scholar]
- 19. Steenland K, Armstrong B. An overview of methods for calculating the burden of disease due to specific risk factors. Epidemiology. 2006;17(5):512–519. [DOI] [PubMed] [Google Scholar]
- 20. Gasparrini A, Leone M. Attributable risk from distributed lag models. BMC Med Res Methodol. 2014;14(1):55. [DOI] [PMC free article] [PubMed] [Google Scholar]
- 21. Yan M, Wilson A, Peel JL, et al. Community-wide mortality rates in Beijing, China, during the July 2012 flood compared with unexposed periods. Epidemiology. 2020;31(3):319–326. [DOI] [PMC free article] [PubMed] [Google Scholar]
- 22. Armstrong BG, Gasparrini A, Tobias A. Conditional Poisson models: a flexible alternative to conditional logistic case cross-over analysis. BMC Med Res Methodol. 2014;14(1):122. [DOI] [PMC free article] [PubMed] [Google Scholar]
- 23. R Core Team . R: A Language and Environment for Statistical Computing. Vienna, Austria: R Foundation for Statistical Computing; 2019. [Google Scholar]
- 24. Kim H, Schwartz RM, Hirsch J, et al. Effect of hurricane Sandy on Long Island emergency departments visits. Disaster Med Public Health Prep. 2016;10(3):344–350. [DOI] [PubMed] [Google Scholar]
- 25. Ryan B, Franklin RC, Burkle FM Jr, et al. Identifying and describing the impact of cyclone, storm and flood related disasters on treatment management, care and exacerbations of non-communicable diseases and the implications for public health. PLoS Currents Disasters. 2015. (doi: 10.1371/currents.dis.62e9286d152de04799644dcca47d9288). [DOI] [PMC free article] [PubMed] [Google Scholar]
- 26. Bell JE, Herring SC, Jantarasami L, et al. 4: Extreme events. In: Crimmins A, Balbus J, Gamble JL, eds. The Impacts of Climate Change on Human Health in the United States: A Scientific Assessment. Washington, DC: U.S. Global Change Research Program, 2016:99–128. [Google Scholar]
- 27. Mongin SJ, Baron SL, Schwartz RM, et al. Measuring the impact of disasters using publicly available data: application to Hurricane Sandy (2012). Am J Epidemiol. 2017;186(11):1290–1299. [DOI] [PubMed] [Google Scholar]
- 28. Becquart NA, Naumova EN, Singh G, et al. Cardiovascular disease hospitalizations in Louisiana parishes' elderly before, during and after Hurricane Katrina. Int J Environ Res Public Health. 2018;16(1):74. [DOI] [PMC free article] [PubMed] [Google Scholar]
- 29. Heslin KC, Barrett ML, Hensche M, et al. Effects of hurricanes on emergency department utilization: an analysis across 7 US storms [published online ahead of print October 7, 2020]. Disaster Med Public Health Prep. (doi: 10.1017/dmp.2020.281). [DOI] [PMC free article] [PubMed] [Google Scholar]
- 30. Liang SY, Messenger N. Infectious diseases after hydrologic disasters. Emerg Med Clin North Am. 2018;36(4):835–851. [DOI] [PMC free article] [PubMed] [Google Scholar]
- 31. Lempert KD, Kopp JB. Hurricane Sandy as a kidney failure disaster. Am J Kidney Dis. 2013;61(6):865–868. [DOI] [PMC free article] [PubMed] [Google Scholar]
- 32. Quinn B, Baker R, Pratt J. Hurricane Andrew and a pediatric emergency department. Ann Emerg Med. 1994;23(4):737–741. [DOI] [PubMed] [Google Scholar]
Associated Data
This section collects any data citations, data availability statements, or supplementary materials included in this article.