

Abstract
Artificial intelligence (AI) has illuminated a clear path towards an evolving health-care system replete with enhanced precision and computing capabilities. Medical imaging analysis can be strengthened by machine learning as the multidimensional data generated by imaging naturally lends itself to hierarchical classification. In this Review, we describe the role of machine intelligence in image-based endocrine cancer diagnostics. We first provide a brief overview of AI and consider its intuitive incorporation into the clinical workflow. We then discuss how AI can be applied for the characterization of adrenal, pancreatic, pituitary and thyroid masses in order to support clinicians in their diagnostic interpretations. This Review also puts forth a number of key evaluation criteria for machine learning in medicine that physicians can use in their appraisals of these algorithms. We identify mitigation strategies to address ongoing challenges around data availability and model interpretability in the context of endocrine cancer diagnosis. Finally, we delve into frontiers in systems integration for AI, discussing automated pipelines and evolving computing platforms that leverage distributed, decentralized and quantum techniques.
Subject terms: Endocrine cancer, Diagnosis
This Review explains core concepts in artificial intelligence (AI) and machine learning for endocrinologists. AI applications in endocrine cancer diagnostics are highlighted as well as research challenges and future directions for the field.
Key points
Developments in machine intelligence have been made possible by the increase in data ubiquity and computing power and have the potential to enhance image segmentation, analysis and workflow in non-invasive endocrine cancer diagnostics.
Improved adherence to consensus reporting standards and evaluation criteria in artificial intelligence (AI) for medical image analysis is urgently needed in the field of endocrine cancer diagnostics as this will enable meaningful cross-study comparison.
A centralized inventory to track diagnostic algorithms in oncologic endocrinology that are in active clinical use would improve performance auditing and algorithm stewardship.
The looming risk of excessive intervention in endocrine cancers can be addressed with the improved detection facilitated by AI, possibly via correlation with prognostic data for improved risk stratification.
Poor data availability continues to stymie the development of robust machine learning applications, particularly in rare endocrine cancers; solutions to this problem might include database curation, pre-training techniques and workflow automation.
Other breakthroughs in machine intelligence will come with the exploration of alternative computing frameworks, such as decentralized, distributed and quantum networks, that might enhance model training and efficiency.
Introduction
Artificial intelligence (AI) refers to any non-living entity that executes tasks typically requiring human intelligence1. Endocrinology stands to benefit greatly from the rise of AI, particularly in the realm of cancer diagnostics, where AI has the potential to facilitate enhanced diagnostic precision and improved workflows. Medical images are a mainstay of tumour diagnostics and they also serve as a reservoir of mineable pixel data that naturally lends itself to machine-based classification2,3. Computer vision (Box 1) applications are already leveraging this property to power robust diagnostic interpretations of endocrine neoplasms4–7. Although tissue pathology remains the gold standard in the diagnosis of many endocrine tumours, the macroscopic characterization of tissue in imaging studies can augment histological findings. Indeed, in some cases, a biopsy sample might not always reflect the intratumoural heterogeneity across genomic subclones8,9. Additionally, a biopsy is invasive and is subject to sampling error that can render it inconclusive. Computer vision can be leveraged in support of histological findings by inferring diagnosis from the structural heterogeneity observed within tumours on medical imaging3. Furthermore, given the high frequency with which medical imaging is performed in cancer management, archives of longitudinal medical imaging data can be used by computer vision applications to better characterize disease, predict progression at the time of diagnosis and monitor response to treatment2.
The correlation of AI-driven image analytics with other omics data and clinical expertise can also be used to enable integrative approaches to care10,11 (Fig. 1). Indeed, studies demonstrate that the mapping of genomics or pathomics (image features are extracted from pathology studies) data with radiomics (image features are extracted from radiology studies) data from medical imaging can illuminate conserved trends at different levels of human physiology, with implications for diagnosis and prognosis12–14. Furthermore, advances in machine intelligence have the potential to enable non-invasive endocrine cancer diagnostics that could preclude or limit the use of invasive biopsy15. Looking ahead, it will be important for both endocrinologists and radiologists to cultivate a working understanding of the utility and limitations of AI if the benefits of these technologies are to be realized.
Fig. 1. Integrative diagnostics.
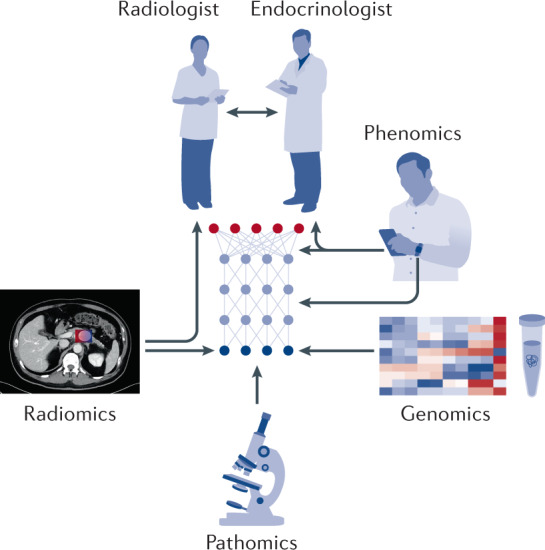
The convergence of different omics data with clinical intuition. Endocrinologists communicate with patients and radiologists to gain a clinical overview of their patient. Four arms give a holistic overview of disease: radiomics (for example, CT or MRI), pathomics (for example, histology of tissue samples), genomics and phenomics (for example, digital health mobile phone applications and wearable trackers). An artificial intelligence algorithm (such as a deep neural network, seen in the centre) synthesizes all the information and provides a diagnostic classification.
In this Review, we highlight the ever-growing contributions of machine intelligence to the field of endocrine imaging diagnostics for tumours of the adrenal, pancreatic, pituitary and thyroid glands.
Box 1 Glossary of key terms.
Machine learning: a branch of artificial intelligence where algorithms can learn a task without explicit pre-programming.
Computer vision: the use of artificial intelligence for image or other digital media analysis.
Supervised learning: a training technique that uses labelled inputs and asks the algorithm to identify how the relevant features from that data map to each respective label.
Unsupervised learning: a training technique that uses unlabelled inputs and lets the model adjudicate the data into clusters or associations.
Reinforcement learning: a training technique where the model interacts with its environment through actions that are each tied to a value reward.
Deep learning: a subset of machine learning algorithms that process data in networks of abstracted layers to learn, usually via sequential transformations of the data.
Continuous learning: an open training state whereby models can modify their architectures in real time.
Data augmentation: a process to generate synthetic data that involves slight transformations in the training images.
Transfer learning: a technique that uses large and diverse datasets to prime models prior to training with the limited target dataset.
Segmentation: the process of making images machine-readable through annotation of regions of interest.
Region of interest: demarcation of areas relevant to the classification decision-making process.
Texture features: quantifiable patterns of pixels in the medical images, many of which are not visible to the naked eye.
Feature engineering: extraction of features from the data space is guided by domain knowledge, a process that deep learning can bypass through automated feature probing.
Feature selection: an analytic process in which a subset of the total pool of extracted features is selected for incorporation to the model.
Overfitting: a phenomenon that occurs when the model too closely maps to features in the training data resulting in poor generalizability.
Generalizability: model performance on real-world patient populations outside the study data used to develop the model.
Backpropagation: a training paradigm often used to develop neural networks where the weights of neurons are repeatedly tuned based on the error rate in the previous cycle through the training dataset.
Picture Archiving and Communications Systems: a system for multi-modal (such as MRI, CT, X-ray and ultrasound) medical image storage and transfer using a universal digital imaging and communications in medicine (DICOM) file format.
Cloud computing: a network architecture that performs data operations using a remote, centralized server.
Decentralized and distributed computing: network architectures that perform data operations using multiple local or non-centralized servers.
Federated learning: an ensemble training strategy where gradient information from models trained locally in parallel is loaded on a central server to develop a single consensus model; it does not require the transfer of patient data.
Quantum computing: a network architecture that leverages the properties of atomic and subatomic particles to improve the computational efficiency of conventional algorithms or to develop new learning paradigms.
Understanding AI
The definition of AI is broad and encompasses a variety of approaches that bridge the natural, applied and social sciences. Examples of tasks in medicine that can leverage AI include image interpretation16,17, disease forecasting18, genomics19,20, natural language processing21,22 and therapeutic discovery23, among others. We review key concepts in machine learning and deep learning in more detail in this section, both of which fall under the larger umbrella of AI.
Machine learning
Machine learning algorithms can be distinguished from conventional statistical models by their ability to learn without explicit pre-programming24. Therefore, machine learning has the potential to reduce coding effort by researchers. Furthermore, task performance can be improved using rules gleaned from examples in the data rather than from those in prewritten code. This data-driven process also confers an advantage to machine learning in terms of adaptability, whereby algorithms can be configured to update in real time to continuously reflect new data.
Machine learning algorithms are often used to assist with diagnostics in medical imaging, which comprise an excellent source of large volume, multidimensional data. Of note, medical image pixel data contains features that are not apparent to the human eye, which can be extracted using radiomics methods25. The intuitive coupling of machine learning to the field of radiomics has been used to enhance diagnostic performance and to automate workflow. The traditional radiomics workflow moves in a stepwise fashion from image acquisition, to segmentation (Box 1), feature extraction and feature analysis, which ultimately yields a radiomics signature (Fig. 2). Image acquisition begins the workflow, with image capture followed by file conversion to achieve digital workflow compatibility for subsequent data processing. Next, segmentation is performed to delineate tumour regions of interest (ROIs) (Box 1), after which feature extraction is used to harvest quantitative pixel features. Following this step, feature analysis is used to determine the most robust and generalizable features for inclusion in the final model. This selection process prevents overfitting (Box 1), a phenomenon that occurs when the model too closely maps to features in the training data, resulting in poor generalizability26 (Box 1). These steps can be performed by hand; however, the benefit of machine learning algorithms is that they can be used to semi or fully automate this process for improved efficiency and detail. Some examples of machine learning algorithms include support vector machines, random forest and k-nearest neighbour (Table 1). Next, we cover three prominent training methodologies in machine intelligence: supervised, unsupervised and reinforcement learning.
Fig. 2. Computer vision workflow.

The four main steps in the conventional machine learning workflow are image acquisition, segmentation, feature extraction and analysis, or feature selection. Segmentation involves determining the region of interest of the image and feature extraction identifies pixel features that are then graphically analysed. A radiomics signature is the final output. One can also use either machine learning or deep learning for feature extraction and engineering, including the identification of pixel intensity, lesion shape, texture feature matrices and wavelets. Conventional machine learning algorithms must respect this pathway of acquisition, segmentation, feature extraction and feature selection. By contrast, deep learning can circumvent this process altogether with end-to-end processing from inputs to outputs.
Table 1.
Examples of artificial intelligence techniques in endocrine cancer imaging
| Model | Description | Highlighted applications (not exhaustive) |
|---|---|---|
| SVM | A machine learning model that finds a ‘hyperplane’ or decision boundary to separate data of one class from another | SVMs are widely used for classification as a stand-alone approach102 or following conventional and/or deep learning feature extraction |
| Random forest | A machine learning model made up of decision trees that classify using the combined predictions of trees in the ‘forest’ | Random forest classifiers, similar to SVMs, are also commonly used for extraction74 or optimization in feature engineering pipelines |
| k-means | A machine learning technique where the number of clusters is specified and the model partitions the data into non-overlapping groups | k-means can be used for unstructured image data processing such as automated image detection and annotation; for example, they have been used for thyroid nodule segmentation on mobile devices169 |
| ANN | A model class designed to mimic the structure and behaviour of neurons in the brain with layers of nodes that activate based on inputs | ANNs are well suited for pattern recognition, making them good candidates for feature selection; for example, they have been used on MRI-based classification of malignant and benign adrenal masses55 |
| CNN | A deep neural network composed of layers that perform operations to sequentially abstract image features, followed by fully connected layers containing probability distributions for classification; some common subtypes include AlexNet, VGG, GoogLeNet, ResNet and U-Net, among others | CNNs excel at image feature learning and have been utilized in thyroid and pancreatic neuroendocrine tumour diagnostics, for example4,170; although CNNs were designed for 2D images, studies have also indicated a potential role for their use in 3D imaging such as with volume reconstruction on thyroid ultrasound171 |
| SAE | Two-layered deep neural networks that learn by reducing and reconstructing input data | SAE is an unsupervised technique that has the potential to improve efficiency in data pre-processing; for example, SAEs have been utilized for multi-organ detection and segmentation on 3D and 4D dynamic contrast-enhanced MRI87,172 |
| GAN | A type of CNN with two neural networks pitted against each other using a generative network, which produces synthetic samples based on input data to fool a discriminator that tries to differentiate between the real and synthetic data | We can envision GANs as a workaround to low volume data in rare adrenal cancers via synthetic data generation; their use has been demonstrated in thyroid nodule analysis and in consistency determinations of the pituitary and endocrine pancreas75,105,151; GANs also have utility in pre-processing such as via automatic MRI protocol and artefact reduction |
ANN, artificial neural network; CNN, convolutional neural network; GAN, generative adversarial network; SAE, stacked auto-encoder; SVM, support vector machine.
Supervised
Supervised learning (Box 1) uses labelled inputs and asks an algorithm to identify how the relevant features from a dataset map to each respective label26. For example, let us say we are trying to differentiate between benign or malignant thyroid nodules using quantitative pixel features extracted from an ultrasonography study that represent nodule texture. Our labels here are ‘benign’ and ‘malignant’ and our inputs are texture representations, such as pixel correlation or entropy. During model training, the machine learning algorithm studies the texture features (Box 1) of benign and malignant images to develop and refine its decision-making process. Conceptually, the goal of supervised techniques is to correctly classify unlabelled data into the pre-defined categories used during model training. In this hypothetical example, we feed the algorithm feature data from unlabelled scans and we want it to tell us if the imaging findings are benign or malignant. The model is supervised in the sense that its programmer shows the algorithm correct examples to guide the learning process.
Unsupervised
In contrast to supervised learning, unsupervised techniques (Box 1) use unlabelled inputs and let the model adjudicate the data into groups. Revisiting our previous example of the thyroid nodule, we could build a model where pixel data of texture features from scans of patients with unconfirmed or borderline diagnoses are used as the unlabelled inputs. In what is an oversimplification, we could imagine the model ‘plotting’ the imaging data based on common features. Doing so enables the algorithm to identify clusters in the data, which might or might not translate to a substantive interpretation. Critically, the algorithm decides what is important when plotting the data. In the supervised learning example, we were looking to classify thyroid nodules as either benign or malignant. In this unsupervised scenario, the data could cluster any which way. For example, the data might triangulate to ‘coordinates’ or groups for different types of nodules as intended or it could group by background noise. In this way, the unsupervised learning model can potentially elucidate trends that the investigator had not originally set out to find, arguably the greatest strength and weakness of this technique. Unsupervised techniques can also be leveraged for augmenting imaging workflows in the annotation and pre-processing of unlabelled data27,28. Again, a critical conceptual distinction between supervised and unsupervised learning is that the output for the former will typically be a defined label or value, whereas the latter will be a cluster or association.
Reinforcement
Reinforcement learning (Box 1) is a framework where the model interacts with its environment through actions that are each tied to a value reward29. In keeping with our thyroid nodule example, we could build a model that is fed pixel data from unlabelled scans of patients. The model is tasked with the identification of the malignant and benign target patterns. The model will take an action based on the data it encounters and then uses the reward information from its environment to find the path that maximizes the reward over time. We can think of this type of technique as learning by trial and error.
Deep learning
Deep learning (Box 1) is a subset of machine learning using algorithm architectures inspired by neural processing in humans that make classifications or predictions using layers of abstract data representations30. Deep learning models typically perform sequential operations that distort the data in each successive layer and this series of transformations enables the model to progressively deduce information relevant to the assigned task. Revisiting our hypothetical thyroid nodule example, the first layer of our deep learning model might assess groups of image pixels at different orientations to discern edge information31. The second layer might then compile the edges from the first layer to detect patterns of edges31. The next layer might assemble different edge motifs to detect hyperechoic or hypoechoic regions of the scan. Finally, subsequent layers might transform inputs from the previous layer to recognize complex image traits such as microcalcifications, cysts and necrosis.
Importantly, deep neural networks can be differentiated from shallow neural networks by their multiple (>1) ‘hidden’ layers, which contain complex, non-linear connections that can be difficult for humans to interpret (Fig. 3). Although these hidden layers are striking in their ability to enhance the complexity of features discernible by the model, deep learning algorithms require lots of data to avoid picking up noise specific to the training dataset (See ‘overfitting’, Box 1). A key strength of deep learning is that the technique is less reliant on feature engineering (Box 1) when compared with classic machine learning models32.
Fig. 3. A convolutional neural network.

The input is a medical image to which an overlaying grid and a kernel matrix (for example, 3 × 3) are applied. The matrix feature maps to a smaller area on a stacked convolution layer. Another smaller kernel matrix (for example, 2 × 2) is pulled from a different area on that convolutional layer to a pooling layer. This pipeline then coalesces into a classification region with the ‘fully connected’ layers, which will yield an output.
Deep learning models can also make use of the aforementioned supervised, unsupervised and reinforcement learning techniques. Deep learning models (Table 1) can be used for specific tasks within the radiomics workflow, such as in segmentation or feature extraction, often with improved performance compared with traditional machine learning methods like single-layer ‘shallow’ neural networks. Mixed techniques are often employed in the feature extraction process, whereby ‘deep features’ mined using deep learning algorithms are syphoned into a second classifier algorithm, either in isolation or in some combination with other manually extracted or statistically derived features. However, deep learning can also be used in end-to-end processing, effectively obviating the need for human involvement in the segmentation, feature extraction and feature selection (Box 1) steps of the radiomics workflow33,34 (Fig. 2).
Diagnostics
In this section, we review AI applications in endocrine cancer diagnostics by organ system, with an emphasis on clinical utility, technical limitations and areas for future research.
Adrenal gland
On abdominal imaging, approximately 5% of the general population have adrenal lesions that are revealed as incidentally found asymptomatic tumours (incidentalomas)35,36. Clinical work-up for adrenal masses starts with assessing them for potential malignancy and functionality37. Early radiomics efforts to discriminate adrenal lesions on imaging using CT and MRI use mean frequency attenuation mapping with histogram analysis38. However, the replication of findings has been a challenge, possibly owing to variation in techniques to define the ROI39–41. Importantly, histogram analysis has paved the way for automated radiomics-based machine learning techniques with texture analysis, which can assess both low-order and higher-order features. Texture analysis explores hierarchical spatial relationships between pixels. First-order features describe distributions in grey-level pixel intensity, second-order features assess relationships between pixel pairs and higher-order features explore distributions in pixel neighbourhoods42–44.
CT is the dominant imaging modality for evaluating the adrenal gland and can be performed with or without contrast enhancement for the visualization of adrenal tumours. In the evaluation of malignancy, a size of >4 cm is a concerning feature, often prompting resection45. However, this risk factor should not be taken in isolation as ~70% of these large adrenal tumours have been shown to be non-malignant lesions46,47. Machine learning has been used to differentiate large (>4 cm) adrenocortical carcinomas from other large cortical lesions on contrast-enhanced CT48. The radiomics signature obtained by machine learning had a diagnostic accuracy for malignant disease exceeding that of radiologists, although there was inter-observer variability on the radiologist evaluation (P <0.0001)48. The performance of this machine learning-based texture analysis model further improved with the inclusion of pre-contrast mean attenuation, which is a parameter that is also used in established adrenal radiological criteria49.
In terms of functional adrenal lesions, machine intelligence has also been used to differentiate between lipid-poor adenoma and subclinical phaeochromocytoma (which might secrete catecholamines), where attenuation thresholds and washout characteristics might not always be reliable50,51. As subclinical phaeochromocytomas can sustain secretory function, biopsy or surgery could precipitate haemodynamic instability if a functional tumour goes undetected. Studies have yielded radiomics signatures for subclinical phaeochromocytoma via machine learning-driven texture analysis on non-contrast CT imaging with performance accuracy ranging from 85% to 89%52,53. However, the potential benefits of this approach over existing clinical criteria are hard to discern due to considerable differences in baseline tumour characteristics, such as attenuation and size, and the lack of comparison between machine learning-driven analysis and expert radiologist evalution52,53. Still, we can envision a future role for the enhanced detection of subclinical pheochromocytomas with artificial intelligence techniques to confidently and quickly prompt confirmatory biochemical testing.
Other groups have also leveraged the improved resolution of adrenal imaging on MRI to train their models. Indeed, one group developed a machine learning-based radiomics signature to differentiate adrenal adenomas from non-adenomatous lesions on MRI, with non-inferior performance in comparison with expert radiologists54. Other studies have explored neural networks for the differentiation of tumour subtypes on MRI (accuracy, 93%) and CT (accuracy, 82%), including adrenal adenomas, cysts, lipomas, lymphangiomas and metastases. However, these neural networks were trained with radiologist evaluation as the ground truth condition rather than with the gold standard of biopsy pathology55,56.
Looking ahead, we anticipate that the field of AI-powered adrenal tumour diagnostics will move towards robust automated detection and preoperative classification of incidentalomas. Future work is needed in the differentiation of small adrenal masses <4 cm, particularly in the case of malignancy, where early detection is linked with better outcomes57. The field will be improved with more robust clinical evaluation and workarounds for small cohort size, possibly through increased data-sharing and/or pre-processing techniques to reduce overfitting.
Pancreas
The aberrant proliferation of endocrine islet cells leads to the development of pancreatic neuroendocrine tumours (NETs) and prognosis is overall favourable with complete resection58–60. A minority of these neoplasms retain the functional status of their original islet cell lineage, which can induce a clinical syndrome due to hormone production, often facilitating their detection61,62. Absent such biochemical indicators, the clinical management of pancreatic NETs is primarily stage-guided by Ki67 index and mitotic count observed in tissue samples obtained by biopsy; however, imaging characteristics, such as tumour size, depth of invasion and presence of metastases, are also considered63–66. Pancreatic NETs classically present on CT imaging as contrast-enhancing masses that are best visualized on the arterial phase, often with a hypervascular appearance and washout on the delayed phase67,68.
Preoperatively, biopsy samples are typically obtained via fine-needle aspiration on endoscopic ultrasound, although the localization and yield can be complicated by lesion size and spatial orientation69. In light of these uncertainties, there is interest in developing a system for preoperative risk stratification of pancreatic NETs, which will help guide therapeutic directions in support of endocrine oncologists and surgeons70,71. Studies have utilized both conventional machine learning and deep learning on preoperative CT and MRI to classify pancreatic NET grade with robust accuracy in pathology-confirmed tumours4,72–75. Importantly, the development of classification boundaries for future studies requires consensus in the partitioning of tumour grades. For example, some studies differentiate grade G1 and G2 from G3 neoplasms, whereas others differentiate grade G1 from G2 and G3 neoplasms4,74,76. Given that pancreatic NETs are so rare, a deep learning study using MRI has used data augmentation (Box 1) with a generative adversarial network on 96 patients with confirmed disease to enable their convolutional neural network to have improved generalizability on unseen data75. As well as stratification, future computer-aided diagnosis could also potentially be used for pancreatic NETs if efforts using AI could be expanded to functional imaging techniques with tracers such as the octreotide scan77–79.
We also envision a role for machine intelligence to support radiologists in the differentiation of atypical pancreatic NETs from adenocarcinoma. Pancreatic adenocarcinoma is an exocrine malignancy of the epithelioid ductal cells that often confers a poor prognosis due to delays in diagnosis80,81. Although pancreatic NETs are usually distinguishable from adenocarcinomas on CT by their vascularity pattern and absence of ductal dilation, a hypovascular enhancement pattern occurs non-infrequently in atypical variants63,67,68. To date, statistical approaches utilizing histogram analysis on CT images have seen conflicting findings in terms of the robustness of features used for differentiation, including entropy, kurtosis and skew82,83. Future studies can be performed with AI and focus on combining imaging information with clinical data (such as laboratory tests) for increased accuracy.
Broadly, studies in the field of pancreatic imaging have utilized deep neural networks to improve workflow by carrying out automatic segmentation of pancreatic lesions, a process ordinarily complicated by the irregular contours and difficult anatomy of the pancreas84–88. In addition, several studies used advanced learning techniques for classification in exocrine pancreatic cancer and precursor lesions, with encouraging findings89,90. For example, one exploratory study with a small dataset used a mix of supervised and unsupervised learning techniques for the classification of pancreatic cystic neoplasms on MRI. We highlight the paper’s use of unsupervised methods, in which a k-means algorithm is trained to cluster pancreatic precursor lesions on unlabelled MRI scans. Following this step, the machine-annotated scans are fed into a novel proportioning type support vector machine for final label adjudication91 (Table 1). Potential also exists here to eventually adapt such unsupervised models for the automatic labelling of unstructured medical image data in order to reduce the pre-processing workload. This work is still exploratory, with only a modest (6–10%) improvement in diagnostic accuracy over prior unsupervised machine learning approaches; however, it nevertheless highlights the opportunity to improve on prior learning techniques in the field of pancreatic imaging to develop models that can be used clinically.
Pituitary gland
Pituitary adenomas are found to occur in approximately 10% of the population, although they are typically small and subclinical lesions that do not require treatment92,93. Clinical syndromes such as acromegaly or bitemporal haemianopsia, for example, can result from tumour hormonal hypersecretion or tumour mass effect on surrounding structures94–98. In combination with clinical data, neuroimaging plays a vital role in informing pituitary tumour diagnosis, surgical planning and longitudinal monitoring99,100. MRI is generally the preferred imaging modality for the sellar region as it can provide exquisite detail of the neuroanatomy. An incredible diversity of sella turcica pathologies localize to the sellar region, including those of primary pituitary, local or distant origin.
Machine intelligence has been leveraged for a variety of diagnostic tasks that reflect the diversity of sellar lesions and hold implications in terms of treatment. For example, an early study utilized a three-layer feedforward artificial neural network (Table 1) with backpropagation (Box 1) for the differentiation of large suprasellar masses such as pituitary adenomas, craniopharyngiomas and Rathke cleft cysts101. Their learning model used patient age together with MRI features to achieve excellent accuracy, which improved on the performance of both neuroradiologists and general radiologists101. Interestingly, upon assessment of expert confidence and misclassifications, the authors found that the AI model was most beneficial when used to identify cases where cystic degeneration occurred in pituitary adenomas101. Other models have been used for the differentiation of null cell adenomas from other non-functioning pituitary adenomas via machine learning-based radiomics signatures, albeit lacking expert radiologist comparison102. Accurate diagnosis of null cell adenomas is critical, as adjuvant radiotherapy has shown some benefit in this adenoma subtype but not in others due to an overriding risk of hypopituitarism. Deep learning is also gaining traction, with one study utilizing convolutional neural networks (Table 1) on multisequence MRI to diagnose pituitary adenomas from other sellar pathologies and healthy controls, with a performance accuracy of 97.0%, although this protocol is still in need of radiologist comparison5.
Robust pituitary tumour characterization at the time of diagnosis can also inform subsequent surgical planning. A variety of conventional machine learning and deep learning techniques have been used to evaluate macroadenoma consistency, with many models achieving good diagnostic performance on par with that of radiologists103–105. This preoperative finding can have surgical implications as soft adenomas are generally amenable to suction curettage upon a transsphenoidal approach, whereas the firm subtype is more difficult to resect and requires ultrasonic aspiration and often a staged transsphenoidal approach106,107. Other deep learning models have been used to preoperatively predict tumour invasion or cerebrospinal fluid leak, to inform surgical planning108,109.
Future machine learning directions should strive to enable the early detection of small pituitary lesions, possibly via automated lesion detection or improved diagnostic performance, as early clinical intervention can prevent the sequelae of worsening mass effect or protracted hormone hypersecretion. In terms of disease forecasting, we also see potential value in tools for the determination of appropriate patient follow-up periods for tumour surveillance to reduce unnecessary scanning and promote efficient health-care utilization. To this aim, studies could use longitudinal patient data gathered by automated segmentation and measurement of lesions over time and link those imaging features with clinical outcomes.
Thyroid gland
Thyroid cancer is the most common malignancy of the endocrine system, with an estimated 5-year prevalence of 4.6%110 (International Agency for Research on Cancer). Ultrasonography is the mainstay imaging modality in diagnosis that can provide excellent visualization of nodules and guide potential biopsy acquisition. Many robust AI applications have emerged to characterize thyroid nodules owing, in part, to the ubiquity of data as ultrasound scans are non-ionizing, fairly low-cost and increasingly portable110,111. Studies to date primarily explore the automatic segmentation and classification aspects of thyroid nodule diagnosis112–117. The primary utility of these models lies in their potential to inform decisions around whether to proceed with surveillance or fine-needle aspiration biopsy15. To date, many of the radiomics signatures for thyroid cancer developed by conventional machine learning approaches map to the five domains in the Thyroid Imaging, Reporting and Data System (TI-RADS, used by radiologists) of echogenicity, echogenic foci, composition, shape and margin criteria118–121. These models support the robustness of these TI-RADS clinical imaging criteria; however, they also highlight a potential role for automated techniques in reducing inter-observer variability.
An abundance of deep learning models has also been developed to inform clinical decisions in patients with thyroid nodules, although a 2020 metanalysis did not find a clear superiority over classic machine learning techniques or radiologists in terms of diagnostic accuracy122. Of course, interpretation of this pooled data is difficult as many of the deep learning models, sample sizes and clinical evaluation criteria vary substantially across studies. For example, one 2019 study with high volume data trained a convolutional neural network (Table 1) with images drawn from over 312,399 ultrasound scans from 42,952 patients across multiple institutions; this model was found to outperform skilled radiologists (>6 years experience) on external validation6. Although not all institutions will have access to high volume thyroid ultrasound scans, they can still implement a number of strategies to increase data availability. Here, we want to highlight one emerging strategy: the use of model pre-training with synthetic data creation via generative adversarial networks (Table 1). In fact, in the past year, the endocrine literature began to explore innovative ‘knowledge-guided’ approaches to data synthesis using deep learning-extracted features from TI-RADS to assist the generative adversarial network in its generation of thyroid nodule images123.
It is not clearly established how the benefits of machine intelligence systems for improving diagnostic accuracy will ultimately translate to the clinical setting. Overall, the literature suggests that these systems can achieve non-inferior performance to that of experienced radiologists (experience varies, typically 5–20 years)122,124. These algorithms do tend to outperform less-experienced radiologists and might therefore play a valuable supporting role, particularly in low-resource settings, where access to experts could be constrained125–127. Compared with a small cohort of models that are actively being utilized in the clinical setting, radiologists seemingly have a slight edge in varying indicators of performance on individual studies, although pooled overall metrics are comparable122,128. A centralized inventory to actively track these diagnostic algorithms in clinical use would improve performance auditing and algorithm stewardship. Looking ahead, we see that the field is already heading towards 3D detection and reconstruction in thyroid ultrasonography that might power more robust analytics117. Another challenge moving forward will be in mitigating the risks of excessive intervention in thyroid cancers with improved detection as many slow-progressing or early-stage cancers will remain subclinical. Possible solutions here include linking imaging algorithms to pathology reference standards as well as with longitudinal outcomes data for improved risk stratification129.
Facial recognition
Interestingly, a number of computer vision applications of facial recognition software have been developed to identify stereotyped facial features induced in hormonal excess130. A positive identification of characteristic facial features could indicate a number of pathologies, including an underlying endocrine tumour. The process is similar to the radiomics workflow, except that facial landmark tagging occurs in lieu of segmentation during image pre-processing.
Acromegaly can result in facial manifestations such as frontal bossing, sunken nasolabial folds, prominent zygomatic arch and enlarged jaw often due to an underlying pituitary somatotrophic macroadenoma. Both machine learning and deep learning approaches have been used to craft models to identify stereotyped facial features, with a performance comparable to that of acromegaly specialists and exceeding that of general internists131,132. Stereotyped features can also occur in Cushing syndrome, such as facial plethora, hirsutism, acne and cervical fat pad, owing to increased cortisol. Initial pilot studies using machine learning are limited by small cohorts and demonstrate variable performance on retrospective validation (accuracy range 62.8–85%)133,134. Limitations in models to date include poor visualization of facial features and potential entrenched bias due to racial and gender homogeneity in training data131–134. The diversification of data and obtaining metrics of bias are critically important as is documenting bias assessments in these facial recognition software applications to avoid replicating current racial and gender disparities in the care of Cushing syndrome and acromegaly that manifest as poor outcomes and delays in diagnosis, respectively135,136.
Clinical evaluation
The metrics used for clinical assessment in AI currently lack standardization, which undermines the smooth integration of AI into the health-care system (Tables 2,3). Many computer vision studies in endocrine cancer imaging lack robust validation, which poses inherent limitations in terms of reproducibility. First, the lack of consistent reference standards (including biopsy, stable imaging and clinical criteria) for common clinical questions in machine intelligence for tumour imaging diagnostics can undermine the ability to establish a ground truth for comparison across studies. Furthermore, no consensus exists in definitions of high versus low experience levels in radiologists; however, the endocrine cancer computer vision literature generally trends towards more than 5 years of clinical practice at a minimum as indicative of a high level of expertise. Next, separation of the data training sets and testing datasets is critically important and cross-validation alone is not adequate in evaluating clinical performance. At a minimum, studies should be validated on external datasets, ideally with prospective studies, which are less prone to selection bias.
Table 2.
Key evaluation metrics for computer vision applications in medicine
| Development phase | Principle | Description | |
|---|---|---|---|
| Data management | Pre-processing | Acquisition | Studies should disclose protocols used to obtain medical images as these can be different across institutions; variations in imaging machines, positioning, image capture and slicing, and data formats can limit generalizability; augmentation of acquisition protocols through automation can improve standardization |
| Segmentation | Refers to the process of making images machine-readable through annotation of ROIs, which can be performed manually or automatically; protocols can be subject to inter-observer and inter-study variability (such as whole tumour versus axial ROIs) | ||
| Heterogeneity | Refers to the sample data mix; ideally, data would include a multi-institutional and representative set of experimental and control images with both typical and atypical cases; publishing the data distributions for pathologies or demographics included in model training can help to mitigate these concerns | ||
| Size | With increasing dimensionality, models need more data for generalization; researchers can use model-specific or post hoc thresholds in performance cut-offs on validation to ‘power’ their studies but these processes are variable in practice; sample size determination practices should be reported in research studies; future work should assess for possible best practices in post hoc techniques for sample size determination | ||
| Training | Reference standard | A degree of uncertainty exists in the ground truth condition in clinical diagnosis, although sample biopsy tends to be the gold standard in cancer diagnostics; however, diagnosis by a specific biomarker, imaging finding or clinical criteria might be more appropriate to the clinical question and/or institutional resources; however, the establishment of uniform reference standards for endocrine neoplasms is needed in cases where biopsy is not routinely obtained such as in small adrenal or pituitary masses | |
| Data separation | Failure to separate training and validation sets is discouraged as it limits the generalizability of findings | ||
| Testing and/or validation | Performance: efficacy (diagnostic performance); safety (potential untoward effects on overall patient health or well being); fairness (equitable algorithm performance across populations) | An expert radiologist comparison can be used to infer the clinical relevance of algorithm performance; retrospective and prospective experimental designs are typically used, with prospective studies less prone to memory bias (internal test sets) and selection bias; in algorithms intended for autonomous use in diagnosis or other high-risk applications, randomized clinical trials might be warranted to assess for efficacy, safety and fairness | |
| Implementation and quality control | Generalizability | Institutions should assess how algorithms perform in their respective clinical populations; ideally, all studies would be tested on a distinct, external dataset prior to implementation to infer generalizability; baseline variation in radiologist skill level across institutions can muddy comparisons; drawing from experts across different institutions as well as including a consensus agreement on ‘highly experienced’ expert level in existing reporting guidelines could help in assessments of model generalizability | |
| Longevity | Model performance has the potential to degrade over time due to changing health infrastructure, cyber sabotage or shifts in population characteristics over time; continued performance auditing across the algorithms life cycle is indicated | ||
| Utility | The number of algorithms being developed to assist clinical diagnostics is exploding to the point where it can constrain bandwidth, clutter interfaces and overwhelm providers; moving forward, there will be a need for inventories of models that can guide clinical stewardship efforts to curtail their excessive use | ||
ROIs, regions of interest.
Table 3.
Major studies in AI imaging for endocrine cancer diagnostics
| Study and yeara | Task | Modality | Model type or package | Study design | Training data size; test data size | External testing | Compared with expert? | Reference standard |
|---|---|---|---|---|---|---|---|---|
| Adrenal | ||||||||
| Romeo et al.54, 2018 | Classify LRA vs LPA vs NAL | MRI | J48 (Weka) | Retrospective | 80 | No | Yes | LRA and LPA by imaging; NAL by pathology |
| Yi et al.53, 2018 | Classify LPA vs sPHEO | CT | LASSO | Retrospective | 212; 53 | No | No | Pathology |
| Yi et al.52, 2018 | Classify LPA vs sPHEO | CT | MaZda-B11 | Retrospective | 110 | No | No | Pathology |
| Barstugan et al.55, 2020 | Classify lesion benign vs malignant and by type (AA vs cyst vs LP vs MET) | MRI | SVM, ANN | Retrospective | 112 | No | No | Imaging |
| Elmohr et al.48, 2019 | Classify benign vs malignant large adrenal tumours | CT | RF | Retrospective | 54 | No | Yes | Pathology |
| Koyuncu et al.56, 2019 | Classify benign vs malignant (AA, haematoma, LP, PHEO, MET) | CT | ANN | Retrospective | 57; 57 | No | No | Imaging |
| Pancreas | ||||||||
| Choi et al.76, 2018 | Predict grade G1 vs G2 or G3 PNET | CT | MISSTA package | Retrospective | 66 | No | Yes | Pathology |
| Gao and Wang75, 2019 | Predict grade G1 vs G2 vs G3 PNET | MRI | GAN, CNN | Retrospective | NR (n = 96; augmented) | Yes | No | Pathology |
| Gu et al.74, 2019 | Predict grade G1 vs G2 or G3 PNET | CT | RF | Retrospective | 104; 34 | No | No | Pathology |
| Liang et al.73, 2019 | Predict grade G1 vs G2 or G3 PNET | CT | LASSO | Retrospective | 86; 51 | Yes | No | Pathology |
| Luo et al.4, 2020 | Predict grade G1 or G2 vs G3 PNET | CT | CNN | Retrospective | 93; 19 | Yes | No | Pathology |
| Zhao et al.72, 2020 | Predict grade G1 vs G2 PNET | CT | SVM | Retrospective | 59; 40 | No | No | Pathology |
| Pituitary | ||||||||
| Kitajima et al.101, 2009 | Differentiate PA vs CP vs RCC | MRI | ANN | Retrospective | 43 | No | Yes | Pathology |
| Zhang et al.102, 2018 | Differentiate NCA vs other NFPA | MRI | SVM | Retrospective | 75; 37 | No | No | Pathology |
| Fan et al.104, 2019 | Differentiate PA consistency | MRI | SVM | Prospective | 100; 58 | Yes | No | Clinical criteria and surgical video |
| Niu et al.108, 2019 | Preoperative prediction of PA cavernous sinus invasion | MRI | LASSO, SVM | Retrospective | 97; 97 | No | No | Surgeon postoperation evaluation |
| Qian et al.5, 2020 | Differentiate PA vs other (sellar lesions or healthy) | MRI | CNN | Retrospective | 5,164; 1,393 | No | No | Clinical diagnosis |
| Zhu et al.105, 2020 | Differentiate PA consistency | MRI | GAN, CNN, CRNN | Retrospective | 70%; 30%; (n = 374; augmented) | No | No | Imaging |
| Thyroid | ||||||||
| Zhu et al.120, 2013 | Differentiate benign vs malignant | US | ANN | Retrospective | 464; 225 | No | No | Pathology |
| Buda et al.125, 2019 | Differentiate benign vs malignant | US | CNN | Retrospective | 1,278; 99 | No | Yes | Pathology |
| Li et al.6, 2019 | Differentiate benign vs malignant | US | CNN | Retrospective | 312,399; 19,781 | Yes | Yes | Pathology |
| Song et al.112, 2019 | Detect and differentiate benign vs malignant | US | CNN | Retrospective | 6,228; 367 | Yes | Yes | Pathology |
| Song et al.173, 2019 | Differentiate benign vs malignant | US | CNN | Prospective | 1,358; 100 | Yes | No | Pathology |
| Wang et al.174, 2020 | Predict aggressive175 vs non-aggressive papillary thyroid CA | MRI | LASSO, GBC | Prospective | 96; 24 | No | No | Pathology |
AA, adrenal adenoma; AI, artificial intelligence; ANN, artificial neural network; CA, carcinoma; CNN, convolutional neural network; CP, craniopharyngioma; CRNN, convolutional recurrent neural network; G, grade; GAN, generative adversarial network; GBC, Gradient Boosting Classifier; LASSO, least absolute shrinkage and selection operator; LPA, lipid-poor adenoma; LRA, lipid-rich adenoma; LP, lipoma; MET, metastases; MISSTA, Medical Imaging Solution for Segmentation and Texture Analysis; NAL, non-adenomatous lesion; NCA, null cell adenoma; NFPA, non-functioning pituitary adenoma; NR, not reported; PA, pituitary adenoma; PHEO, pheochromocytoma; PNET, pancreatic neuroendocrine tumour; RF, random forest; RCC, Rathke cleft cyst; sPHEO, subclinical phaeochromocytoma; SVM, support vector machine; US, ultrasonography. aThis list is not exhaustive and provides a selection of key studies.
To improve the quality of research, a number of guidelines for reporting in computer vision studies in medicine have been developed137–139. Moving forward, the development of performance profiles for any high-fidelity model classes or software packages for standard benchmarking might also be helpful, while at the same time acknowledging that, often, many ways exist to accomplish the same task with machine learning. Importantly, for those algorithms intended for autonomous clinical use, multicentre randomized trials might also be indicated to qualify their performance in integrated settings. Long-term monitoring of efficacy and bias across the algorithm life cycle is also indicated, particularly in cases of continuous learning (Box 1) where algorithms continually update to reflect new data.
Interpretability
Decoding AI for physicians can mitigate uncertainty that could undermine trust in machine intelligence140–142. Broadly speaking, interpretability strategies come in multiple flavours, either being specific or agnostic to a given model class and assessing function either at a global or local level143. Global interpretations seek to offer holistic depictions of model behaviour and they focus on illuminating trends in the data that are most important to classification. Local interpretations focus on explaining individual model prediction instances. The intent of these strategies is to reassure endocrinologists and radiologists that the model is making decisions of what it should be looking at, often by way of visualizations or text. These explanations are generated using several techniques, including feature importance to highlight salient features, counterfactual examples of model predictions for a given input or decision rules that describe the logical flow of the model143,144.
Feature attribute strategies are quite popular and include colour mapping145, an interpretability technique that highlights regions of the medical image that influence the model decision. Other feature attribute methods include surrogate strategies146, which use simpler models to explain the behaviour of more complex models. In the oncologic endocrinology literature, one form of colour mapping, known as saliency mapping, has been demonstrated in thyroid nodule classification to illustrate model behaviour147. Other studies have utilized both gradient mapping and surrogate modelling techniques to highlight feature importance in the segmentation of brain tumours on MRI and abdominal CT, with the potential for future use in sellar, pancreatic and adrenal diagnostics148–150. Finally, image similarity feature attribute strategies have also been applied to computer vision models for thyroid cancer. This technique displays a similar image linked to a classification as an explanation for the user, often with a superimposed gradient mapping to illuminate any respective discrepancies in regions of importance151. Of note, textual explanations are less common; however, they have been utilized in breast MRI and pelvic x-ray imaging to generate descriptive semantic outputs152,153. Interestingly, a combined approach with both saliency maps and textual explanations was shown to be better received by a small group of physicians153. Future efforts should strive to develop standardized metrics for evaluating the performance of interpretability models to ensure their effective and reproducible knowledge translation to the clinical setting.
Data availability
Abundant medical imaging data is needed to develop clinically meaningful deep learning models for non-invasive endocrine cancer diagnostics, capable of generalizing to a variety of clinical settings. In this section, we discuss techniques to increase the availability of data to prevent overfitting in AI models.
Open data curation
A lack of high volume, quality data impedes the development of robust AI in endocrine cancer diagnosis. One strategy to improve data for use by machine learning models is through improved sharing of existing data via the creation of open databases. The ongoing coronavirus disease 2019 pandemic has highlighted the role of open science in enabling timely advances in medical research, a movement that we should strive to foster outside of crisis scenarios154–156. In terms of medical imaging specifically, open data can be used either for training and development of models or as external test sets. Some examples would be the US National Institute of Health Cancer Imaging Archive and the UK Biobank, the latter of which expanded its archive in 2020 to include an imaging database with pan-MRI and DXA scans on >5,000 patients.
Automated workflow
AI integration can be targeted through automated pipelines (including XNAT or DICOM Image Analytics and Archive) that can reduce latency in data retrieval through improved integration with existing health-care infrastructure157 (Fig. 4). These tools can uncouple imaging data in Picture Archiving and Communications Systems from protected health information following image acquisition for use by AI models for near-real-time processing. From there, these imaging findings can be conveyed using automatic workflow interfaces connected with the electronic medical record as a central hub for coordination among endocrinologists, radiologists and other care team members. Looking ahead, we envision the deployment of these automated workflow pipelines to facilitate real-time analytics that endocrinologists can access rapidly at the bedside via smartphone-based imaging viewing platforms or portable imaging devices.
Fig. 4. Real-time analytics with automatic picture archiving and communications systems integration.

The system named DICOM Image Analysis and Archive (DIANA) is an automated workflow solution developed by the authors’ group that provides a programming interface with the hospital picture archiving and communications systems (PACS) to streamline clinical artificial intelligence (AI) research176. DIANA has facilitated near-real-time monitoring of acquired images, large data queries and post-processing analyses. More importantly, DIANA is integrated with the machine learning algorithms developed for various applications. The future goal is to integrate AI endocrine cancer diagnostics (such as adrenal adenoma and pituitary adenoma) in this or other systems. HTTP, hypertext transfer protocol; PHI, protected health information. Figure 4 is adapted from ref.176, Springer Nature Limited.
Data augmentation and transfer learning
Data pre-processing and model pre-training techniques can also be used to engineer workaround solutions to limited imaging data in order to improve AI model generalizability32. Data augmentation is a process that distorts the training images via oversampling to generate synthetic data158,159. Another popular option in computer vision for treating small sample sizes involves pre-training of the model with a large and diverse image set to transfer preliminary weights to nodes in the network, after which fine-tuning of the model is performed using the target data160,161. Although these augmentation and transfer learning (Box 1) methods are now becoming staples in medical image informatics research, they were not used in a number of the endocrine cancer studies that we reviewed. Looking ahead, we anticipate that improved uptake of these methods will promote deep learning breakthroughs, particularly in the cases of rare neoplasms with limited availability of imaging data such as those of the adrenal gland and endocrine pancreas.
Alternative computing platforms
The organization of network servers used to access, store and transfer data can influence AI model training and development (Fig. 5). In this section, we draw attention to how exploratory computing frameworks might be leveraged to improve the quality of AI applications for endocrine cancer diagnostics.
Fig. 5. Exploring alternative computing platforms.

Centralized, distributed, decentralized and quantum computing frameworks are shown. The centralized network panel has a node with spokes spreading outward that represents a single, consolidated platform such as a local (on-site data centre) or remote (Cloud) server. The distributed network panel shows a net-like pattern of equally spaced nodes and such a platform with multiple local servers or devices can be used for collaborative model training techniques like cyclic weight transfer. The decentralized network panel has multiple centralized nodes connected in a net-like pattern and federated learning is one training paradigm that uses this platform. Previous studies177,178 depicted quantum networks as two nodes with the cutout region between nodes illustrating the induction of dependent quantum states among two particles (A and B, where S refers to a shared source of squeezed light) and this particle ‘entanglement’ is at the crux of quantum communications. Adapted from ref.177, Springer Nature Limited. The quantum network is reprinted from ref.178, CC BY 4.0 (https://creativecommons.org/licenses/by/4.0/).
Decentralized or distributed
Information technology infrastructures are trending towards Cloud computing (Box 1) solutions that consolidate data operations within a central server. However, computing platforms with diffuse servers are now being explored to circumvent data-sharing issues associated with centralized data that pose barriers to the multi-institutional, collaborative training of AI models. Distributed networks process data diffusely across local nodes, whereas decentralized platforms operate as collectives of nodal clusters (Fig. 5; Box 1).
We highlight the potential of an emerging decentralized training paradigm known as federated learning (Box 1), which is already being utilized to enable deep AI models to be developed for diabetic retinopathy and breast cancer diagnosis162. Federated learning uses distributed servers across multiple institutions for parallel model training and model updates are subsequently loaded onto a central server to develop an ensemble model. Distributed learning techniques, such as cyclic weight transfer, can conduct this process across local servers in series, using one model passed from institution to institution over the course of training163. Importantly, these techniques do not require inter-institutional patient data transfer or co-location. We can similarly envision a role for decentralized and distributed techniques in bypassing current barriers to data sharing and availability to enable deep learning applications in oncologic endocrinology, particularly in rare cancers. However, a notable limitation in current federated learning techniques is that the diversity of data is only as robust as that of the collaborating institutions. Still, past efforts have yielded deep learning models with impressive performance on par with those from shared multi-institutional datasets162–164.
Quantum
Other breakthroughs in machine intelligence in medicine will come with shifts in computing frameworks that can enhance model training and efficiency. Quantum computing (Box 1) represents one emerging prospect that would leverage the physical properties of atomic and subatomic particles to enhance processing power, algorithm performance and data transfer165. Quantum computers can theoretically support the simultaneous, parallel-path processing of data to create shortcuts that might outperform conventional computing165 (Fig. 5). Encouraging scientific breakthroughs over the past 5 years demonstrated ‘quantum supremacy’ in terms of problem-solving capabilities over conventional computing, albeit these findings are still very much exploratory166. However, some experts anticipate that the arrival of usable quantum computing could occur as early as within the next few decades167.
Conclusions
Machine intelligence continues to gain traction in oncologic endocrinology for its potential to enable robust non-invasive diagnostics. However, for these technologies to take hold, both adherence to consensus reporting standards and evaluation criteria in AI image interpretation are required, which will enable meaningful cross-study comparisons. Although several of such AI guidelines have been established137–139, a lack of harmonization impedes their widespread uptake. Another challenge will be facilitating the smooth movement of these technologies into the clinical setting so that physicians embrace their use. Clarity at the federal and institutional levels is urgently needed in terms of developing longitudinal performance auditing, medicolegal liability frameworks and guidance on reimbursements for clinical AI developers and medical institutions utilizing these technologies.
Another theme is how poor data availability continues to stymie the development of robust machine learning applications, particularly in rare endocrine cancers. Although access to medical imaging is improving through open data-sharing initiatives, we still note a relative paucity of endocrine cancer scans within these larger imaging databases. We encourage the creation of domain-specific imaging databases that can better enable AI for oncologic endocrinology purposes.
Collaborative learning strategies might also centre the foray given their potential to circumvent data access issues without transferring personal health information. Future work on distributed computing paradigms also need to consider how to best manage potential cyber risks and data as the potential surface area vulnerable for cyberattack increases with the increasing number of participants. Digital health could also enable future breakthroughs such as via correlation of radiomics findings with wearables or digital health application data168. Finally, the advent of smartphone imaging viewing platforms and automated workflows will bring the field closer to smooth, real-time analytics that can enable robust partnerships among endocrinologists, radiologists and AI.
Author contributions
The authors contributed equally to all aspects of the article.
Competing interests
The authors declare no competing interests.
Footnotes
Peer review information
Nature Reviews Endocrinology thanks J. Thomas and J. Wang for their contribution to the peer review of this work.
Publisher’s note
Springer Nature remains neutral with regard to jurisdictional claims in published maps and institutional affiliations.
Related links
International Agency for Research on Cancer: https://gco.iarc.fr/
UK Biobank: https://www.ukbiobank.ac.uk/imaging-data/
US National Institute of Health Cancer Imaging Archive: https://www.cancerimagingarchive.net
References
- 1.Goodfellow, I., Bengio, Y., Courville, A. & Bengio, Y. Deep learning. Vol. 1 (MIT Press, 2016).
- 2.Esteva A, et al. A guide to deep learning in healthcare. Nat. Med. 2019;25:24–29. doi: 10.1038/s41591-018-0316-z. [DOI] [PubMed] [Google Scholar]
- 3.Hosny A, Parmar C, Quackenbush J, Schwartz LH, Aerts HJWL. Artificial intelligence in radiology. Nat. Rev. Cancer. 2018;18:500–510. doi: 10.1038/s41568-018-0016-5. [DOI] [PMC free article] [PubMed] [Google Scholar]
- 4.Luo Y, et al. Preoperative prediction of pancreatic neuroendocrine neoplasms grading based on enhanced computed tomography imaging: validation of deep learning with a convolutional neural network. Neuroendocrinology. 2020;110:338–350. doi: 10.1159/000503291. [DOI] [PubMed] [Google Scholar]
- 5.Qian Y, et al. A novel diagnostic method for pituitary adenoma based on magnetic resonance imaging using a convolutional neural network. Pituitary. 2020;23:246–252. doi: 10.1007/s11102-020-01032-4. [DOI] [PubMed] [Google Scholar]
- 6.Li X, et al. Diagnosis of thyroid cancer using deep convolutional neural network models applied to sonographic images: a retrospective, multicohort, diagnostic study. Lancet Oncol. 2019;20:193–201. doi: 10.1016/S1470-2045(18)30762-9. [DOI] [PMC free article] [PubMed] [Google Scholar]
- 7.Wang L, et al. Automatic thyroid nodule recognition and diagnosis in ultrasound imaging with the YOLOv2 neural network. World J. Surg. Oncol. 2019;17:12. doi: 10.1186/s12957-019-1558-z. [DOI] [PMC free article] [PubMed] [Google Scholar]
- 8.Gerlinger M, et al. Intratumor heterogeneity and branched evolution revealed by multiregion sequencing. N. Engl. J. Med. 2012;366:883–892. doi: 10.1056/NEJMoa1113205. [DOI] [PMC free article] [PubMed] [Google Scholar]
- 9.Chmielik E, et al. Heterogeneity of thyroid cancer. Pathobiology. 2018;85:117–129. doi: 10.1159/000486422. [DOI] [PubMed] [Google Scholar]
- 10.Topol EJ. Individualized medicine from prewomb to tomb. Cell. 2014;157:241–253. doi: 10.1016/j.cell.2014.02.012. [DOI] [PMC free article] [PubMed] [Google Scholar]
- 11.Obermeyer Z, Emanuel EJ. Predicting the future - big data, machine learning, and clinical medicine. N. Engl. J. Med. 2016;375:1216–1219. doi: 10.1056/NEJMp1606181. [DOI] [PMC free article] [PubMed] [Google Scholar]
- 12.Rao A, et al. A combinatorial radiographic phenotype may stratify patient survival and be associated with invasion and proliferation characteristics in glioblastoma. J. Neurosurg. 2016;124:1008–1017. doi: 10.3171/2015.4.JNS142732. [DOI] [PMC free article] [PubMed] [Google Scholar]
- 13.Yamamoto S, Maki DD, Korn RL, Kuo MD. Radiogenomic analysis of breast cancer using MRI: a preliminary study to define the landscape. AJR Am. J. Roentgenol. 2012;199:654–663. doi: 10.2214/AJR.11.7824. [DOI] [PubMed] [Google Scholar]
- 14.Aerts HJ, et al. Decoding tumour phenotype by noninvasive imaging using a quantitative radiomics approach. Nat. Commun. 2014;5:4006. doi: 10.1038/ncomms5006. [DOI] [PMC free article] [PubMed] [Google Scholar]
- 15.Zhao CK, et al. A comparative analysis of two machine learning-based diagnostic patterns with thyroid imaging reporting and data system for thyroid nodules: diagnostic performance and unnecessary biopsy rate. Thyroid. 2021;31:470–481. doi: 10.1089/thy.2020.0305. [DOI] [PubMed] [Google Scholar]
- 16.Gulshan V, et al. Development and validation of a deep learning algorithm for detection of diabetic retinopathy in retinal fundus photographs. JAMA. 2016;316:2402–2410. doi: 10.1001/jama.2016.17216. [DOI] [PubMed] [Google Scholar]
- 17.Zhou H, et al. Machine learning reveals multimodal MRI patterns predictive of isocitrate dehydrogenase and 1p/19q status in diffuse low- and high-grade gliomas. J. Neurooncol. 2019;142:299–307. doi: 10.1007/s11060-019-03096-0. [DOI] [PMC free article] [PubMed] [Google Scholar]
- 18.Liang W, et al. Development and validation of a clinical risk score to predict the occurrence of critical illness in hospitalized patients with COVID-19. JAMA Intern. Med. 2020;180:1081–1089. doi: 10.1001/jamainternmed.2020.2033. [DOI] [PMC free article] [PubMed] [Google Scholar]
- 19.Cohen JD, et al. Detection and localization of surgically resectable cancers with a multi-analyte blood test. Science. 2018;359:926–930. doi: 10.1126/science.aar3247. [DOI] [PMC free article] [PubMed] [Google Scholar]
- 20.Davis RJ, et al. Pan-cancer transcriptional signatures predictive of oncogenic mutations reveal that Fbw7 regulates cancer cell oxidative metabolism. Proc. Natl Acad. Sci. USA. 2018;115:5462–5467. doi: 10.1073/pnas.1718338115. [DOI] [PMC free article] [PubMed] [Google Scholar]
- 21.Chang EK, et al. Defining a patient population with cirrhosis: an automated algorithm with natural language processing. J. Clin. Gastroenterol. 2016;50:889–894. doi: 10.1097/MCG.0000000000000583. [DOI] [PubMed] [Google Scholar]
- 22.Bedi G, et al. Automated analysis of free speech predicts psychosis onset in high-risk youths. NPJ Schizophrenia. 2015;1:15030. doi: 10.1038/npjschz.2015.30. [DOI] [PMC free article] [PubMed] [Google Scholar]
- 23.Yu P, et al. FGF-dependent metabolic control of vascular development. Nature. 2017;545:224–228. doi: 10.1038/nature22322. [DOI] [PMC free article] [PubMed] [Google Scholar]
- 24.Samuel AL. Some studies in machine learning using the game of checkers. IBM J. Res. Dev. 1959;3:210–229. [Google Scholar]
- 25.Kumar V, et al. Radiomics: the process and the challenges. Magn. Reson. Imaging. 2012;30:1234–1248. doi: 10.1016/j.mri.2012.06.010. [DOI] [PMC free article] [PubMed] [Google Scholar]
- 26.Erickson BJ, Korfiatis P, Akkus Z, Kline TL. Machine learning for medical imaging. Radiographics. 2017;37:505–515. doi: 10.1148/rg.2017160130. [DOI] [PMC free article] [PubMed] [Google Scholar]
- 27.Guo Y, Gao Y, Shen D. Deformable MR prostate segmentation via deep feature learning and sparse patch matching. IEEE Trans. Med. Imaging. 2016;35:1077–1089. doi: 10.1109/TMI.2015.2508280. [DOI] [PMC free article] [PubMed] [Google Scholar]
- 28.Wu J, et al. A deep Boltzmann machine-driven level set method for heart motion tracking using cine MRI images. Med. Image Anal. 2018;47:68–80. doi: 10.1016/j.media.2018.03.015. [DOI] [PMC free article] [PubMed] [Google Scholar]
- 29.Sutton, R. S. & Barto, A. G. Introduction to Reinforcement Learning. Vol. 135 (MIT Press, 1998).
- 30.Bengio Y, Courville A, Vincent P. Representation learning: a review and new perspectives. IEEE Trans. Pattern Anal. Mach. Intell. 2013;35:1798–1828. doi: 10.1109/TPAMI.2013.50. [DOI] [PubMed] [Google Scholar]
- 31.LeCun Y, Bengio Y, Hinton G. Deep learning. Nature. 2015;521:436–444. doi: 10.1038/nature14539. [DOI] [PubMed] [Google Scholar]
- 32.Litjens G, et al. A survey on deep learning in medical image analysis. Med. Image Anal. 2017;42:60–88. doi: 10.1016/j.media.2017.07.005. [DOI] [PubMed] [Google Scholar]
- 33.Esteva A, et al. Dermatologist-level classification of skin cancer with deep neural networks. Nature. 2017;542:115–118. doi: 10.1038/nature21056. [DOI] [PMC free article] [PubMed] [Google Scholar]
- 34.Naceur MB, Saouli R, Akil M, Kachouri R. Fully automatic brain tumor segmentation using end-to-end incremental deep neural networks in MRI images. Comput. Methods Prog. Biomed. 2018;166:39–49. doi: 10.1016/j.cmpb.2018.09.007. [DOI] [PubMed] [Google Scholar]
- 35.Lee MJ, et al. Benign and malignant adrenal masses: CT distinction with attenuation coefficients, size, and observer analysis. Radiology. 1991;179:415–418. doi: 10.1148/radiology.179.2.2014283. [DOI] [PubMed] [Google Scholar]
- 36.Song JH, Chaudhry FS, Mayo-Smith WW. The incidental adrenal mass on CT: prevalence of adrenal disease in 1,049 consecutive adrenal masses in patients with no known malignancy. AJR Am. J. Roentgenol. 2008;190:1163–1168. doi: 10.2214/AJR.07.2799. [DOI] [PubMed] [Google Scholar]
- 37.Zeiger M, et al. American Association of Clinical Endocrinologists and American Association of Endocrine Surgeons medical guidelines for the management of adrenal incidentalomas. Endocr. Pract. 2009;15:1–20. doi: 10.4158/EP.15.S1.1. [DOI] [PubMed] [Google Scholar]
- 38.Bae KT, Fuangtharnthip P, Prasad SR, Joe BN, Heiken JP. Adrenal masses: CT characterization with histogram analysis method. Radiology. 2003;228:735–742. doi: 10.1148/radiol.2283020878. [DOI] [PubMed] [Google Scholar]
- 39.Ho LM, Paulson EK, Brady MJ, Wong TZ, Schindera ST. Lipid-poor adenomas on unenhanced CT: does histogram analysis increase sensitivity compared with a mean attenuation threshold? Am. J. Roentgenol. 2008;191:234–238. doi: 10.2214/AJR.07.3150. [DOI] [PubMed] [Google Scholar]
- 40.Umanodan T, et al. ADC histogram analysis for adrenal tumor histogram analysis of apparent diffusion coefficient in differentiating adrenal adenoma from pheochromocytoma. J. Magn. Reson. Imaging. 2017;45:1195–1203. doi: 10.1002/jmri.25452. [DOI] [PubMed] [Google Scholar]
- 41.Tüdös Z, Čtvrtlík F. Possible impact of CT histogram analysis in incidentally discovered adrenal masses. Abdom. Radiol. 2020;45:2937–2938. doi: 10.1007/s00261-020-02596-2. [DOI] [PubMed] [Google Scholar]
- 42.Alobaidli S, et al. The role of texture analysis in imaging as an outcome predictor and potential tool in radiotherapy treatment planning. Br. J. Radiol. 2014;87:20140369. doi: 10.1259/bjr.20140369. [DOI] [PMC free article] [PubMed] [Google Scholar]
- 43.Parekh VS, Jacobs MA. Deep learning and radiomics in precision medicine. Expert Rev. Precis. Med. Drug Dev. 2019;4:59–72. doi: 10.1080/23808993.2019.1585805. [DOI] [PMC free article] [PubMed] [Google Scholar]
- 44.Ganeshan B, Miles KA. Quantifying tumour heterogeneity with CT. Cancer Imaging. 2013;13:140–149. doi: 10.1102/1470-7330.2013.0015. [DOI] [PMC free article] [PubMed] [Google Scholar]
- 45.Nieman LK. Approach to the patient with an adrenal incidentaloma. J. Clin. Endocrinol. Metab. 2010;95:4106–4113. doi: 10.1210/jc.2010-0457. [DOI] [PMC free article] [PubMed] [Google Scholar]
- 46.Iñiguez-Ariza NM, et al. Clinical, biochemical, and radiological characteristics of a single-center retrospective cohort of 705 large adrenal tumors. Mayo Clin. Proc. Innov. Qual. Outcomes. 2018;2:30–39. doi: 10.1016/j.mayocpiqo.2017.11.002. [DOI] [PMC free article] [PubMed] [Google Scholar]
- 47.Angeli A, Osella G, Alì A, Terzolo M. Adrenal incidentaloma: an overview of clinical and epidemiological data from the National Italian Study Group. Horm. Res. 1997;47:279–283. doi: 10.1159/000185477. [DOI] [PubMed] [Google Scholar]
- 48.Elmohr MM, et al. Machine learning-based texture analysis for differentiation of large adrenal cortical tumours on CT. Clin. Radiol. 2019;74:818.e1–818.e7. doi: 10.1016/j.crad.2019.06.021. [DOI] [PubMed] [Google Scholar]
- 49.Korobkin M, et al. Differentiation of adrenal adenomas from nonadenomas using CT attenuation values. AJR Am. J. Roentgenol. 1996;166:531–536. doi: 10.2214/ajr.166.3.8623622. [DOI] [PubMed] [Google Scholar]
- 50.Patel J, Davenport MS, Cohan RH, Caoili EM. Can established CT attenuation and washout criteria for adrenal adenoma accurately exclude pheochromocytoma? Am. J. Roentgenol. 2013;201:122–127. doi: 10.2214/AJR.12.9620. [DOI] [PubMed] [Google Scholar]
- 51.Northcutt BG, Trakhtenbroit MA, Gomez EN, Fishman EK, Johnson PT. Adrenal adenoma and pheochromocytoma: comparison of multidetector CT venous enhancement levels and washout characteristics. J. Comput. Assist. Tomogr. 2016;40:194–200. doi: 10.1097/RCT.0000000000000343. [DOI] [PubMed] [Google Scholar]
- 52.Yi X, et al. Adrenal incidentaloma: machine learning-based quantitative texture analysis of unenhanced CT can effectively differentiate sPHEO from lipid-poor adrenal adenoma. J. Cancer. 2018;9:3577–3582. doi: 10.7150/jca.26356. [DOI] [PMC free article] [PubMed] [Google Scholar]
- 53.Yi X, et al. Radiomics improves efficiency for differentiating subclinical pheochromocytoma from lipid-poor adenoma: a predictive, preventive and personalized medical approach in adrenal incidentalomas. EPMA J. 2018;9:421–429. doi: 10.1007/s13167-018-0149-3. [DOI] [PMC free article] [PubMed] [Google Scholar]
- 54.Romeo V, et al. Characterization of adrenal lesions on unenhanced MRI using texture analysis: a machine-learning approach. J. Magn. Reson. Imaging. 2018;48:198–204. doi: 10.1002/jmri.25954. [DOI] [PubMed] [Google Scholar]
- 55.Barstugan M, Ceylan R, Asoglu S, Cebeci H, Koplay M. Adrenal tumor characterization on magnetic resonance images. Int. J. Imaging Syst. Technol. 2020;30:252–265. [Google Scholar]
- 56.Koyuncu H, Ceylan R, Asoglu S, Cebeci H, Koplay M. An extensive study for binary characterisation of adrenal tumours. Med. Biol. Eng. Comput. 2019;57:849–862. doi: 10.1007/s11517-018-1923-z. [DOI] [PubMed] [Google Scholar]
- 57.Henley DJ, van Heerden JA, Grant CS, Carney JA, Carpenter PC. Adrenal cortical carcinoma — a continuing challenge. Surgery. 1983;94:926–931. [PubMed] [Google Scholar]
- 58.Dasari A, et al. Trends in the incidence, prevalence, and survival outcomes in patients with neuroendocrine tumors in the United States. JAMA Oncol. 2017;3:1335–1342. doi: 10.1001/jamaoncol.2017.0589. [DOI] [PMC free article] [PubMed] [Google Scholar]
- 59.Halfdanarson TR, Rabe KG, Rubin J, Petersen GM. Pancreatic neuroendocrine tumors (PNETs): incidence, prognosis and recent trend toward improved survival. Ann. Oncol. 2008;19:1727–1733. doi: 10.1093/annonc/mdn351. [DOI] [PMC free article] [PubMed] [Google Scholar]
- 60.Genç CG, et al. A new scoring system to predict recurrent disease in grade 1 and 2 nonfunctional pancreatic neuroendocrine tumors. Ann. Surg. 2018;267:1148–1154. doi: 10.1097/SLA.0000000000002123. [DOI] [PubMed] [Google Scholar]
- 61.Modlin IM, et al. Gastroenteropancreatic neuroendocrine tumours. Lancet Oncol. 2008;9:61–72. doi: 10.1016/S1470-2045(07)70410-2. [DOI] [PubMed] [Google Scholar]
- 62.Zerbi A, et al. Clinicopathological features of pancreatic endocrine tumors: a prospective multicenter study in Italy of 297 sporadic cases. Am. J. Gastroenterol. 2010;105:1421–1429. doi: 10.1038/ajg.2009.747. [DOI] [PubMed] [Google Scholar]
- 63.Manfredi R, et al. Non-hyperfunctioning neuroendocrine tumours of the pancreas: MR imaging appearance and correlation with their biological behaviour. Eur. Radiol. 2013;23:3029–3039. doi: 10.1007/s00330-013-2929-4. [DOI] [PubMed] [Google Scholar]
- 64.Inzani F, Petrone G, Rindi G. The New World Health Organization Classification for Pancreatic Neuroendocrine Neoplasia. Endocrinol. Metab. Clin. North. Am. 2018;47:463–470. doi: 10.1016/j.ecl.2018.04.008. [DOI] [PubMed] [Google Scholar]
- 65.Rindi G, Wiedenmann B. Neuroendocrine neoplasms of the gut and pancreas: new insights. Nat. Rev. Endocrinol. 2012;8:54. doi: 10.1038/nrendo.2011.120. [DOI] [PubMed] [Google Scholar]
- 66.Oronsky B, Ma PC, Morgensztern D, Carter CA. Nothing but NET: a review of neuroendocrine tumors and carcinomas. Neoplasia. 2017;19:991–1002. doi: 10.1016/j.neo.2017.09.002. [DOI] [PMC free article] [PubMed] [Google Scholar]
- 67.Lee NJ, Hruban RH, Fishman EK. Pancreatic neuroendocrine tumor: review of heterogeneous spectrum of CT appearance. Abdom. Radiol. 2018;43:3025–3034. doi: 10.1007/s00261-018-1574-4. [DOI] [PubMed] [Google Scholar]
- 68.Karmazanovsky G, et al. Nonhypervascular pancreatic neuroendocrine tumors: Spectrum of MDCT imaging findings and differentiation from pancreatic ductal adenocarcinoma. Eur. J. Radiol. 2019;110:66–73. doi: 10.1016/j.ejrad.2018.04.006. [DOI] [PubMed] [Google Scholar]
- 69.Rösch T, et al. Localization of pancreatic endocrine tumors by endoscopic ultrasonography. N. Engl. J. Med. 1992;326:1721–1726. doi: 10.1056/NEJM199206253262601. [DOI] [PubMed] [Google Scholar]
- 70.Song Y, et al. Multiple machine learnings revealed similar predictive accuracy for prognosis of PNETs from the surveillance, epidemiology, and end result database. J. Cancer. 2018;9:3971–3978. doi: 10.7150/jca.26649. [DOI] [PMC free article] [PubMed] [Google Scholar]
- 71.Saleh M, et al. New frontiers in imaging including radiomics updates for pancreatic neuroendocrine neoplasms. Abdom. Radiol. 2020 doi: 10.1007/s00261-020-02833-8. [DOI] [PubMed] [Google Scholar]
- 72.Zhao Z, et al. CT-radiomic approach to predict G1/2 nonfunctional pancreatic neuroendocrine tumor. Acad. Radiol. 2020;27:e272–e281. doi: 10.1016/j.acra.2020.01.002. [DOI] [PubMed] [Google Scholar]
- 73.Liang W, et al. A combined nomogram model to preoperatively predict histologic grade in pancreatic neuroendocrine tumors. Clin. Cancer Res. 2019;25:584–594. doi: 10.1158/1078-0432.CCR-18-1305. [DOI] [PubMed] [Google Scholar]
- 74.Gu D, et al. CT radiomics may predict the grade of pancreatic neuroendocrine tumors: a multicenter study. Eur. Radiol. 2019;29:6880–6890. doi: 10.1007/s00330-019-06176-x. [DOI] [PubMed] [Google Scholar]
- 75.Gao X, Wang X. Deep learning for World Health Organization grades of pancreatic neuroendocrine tumors on contrast-enhanced magnetic resonance images: a preliminary study. Int. J. Comput. Assist. Radiol. Surg. 2019;14:1981–1991. doi: 10.1007/s11548-019-02070-5. [DOI] [PubMed] [Google Scholar]
- 76.Choi TW, Kim JH, Yu MH, Park SJ, Han JK. Pancreatic neuroendocrine tumor: prediction of the tumor grade using CT findings and computerized texture analysis. Acta Radiol. 2018;59:383–392. doi: 10.1177/0284185117725367. [DOI] [PubMed] [Google Scholar]
- 77.Duan H, Baratto L, Iagaru A. The role of PET/CT in the imaging of pancreatic neoplasms. Semin. Ultrasound CT MR. 2019;40:500–508. doi: 10.1053/j.sult.2019.04.006. [DOI] [PubMed] [Google Scholar]
- 78.Zaharchuk G. Next generation research applications for hybrid PET/MR and PET/CT imaging using deep learning. Eur. J. Nucl. Med. Mol. Imaging. 2019;46:2700–2707. doi: 10.1007/s00259-019-04374-9. [DOI] [PMC free article] [PubMed] [Google Scholar]
- 79.Wei L, Osman S, Hatt M, El Naqa I. Machine learning for radiomics-based multimodality and multiparametric modeling. Q. J. Nucl. Med. Mol. Imaging. 2019;63:323–338. doi: 10.23736/S1824-4785.19.03213-8. [DOI] [PubMed] [Google Scholar]
- 80.Hidalgo M. Pancreatic cancer. N. Engl. J. Med. 2010;362:1605–1617. doi: 10.1056/NEJMra0901557. [DOI] [PubMed] [Google Scholar]
- 81.Cameron JL, et al. Factors influencing survival after pancreaticoduodenectomy for pancreatic cancer. Am. J. Surg. 1991;161:120–124. doi: 10.1016/0002-9610(91)90371-j. [DOI] [PubMed] [Google Scholar]
- 82.Guo C, et al. The differentiation of pancreatic neuroendocrine carcinoma from pancreatic ductal adenocarcinoma: the values of CT imaging features and texture analysis. Cancer Imaging. 2018;18:37. doi: 10.1186/s40644-018-0170-8. [DOI] [PMC free article] [PubMed] [Google Scholar]
- 83.Li J, et al. Differentiation of atypical pancreatic neuroendocrine tumors from pancreatic ductal adenocarcinomas: Using whole-tumor CT texture analysis as quantitative biomarkers. Cancer Med. 2018;7:4924–4931. doi: 10.1002/cam4.1746. [DOI] [PMC free article] [PubMed] [Google Scholar]
- 84.Fu M, et al. Hierarchical combinatorial deep learning architecture for pancreas segmentation of medical computed tomography cancer images. BMC Syst. Biol. 2018;12:56. doi: 10.1186/s12918-018-0572-z. [DOI] [PMC free article] [PubMed] [Google Scholar]
- 85.Man Y, Huang Y, Feng J, Li X, Wu F. Deep Q learning driven CT pancreas segmentation with geometry-aware U-net. IEEE Trans. Med. Imaging. 2019;38:1971–1980. doi: 10.1109/TMI.2019.2911588. [DOI] [PubMed] [Google Scholar]
- 86.Heinrich MP, Blendowski M, Oktay O. TernaryNet: faster deep model inference without GPUs for medical 3D segmentation using sparse and binary convolutions. Int. J. Comput. Assist. Radiol. Surg. 2018;13:1311–1320. doi: 10.1007/s11548-018-1797-4. [DOI] [PubMed] [Google Scholar]
- 87.Gibson E, et al. Automatic multi-organ segmentation on abdominal CT with dense V-networks. IEEE Trans. Med. Imaging. 2018;37:1822–1834. doi: 10.1109/TMI.2018.2806309. [DOI] [PMC free article] [PubMed] [Google Scholar]
- 88.Liang Y, et al. Auto-segmentation of pancreatic tumor in multi-parametric MRI using deep convolutional neural networks. Radiother. Oncol. 2020;145:193–200. doi: 10.1016/j.radonc.2020.01.021. [DOI] [PubMed] [Google Scholar]
- 89.Corral JE, et al. Deep learning to classify intraductal papillary mucinous neoplasms using magnetic resonance imaging. Pancreas. 2019;48:805–810. doi: 10.1097/MPA.0000000000001327. [DOI] [PubMed] [Google Scholar]
- 90.Kuwahara T, et al. Usefulness of deep learning analysis for the diagnosis of malignancy in intraductal papillary mucinous neoplasms of the pancreas. Clin. Transl. Gastroenterol. 2019;10:1–8. doi: 10.14309/ctg.0000000000000045. [DOI] [PMC free article] [PubMed] [Google Scholar]
- 91.Hussein S, Kandel P, Bolan CW, Wallace MB, Bagci U. Lung and pancreatic tumor characterization in the deep learning era: novel supervised and unsupervised learning approaches. IEEE Trans. Med. Imaging. 2019;38:1777–1787. doi: 10.1109/TMI.2019.2894349. [DOI] [PubMed] [Google Scholar]
- 92.Molitch ME. Diagnosis and treatment of pituitary adenomas: a review. JAMA. 2017;317:516–524. doi: 10.1001/jama.2016.19699. [DOI] [PubMed] [Google Scholar]
- 93.Melmed S. Pituitary-tumor endocrinopathies. N. Engl. J. Med. 2020;382:937–950. doi: 10.1056/NEJMra1810772. [DOI] [PubMed] [Google Scholar]
- 94.Chahal J, Schlechte J. Hyperprolactinemia. Pituitary. 2008;11:141–146. doi: 10.1007/s11102-008-0107-5. [DOI] [PubMed] [Google Scholar]
- 95.Vilar L, Vilar CF, Lyra R, Lyra R, Naves LA. Acromegaly: clinical features at diagnosis. Pituitary. 2017;20:22–32. doi: 10.1007/s11102-016-0772-8. [DOI] [PubMed] [Google Scholar]
- 96.Ntali G, Wass JA. Epidemiology, clinical presentation and diagnosis of non-functioning pituitary adenomas. Pituitary. 2018;21:111–118. doi: 10.1007/s11102-018-0869-3. [DOI] [PubMed] [Google Scholar]
- 97.Amlashi FG, Tritos NA. Thyrotropin-secreting pituitary adenomas: epidemiology, diagnosis, and management. Endocrine. 2016;52:427–440. doi: 10.1007/s12020-016-0863-3. [DOI] [PubMed] [Google Scholar]
- 98.Varlamov EV, McCartney S, Fleseriu M. Functioning pituitary adenomas — current treatment options and emerging medical therapies. Eur. Endocrinol. 2019;15:30–40. doi: 10.17925/EE.2019.15.1.30. [DOI] [PMC free article] [PubMed] [Google Scholar]
- 99.Zamora C, Castillo M. Sellar and parasellar imaging. Neurosurgery. 2017;80:17–38. doi: 10.1093/neuros/nyw013. [DOI] [PubMed] [Google Scholar]
- 100.Connor SE, Penney CC. MRI in the differential diagnosis of a sellar mass. Clin. Radiol. 2003;58:20–31. doi: 10.1053/crad.2002.1119. [DOI] [PubMed] [Google Scholar]
- 101.Kitajima M, et al. Differentiation of common large sellar-suprasellar masses effect of artificial neural network on radiologists’ diagnosis performance. Acad. Radiol. 2009;16:313–320. doi: 10.1016/j.acra.2008.09.015. [DOI] [PubMed] [Google Scholar]
- 102.Zhang S, et al. Non-invasive radiomics approach potentially predicts non-functioning pituitary adenomas subtypes before surgery. Eur. Radiol. 2018;28:3692–3701. doi: 10.1007/s00330-017-5180-6. [DOI] [PubMed] [Google Scholar]
- 103.Zeynalova A, et al. Preoperative evaluation of tumour consistency in pituitary macroadenomas: a machine learning-based histogram analysis on conventional T2-weighted MRI. Neuroradiology. 2019;61:767–774. doi: 10.1007/s00234-019-02211-2. [DOI] [PubMed] [Google Scholar]
- 104.Fan Y, et al. Preoperative noninvasive radiomics approach predicts tumor consistency in patients with acromegaly: development and multicenter prospective validation. Front. Endocrinol. 2019;10:403. doi: 10.3389/fendo.2019.00403. [DOI] [PMC free article] [PubMed] [Google Scholar]
- 105.Zhu H, Fang Q, Huang Y, Xu K. Semi-supervised method for image texture classification of pituitary tumors via CycleGAN and optimized feature extraction. BMC Med. Inf. Decis. Mak. 2020;20:215. doi: 10.1186/s12911-020-01230-x. [DOI] [PMC free article] [PubMed] [Google Scholar]
- 106.Yamamoto J, et al. Tumor consistency of pituitary macroadenomas: predictive analysis on the basis of imaging features with contrast-enhanced 3D FIESTA at 3T. Am. J. Neuroradiol. 2014;35:297–303. doi: 10.3174/ajnr.A3667. [DOI] [PMC free article] [PubMed] [Google Scholar]
- 107.Iuchi T, Saeki N, Tanaka M, Sunami K, Yamaura A. MRI prediction of fibrous pituitary adenomas. Acta Neurochir. 1998;140:779–786. doi: 10.1007/s007010050179. [DOI] [PubMed] [Google Scholar]
- 108.Niu J, et al. Preoperative prediction of cavernous sinus invasion by pituitary adenomas using a radiomics method based on magnetic resonance images. Eur. Radiol. 2019;29:1625–1634. doi: 10.1007/s00330-018-5725-3. [DOI] [PMC free article] [PubMed] [Google Scholar]
- 109.Staartjes VE, et al. Neural network-based identification of patients at high risk for intraoperative cerebrospinal fluid leaks in endoscopic pituitary surgery. J. Neurosurg. 2019;133:329–335. doi: 10.3171/2019.4.JNS19477. [DOI] [PubMed] [Google Scholar]
- 110.Kitahara CM, Sosa JA. The changing incidence of thyroid cancer. Nat. Rev. Endocrinol. 2016;12:646–653. doi: 10.1038/nrendo.2016.110. [DOI] [PMC free article] [PubMed] [Google Scholar]
- 111.Cabanillas ME, McFadden DG, Durante C. Thyroid cancer. Lancet. 2016;388:2783–2795. doi: 10.1016/S0140-6736(16)30172-6. [DOI] [PubMed] [Google Scholar]
- 112.Song W, et al. Multitask cascade convolution neural networks for automatic thyroid nodule detection and recognition. IEEE J. Biomed. Health Inf. 2019;23:1215–1224. doi: 10.1109/JBHI.2018.2852718. [DOI] [PubMed] [Google Scholar]
- 113.Li H, et al. An improved deep learning approach for detection of thyroid papillary cancer in ultrasound images. Sci. Rep. 2018;8:6600. doi: 10.1038/s41598-018-25005-7. [DOI] [PMC free article] [PubMed] [Google Scholar]
- 114.Ma J, Wu F, Zhu J, Xu D, Kong D. A pre-trained convolutional neural network based method for thyroid nodule diagnosis. Ultrasonics. 2017;73:221–230. doi: 10.1016/j.ultras.2016.09.011. [DOI] [PubMed] [Google Scholar]
- 115.Lim KJ, et al. Computer-aided diagnosis for the differentiation of malignant from benign thyroid nodules on ultrasonography. Acad. Radiol. 2008;15:853–858. doi: 10.1016/j.acra.2007.12.022. [DOI] [PubMed] [Google Scholar]
- 116.Chi J, et al. Thyroid nodule classification in ultrasound images by fine-tuning deep convolutional neural network. J. Digit. Imaging. 2017;30:477–486. doi: 10.1007/s10278-017-9997-y. [DOI] [PMC free article] [PubMed] [Google Scholar]
- 117.Acharya UR, et al. Non-invasive automated 3D thyroid lesion classification in ultrasound: a class of ThyroScan™ systems. Ultrasonics. 2012;52:508–520. doi: 10.1016/j.ultras.2011.11.003. [DOI] [PubMed] [Google Scholar]
- 118.Tessler FN, et al. ACR thyroid imaging, reporting and data system (TI-RADS): white paper of the ACR TI-RADS Committee. J. Am. Coll. Radiol. 2017;14:587–595. doi: 10.1016/j.jacr.2017.01.046. [DOI] [PubMed] [Google Scholar]
- 119.Zhang B, et al. Machine learning-assisted system for thyroid nodule diagnosis. Thyroid. 2019;29:858–867. doi: 10.1089/thy.2018.0380. [DOI] [PubMed] [Google Scholar]
- 120.Zhu LC, et al. A model to discriminate malignant from benign thyroid nodules using artificial neural network. PLoS One. 2013;8:e82211. doi: 10.1371/journal.pone.0082211. [DOI] [PMC free article] [PubMed] [Google Scholar]
- 121.Song G, Xue F, Zhang C. A model using texture features to differentiate the nature of thyroid nodules on sonography. J. Ultrasound Med. 2015;34:1753–1760. doi: 10.7863/ultra.15.14.10045. [DOI] [PubMed] [Google Scholar]
- 122.Xu L, et al. Computer-aided diagnosis systems in diagnosing malignant thyroid nodules on ultrasonography: a systematic review and meta-analysis. Eur. Thyroid. J. 2020;9:186–193. doi: 10.1159/000504390. [DOI] [PMC free article] [PubMed] [Google Scholar]
- 123.Shi G, et al. Knowledge-guided synthetic medical image adversarial augmentation for ultrasonography thyroid nodule classification. Comput. Methods Prog. Biomed. 2020;196:105611. doi: 10.1016/j.cmpb.2020.105611. [DOI] [PubMed] [Google Scholar]
- 124.Zhao WJ, Fu LR, Huang ZM, Zhu JQ, Ma BY. Effectiveness evaluation of computer-aided diagnosis system for the diagnosis of thyroid nodules on ultrasound: a systematic review and meta-analysis. Medicine. 2019;98:e16379. doi: 10.1097/MD.0000000000016379. [DOI] [PMC free article] [PubMed] [Google Scholar]
- 125.Buda M, et al. Management of thyroid nodules seen on US images: deep learning may match performance of radiologists. Radiology. 2019;292:695–701. doi: 10.1148/radiol.2019181343. [DOI] [PMC free article] [PubMed] [Google Scholar]
- 126.Jeong EY, et al. Computer-aided diagnosis system for thyroid nodules on ultrasonography: diagnostic performance and reproducibility based on the experience level of operators. Eur. Radiol. 2019;29:1978–1985. doi: 10.1007/s00330-018-5772-9. [DOI] [PubMed] [Google Scholar]
- 127.Sollini M, Cozzi L, Chiti A, Kirienko M. Texture analysis and machine learning to characterize suspected thyroid nodules and differentiated thyroid cancer: where do we stand? Eur. J. Radiol. 2018;99:1–8. doi: 10.1016/j.ejrad.2017.12.004. [DOI] [PubMed] [Google Scholar]
- 128.Choi YJ, et al. A computer-aided diagnosis system using artificial intelligence for the diagnosis and characterization of thyroid nodules on ultrasound: initial clinical assessment. Thyroid. 2017;27:546–552. doi: 10.1089/thy.2016.0372. [DOI] [PubMed] [Google Scholar]
- 129.Daniels K, et al. Machine learning by ultrasonography for genetic risk stratification of thyroid nodules. JAMA Otolaryngol. Head Neck Surg. 2020;146:36–41. doi: 10.1001/jamaoto.2019.3073. [DOI] [PMC free article] [PubMed] [Google Scholar]
- 130.Kosilek RP, et al. Diagnostic use of facial image analysis software in endocrine and genetic disorders: review, current results and future perspectives. Eur. J. Endocrinol. 2015;173:M39–44. doi: 10.1530/EJE-15-0429. [DOI] [PubMed] [Google Scholar]
- 131.Kong X, Gong S, Su L, Howard N, Kong Y. Automatic detection of acromegaly from facial photographs using machine learning methods. EBioMedicine. 2018;27:94–102. doi: 10.1016/j.ebiom.2017.12.015. [DOI] [PMC free article] [PubMed] [Google Scholar]
- 132.Schneider HJ, et al. A novel approach to the detection of acromegaly: accuracy of diagnosis by automatic face classification. J. Clin. Endocrinol. Metab. 2011;96:2074–2080. doi: 10.1210/jc.2011-0237. [DOI] [PubMed] [Google Scholar]
- 133.Kosilek RP, et al. Automatic face classification of Cushing’s syndrome in women — a novel screening approach. Exp. Clin. Endocrinol. Diabetes. 2013;121:561–564. doi: 10.1055/s-0033-1349124. [DOI] [PubMed] [Google Scholar]
- 134.Popp KH, et al. Computer vision technology in the differential diagnosis of Cushing’s syndrome. Exp. Clin. Endocrinol. Diabetes. 2019;127:685–690. doi: 10.1055/a-0887-4233. [DOI] [PubMed] [Google Scholar]
- 135.Dal J, et al. Disease control and gender predict the socioeconomic effects of acromegaly: a nationwide cohort study. J. Clin. Endocrinol. Metab. 2020;105:2975–2982. doi: 10.1210/clinem/dgaa405. [DOI] [PubMed] [Google Scholar]
- 136.Gkourogianni A, et al. Pediatric Cushing disease: disparities in disease severity and outcomes in the Hispanic and African-American populations. Pediatr. Res. 2017;82:272–277. doi: 10.1038/pr.2017.58. [DOI] [PMC free article] [PubMed] [Google Scholar]
- 137.Lambin P, et al. Radiomics: the bridge between medical imaging and personalized medicine. Nat. Rev. Clin. Oncol. 2017;14:749–762. doi: 10.1038/nrclinonc.2017.141. [DOI] [PubMed] [Google Scholar]
- 138.Mongan J, Moy L, Kahn CE., Jr Checklist for artificial intelligence in medical imaging (CLAIM): a guide for authors and reviewers. Radiol. Artif. Intell. 2020;2:e200029. doi: 10.1148/ryai.2020200029. [DOI] [PMC free article] [PubMed] [Google Scholar]
- 139.Liu X, Cruz Rivera S, Moher D, Calvert MJ, Denniston AK. Reporting guidelines for clinical trial reports for interventions involving artificial intelligence: the CONSORT-AI extension. Nat. Med. 2020;26:1364–1374. doi: 10.1038/s41591-020-1034-x. [DOI] [PMC free article] [PubMed] [Google Scholar]
- 140.Miotto R, Wang F, Wang S, Jiang X, Dudley JT. Deep learning for healthcare: review, opportunities and challenges. Brief. Bioinform. 2018;19:1236–1246. doi: 10.1093/bib/bbx044. [DOI] [PMC free article] [PubMed] [Google Scholar]
- 141.Topol EJ. High-performance medicine: the convergence of human and artificial intelligence. Nat. Med. 2019;25:44–56. doi: 10.1038/s41591-018-0300-7. [DOI] [PubMed] [Google Scholar]
- 142.Wang F, Kaushal R, Khullar D. Should health care demand interpretable artificial intelligence or accept “Black Box” Medicine? Ann. Intern. Med. 2019;172:59–60. doi: 10.7326/M19-2548. [DOI] [PubMed] [Google Scholar]
- 143.Murdoch WJ, Singh C, Kumbier K, Abbasi-Asl R, Yu B. Definitions, methods, and applications in interpretable machine learning. Proc. Natl Acad. Sci. USA. 2019;116:22071–22080. doi: 10.1073/pnas.1900654116. [DOI] [PMC free article] [PubMed] [Google Scholar]
- 144.Reyes M, et al. On the interpretability of artificial intelligence in radiology: challenges and opportunities. Radiol. Artif. Intell. 2020;2:e190043. doi: 10.1148/ryai.2020190043. [DOI] [PMC free article] [PubMed] [Google Scholar]
- 145.Chattopadhay A, Sarkar A, Howlader P, Balasubramanian VN. Grad-CAM++: generalized gradient-based visual explanations for deep convolutional networks. IEEE Winter Conf. Appl. Comput. Vis. 2018 doi: 10.1109/WACV.2018.00097. [DOI] [Google Scholar]
- 146.Ribeiro, M. T., Singh, S. & Guestrin, C. Why Should I Trust You?: Explaining the Predictions of Any Classifier. in Proceedings of the 22nd ACM SIGKDD International Conference on Knowledge Discovery and Data Mining. 1135-1144 (Association for Computing Machinery, 2016).
- 147.Akkus, Z. et al. Reduction of Unnecessary Thyroid Biopsies using Deep Learning. Vol. 10949 MI (SPIE, 2019).
- 148.Pereira S, et al. Enhancing interpretability of automatically extracted machine learning features: application to a RBM-Random Forest system on brain lesion segmentation. Med. Image Anal. 2018;44:228–244. doi: 10.1016/j.media.2017.12.009. [DOI] [PubMed] [Google Scholar]
- 149.Natekar P, Kori A, Krishnamurthi G. Demystifying brain tumor segmentation networks: interpretability and uncertainty analysis. Front. Comput. Neurosci. 2020;14:6. doi: 10.3389/fncom.2020.00006. [DOI] [PMC free article] [PubMed] [Google Scholar]
- 150.Philbrick KA, et al. What does deep learning see? Insights from a classifier trained to predict contrast enhancement phase from CT images. Am. J. Roentgenol. 2018;211:1184–1193. doi: 10.2214/AJR.18.20331. [DOI] [PubMed] [Google Scholar]
- 151.Thomas J, Haertling T. AIBx, artificial intelligence model to risk stratify thyroid nodules. Thyroid. 2020;30:878–884. doi: 10.1089/thy.2019.0752. [DOI] [PubMed] [Google Scholar]
- 152.Gallego-Ortiz C, Martel AL. Using quantitative features extracted from T2-weighted MRI to improve breast MRI computer-aided diagnosis (CAD) PLoS One. 2017;12:e0187501. doi: 10.1371/journal.pone.0187501. [DOI] [PMC free article] [PubMed] [Google Scholar]
- 153.Gale W, Oakden-Rayner L, Carneiro G, Palmer LJ, Bradley AP. Producing radiologist-quality reports for interpretable deep learning. IEEE Int. Symp. Biomed. Imaging. 2019 doi: 10.1109/ISBI.2019.8759236. [DOI] [Google Scholar]
- 154.Wu F, et al. A new coronavirus associated with human respiratory disease in China. Nature. 2020;579:265–269. doi: 10.1038/s41586-020-2008-3. [DOI] [PMC free article] [PubMed] [Google Scholar]
- 155.Shuja J, Alanazi E, Alasmary W, Alashaikh A. COVID-19 open source data sets: a comprehensive survey. Appl. Intell. 2021;51:1296–1325. doi: 10.1007/s10489-020-01862-6. [DOI] [PMC free article] [PubMed] [Google Scholar]
- 156.Bai HX, Thomasian NM. RICORD: a precedent for open AI in COVID-19 image analytics. Radiology. 2021;299:E219–E220. doi: 10.1148/radiol.2020204214. [DOI] [PMC free article] [PubMed] [Google Scholar]
- 157.Marcus DS, Olsen TR, Ramaratnam M, Buckner RL. The extensible neuroimaging archive toolkit: an informatics platform for managing, exploring, and sharing neuroimaging data. Neuroinformatics. 2007;5:11–34. doi: 10.1385/ni:5:1:11. [DOI] [PubMed] [Google Scholar]
- 158.Dao T, et al. A kernel theory of modern data augmentation. Proc. Mach. Learn. Res. 2019;97:1528–1537. [PMC free article] [PubMed] [Google Scholar]
- 159.Hussain Z, Gimenez F, Yi D, Rubin D. Differential data augmentation techniques for medical imaging classification tasks. AMIA Annu. Symp. Proc. 2017;2017:979–984. [PMC free article] [PubMed] [Google Scholar]
- 160.Deepak S, Ameer PM. Brain tumor classification using deep CNN features via transfer learning. Comput. Biol. Med. 2019;111:103345. doi: 10.1016/j.compbiomed.2019.103345. [DOI] [PubMed] [Google Scholar]
- 161.Shin HC, et al. Deep convolutional neural networks for computer-aided detection: CNN architectures, dataset characteristics and transfer learning. IEEE Trans. Med. Imaging. 2016;35:1285–1298. doi: 10.1109/TMI.2016.2528162. [DOI] [PMC free article] [PubMed] [Google Scholar]
- 162.Sheller MJ, et al. Federated learning in medicine: facilitating multi-institutional collaborations without sharing patient data. Sci. Rep. 2020;10:12598. doi: 10.1038/s41598-020-69250-1. [DOI] [PMC free article] [PubMed] [Google Scholar]
- 163.Chang K, et al. Distributed deep learning networks among institutions for medical imaging. J. Am. Med. Inf. Assoc. 2018;25:945–954. doi: 10.1093/jamia/ocy017. [DOI] [PMC free article] [PubMed] [Google Scholar]
- 164.Sheller MJ, Reina GA, Edwards B, Martin J, Bakas S. Multi-institutional deep learning modeling without sharing patient data: a feasibility study on brain tumor segmentation. Brainlesion. 2019;11383:92–104. doi: 10.1007/978-3-030-11723-8_9. [DOI] [PMC free article] [PubMed] [Google Scholar]
- 165.Biamonte J, et al. Quantum machine learning. Nature. 2017;549:195–202. doi: 10.1038/nature23474. [DOI] [PubMed] [Google Scholar]
- 166.Arute F, et al. Quantum supremacy using a programmable superconducting processor. Nature. 2019;574:505–510. doi: 10.1038/s41586-019-1666-5. [DOI] [PubMed] [Google Scholar]
- 167.Princeton University Center for Information Technology Policy. Implications of quantum computing for encryption policy. CEIP. https://carnegieendowment.org/2019/04/25/implications-of-quantum-computing-for-encryption-policy-pub-78985 (2019).
- 168.Smets E, et al. Large-scale wearable data reveal digital phenotypes for daily-life stress detection. NPJ Digital Med. 2018;1:67. doi: 10.1038/s41746-018-0074-9. [DOI] [PMC free article] [PubMed] [Google Scholar]
- 169.Tuncer SA, Alkan A. Segmentation of thyroid nodules with K-means algorithm on mobile devices. IEEE Int. Symp. Biomed. Imaging. 2015 doi: 10.1109/CINTI.2015.7382947. [DOI] [Google Scholar]
- 170.Ma J, et al. Efficient deep learning architecture for detection and recognition of thyroid nodules. Comput. Intell. Neurosci. 2020;2020:1242781. doi: 10.1155/2020/1242781. [DOI] [PMC free article] [PubMed] [Google Scholar]
- 171.Poudel P, Illanes A, Sheet D, Friebe M. Evaluation of commonly used algorithms for thyroid ultrasound images segmentation and improvement using machine learning approaches. J. Healthc. Eng. 2018;2018:8087624. doi: 10.1155/2018/8087624. [DOI] [PMC free article] [PubMed] [Google Scholar]
- 172.Shin HC, Orton MR, Collins DJ, Doran SJ, Leach MO. Stacked autoencoders for unsupervised feature learning and multiple organ detection in a pilot study using 4D patient data. IEEE Trans. Pattern Anal. Mach. Intell. 2013;35:1930–1943. doi: 10.1109/TPAMI.2012.277. [DOI] [PubMed] [Google Scholar]
- 173.Song J, et al. Ultrasound image analysis using deep learning algorithm for the diagnosis of thyroid nodules. Medicine. 2019;98:e15133. doi: 10.1097/MD.0000000000015133. [DOI] [PMC free article] [PubMed] [Google Scholar]
- 174.Wang H, et al. Machine learning-based multiparametric MRI radiomics for predicting the aggressiveness of papillary thyroid carcinoma. Eur. J. Radiol. 2020;122:108755. doi: 10.1016/j.ejrad.2019.108755. [DOI] [PubMed] [Google Scholar]
- 175.Haugen BR, et al. 2015 American Thyroid Association Management Guidelines for Adult Patients with Thyroid Nodules and Differentiated Thyroid Cancer: The American Thyroid Association Guidelines Task Force on Thyroid Nodules and Differentiated Thyroid Cancer. Thyroid. 2016;26:1–133. doi: 10.1089/thy.2015.0020. [DOI] [PMC free article] [PubMed] [Google Scholar]
- 176.Yi T, et al. DICOM Image Analysis and Archive (DIANA): an open-source system for clinical AI applications. J. Digit. Imaging. 2021 doi: 10.1007/s10278-021-00488-5. [DOI] [PMC free article] [PubMed] [Google Scholar]
- 177.Perseguers S, Lewenstein M, Acín A, Cirac JI. Quantum random networks. Nat. Phys. 2010;6:539–543. [Google Scholar]
- 178.Biamonte J, Faccin M, De Domenico M. Complex networks from classical to quantum. Commun. Phys. 2019;2:53. [Google Scholar]
Associated Data
This section collects any data citations, data availability statements, or supplementary materials included in this article.
Data Availability Statement
Abundant medical imaging data is needed to develop clinically meaningful deep learning models for non-invasive endocrine cancer diagnostics, capable of generalizing to a variety of clinical settings. In this section, we discuss techniques to increase the availability of data to prevent overfitting in AI models.
Open data curation
A lack of high volume, quality data impedes the development of robust AI in endocrine cancer diagnosis. One strategy to improve data for use by machine learning models is through improved sharing of existing data via the creation of open databases. The ongoing coronavirus disease 2019 pandemic has highlighted the role of open science in enabling timely advances in medical research, a movement that we should strive to foster outside of crisis scenarios154–156. In terms of medical imaging specifically, open data can be used either for training and development of models or as external test sets. Some examples would be the US National Institute of Health Cancer Imaging Archive and the UK Biobank, the latter of which expanded its archive in 2020 to include an imaging database with pan-MRI and DXA scans on >5,000 patients.
Automated workflow
AI integration can be targeted through automated pipelines (including XNAT or DICOM Image Analytics and Archive) that can reduce latency in data retrieval through improved integration with existing health-care infrastructure157 (Fig. 4). These tools can uncouple imaging data in Picture Archiving and Communications Systems from protected health information following image acquisition for use by AI models for near-real-time processing. From there, these imaging findings can be conveyed using automatic workflow interfaces connected with the electronic medical record as a central hub for coordination among endocrinologists, radiologists and other care team members. Looking ahead, we envision the deployment of these automated workflow pipelines to facilitate real-time analytics that endocrinologists can access rapidly at the bedside via smartphone-based imaging viewing platforms or portable imaging devices.
Fig. 4. Real-time analytics with automatic picture archiving and communications systems integration.
The system named DICOM Image Analysis and Archive (DIANA) is an automated workflow solution developed by the authors’ group that provides a programming interface with the hospital picture archiving and communications systems (PACS) to streamline clinical artificial intelligence (AI) research176. DIANA has facilitated near-real-time monitoring of acquired images, large data queries and post-processing analyses. More importantly, DIANA is integrated with the machine learning algorithms developed for various applications. The future goal is to integrate AI endocrine cancer diagnostics (such as adrenal adenoma and pituitary adenoma) in this or other systems. HTTP, hypertext transfer protocol; PHI, protected health information. Figure 4 is adapted from ref.176, Springer Nature Limited.
Data augmentation and transfer learning
Data pre-processing and model pre-training techniques can also be used to engineer workaround solutions to limited imaging data in order to improve AI model generalizability32. Data augmentation is a process that distorts the training images via oversampling to generate synthetic data158,159. Another popular option in computer vision for treating small sample sizes involves pre-training of the model with a large and diverse image set to transfer preliminary weights to nodes in the network, after which fine-tuning of the model is performed using the target data160,161. Although these augmentation and transfer learning (Box 1) methods are now becoming staples in medical image informatics research, they were not used in a number of the endocrine cancer studies that we reviewed. Looking ahead, we anticipate that improved uptake of these methods will promote deep learning breakthroughs, particularly in the cases of rare neoplasms with limited availability of imaging data such as those of the adrenal gland and endocrine pancreas.