Abstract
Background
The incidence of esophageal cancer (ESCA) is increasing rapidly, and the 5-year survival rate is less than 20%. This study provides new ideas for clinical treatment by establishing a prognostic signature composed of immune-related genes (IRGs), and fully analyzing its relationship with target genes and the tumor microenvironment (TME).
Methods
We downloaded the ESCA expression matrix and clinical information from The Cancer Genome Atlas (TCGA) database. Differential expression genes (DEGs) were identified with the edgeR package and crossed with the IRGs we obtained from the ImmPort database to obtain differential IRGs (DEIRGs). The prognostic signature was then obtained through univariate Cox, LASSO-Cox, and multivariate Cox analyses. The receiver operating characteristic (ROC) curve was used to evaluate the prediction effect of the model. The immune cell infiltration abundance obtained by ssGSEA and therapeutic target genes was used to perform sufficient correlation analysis with the obtained prognostic signature and related genes.
Results
A total of 173 samples were obtained from TCGA database, including 162 tumor and 11 normal samples. The 3,033 differential genes were used to obtain 254 DEIRGs by intersections with 2,483 IRGs (IRGs) obtained from the ImmPort Database. Finally, multivariate Cox regression analysis identified eight prognostic DEIRGs and established a new prognostic signature (HR: 2.49, 95% CI: 1.68–3.67; P<0.001). Based on the expression of the eight genes, the cohort was then divided into high and low risk groups and Kaplan-Meier (K-M) curves were plotted with the log-rank test P<0.0001 and 1-, 3-year area under the curve (AUC) >0.7. The K-M curves grouped according to high and low risks performed well in the two subgroup validation cohorts, with log-rank test P<0.05. There were differences in the degree of infiltration of 16 kinds of immune cells in tumor and normal samples, and the infiltration abundance of 12 kinds of immune cells was different in the high and low-risk groups.
Conclusions
An effective and validated prognostic signature composed of IRGs was established and had a strong correlation with immune cells and target genes of drug therapy.
Keywords: Esophageal cancer (ESCA), prognostic signature, infiltrating immune cells, target genes
Introduction
Esophageal cancer (ESCA) is a common gastrointestinal tumor, with the seventh highest incidence and sixth highest mortality worldwide (1). According to its pathological types, ESCA can be divided into squamous cell carcinoma (SCC) and adenocarcinoma (AC). The incidence of SCC, which accounts for 90% of ESCA, occurs mostly in low-income developing countries, while that of AC, which is more common in developed countries, is rapidly increasing (2). It is important to note that although several treatments are available for ESCA, survival rates, remain poor (3), with an overall five-year survival rate of less than 20% (4), and five-year survival rate after surgery only around 50% (5-7), mainly due to distant metastasis and the development of resistance to chemoradiotherapy (8). Therefore, there is an urgent need to develop new and effective treatments, including targeted therapy.
Escape from the immune system has been shown to be an important mechanism in tumor development (9). Through the expression of programmed death-ligand 1 (PD-L1), the well-known programmed death 1 (PD-1) signaling pathway involves binding to the PD-1 receptor of immune effector cells to inhibit the killing effect of immune cells on tumor cells (10). Moreover, studies have shown that overexpression of PD-L1 is associated with poor prognosis (11). In addition, programmed death-ligand 2 (PD-L2) also plays the role of an immunosuppressor by activating the PD-1 receptor to induce T cell failure, and PD-L2 has a higher affinity with PD-1 than PD-L1 (12). Furthermore, cytotoxic T lymphocyte-associated antigen-4 (CTLA-4) competently combines with B7 from antigen-presenting cells (APCs), and inhibition of the co-stimulatory signal produced by the combination of CD28 and B7 reduces the T cell immune response (13). Immune checkpoint inhibitors (ICIs) targeting these immune checkpoints have shown superior efficacy in many tumors, especially malignant melanoma and non-small cell lung cancer (14). Colorectal immune scores based on the T cell markers CD3 and CD8 have also been shown to have great prognostic potential (15). However, the role of ICIs in advanced ESCA seems uncertain. While the only first-line targeted drug recommended in the National Comprehensive Cancer Network (NCCN) guidelines is the receptor tyrosine-protein kinase ERbb-2 (HER-2) inhibitor, Trastuzumab, combined with chemotherapy (16), the main problem with the unsatisfactory effect of targeted therapy on ESCA is the heterogeneity of the tumor and the difference between individual cases. Better differentiation of individual prognostic differences will contribute to the advancement of precision therapy in the future.
The tumor microenvironment (TME) is a complex ecosystem that has been extensively studied and includes a variety of cells, extracellular matrix (ECM), and informational factors (17), as well as immunosuppressive cell infiltrates such as regulatory T (Treg) cells, myeloid derived suppressor cells (MDSCs), and tumor-associated macrophages (TAMs) (18,19). In the process of tumor occurrence and development, the complex information network composed of related factors promotes tumor cells to evade the examination and hunting of the immune system, and even develop resistance to radiotherapy and chemotherapy (20). And it is worth noting that MDSCs could be associated with advanced disease, poor prognosis and therapeutic resistance in ESCA (19). Vacchelli et al. found that the density of Tregs was not only related to pathological responses, but also to cancer-specific survival rates in patients with esophageal cancer receiving neoadjuvant therapy (21). The role of TAMs in the development of ESCA was considered to be the activation of STAT3 pathway and promotion of M2 macrophage polarization (22). While immune-related genes (IRGs) have been shown to predict prognosis in a variety of cancers (23-26), few studies have been able to comprehensively explore the relationship between the characteristics of the TME in tumor tissues or its relationship with prognostic models, especially some popular gene targets and immune checkpoint related genes. Similarly, Guo et al. established a new prognostic signature of immune-related genes (26). Unfortunately, this study did not validate this signature, even within the TCGA cohort. What’s more, related analysis about TME scores or gene targets was not included.
In view of the current uncertainty of ESCA molecular therapy, this study attempted to establish a prognosis model of IRGs by obtaining ESCA transcriptome data from The Cancer Genome Atlas (TCGA), a public database, and fully explore the relationship between related genes and TME and immune checkpoints. This study will provide a basis for precise molecular therapy in the future. We present the following article in accordance with the TRIPOD reporting checklist (available at https://dx.doi.org/10.21037/atm-21-4756).
Methods
Data acquisition and processing
We obtained ESCA gene transcription group (count) data, DNA mutation data, and corresponding clinical information, including gender, age, tumor stage, and survival information from TCGA database (https://portal.gdc.cancer.gov/). In addition, we obtained immune related genes from the Immunology Database and Analysis Portal (ImmPort, https://www.immport.org/home), which provides an open access for download, including 2,483 IRGs to date. We then performed differential analysis of the transcriptome data between tumor tissue and normal samples using the “edgeR” package (27), using the standard P<0.05 and |logFC|>1.5. The intersection of the obtained differential expression genes (DEGs) and immune genes was obtained and displayed in a Venn diagram, and all the following analyses were based on these differential IRGs (DEIRGs). The study was conducted in accordance with the Declaration of Helsinki (as revised in 2013).
Functional annotations and signaling pathway enrichment analysis
To explore the biological functions and functional signaling pathways of DEIRGs, we utilized the “ClusterPorfiler” package (28) to perform the Gene Ontology (GO) annotation and Kyoto Encyclopedia of Genes and Genomes (KEGG) pathway Enrichment analysis, where GO divides gene function into cellular component (CC), molecular function (MF) and biological process (BP). The “GOplot” package (29) was also used to visualize the significant results (P<0.05).
Construction and validation of the DEIRGs prognostic signature
With the aim of establishing a DEIRGs prognostic signature to predict and differentiate the outcomes of patients with cancer, a univariate Cox regression analysis was first used to screen prognostic factors. The IRGs with P less than 0.05 were subsequently included in the Least Absolute Selection Operator (LASSO) Cox, which further screened the best gene combination. Multivariate Cox regression analysis was then used to select independent prognostic genes and establish a prognostic signature. The calculation formula of this model was:
| [1] |
Coefi was the regression coefficient in multivariate COX regression, and Expi represented the expression of the gene. We then extracted the optimal cut-off value of the risk score using the “survminer” and “survival” packages and divided the tumor cohort into high risk and low risk groups according to the cut-off value. Kaplan-Meier (K-M) curves were then plotted in the high and low-risk groups, and based on the expression of each gene in the signature. Time-dependent receiver operating characteristic (ROC) curves were applied to evaluate the predictive ability of the IRGs signature using the “timeROC” package, and to internally verify the accuracy of the signature, we used the “ConsensusClusterPlus” package to divide tumor samples into different subtypes. The algorithm was to extract a certain sample data set by a re-sampling method, specify the number of clusters K, and calculate the rationality under a different number of clusters (PAC method). K-M survival curves and time-dependent ROC were used to verify this model in each subtype. Nomogram modeling, which provided the survival probability and evaluated the predictive probability of 1-, 3- and 5-year OS, was then established using the “rms” package including the risk score and relevant clinical characteristics.
Explorations of associations between signature and TME
As the single-sample gene-set enrichment analysis (ssGSEA) (30), which was a robust method, calculates the degree of immune cell infiltration from the gene expression of each sample in a given data set, we used the “GSVA” package (31) to assess the abundance of immune cell infiltration in tumor samples (30). The 24 human TME cell subtypes were memory B cells, naive B cells, activated dendritic cells, resting dendritic cells, endothelial cells, eosinophils, fibroblasts, M0 macrophages, M1 macrophages, M2 macrophages, activated mast cells, resting mast cells, monocytes, neutrophils, activated natural killer (NK) cells, resting NK cells, plasma cells, activated CD4 memory T cells, resting CD4 memory T cells, naive CD4 T cells, CD8 T cells, follicular helper T cells, gamma delta T cells, and Treg cells. Subsequently, the “ggplot2” and “Corrplot” packages were used to visualize the relationship between the risk score, each prognostic gene and immune cell, or immune checkpoints. The “Estimation of STromal and Immune cells in MAlignant Tumours using Expression data” (ESTIMATE) algorithm (32), based on ssGSEA, scored the samples of stromal and immune gene sets in the gene expression matrix to control the bias caused by tumor purity. We discussed the difference between high and low-risk scores or tumor and normal tissue according to the two scoring modes.
Statistical analysis
Overall survival was calculated using the Kaplan-Meier method and the log-rank test by the survival R package. Time-dependent ROC curves were plotted by the “timeROC” package, and the boot-strap method was used to compare the signature for the area under the ROC (AUC) curve. The Wilcoxon test was used to conduct the difference analyses between two groups, and the correlation tests were based on the Spearman and distance correlation analyses. The LASSO-Cox analysis, univariate, and multivariate Cox regression were utilized to calculate the hazard ratios (HR) and 95% confidence interval (CI), and a P value less than 0.05 was considered significant. All statistical analyses were performed by R 4.0.2 version.
Results
Identification and enrichment analysis of DEIRGs in ESCA patients
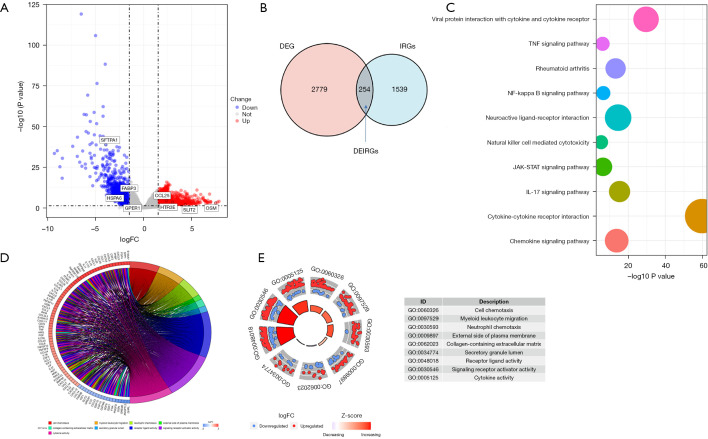
A total of 173 samples were downloaded from TCGA, including 162 tumor samples and 11 normal samples, and by excluding those with missing survival information, we obtained 160 tumor and 11 normal samples with complete clinical information. The mean age of the cohort was 62±12, with 137 males (85.6%) and only 23 females (14.4%). Other baseline data are shown in Table 1. A total of 3,033 DEGs were screened by |logFC|>1.5 P<0.05, including 1,855 up-regulated and 1,178 down-regulated genes, and the volcanic map (Figure 1A) shows the distribution of the DEGs. After removing duplicates, 1,793 independent IRGs and DEGs were calculated for the intersection, as shown in the Venn plot (Figure 1B), and 254 DEIRGs were finally obtained. GO and KEGG enrichment analysis showed that DEIRGs were mainly involved in the activation, migration, and cytokine-cytokine receptor interactions of immune cells (Figure 1C-1E), which suggested these differential genes may be involved in tumor-associated immune escape.
Table 1. Clinical characteristics of the cohort and two subtype clusters.
| Variables | The cohort (n=160) | Cluster 1 (n=82) | Cluster 2 (n=78) |
|---|---|---|---|
| Age (mean ± SD) | 62±12 | 58±11 | 67±11 |
| Gender (n, %) | |||
| Male | 137 (85.6) | 71 (86.6) | 66 (84.6) |
| Female | 23 (14.4) | 11 (13.4) | 12 (15.4) |
| Race (n, %) | |||
| White | 99 (61.9) | 40 (48.8) | 59 (75.6) |
| Asian | 38 (23.8) | 35 (42.7) | 3 (3.8) |
| Black or African American | 5 (3.1) | 5 (6.1) | 0 (0) |
| Unknown | 18 (11.3) | 2 (2.4) | 16 (20.5) |
| Grade (n, %) | |||
| G1 | 16 (10.0) | 15 (18.3) | 1 (1.3) |
| G2 | 66 (41.3) | 40 (48.8) | 26 (33.3) |
| G3 | 43 (26.9) | 17 (20.7) | 26 (33.3) |
| Unknown | 35 (21.9) | 10 (12.2) | 25 (32.1) |
| AJCC T (n, %) | |||
| T0–T2 | 65 (40.6) | 35 (42.7) | 30 (38.5) |
| T3–T4 | 80 (50.0) | 43 (52.5) | 37 (47.5) |
| Unknown | 15 (9.4) | 4 (4.9) | 11 (14.1) |
| AJCC N (n, %) | |||
| N0 | 65 (40.6) | 44 (53.7) | 21 (26.9) |
| N1–N3 | 78 (48.8) | 33 (40.2) | 45 (57.6) |
| Unknown | 17 (10.7) | 5 (6.1) | 12 (15.4) |
| AJCC M (n, %) | |||
| M0 | 121 (75.6) | 70 (85.4) | 51 (65.4) |
| M1 | 8 (5.0) | 2 (2.4) | 6 (7.7) |
| Unknown | 31 (19.3) | 10 (12.2) | 21 (26.9) |
| Pathological stage (n, %) | |||
| Stage I | 16 (10.0) | 7 (8.5) | 9 (11.5) |
| Stage II | 68 (42.5) | 45 (54.9) | 23 (29.5) |
| Stage III | 49 (30.6) | 23 (28.0) | 26 (33.3) |
| Stage IV | 8 (5.0) | 2 (2.4) | 6 (7.7) |
| Unknown | 19 (11.9) | 5 (6.1) | 14 (17.9) |
| Status (n, %) | |||
| Alive | 97 (60.6) | 56 (68.3) | 41 (52.6) |
| Death | 63 (39.4) | 26 (31.7) | 37 (47.4) |
| Follow-up (m) (mean ± SD) | 18.1±14.5 | 17.6±13.1 | 18.6±16.0 |
AJCC, American Joint Committee on Cancer.
Figure 1.
Expression of DEGs and function enrichment of DEIRGs. (A) Volcano plot of DEGs and eight genes of the signature; (B) 254 DEIRGs, the intersection of DEGs, and immune-related genes obtained from the ImmPort database; (C) KEGG enrichment analysis of 254 DEIRGs; (D,E) Results of GO enrichment analysis of DEIRGs. DEGs, differentially expressed genes; DEIRGs, differentially expressed immune-related genes; KEGG, Kyoto Encyclopedia of Genes and Genomes; GO, Gene Ontology.
Establishment and validation of the DEIRGs prognostic signature
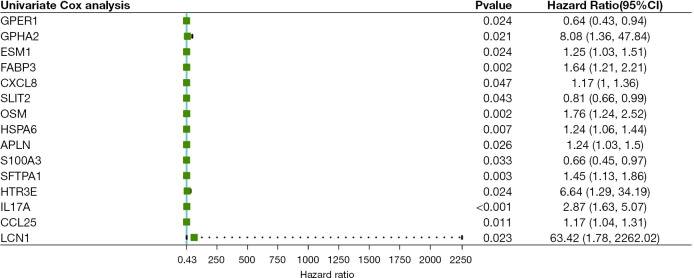
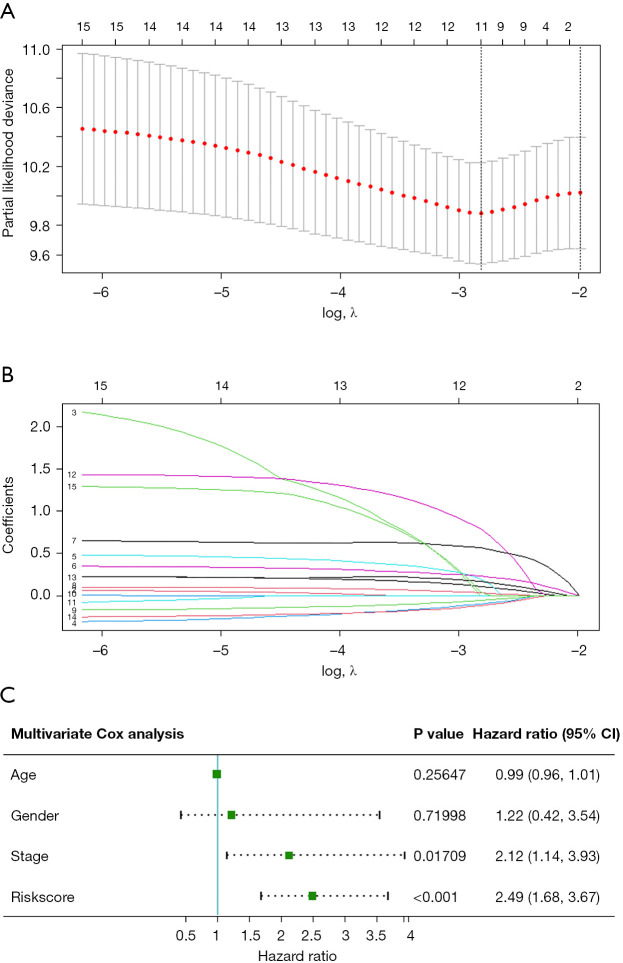
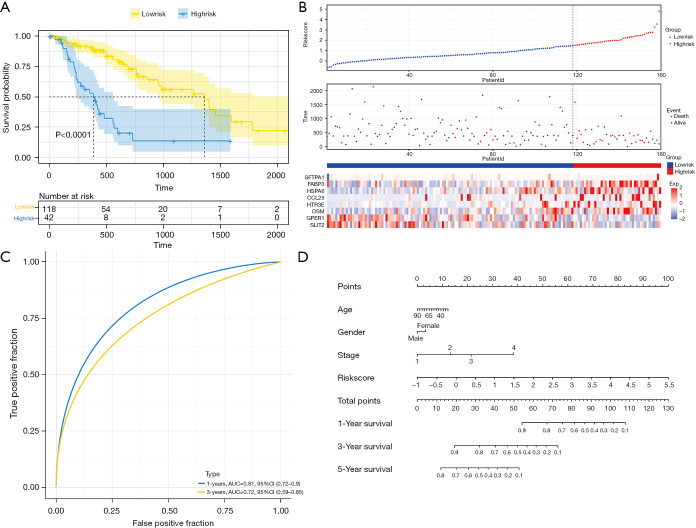
Univariate Cox regression analysis results of DEIRGs (Figure 2) saw fifteen survival-related genes screened by a standard of P<0.05. We then used a Lasso-Cox algorithm (Figure 3A,3B) and multivariate Cox regression analysis to select eight IRGs as the final gene set for signature construction (Table 2). The regression coefficient and gene expression of the multivariate regression model were used to calculate the risk score, and the formula was: risk score = (expression of SFTPA1 × 0.4806245) + (expression of FABP3 × 0.4282553) + (expression of HSPA6 × 0.2042443) + (expression of CCL25 × 0.1315460) − (expression of SLIT2 × 0.2446679) + (expression of HTR3E × 1.9927509) + (expression of OSM × 0.4296963) − (expression of GPER1 × 0.2632006). Multivariate Cox regression analysis including age, gender, stage, and the risk score showed that stage (HR: 2.1187, 95% CI: 1.1431–3.927, P=0.01709) and the risk score (HR: 2.4854, 95% CI: 1.6833–3.670, P<0.001) were independent risk factors in the TCGA-ESCA cohort (Figure 3C). We then calculated the best cut-off value of the risk score (Figure S1) using the “SurvMiner” package and found the distinction was best when the Cutpoint was 1.52, so the risk score was divided into two groups based on this value. The K-M curve showed a significant difference in prognosis between the high and low-risk groups (P<0.0001, Figure 4A), and the risk pattern diagram (Figure 4B) also showed the number of patients who died increased as the risk increased. Results of the ROC curve showed that the signature of these eight genes had a good prediction, and the area under the curve (AUC) values of 1 year and 3 years were above 0.7 (Figure 4C). To individualize prognosis prediction, we produced a nomogram which obtained prognosis scores according to clinical features and the level of the signature, and accurately quantified prognosis results (Figure 4D).
Figure 2.
Results of univariate Cox analysis of DEIRGs. CI, confidence interval; DEIRGs, differentially expressed immune-related genes.
Figure 3.
Construction of a prognostic signature. (A,B) LASSO-Cox regression analysis was conducted to find 11 genes before multivariate Cox analysis; (C) results of multivariate Cox analysis of the signature including eight genes and other clinical characteristics.
Table 2. Multivariate Cox regression analysis of the eight immune-related genes.
| Gene | Coef | HR | 95% CI | P value |
|---|---|---|---|---|
| SFTPA1 | 0.4806245 | 1.6171 | 1.2524–2.0880 | <0.001 |
| FABP3 | 0.4282553 | 1.5346 | 1.0922–2.1561 | 0.01357 |
| HSPA6 | 0.2042443 | 1.2266 | 1.0452–1.4394 | 0.01236 |
| CCL25 | 0.1315460 | 1.1406 | 0.9986–1.3028 | 0.05246 |
| SLIT2 | -0.2446679 | 0.7830 | 0.6222–0.9853 | 0.03699 |
| HTR3E | 1.9927509 | 7.3357 | 1.2591–42.7395 | 0.02668 |
| OSM | 0.4296963 | 1.5368 | 1.0489–2.2517 | 0.02747 |
| GPER1 | -0.2632006 | 0.7686 | 0.5111–1.1558 | 0.20609 |
Coef, coefficient; HR, hazard ration; CI, confidence interval.
Figure 4.
Prognostic value of the immune-related risk score and establishment of the nomogram (A) Kaplan-Meier curves showed the group of high-risk had a worse overall survival; (B) distribution of the risk score, relationship between survival status, and risk score and expression of risk genes in the high-risk group and low-risk group; (C) 1- and 3-year AUC of ROC curves of prognostic signature in the whole cohort; (D) nomogram of ESCA based on the signature and other clinical characteristics. AUC, area under the curve; ROC, receiver operating characteristic; ESCA, esophageal cancer.
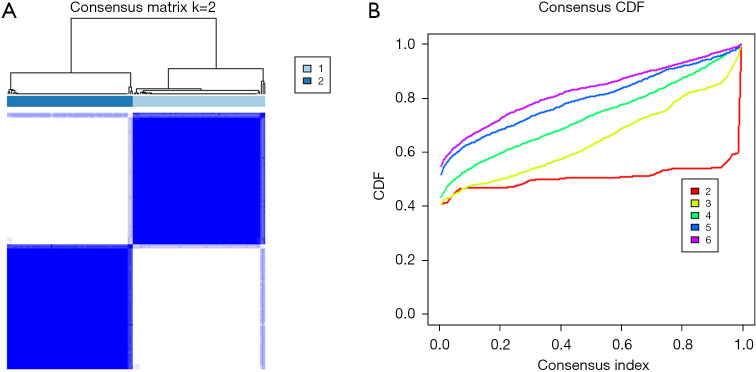
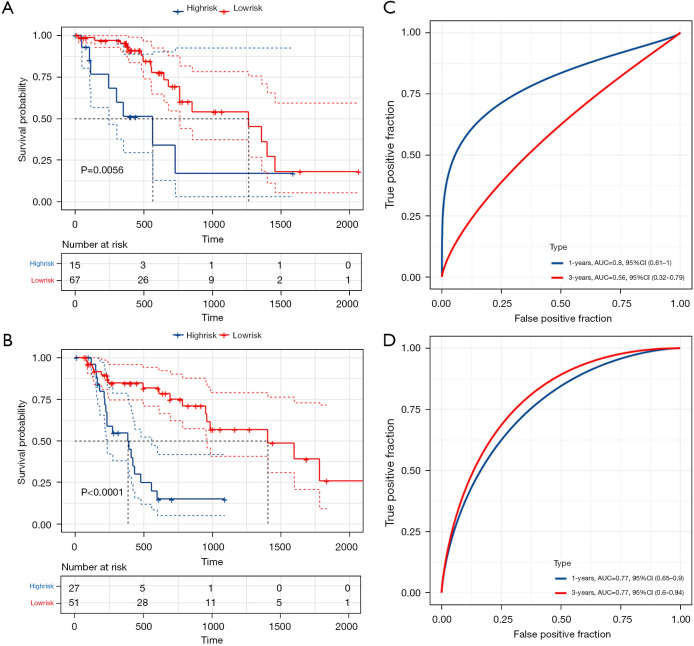
Consensus clustering has been widely used in subgroup-based identification and cancer typing. Therefore, we divided 160 tumor samples into different subtypes for model validation. As shown in Figure 5, when k=2, the clustering effect was the best, and the number of samples for the two subtypes was 82 and 78, respectively. Baseline data are shown in columns Cluster 1 and Cluster 2 in Table 1. K-M curves (Figure 6A,6B) and ROC analysis (Figure 6C,6D) were performed for the two subgroups using the previously obtained the risk score, and the results showed a significant difference in survival between high and low-risk groups (P<0.05). Although the 3-year AUC value in Cluster 1 was not satisfactory, the 1-year AUC value reached 0.8, and the 1- and 3-year AUC value in Cluster 2 were both 0.77, indicating the model had good stability.
Figure 5.
Identification of consensus clusters according to the expression of DEIRGs. (A) Matrix of consensus clustering (k=2); (B) CDF (k=2–6). DEIRGs, differentially expressed immune-related genes; CDF, cumulative distribution function.
Figure 6.
Validation of the prognostic signature in two subgroups based on result of consensus clustering (k=2). (A,B) Kaplan-Meier curves showed the high-risk groups both had a worse overall survival in the two subgroups; (C,D) value of prediction of the signature in two subgroups.
Other related analyses of the eight signature genes
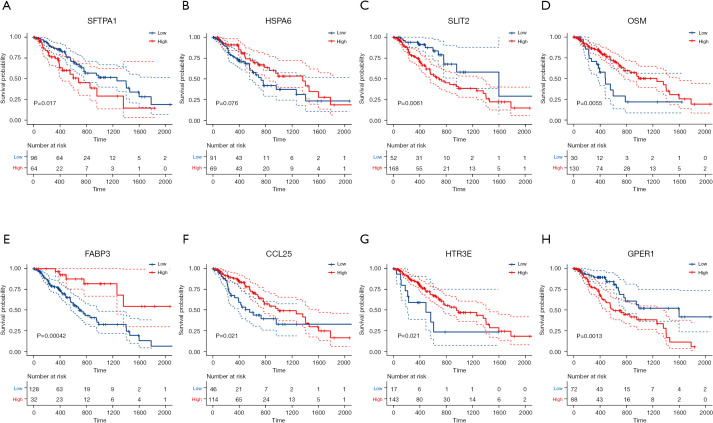
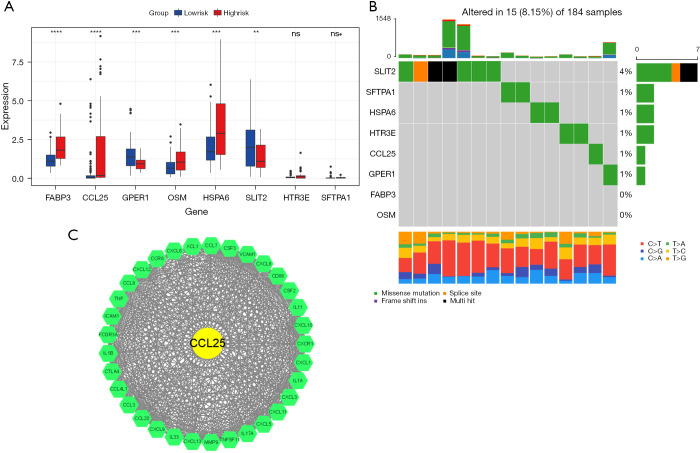
We performed K-M curves for the eight genes (Figure 7), and the results showed that except for HSPA6, the other seven genes were associated with prognosis (P<0.05), and except for HTR3E and SFTPA1, the remaining six genes were significantly different between the high and low-risk groups (P<0.05; Figure 8A). We read the ESCA mutation data compression package downloaded from TCGA database with the “MafTools” package (33), extracted the eight genes, and plotted the mutation waterfall map (Figure 8B). This showed SLIT2 had the highest mutation frequency among the samples, but most only had non-sense mutations. A protein-protein interaction (PPI) network was established by submitting DEIRGs to the STRING database (https://www.string-db.org/) and we used the Molecular Complex Detection (MCODE) plugin in Cytoscape to screen the hub module by the standard of the degree cutoff =2, node score cutoff =0.2, k-core =2, max. depth =100. Finally, we selected the modules with the highest scores, including 34 nodes and 460 edges, and found that in these nodes, only the CCL25 DEIRGs may play an important role in the model (Figure 8C).
Figure 7.
Kaplan-Meier curves of eight genes of the prognostic signature.
Figure 8.
Molecular characteristics of eight genes of the prognostic signature. (A) Expression of eight genes in high and low-risk groups; (B) Mutation landscape in 184 samples of TCGA-ESCA cohort; (C) Hub genes using PPI network and MCODE. (**, P<0.01; ***, P<0.001; ****, P<0.0001; ns, not significant). TCGA, The Cancer Genome Atlas; ESCA, esophageal cancer; PPI, protein-protein interaction; MCODE, Molecular Complex Detection.
Characterization of infiltrating immune cells in the TME
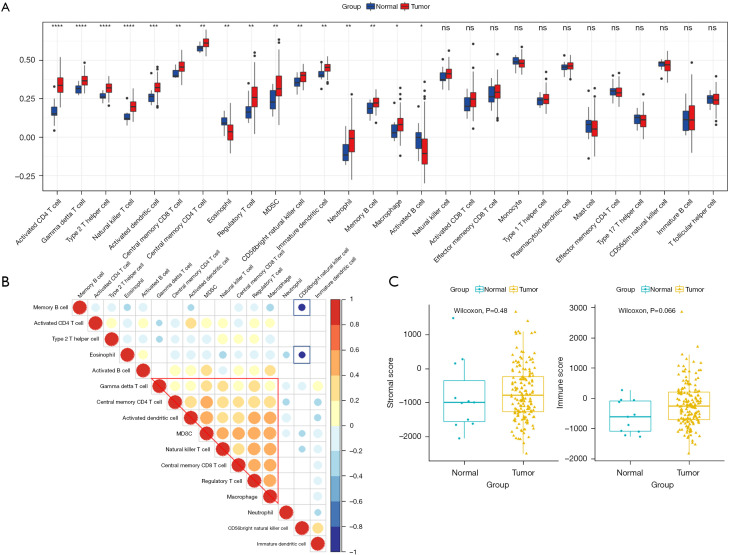
The proliferation and metastasis of tumor cells are inseparably related to the TME, especially immune infiltrating cells. Therefore, we used an ssGSEA algorithm to explore the differences between 28 immune cells in ESCA and normal samples, and the results showed that, activated CD4 T cells, gamma delta T cells, type 2 T helper cells, natural killer T cells, and another 12 subtypes of immune cells showed significant differences, suggesting these cells may play a role in tumour development (Figure 9A). In addition, we found that, except for the activated B cells, all others showed increased abundance in tumor samples. In addition, the correlation of these 16 different immune cells was explored, and showed gamma delta T cells, central memory CD4 T cells, activated dendritic cells, MDSC, natural killer T cells, macrophage central memory CD8 T cells, Treg cells, and macrophages were positively correlated, However, memory B cells and eosinophils showed a strong negative correlation with CD56 bright natural killer cells, the least differentiated NK cell component and accounting for 10% of all NK cells (Figure 9B). Additionally, we used the Estimate algorithm to calculate and compare stroma and immune cell scores in tumor and normal samples, and the results showed that the proportion of both types of cells in tumor samples was higher than that in normal tissue samples (Figure 9C), although the difference was not significant (P>0.05).
Figure 9.
Characteristics of infiltrating immune cells between normal and tumor samples. (A) Differences in the abundance of immune cells in the two samples (*, P<0.05; **, P<0.01; ***, P<0.001; ****, P<0.0001; ns, not significant); (B) correlation of different immune cells; (C) differences between the two samples in the two immune scores.
Relationship between signature and infiltrating immune cells in the TME
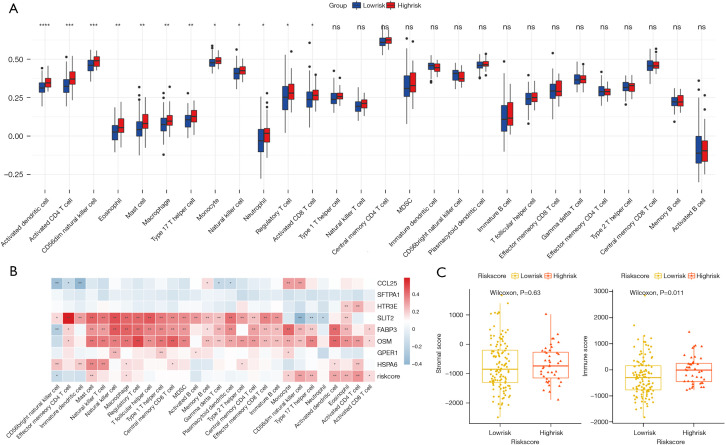
We first compared the distribution of 28 subtypes of immune cells in high and low-risk groups, and the results showed that activated dendritic cells, activated CD4 T cells, CD56dim natural killer cells, eosinophils, mast cells, macrophages, Type 17 T helper cell, monocytes, and other 5 subtypes of immune cells had significant differences (Figure 10A), and these cells all had higher infiltration degrees in the high-risk group. The correlation analysis of the eight genes in signature and the risk score with immune-infiltrating cells was then carried out (Figure 10B), and we found that SLIT2, FABP3, and OSM genes were highly correlated with most immune-infiltrating cells. The risk score with CD56dim natural killer cells, type 17 T helper cells, activated dendritic cells, eosinophils, and activated CD4 T cells were also strongly correlated (Figure 10B), and the high-risk group scored higher in the immuneScore (P=0.011, Figure 10C). We also conducted a correlation analysis of immunotherapy-related genes, including PD-1, PD-L1, PD-L2, CTLA-4, and the targeted therapy gene, HER-2, and found that SLIT2, FABP3, HSPA6, and OSM were highly correlated with these five genes (Figure S2), and a correlation point plot was performed to better determine the correlation between them. As shown in Figure 11, we found that SLIT2 had a strong correlation with PD-L2 and CTLA-4 (P<0.001).
Figure 10.
Characteristics of infiltrating immune cells between high and-low risk groups. (A) Differences in the abundance of immune cells in the two groups (*, P<0.05; **, P<0.01; ***, P<0.001; ****, P<0.0001; ns, not significant); (B) correlation of immune cells and genes of signature (*, P<0.05; **, P<0.01); (C) differences between the two groups in the two immune scores.
Figure 11.
Dot plot of correlation of SLIT2, HSPA6, FABP3, OSM, and five drug therapeutic targets.
Discussion
The incidence of ESCA has increased rapidly in recent years, with studies showing that it has the highest incidence of all cancers in the United States (34). ESCA is closely associated with living and environmental factors, with SCC mainly associated with smoking and alcohol consumption, whereas AC is closely associated with gastroesophageal reflux (GERD) (17). The 5-year survival rate for most cancers has improved over the past 40 years, but ESCA prognosis remains poor (12). Given the difficulty of early diagnosis of ESCA and its resistance to chemoradiotherapy (8), molecular research may be able to meet this challenge. Recent molecular studies have shown that the alteration, mutation, or amplification of ESCC related genes were the key to its development and prognosis (35,36). However, the external environment of ESCA is also an indispensable link in its occurrence and development. The TME includes immune cells, fibroblasts, endothelial cells, perivascular cells, neurons, fat cells, and ECM, and studies have suggested it can inhibit apoptosis, promote immune evasion, and promote proliferation, angiogenesis, invasion, and metastasis (37). In addition, inflammatory factors can induce damage to esophageal epithelial cells and rupture of DNA through the production of reactive oxygen species (ROS), leading to tumor activation (38). Several immune cells have been shown to play an important role in the immune escape mechanism of tumors, including MDSCs, Tregs, Th17 cells, and TAMs, which have been associated with immunotherapy resistance (19,39). Using targeted therapy for ESCA, HER-2 inhibitors combined with chemotherapy performed well in patients with advanced gastroesophageal AC in those with positive HER-2 (16), and are now recommended as a first-line therapy. In addition, the monoclonal PD-1 antibody nivolumab has been approved by the FDA as a second-line treatment for patients with advanced or relapsed SCC (40). These findings reveal the potential of molecular therapy to improve ESCA survival. Immune-related prognosis models combining immune genes have shown good predictive potential in a variety of cancers (25,41,42), and we can explore the molecular characteristics behind these prognostic immune genes and discover the important molecules that can be applied to clinical treatment.
In this study, a signature composed of eight IRGs was constructed by ESCA-related DEIRGs and verified by subgroups in the cohort, and the results showed that the model had good stability and high accuracy. In addition, the ssGSEA algorithm was used to analyze the immune cell infiltration of ESCA tumor and normal samples. We found that 16 immune cells were significantly different between the two tissues, and the immune score showed that the degree of immune cell infiltration was higher in the tumor samples. The prognostic signature was also used to divide tumor samples into high and low-risk groups to assess differences in immune cells and immune scores. Interestingly, we found that 12 significantly different immune cells were more invasive in the high-risk group and had similar results in the immune scores of the tumor samples, which seemed to contradict the familiar theory. We hypothesized that highly invasive tumor cells might recruit more immune-infiltrating cells and make more cell-cell connections to induce immune cell activation.
In addition, HER-2 and four other immune checkpoints that had been shown to play a role in a variety of cancers were analyzed for their association with the established signature. From the eight genes of the signature, we found three genes, namely SLIT2, FABP3, and OSM, that were significantly correlated with the targets of molecular therapy, and were also co-expressed with most immune cells (Figure 10B). In two previous studies, the prognostic signatures composed by nine IRGs were established and found to accurately predict the prognosis of ESCA, AUC >0.8 (26,43). However, neither model had been validated internally or externally, so their stability remains to be discussed, and more importantly, more immune-related studies were not discussed in these studies. However, it is worth noting that two genes in two previous models, HSPA6 and OSM, were also included in the prognostic model of this study.
OSM is an interleukin-6 (IL-6) type cytokine that binds to the OSM receptor OSMR to activate specific signaling pathways, and has been found to have positive effects in a variety of tumors (44,45). In a prospective multicenter clinical study of the early diagnosis of ESCA with a follow-up period of nearly 10 years, OSM expression levels in blood samples were shown to be associated with the development of ESCA (P<0.05) (46). In addition, Kausar et al. found a strong OSM immune response in the esophageal epithelial cells and stroma of 47/50 (94%) ESCA samples by immunohistochemistry, suggesting OSM plays an important role in the development of ESCA (47). In this study, OSM, as an independent prognostic factor, was significantly increased in the high-risk group (Figure 8A) and co-expressed with most immune cells (Figure 10B), confirming the results of previous studies. HSPA6, (heat shock 70 kDa protein 6), has low expression in normal tissues, but can be activated and induced to produce a cell protection function under severe emergency conditions (48). Few studies have looked at this gene in relation to ESCA, but its association with drug resistance in human tumors has been elucidated. In a study on the mechanism of anti-tumor treatment of lung cancer by a traditional Chinese medicine, HSPA6 was considered a key factor regulating the sensitivity of drug treatment. Further, when HSPA6 was absent, the sensitivity of both sensitive and insensitive cells to this medicine increased (49). In another study, which also concentrated on the mechanism of a traditional Chinese medicine in the treatment of breast cancer, researchers found that compared with normal tissue, the expression of breast cancer tissue had a high expression level in HSPA6, and as one of the target genes of the traditional medicine, overexpression of HSPA6 inhibited the growth, migration, and invasion of cancer cells. After the knockout of HSPA6, cancer cells showed a higher migration and invasion ability. Most importantly, the expression of HSPA6 was also shown to be associated with the overall survival of all subtypes of breast cancer (50). Shin et al. investigated the molecular mechanism by which garlic extract (GE) regulates the proliferation, migration, and invasion of bladder cancer cells, and found that HSPA6 was involved in the GE mediated inhibition of EJ cell proliferation, migration, and invasion, and was associated with cell cycle disorder, signaling pathway changes, and transcription factor related regulation of MMP-9 (51). Similarly, the expression of HSPA6 was significantly increased in the high-risk group in this study, and we speculate it might be a new target for ESCA drug therapy.
In addition, we found SLIT2 had the highest mutation frequency in the eight-gene signature, and that it was highly correlated with most immune cells and immune checkpoints, especially PD-L2 (Figure 11A). The results of a study by Tseng et al. focusing on the effect of SLIT2 on ESCA metastasis and prognosis were similar to our findings, which showed the deletion or low expression of SLIT2 protein in 31.8% of 154 ESCA patient samples, and low expression of SLIT2 was associated with poor prognosis, whether in univariate or multivariate Cox analysis (P<0.05). To validate the hypothesis that SLIT2 might inhibit tumor cell migration in ESCA, the knockout cells were then compared with untreated cells, and the results showed that the knockout cells were significantly more capable of migration (P<0.001) (52). This conclusion was also supported by the significantly reduced expression of SLIT2 in our high-risk group.
The expression of FABP3 also seems to be related to ESCA. Liu et al. screened the prognostic biomarker genes of ESCA from the TCGA database, and then used four machine learning methods to select an effective prognostic model to verify this in their own real cohort. The study identified two of the most important marker genes, including the risk gene FABP3 and the protective gene CLCNKB. They then conducted multiple experiments to verify the ability of FABP3 to promote the proliferation and migration of ESCA cell lines (53). This conclusion was unquestionably supported by our results, in which multivariate Cox analysis showed FABP3 was an independent prognostic factor (HR: 1.5346, 95% CI: 1.0922–2.1561 P=0.01357), and the expression of FABP3 in the high-risk group was significantly increased (P<0.00001).
CCL25 was the only gene in the eight genes of the signature that appeared in the higher sub-module of our PPI network. A high-quality review summarized the role of CCL25 in leukemia, as well as prostate, breast, ovarian, lung, and hepatocellular cancer cells, as including an antiapoptotic effect, inducing the proliferation of cancer cells, and playing an important role in the metastasis and infiltration of tumor cells (54). This indicates CCL25 can improve the immunotherapeutic effect of triple-negative breast cancers by combining with PD-L1 (55). Moreover, CCL25 also played an important role in prognostic models in other related studies (56). It should be noted that pan-cancer analysis was also performed in the study, and the results demonstrated the universality of the model (56).
The other three genes in the signature, GPER1 (57), HTR3E (58), and SFTPA1 (59), also played important roles in a variety of other tumors and diseases, but their implications in ESCA have not been reported.
To summarize, we found a new prognostic signature which subgroup analysis proved to be relatively stable and predictive, and the relationship between model and target genes will provide direction for mechanism research. However, there are some deficiencies in this study. Firstly, it is well known that age is an important prognostic indicator of tumor patients, but age was not an independent prognostic factor in the TCGA-ESCA cohort, which we suspect may be related to the small sample size; secondly, the mechanism of action behind genes needs to be fully explored and discussed.
Conclusions
In conclusion, a significant prognostic signature was established based on IRGs, and was been found to be strongly related to genes targeted by immune cells and drug therapy. The results of this study provide new insights for future clinical treatment.
Supplementary
The article’s supplementary files as
Acknowledgments
Funding: None.
Ethical Statement: The authors are accountable for all aspects of the work in ensuring that questions related to the accuracy or integrity of any part of the work are appropriately investigated and resolved. The study was conducted in accordance with the Declaration of Helsinki (as revised in 2013).
Reporting Checklist: The authors have completed the TRIPOD reporting checklist. Available at https://dx.doi.org/10.21037/atm-21-4756
Conflicts of Interest: All authors have completed the ICMJE uniform disclosure form (available at https://dx.doi.org/10.21037/atm-21-4756). The authors have no conflicts of interest to declare.
(English Language Editor: B. Draper)
References
- 1.Bray F, Ferlay J, Soerjomataram I, et al. Global cancer statistics 2018: GLOBOCAN estimates of incidence and mortality worldwide for 36 cancers in 185 countries. CA Cancer J Clin 2018;68:394-424. 10.3322/caac.21492 [DOI] [PubMed] [Google Scholar]
- 2.Rustgi AK, El-Serag HB. Esophageal carcinoma. N Engl J Med 2014;371:2499-509. 10.1056/NEJMra1314530 [DOI] [PubMed] [Google Scholar]
- 3.Baba Y, Yoshida N, Kinoshita K, et al. Clinical and Prognostic Features of Patients With Esophageal Cancer and Multiple Primary Cancers: A Retrospective Single-institution Study. Ann Surg 2018;267:478-83. 10.1097/SLA.0000000000002118 [DOI] [PubMed] [Google Scholar]
- 4.Allemani C, Matsuda T, Di Carlo V, et al. Global surveillance of trends in cancer survival 2000-14 (CONCORD-3): analysis of individual records for 37 513 025 patients diagnosed with one of 18 cancers from 322 population-based registries in 71 countries. Lancet 2018;391:1023-75. 10.1016/S0140-6736(17)33326-3 [DOI] [PMC free article] [PubMed] [Google Scholar]
- 5.Rice TW, Rusch VW, Apperson-Hansen C, et al. Worldwide esophageal cancer collaboration. Dis Esophagus 2009;22:1-8. 10.1111/j.1442-2050.2008.00901.x [DOI] [PubMed] [Google Scholar]
- 6.Mao YS, Gao SG, Wang Q, et al. Analysis of a registry database for esophageal cancer from high-volume centers in China. Dis Esophagus 2020;33:doz091. 10.1093/dote/doz091 [DOI] [PubMed] [Google Scholar]
- 7.Watanabe M, Tachimori Y, Oyama T, et al. Comprehensive registry of esophageal cancer in Japan, 2013. Esophagus 2021;18:1-24. 10.1007/s10388-020-00785-y [DOI] [PMC free article] [PubMed] [Google Scholar]
- 8.Trowbridge R, Sharma P, Hunter WJ, et al. Vitamin D receptor expression and neoadjuvant therapy in esophageal adenocarcinoma. Exp Mol Pathol 2012;93:147-53. 10.1016/j.yexmp.2012.04.018 [DOI] [PMC free article] [PubMed] [Google Scholar]
- 9.Hanahan D, Weinberg RA. Hallmarks of cancer: the next generation. Cell 2011;144:646-74. 10.1016/j.cell.2011.02.013 [DOI] [PubMed] [Google Scholar]
- 10.Tumeh PC, Harview CL, Yearley JH, et al. PD-1 blockade induces responses by inhibiting adaptive immune resistance. Nature 2014;515:568-71. 10.1038/nature13954 [DOI] [PMC free article] [PubMed] [Google Scholar]
- 11.Okadome K, Baba Y, Nomoto D, et al. Prognostic and clinical impact of PD-L2 and PD-L1 expression in a cohort of 437 oesophageal cancers. Br J Cancer 2020;122:1535-43. 10.1038/s41416-020-0811-0 [DOI] [PMC free article] [PubMed] [Google Scholar]
- 12.Abdo J, Agrawal DK, Mittal SK. Basis for molecular diagnostics and immunotherapy for esophageal cancer. Expert Rev Anticancer Ther 2017;17:33-45. 10.1080/14737140.2017.1260449 [DOI] [PMC free article] [PubMed] [Google Scholar]
- 13.Egen JG, Kuhns MS, Allison JP. CTLA-4: new insights into its biological function and use in tumor immunotherapy. Nat Immunol 2002;3:611-8. 10.1038/ni0702-611 [DOI] [PubMed] [Google Scholar]
- 14.Chae YK, Arya A, Iams W, et al. Current landscape and future of dual anti-CTLA4 and PD-1/PD-L1 blockade immunotherapy in cancer; lessons learned from clinical trials with melanoma and non-small cell lung cancer (NSCLC). J Immunother Cancer 2018;6:39. 10.1186/s40425-018-0349-3 [DOI] [PMC free article] [PubMed] [Google Scholar]
- 15.Galon J, Mlecnik B, Bindea G, et al. Towards the introduction of the 'Immunoscore' in the classification of malignant tumours. J Pathol 2014;232:199-209. 10.1002/path.4287 [DOI] [PMC free article] [PubMed] [Google Scholar]
- 16.Bang YJ, Van Cutsem E, Feyereislova A, et al. Trastuzumab in combination with chemotherapy versus chemotherapy alone for treatment of HER2-positive advanced gastric or gastro-oesophageal junction cancer (ToGA): a phase 3, open-label, randomised controlled trial. Lancet 2010;376:687-97. 10.1016/S0140-6736(10)61121-X [DOI] [PubMed] [Google Scholar]
- 17.Bhat AA, Nisar S, Maacha S, et al. Cytokine-chemokine network driven metastasis in esophageal cancer; promising avenue for targeted therapy. Mol Cancer 2021;20:2. 10.1186/s12943-020-01294-3 [DOI] [PMC free article] [PubMed] [Google Scholar]
- 18.Ponomarev AV, Shubina IZ. Insights Into Mechanisms of Tumor and Immune System Interaction: Association With Wound Healing. Front Oncol 2019;9:1115. 10.3389/fonc.2019.01115 [DOI] [PMC free article] [PubMed] [Google Scholar]
- 19.Lin EW, Karakasheva TA, Hicks PD, et al. The tumor microenvironment in esophageal cancer. Oncogene 2016;35:5337-49. 10.1038/onc.2016.34 [DOI] [PMC free article] [PubMed] [Google Scholar]
- 20.Lee HJ, Zhuang G, Cao Y, et al. Drug resistance via feedback activation of Stat3 in oncogene-addicted cancer cells. Cancer Cell 2014;26:207-21. 10.1016/j.ccr.2014.05.019 [DOI] [PubMed] [Google Scholar]
- 21.Vacchelli E, Semeraro M, Enot DP, et al. Negative prognostic impact of regulatory T cell infiltration in surgically resected esophageal cancer post-radiochemotherapy. Oncotarget 2015;6:20840-50. 10.18632/oncotarget.4428 [DOI] [PMC free article] [PubMed] [Google Scholar]
- 22.Miyashita T, Tajima H, Shah FA, et al. Impact of inflammation-metaplasia-adenocarcinoma sequence and inflammatory microenvironment in esophageal carcinogenesis using surgical rat models. Ann Surg Oncol 2014;21:2012-9. 10.1245/s10434-014-3537-5 [DOI] [PubMed] [Google Scholar]
- 23.Shen C, Liu J, Wang J, et al. Development and validation of a prognostic immune-associated gene signature in clear cell renal cell carcinoma. Int Immunopharmacol 2020;81:106274. 10.1016/j.intimp.2020.106274 [DOI] [PubMed] [Google Scholar]
- 24.Shen S, Wang G, Zhang R, et al. Development and validation of an immune gene-set based Prognostic signature in ovarian cancer. EBioMedicine 2019;40:318-26. 10.1016/j.ebiom.2018.12.054 [DOI] [PMC free article] [PubMed] [Google Scholar]
- 25.Guo D, Wang M, Shen Z, et al. A new immune signature for survival prediction and immune checkpoint molecules in lung adenocarcinoma. J Transl Med 2020;18:123. 10.1186/s12967-020-02286-z [DOI] [PMC free article] [PubMed] [Google Scholar]
- 26.Guo X, Wang Y, Zhang H, et al. Identification of the Prognostic Value of Immune-Related Genes in Esophageal Cancer. Front Genet 2020;11:989. 10.3389/fgene.2020.00989 [DOI] [PMC free article] [PubMed] [Google Scholar]
- 27.Robinson MD, McCarthy DJ, Smyth GK. edgeR: a Bioconductor package for differential expression analysis of digital gene expression data. Bioinformatics 2010;26:139-40. 10.1093/bioinformatics/btp616 [DOI] [PMC free article] [PubMed] [Google Scholar]
- 28.Yu G, Wang LG, Han Y, et al. clusterProfiler: an R package for comparing biological themes among gene clusters. OMICS 2012;16:284-7. 10.1089/omi.2011.0118 [DOI] [PMC free article] [PubMed] [Google Scholar]
- 29.Walter W, Sánchez-Cabo F, Ricote M. GOplot: an R package for visually combining expression data with functional analysis. Bioinformatics 2015;31:2912-4. 10.1093/bioinformatics/btv300 [DOI] [PubMed] [Google Scholar]
- 30.Charoentong P, Finotello F, Angelova M, et al. Pan-cancer Immunogenomic Analyses Reveal Genotype-Immunophenotype Relationships and Predictors of Response to Checkpoint Blockade. Cell Rep 2017;18:248-62. 10.1016/j.celrep.2016.12.019 [DOI] [PubMed] [Google Scholar]
- 31.Hänzelmann S, Castelo R, Guinney J. GSVA: gene set variation analysis for microarray and RNA-seq data. BMC Bioinformatics 2013;14:7. 10.1186/1471-2105-14-7 [DOI] [PMC free article] [PubMed] [Google Scholar]
- 32.Yoshihara K, Shahmoradgoli M, Martínez E, et al. Inferring tumour purity and stromal and immune cell admixture from expression data. Nat Commun 2013;4:2612. 10.1038/ncomms3612 [DOI] [PMC free article] [PubMed] [Google Scholar]
- 33.Mayakonda A, Lin DC, Assenov Y, et al. Maftools: efficient and comprehensive analysis of somatic variants in cancer. Genome Res 2018;28:1747-56. 10.1101/gr.239244.118 [DOI] [PMC free article] [PubMed] [Google Scholar]
- 34.Kapoor H, Agrawal DK, Mittal SK. Barrett's esophagus: recent insights into pathogenesis and cellular ontogeny. Transl Res 2015;166:28-40. 10.1016/j.trsl.2015.01.009 [DOI] [PubMed] [Google Scholar]
- 35.Gao YB, Chen ZL, Li JG, et al. Genetic landscape of esophageal squamous cell carcinoma. Nat Genet 2014;46:1097-102. 10.1038/ng.3076 [DOI] [PubMed] [Google Scholar]
- 36.Song Y, Li L, Ou Y, et al. Identification of genomic alterations in oesophageal squamous cell cancer. Nature 2014;509:91-5. 10.1038/nature13176 [DOI] [PubMed] [Google Scholar]
- 37.Whiteside TL. The tumor microenvironment and its role in promoting tumor growth. Oncogene 2008;27:5904-12. 10.1038/onc.2008.271 [DOI] [PMC free article] [PubMed] [Google Scholar]
- 38.Farhadi A, Fields J, Banan A, et al. Reactive oxygen species: are they involved in the pathogenesis of GERD, Barrett's esophagus, and the latter's progression toward esophageal cancer? Am J Gastroenterol 2002;97:22-6. 10.1111/j.1572-0241.2002.05444.x [DOI] [PubMed] [Google Scholar]
- 39.Baba Y, Nomoto D, Okadome K, et al. Tumor immune microenvironment and immune checkpoint inhibitors in esophageal squamous cell carcinoma. Cancer Sci 2020;111:3132-41. 10.1111/cas.14541 [DOI] [PMC free article] [PubMed] [Google Scholar]
- 40.Kato K, Cho BC, Takahashi M, et al. Nivolumab versus chemotherapy in patients with advanced oesophageal squamous cell carcinoma refractory or intolerant to previous chemotherapy (ATTRACTION-3): a multicentre, randomised, open-label, phase 3 trial. Lancet Oncol 2019;20:1506-17. 10.1016/S1470-2045(19)30626-6 [DOI] [PubMed] [Google Scholar]
- 41.Hong W, Liang L, Gu Y, et al. Immune-Related lncRNA to Construct Novel Signature and Predict the Immune Landscape of Human Hepatocellular Carcinoma. Mol Ther Nucleic Acids 2020;22:937-47. 10.1016/j.omtn.2020.10.002 [DOI] [PMC free article] [PubMed] [Google Scholar]
- 42.Shen Y, Peng X, Shen C. Identification and validation of immune-related lncRNA prognostic signature for breast cancer. Genomics 2020;112:2640-6. 10.1016/j.ygeno.2020.02.015 [DOI] [PubMed] [Google Scholar]
- 43.Zhang Z, Chen C, Fang Y, et al. Development of a prognostic signature for esophageal cancer based on nine immune related genes. BMC Cancer 2021;21:113. 10.1186/s12885-021-07813-9 [DOI] [PMC free article] [PubMed] [Google Scholar]
- 44.Brown TJ, Lioubin MN, Marquardt H. Purification and characterization of cytostatic lymphokines produced by activated human T lymphocytes. Synergistic antiproliferative activity of transforming growth factor beta 1, interferon-gamma, and oncostatin M for human melanoma cells. J Immunol 1987;139:2977-83. [PubMed] [Google Scholar]
- 45.Ohata Y, Harada T, Fujii A, et al. Menstrual cycle-specific inhibition of endometrial stromal cell proliferation by oncostatin M. Mol Hum Reprod 2001;7:665-70. 10.1093/molehr/7.7.665 [DOI] [PubMed] [Google Scholar]
- 46.Aversa J, Song M, Shimazu T, et al. Prediagnostic circulating inflammation biomarkers and esophageal squamous cell carcinoma: A case-cohort study in Japan. Int J Cancer 2020;147:686-91. 10.1002/ijc.32763 [DOI] [PubMed] [Google Scholar]
- 47.Kausar T, Sharma R, Hasan MR, et al. Overexpression of a splice variant of oncostatin M receptor beta in human esophageal squamous carcinoma. Cell Oncol (Dordr) 2011;34:177-87. 10.1007/s13402-011-0011-2 [DOI] [PubMed] [Google Scholar]
- 48.Rohde M, Daugaard M, Jensen MH, et al. Members of the heat-shock protein 70 family promote cancer cell growth by distinct mechanisms. Genes Dev 2005;19:570-82. 10.1101/gad.305405 [DOI] [PMC free article] [PubMed] [Google Scholar]
- 49.Wang L, Hou J, Wang J, et al. Regulatory roles of HSPA6 in Actinidia chinensis Planch. root extract (acRoots)-inhibited lung cancer proliferation. Clin Transl Med 2020;10:e46. 10.1186/1479-5876-10-S2-A46 [DOI] [PMC free article] [PubMed] [Google Scholar]
- 50.Shen S, Wei C, Fu J. RNA-Sequencing Reveals Heat Shock 70-kDa Protein 6 (HSPA6) as a Novel Thymoquinone-Upregulated Gene That Inhibits Growth, Migration, and Invasion of Triple-Negative Breast Cancer Cells. Front Oncol 2021;11:667995. 10.3389/fonc.2021.667995 [DOI] [PMC free article] [PubMed] [Google Scholar]
- 51.Shin SS, Song JH, Hwang B, et al. HSPA6 augments garlic extract-induced inhibition of proliferation, migration, and invasion of bladder cancer EJ cells; Implication for cell cycle dysregulation, signaling pathway alteration, and transcription factor-associated MMP-9 regulation. PLoS One 2017;12:e0171860. 10.1371/journal.pone.0171860 [DOI] [PMC free article] [PubMed] [Google Scholar]
- 52.Tseng RC, Chang JM, Chen JH, et al. Deregulation of SLIT2-mediated Cdc42 activity is associated with esophageal cancer metastasis and poor prognosis. J Thorac Oncol 2015;10:189-98. 10.1097/JTO.0000000000000369 [DOI] [PubMed] [Google Scholar]
- 53.Liu T, Fang P, Han C, et al. Four transcription profile-based models identify novel prognostic signatures in oesophageal cancer. J Cell Mol Med 2020;24:711-21. 10.1111/jcmm.14779 [DOI] [PMC free article] [PubMed] [Google Scholar]
- 54.Xu B, Deng C, Wu X, et al. CCR9 and CCL25: A review of their roles in tumor promotion. J Cell Physiol 2020;235:9121-32. 10.1002/jcp.29782 [DOI] [PubMed] [Google Scholar]
- 55.Khandelwal N, Breinig M, Speck T, et al. A high-throughput RNAi screen for detection of immune-checkpoint molecules that mediate tumor resistance to cytotoxic T lymphocytes. EMBO Mol Med 2015;7:450-63. 10.15252/emmm.201404414 [DOI] [PMC free article] [PubMed] [Google Scholar]
- 56.Zhu C, Xia Q, Gu B, et al. Esophageal Cancer Associated Immune Genes as Biomarkers for Predicting Outcome in Upper Gastrointestinal Tumors. Front Genet 2021;12:707299. 10.3389/fgene.2021.707299 [DOI] [PMC free article] [PubMed] [Google Scholar]
- 57.Vivacqua A. GPER1 and microRNA: Two Players in Breast Cancer Progression. Int J Mol Sci 2020;22:98. 10.3390/ijms22010098 [DOI] [PMC free article] [PubMed] [Google Scholar]
- 58.Zhang Y, Li Y, Hao Z, et al. Association of the Serotonin Receptor 3E Gene as a Functional Variant in the MicroRNA-510 Target Site with Diarrhea Predominant Irritable Bowel Syndrome in Chinese Women. J Neurogastroenterol Motil 2016;22:272-81. 10.5056/jnm15138 [DOI] [PMC free article] [PubMed] [Google Scholar]
- 59.Takezaki A, Tsukumo SI, Setoguchi Y, et al. A homozygous SFTPA1 mutation drives necroptosis of type II alveolar epithelial cells in patients with idiopathic pulmonary fibrosis. J Exp Med 2019;216:2724-35. 10.1084/jem.20182351 [DOI] [PMC free article] [PubMed] [Google Scholar]
Associated Data
This section collects any data citations, data availability statements, or supplementary materials included in this article.
Supplementary Materials
The article’s supplementary files as


