

Abstract
Although studies have investigated the associations between PM2.5 and mortality risk, evidence from rural areas is scarce. We aimed to compare the PM2.5-mortality associations between urban cities and rural areas in China. Daily mortality and air pollution data were collected from 215 locations during 2014–2017 in China. A two-stage approach was employed to estimate the location-specific and combined cumulative associations between short-term exposure to PM2.5 (lag 0–3 days) and mortality risks. The excess risks (ER) of all-cause, respiratory disease (RESP), cardiovascular disease (CVD), and cerebrovascular disease (CED) mortality for each 10 μg/m3 increment in PM2.5 across all locations were 0.54% (95% confidence interval [CI]: 0.38%, 0.70%), 0.51% (0.10%, 0.93%), 0.74% (0.50%, 0.97%), and 0.52% (0.20%, 0.83%), respectively. Slightly stronger associations for CVD (0.80% versus 0.60%) and CED (0.61% versus 0.26%) mortality were observed in urban cities than in rural areas, and slightly greater associations for RESP mortality (0.51% versus 0.43%) were found in rural areas than in urban cities. A mean of 2.11% (attributable fraction [AF], 95% CI: 1.48%, 2.76%) of all-cause mortality was attributable to PM2.5 exposure in China, with a larger AF in urban cities (2.89% [2.12%, 3.67%]) than in rural areas (0.61% [−0.60%, 1.84%]). Disparities in PM2.5-mortality associations between urban cities and rural areas were also found in some subgroups classified by sex and age. This study provided robust evidence on the associations of PM2.5 with mortality risks in China and demonstrated urban-rural disparities of PM2.5-mortality associations for various causes of death.
Keywords: fine particulate matter, mortality, urban-rural disparity, China
Graphical abstract
Public summary
-
•
PM2.5 had greater effects on CVD/CED mortality in urban cities than in rural areas
-
•
PM2.5 had stronger effects on RESP mortality in rural areas than in urban cities
-
•
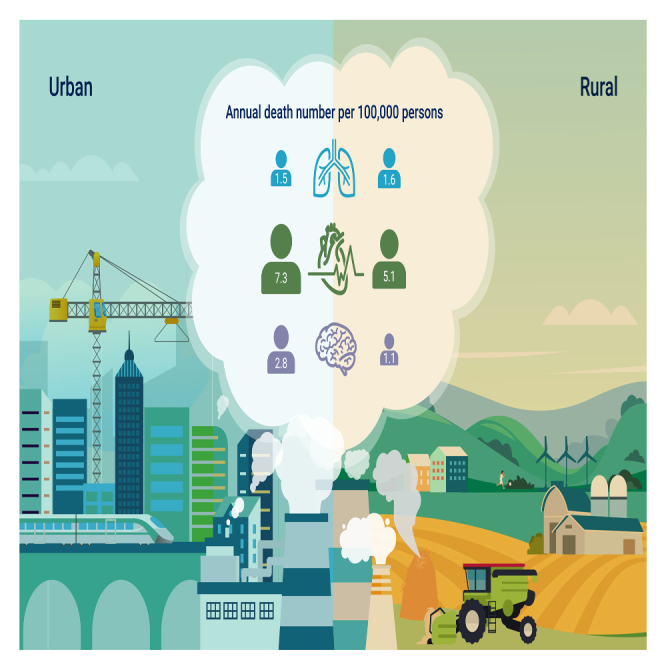
An annual mean of 16.5/100,000 deaths was attributable to PM2.5 in urban cities
-
•
An annual mean of 3.4//100,000 deaths was attributable to PM2.5 in rural areas
-
•
Spatially targeted measures are needed to reduce PM2.5-related mortality in China
Introduction
Numerous studies have examined the associations between short-term exposure to ambient particulate matter with an aerodynamic diameter of 2.5 μm or less (PM2.5) and daily mortality.1, 2, 3 For example, Liu et al. found that each 10 μg/m3 increase in PM2.5 was associated with a 0.68% higher risk of all-cause mortality, a 0.55% higher risk of cardiovascular (CVD) mortality, and a 0.47% higher risk of respiratory (RESP) mortality using data from 652 cities worldwide.1 These studies demonstrated a robust association between PM2.5 and mortality risk worldwide.
Previous studies suggested that the associations between air pollution and health may be different between urban cities and rural areas. Residents in rural areas usually use traditional stoves, have fewer self-protection measures, and participate in more outdoor activities, which may increase their exposure to air pollution and lead to more premature deaths.4 In addition, the lack of planning in rural areas exacerbates residential environmental exposures.5 Correspondingly, urban residents usually consume more materials and energy than rural residents, which may lead to higher per capita emissions of air pollutants and higher air pollution concentrations. Moreover, urban population growth and in-migration indicate that population exposure to air pollution increases even without substantial air quality changes.6 These complex dynamics indicate the necessity to further illustrate the urban-rural disparity of the associations between PM2.5 and human health.
However, to date, few studies have compared the discrepancy of the mortality-PM2.5 association between urban cities and rural areas, and the existing results are inconsistent. In addition, most previous studies assessed the urban-rural disparity of associations of long-term exposures to PM2.5 with health,5,7, 8, 9 and no study was found to investigate the short-term effect difference of PM2.5 between urban cities and rural areas. For example, a study conducted in China reported a higher mortality risk attributable to long-term PM2.5 exposures in dense urban cities than in rural areas.7 In contrast, Zhao et al. observed a stronger long-term effect of PM2.5 on mortality in rural areas than in urban cities in China.8 Therefore, more multilocation studies are needed to corroborate the difference in the associations of short-term exposure to PM2.5 with mortality between urban cities and rural areas.
A better understanding of the urban-rural disparity of air pollution–related mortality risk and burden is important for effective decision making in designing spatially targeted interventions and mitigation policies. This is especially relevant for developing countries such as China, which is suffering from severe air pollution and has a large number of rural residents. Given these knowledge gaps, we collected data in 215 locations from four provinces in China to compare the associations of short-term exposure to PM2.5 with mortality risk and burden between urban cities and rural areas.
Results
General characteristics of study samples
A total of 2,604,828 deaths were included in this study (403,725 deaths caused by RESP, 1,050,326 deaths caused by CVD, and 524,790 deaths caused by CED). The mean number of daily all-cause deaths was 8.3 (SD = 5.8) in all locations, with a mean of 8.9 (SD = 5.9) and 7.7 (SD = 5.6) deaths in urban cities and rural areas, respectively. The average daily RESP, CVD, and CED deaths in all locations were 1.3 (SD = 1.7), 3.3 (SD = 2.8), and 1.7 (SD = 1.7), respectively. We observed higher mean PM2.5, NO2, and SO2 concentrations, slightly lower mean O3 concentrations, and identical mean CO concentrations in urban cities than in rural areas (Figure 1 and Table 1). Daily PM2.5 concentration was positively associated with daily O3 (r = 0.11, p < 0.05), CO (r = 0.47, p < 0.05), NO2 (r = 0.62, p < 0.05), and SO2 (r = 0.51, p < 0.05), and it was negatively associated with daily TM (r = −0.32, p < 0.05) and RH (r = −0.26, p < 0.05) (Table S2).
Figure 1.

The distribution of 215 Chinese locations and their mean daily PM2.5 concentration during 2014–2017
(A) Guangdong; (B) Zhejiang; (C) Jilin; (D) Yunnan.
Table 1.
Characteristics of the studied variables in 215 locations in China
| Mean (SD) | Minimum | P25 | Median | P75 | Maximum | |
|---|---|---|---|---|---|---|
| All-cause mortality | ||||||
| Total | 8.3 (5.8) | 0 | 4 | 7 | 11 | 119 |
| Urban | 8.9 (5.9) | 0 | 5 | 8 | 12 | 62 |
| Rural | 7.7 (5.6) | 0 | 4 | 6 | 10 | 119 |
| RESP mortality | ||||||
| Total | 1.3 (1.7) | 0 | 0 | 1 | 2 | 73 |
| Urban | 1.2 (1.5) | 0 | 0 | 1 | 2 | 16 |
| Rural | 1.3 (1.8) | 0 | 0 | 1 | 2 | 73 |
| CVD mortality | ||||||
| Total | 3.3(2.8) | 0 | 1 | 3 | 5 | 109 |
| Urban | 3.4(2.7) | 0 | 1 | 3 | 5 | 41 |
| Rural | 3.3(2.9) | 0 | 1 | 3 | 5 | 109 |
| CED mortality | ||||||
| Total | 1.7 (1.7) | 0 | 0 | 1 | 2 | 30 |
| Urban | 1.7 (1.7) | 0 | 0 | 1 | 2 | 30 |
| Rural | 1.6 (1.7) | 0 | 0 | 1 | 2 | 27 |
| PM2.5(μg/m3) | ||||||
| Total | 38.3 (25.1) | 4.0 | 21.5 | 31.6 | 47.8 | 451.1 |
| Urban | 41.7 (27.2) | 4.0 | 23.1 | 35.1 | 52.1 | 451.1 |
| Rural | 35.0 (22.3) | 4.9 | 20.3 | 29.0 | 43.5 | 429.5 |
| NO2(μg/m3) | ||||||
| Total | 28.9 (15.7) | 3.8 | 17.3 | 24.3 | 36.6 | 141.1 |
| Urban | 34.0 (17.3) | 4.6 | 20.6 | 30.4 | 44.2 | 141.1 |
| Rural | 23.9 (12.1) | 3.8 | 15.6 | 20.5 | 28.4 | 122.3 |
| SO2(μg/m3) | ||||||
| Total | 17.3 (11.2) | 2.2 | 11.0 | 14.5 | 20.4 | 188.7 |
| Urban | 17.7 (13.2) | 2.8 | 10.3 | 14.2 | 20.7 | 188.7 |
| Rural | 17.0 (8.8) | 2.2 | 11.5 | 14.8 | 20.2 | 116.4 |
| O3(μg/m3) | ||||||
| Total | 59.5 (24.1) | 2.8 | 41.5 | 56.9 | 75.0 | 224.6 |
| Urban | 59.2 (25.4) | 2.8 | 40.3 | 56.8 | 75.6 | 224.6 |
| Rural | 59.8 (22.6) | 5.5 | 42.6 | 57.0 | 74.3 | 223.4 |
| CO (mg/m3) | ||||||
| Total | 0.9 (0.3) | 0.3 | 0.7 | 0.8 | 1.0 | 3.8 |
| Urban | 0.9 (0.3) | 0.3 | 0.7 | 0.9 | 1.0 | 3.8 |
| Rural | 0.9 (0.3) | 0.3 | 0.7 | 0.8 | 1.0 | 3.5 |
| Mean temperature (°C) | ||||||
| Total | 16.7 (9.6) | −28.9 | 11.2 | 18.2 | 23.4 | 35.6 |
| Urban | 16.5 (10.4) | −28.9 | 10.6 | 18.3 | 24.1 | 35.6 |
| Rural | 16.8 (8.8) | −27.7 | 11.7 | 18.1 | 22.7 | 35.6 |
| Relative humidity (%) | ||||||
| Total | 74.8 (14.2) | 8.0 | 66.0 | 77.0 | 85.0 | 100.0 |
| Urban | 74.8 (14.4) | 8.0 | 66.0 | 77.0 | 86.0 | 100.0 |
| Rural | 74.9 (14.0) | 14.0 | 67.0 | 77.0 | 85.0 | 100.0 |
SD: standard deviation.
Cumulative exposure-response associations of daily PM2.5 with mortality risk
We observed a general positive association between PM2.5 and mortality in all locations, with a steeper slope at low PM2.5 concentrations (<30 μg/m3), particularly for CVD and CED mortality. However, the nonlinear association patterns between PM2.5 and mortality were different across areas and causes. For example, a steeper slope at higher PM2.5 concentrations (>80 μg/m3) was found in rural areas than in urban areas for the association between PM2.5 and RESP mortality risk. In urban areas, we observed greater associations of PM2.5 with CVD mortality than with RESP mortality on days with higher PM2.5 concentrations (Figure 2).
Figure 2.

The cumulative exposure-response curves between PM2.5 and mortality over lag 0–3 days in all urban and rural locations
Note: The solid lines represent the cumulative relative risk of mortality over 4 days (lag 0–3 days) for PM2.5 concentrations, which are the combined effects of exposure and lag dimensions.
Table 2 shows the cumulative (lag 0–3 days) ERs of mortality for each 10 μg/m3 increase in PM2.5 concentrations. The ERs of all-cause mortality, RESP, CVD, and CED mortality in all locations were 0.54% (95% CI: 0.38%, 0.70%), 0.51% (0.10%, 0.93%), 0.74% (0.50%, 0.97%), and 0.52% (0.20%, 0.83%), respectively. Stratification analyses showed greater associations between PM2.5 and mortality in urban cities than in rural areas for all-cause mortality (0.68% [0.50%, 0.86%] versus 0.17% [−0.17%, 0.52%]) and in most subgroups, including CVD mortality (0.80% [0.51%, 1.08%] versus 0.60% [0.18%, 1.03%]), CED mortality (0.61% [0.23%, 0.98%] versus 0.26% [−0.32%, 0.83%]), males (0.64% [0.43%, 0.85%] versus 0.12% [−0.21%, 0.44%]), and people aged 0 to 74 years (0.43% [0.20%, 0.66%] versus 0.00% [−0.32%, 0.32%]). In particular, we found statistically significant urban-rural differences in the associations of PM2.5 with all-cause mortality among the total participants (p = 0.011), males (p = 0.009), and people aged 0 to 74 years (p = 0.034).
Table 2.
The cumulative ERa (%, 95% CI) of mortality for each 10 μg/m3 increase in PM2.5 concentration over lag 0–3 days by region
| Total | Sex |
Age (years) |
|||
|---|---|---|---|---|---|
| Male | Female | 0–74 | 75– | ||
| All-cause mortality | |||||
| Total | 0.54 (0.38, 0.70) | 0.46 (0.29, 0.64) | 0.66 (0.43, 0.89) | 0.26 (0.08, 0.45) | 0.77 (0.57, 0.98) |
| Urban | 0.68 (0.50, 0.86) | 0.64 (0.43, 0.85) | 0.75 (0.48, 1.02) | 0.43 (0.20, 0.66) | 0.87 (0.63, 1.11) |
| Rural | 0.17 (−0.17, 0.52) | 0.12 (−0.21, 0.44) | 0.46 (0.05, 0.87) | 0.00 (−0.32, 0.32) | 0.45 (0.05, 0.85) |
| pb | 0.011 | 0.009 | 0.248 | 0.034 | 0.079 |
| RESP mortality | |||||
| Total | 0.51 (0.10, 0.93) | 0.66 (0.20, 1.13) | 0.39 (−0.19, 0.97) | 0.19 (−0.52, 0.90) | 0.60 (0.13, 1.06) |
| Urban | 0.43 (−0.11, 0.98) | 0.72 (0.11, 1.34) | 0.09 (−0.67, 0.85) | −0.07 (−1.06, 0.93) | 0.58 (−0.01, 1.17) |
| Rural | 0.51 (−0.14, 1.16) | 0.33 (−0.39, 1.05) | 0.91 (0.02, 1.81) | 0.40 (−0.62, 1.42) | 0.46 (−0.31, 1.23) |
| pb | 0.854 | 0.420 | 0.172 | 0.519 | 0.809 |
| CVD mortality | |||||
| Total | 0.74 (0.50, 0.97) | 0.69 (0.41, 0.97) | 0.76 (0.44, 1.09) | 0.24 (−0.09, 0.57) | 0.99 (0.72, 1.25) |
| Urban | 0.80 (0.51, 1.08) | 0.78 (0.42, 1.14) | 0.80 (0.40, 1.20) | 0.37 (−0.06, 0.79) | 0.98 (0.66, 1.30) |
| Rural | 0.60 (0.18, 1.03) | 0.55 (0.08, 1.03) | 0.68 (0.11, 1.26) | 0.09 (−0.45, 0.63) | 0.96 (0.49, 1.43) |
| pb | 0.444 | 0.450 | 0.737 | 0.425 | 0.945 |
| CED mortality | |||||
| Total | 0.52 (0.20, 0.83) | 0.54 (0.19, 0.89) | 0.47 (0.02, 0.93) | −0.12 (−0.63, 0.40) | 0.87 (0.54, 1.19) |
| Urban | 0.61 (0.23, 0.98) | 0.50 (0.05, 0.95) | 0.71 (0.14, 1.28) | −0.01 (−0.66, 0.65) | 0.87 (0.46, 1.28) |
| Rural | 0.26 (−0.32, 0.83) | 0.51 (−0.17, 1.20) | −0.04 (−0.82, 0.75) | −0.19 (−1.00, 0.63) | 0.61 (−0.03, 1.24) |
| pb | 0.319 | 0.981 | 0.131 | 0.736 | 0.501 |
The 95% CI of an ER including zero indicates no statistical significance.
The p values were for difference tests in the associations between urban and rural areas.
In contrast, we found slightly greater associations between PM2.5 and RESP mortality in rural areas than in urban cities (0.51% [−0.14%, 1.16%] versus 0.43% [−0.11%, 0.98%]), particularly in females (0.91% [0.02%, 1.81%] versus 0.09% [−0.67%, 0.85%]), and in people aged 0 to 74 years (0.40% [−0.62%, 1.42%] versus −0.07% [−1.06%, 0.93%]).
Attributable fraction of mortality caused by ambient PM2.5
We observed that 2.11% (95% CI: 1.48%, 2.76%) of all-cause mortality was attributable to PM2.5 exposure in 215 locations, with a larger AF in urban cities than in rural areas (2.89% [2.12%, 3.67%] versus 0.61% [−0.60%, 1.84%]). Greater AFs comparing urban cities with rural areas were also found on RESP (1.82% [−0.47%, 4.18%] versus 1.70% [−0.47%, 3.94%]), CVD (3.35% [2.13%, 4.59%] versus 2.13% [0.63%, 3.65%]) and CED mortality (2.56% [0.98%, 4.17%] versus 0.90% [−1.09%, 2.94%]). However, we observed larger AFs of RESP mortality in rural females (3.08% [95% CI: 0.06%, 6.22%]) than in urban females (0.37% [95% CI: −2.76%, 3.64%]) (Table 3).
Table 3.
The AFa (%, 95% CI) of mortality attributable to ambient PM2.5 pollution by region
| Total | Sex |
Age (years) |
|||
|---|---|---|---|---|---|
| Male | Female | 0–74 | 75– | ||
| All-cause mortality | |||||
| Total | 2.11 (1.48, 2.76) | 1.81 (1.11, 2.51) | 2.59 (1.68, 3.50) | 1.01 (0.31, 1.72) | 3.07 (2.25, 3.90) |
| Urban | 2.89 (2.12, 3.67) | 2.71 (1.83, 3.61) | 3.18 (2.02, 4.35) | 1.80 (0.83, 2.78) | 3.75 (2.71, 4.80) |
| Rural | 0.61 (−0.60, 1.84) | 0.41 (−0.75, 1.57) | 1.62 (0.16, 3.11) | −0.02 (−1.12, 1.11) | 1.62 (0.18, 3.08) |
| pb | 0.002 | 0.002 | 0.105 | 0.017 | 0.020 |
| RESP mortality | |||||
| Total | 1.93 (0.36, 3.52) | 2.49 (0.74, 4.28) | 1.47 (−0.71, 3.71) | 0.66 (−1.78, 3.18) | 2.30 (0.51, 4.13) |
| Urban | 1.82 (−0.47, 4.18) | 3.03 (0.44, 5.71) | 0.37 (−2.76, 3.64) | −0.28 (−4.12, 3.77) | 2.47 (−0.03, 5.05) |
| Rural | 1.70 (−0.47, 3.94) | 1.11 (−1.28, 3.58) | 3.08 (0.06, 6.22) | 1.27 (−1.94, 4.62) | 1.57 (−1.03, 4.27) |
| pb | 0.942 | 0.295 | 0.233 | 0.554 | 0.631 |
| CVD mortality | |||||
| Total | 2.85 (1.93, 3.77) | 2.66 (1.57, 3.77) | 2.97 (1.68, 4.28) | 0.90 (−0.33, 2.15) | 3.91 (2.85, 4.98) |
| Urban | 3.35 (2.13, 4.59) | 3.27 (1.76, 4.82) | 3.36 (1.66, 5.11) | 1.49 (−0.24, 3.26) | 4.16 (2.79, 5.57) |
| Rural | 2.13 (0.63, 3.65) | 1.95 (0.27, 3.66) | 2.42 (0.38, 4.51) | 0.29 (−1.53, 2.16) | 3.45 (1.74, 5.21) |
| pb | 0.221 | 0.258 | 0.494 | 0.356 | 0.532 |
| CED mortality | |||||
| Total | 1.99 (0.78, 3.23) | 2.07 (0.73, 3.44) | 1.83 (0.06, 3.65) | −0.44 (−2.32, 1.49) | 3.44 (2.14, 4.76) |
| Urban | 2.56 (0.98, 4.17) | 2.10 (0.22, 4.02) | 3.01 (0.60, 5.49) | −0.03 (−2.72, 2.75) | 3.72 (1.97, 5.52) |
| Rural | 0.90 (−1.09, 2.94) | 1.81 (−0.60, 4.29) | −0.13 (−2.83, 2.66) | −0.65 (−3.37, 2.17) | 2.16 (−0.10, 4.49) |
| pb | 0.207 | 0.855 | 0.091 | 0.755 | 0.293 |
The 95% CI of an AF including zero indicates no statistical significance.
The p values were for difference tests in the associations between urban and rural areas.
An annual mean of 12.0 (95% CI: 8.4, 15.6) deaths per 100,000 population were attributable to PM2.5 exposure in all locations, with a mean of 16.5 (12.1, 21.0) deaths per 100,000 in urban cities and 3.4 (−3.3, 10.3) deaths per 100,000 in rural areas (Table 4).
Table 4.
Annual mean number of deaths (95% CI, per 100,000 people) attributable to ambient PM2.5 pollution by region
| Total | Sex |
Age (years) |
|||
|---|---|---|---|---|---|
| Male | Female | 0–74 | 75– | ||
| All-cause mortality | |||||
| Total | 12.0 (8.4, 15.6) | 5.9 (3.6, 8.2) | 6.2 (4.1, 8.4) | 2.5 (0.8, 4.3) | 9.8 (7.2, 12.4) |
| Urban | 16.5 (12.1, 21.0) | 8.8 (5.9, 11.8) | 7.8 (5.0, 10.7) | 4.3 (2.0, 6.6) | 12.6 (9.1, 16.1) |
| Rural | 3.4 (−3.3, 10.3) | 1.3 (−2.4, 5.1) | 3.8 (0.4, 7.3) | 0.0 (−2.9, 2.9) | 4.8 (0.5, 9.2) |
| RESP mortality | |||||
| Total | 1.7 (0.3, 3.1) | 1.2 (0.4, 2.1) | 0.6 (−0.3, 1.4) | 0.1 (−0.4, 0.6) | 1.6 (0.3, 2.8) |
| Urban | 1.5 (−0.4, 3.4) | 1.4 (0.2, 2.6) | 0.1 (−1.0, 1.3) | 0.0 (−0.6, 0.6) | 1.6 (0.0, 3.3) |
| Rural | 1.6 (−0.5, 3.8) | 0.6 (−0.7, 2.0) | 1.3 (0.0, 2.6) | 0.3 (−0.5, 1.2) | 1.1 (−0.7, 3.0) |
| CVD mortality | |||||
| Total | 6.5 (4.4, 8.6) | 3.3 (1.9, 4.6) | 3.1 (1.8, 4.5) | 0.7 (−0.3, 1.7) | 5.7 (4.2, 7.3) |
| Urban | 7.3 (4.6, 10.0) | 3.8 (2.0, 5.6) | 3.4 (1.7, 5.2) | 1.0 (−0.2, 2.2) | 6.2 (4.2, 8.3) |
| Rural | 5.1 (1.5, 8.8) | 2.6 (0.4, 4.8) | 2.6 (0.4, 4.9) | 0.3 (−1.5, 2.1) | 5.0 (2.5, 7.5) |
| CED mortality | |||||
| Total | 2.3 (0.9, 3.7) | 1.3 (0.5, 2.2) | 0.9 (0.0, 1.9) | −0.2 (−1.0, 0.6) | 2.5 (1.5, 3.4) |
| Urban | 2.8 (1.1, 4.6) | 1.2 (0.1, 2.4) | 1.5 (0.3, 2.8) | 0.0 (−1.4, 1.4) | 2.8 (1.5, 4.1) |
| Rural | 1.1 (−1.3, 3.5) | 1.2 (−0.4, 2.9) | −0.1 (−1.5, 1.4) | −0.3 (−1.7, 1.1) | 1.5 (−0.1, 3.2) |
Sensitivity analyses
Sensitivity analyses showed that our results were robust to the changes of dfs of long-term trend, using different cutoffs of urbanization ratio to define rural areas, using different definitions of extreme PM2.5 concentrations, and adjustment for other air pollutants including O3 and CO. However, the associations of PM2.5 with mortality were reduced after adjustment for NO2 and SO2 (Table S3). We did not find substantial changes in the associations between PM2.5 and mortality risks in all locations and in urban cities after limiting the study days with daily mean PM2.5 concentrations less than the maximum PM2.5 concentration of rural locations (Figure S5).
Discussion
This study comprehensively compared the associations of short-term exposures to PM2.5 and mortality risks between urban cities and rural areas in China. We found that short-term exposure to PM2.5 was positively associated with risks of all-cause, RESP, CVD, and CED mortality. The associations of PM2.5 with all-cause, CVD, and CED mortality were slightly greater in urban cities than in rural areas. In contrast, for RESP mortality, the effect of PM2.5 was more pronounced in rural areas than in urban cities. These disparities in PM2.5-mortality associations between urban cities and rural areas were also found in some subgroups by sex and age.
Many previous studies have illustrated the positive associations between short-term exposure to PM2.5 and mortality risk. A global meta-analysis demonstrated that each 10 μg/m3 increase in PM2.5 concentration was associated with 0.65%, 0.73%, 0.92%, and 0.72% increases in all-cause, RESP, CVD, and CED mortality risk, respectively.10 A recent comprehensive review conducted by the U.S. Environmental Protection Agency also reported a positive relationship between PM2.5 and mortality.11 However, the risk estimates reported in Western countries were generally larger than our findings, which may be related to the higher air pollution levels in China. Previous studies have illustrated that the effects of PM2.5 depend on the mean level of air pollution, with greater sizes at low PM2.5 concentrations.1 The results of the nonlinear exposure-response association between PM2.5 and mortality in this study also showed a steeper slope at low PM2.5 concentrations (<30 μg/m3), particularly for CVD and CED mortality.
Compared with those in rural areas, we found slightly greater associations of PM2.5 with CVD and CED mortality in urban cities. A few studies also reported consistent results with the present study.12,13 For example, Garcia et al. observed a slightly larger effect of PM2.5 exposure on mortality from ischemic heart disease in urban cities in California than in rural areas.12 The reasons for this phenomenon are not completely clear, and they may be related to the differences in the sources and chemical compositions of PM2.5. In urban cities, particularly in metropolises, the major emission sources of PM2.5 are traffic and industries, which cause emissions to usually contain more toxic components, such as elemental carbon (EC), organic carbon (OC), sulfate, nitrate, and heavy metals. These compositions could lead to higher levels of inflammation and oxidative stress and result in greater impairments to the human cardiovascular system.11,14,15 A study conducted in Germany reported that exposure to PM2.5 from a smelter area induced a greater inflammatory response than exposure to PM2.5 from a control area in healthy volunteers.14 We previously observed stronger associations of cardiovascular mortality with compositions of PM2.5, including OC, EC, sulfate, and nitrate, than other compositions.16 In addition, rapid urbanization across China promoted the in-migration of a substantial population, particularly young people, to urban cities. However, these in-migrated people tend to reside in more polluted areas and hence intensify the health damage of air pollution.6 The influence of in-migration may be an important reason for the larger urban-rural disparity of association between PM2.5 and CVD mortality in younger people than in the elderly (Table 2).
In contrast to CVD and CED mortality, we observed more pronounced effects of PM2.5 on RESP mortality, particularly at higher PM2.5 concentrations in rural areas compared with urban cities, although the differences were not statistically significant. A few previous studies also suggested stronger effects of PM2.5 on RESP mortality in suburban or rural areas than in urban cities in China.5,8,17 For instance, Zhao et al. found that the relative risk of PM2.5-related RESP mortality was stronger in rural areas than in urban cities across China and that PM2.5 pollution was the dominant driving force of RESP mortality in rural areas.8 These findings indicate that the RESP mortality burden caused by PM2.5 might be underestimated in countries with large rural populations if we use concentration–response relationships derived from urban cities to assess the mortality burden of PM2.5. This finding has important implications for air pollution control in China because there are more than 500 million people living in rural China.
The reasons for the greater associations of PM2.5 with RESP mortality risk in rural areas than in urban cities remain unclear and may be explained by several reasons. First, compared with urban residents, rural populations have disadvantaged socioeconomic conditions, sanitation, health care systems, living environments, and health status with more respiratory diseases (Table S4),18 which can increase their susceptibility to PM2.5.17 Second, rural residents, particularly women, usually have higher levels of exposure to indoor air pollution from solid fuels for cooking and heating without adequate ventilation compared with urban residents.19,20 As a result, the exposure to ambient PM2.5 in rural areas might be underestimated, and indoor air pollutants may synergize with the RESP mortality risks caused by a per-unit increase in ambient PM2.5 concentrations. A recent global meta-analysis also reported stronger effects of household air pollution on respiratory diseases than on cardiovascular diseases.21 Third, higher levels of some chemical components, such as neonicotinoid insecticide, of PM2.5 in rural areas may also contribute to the greater health impacts of PM2.5.22,23 Fourth, the greater effects of PM2.5 in rural areas may also be related to a higher prevalence of smoking and second-hand smoke,24,25 which may intensify the effects of ambient air pollution on RESP mortality risks.
Urban-rural disparities in the associations between PM2.5 and mortality were also observed in people of different sexes and ages. For example, a much stronger association of PM2.5 with RESP mortality was found in rural females than in urban females, which may be related to their differences in exposures, socioeconomic conditions, and health status. Compared with urban females, rural females usually have harder physical activities,26 more indoor air pollution from passive smoking and solid fuels for cooking and heating,24,25 and poorer health status,27 which may increase their exposure and susceptibility to air pollution. In addition, our results showed that the effects of PM2.5 were generally greater in females than in males and in older people than in younger people, which was consistent with previous studies.3,28
Our findings indicate that air pollution can result in discrepant adverse health between urban and rural people. Different measures are needed to design urban and rural residents. In urban areas, efforts should be spent on upgrading industry structures and technologies, upgrading energy structures (such as developing economically and socially sustainable alternations to fossil fuel used), and promoting green transportation (such as public and electric transportation). In rural areas, more efforts should focus on legislation to ban smoking, reduce indoor pollution exposure, improve ventilation, and promote the usage of protective measurements for air pollution. Moreover, the different patterns of PM2.5-mortality associations in urban cities versus rural areas should be considered in future epidemiological studies and the estimations of disease burden attributable to air pollution.
Many previous studies have estimated the mortality burden attributable to PM2.5 exposure globally. However, most studies have focused on long-term exposure to PM2.5,29, 30, 31, 32, 33 and information on the mortality burden attributable to short-term PM2.5 exposure is scarce.34 In this study, we observed that an annual mean of 12.0 deaths per 100,000 population were attributable to PM2.5 exposure in all included locations, and the corresponding AF was 2.11%. Our finding was lower than that in the study by Li et al., which reported that the additional death rate was 13.78 per 100,000 people throughout China.34 This difference may be partially because the present study considered the disparities in PM2.5-mortality associations between urban and rural areas. We found a larger death rate (16.5/100,000 people) in urban areas than in rural areas (3.4/100,000 people). However, Li et al. applied a unique exposure-response association to estimate the mortality burden related to PM2.5 throughout China,34 which may lead to an overestimation. The larger mortality burden in urban areas may be due to the stronger association between PM2.5 and all-cause mortality and the higher PM2.5 concentrations. Therefore, the urban-rural disparities of PM2.5-mortality associations should not be ignored in estimating the disease burden of air pollution.
Strengths and limitations
This study has several strengths. First, our study compared the effects of PM2.5 exposure on all causes and cause-specific mortality in both urban cities and rural areas in China and provided new insights into the urban-rural difference in the effects of PM2.5 on mortality. Second, the large-scale study including 215 locations in different regions of China increased the external representativeness of our findings. Third, we employed a random forest model to assess the daily PM2.5 concentrations in each location, which could reduce the misclassification bias.
There are also several limitations. First, similar to many previous time-series studies, this study was an ecological study. Therefore, the association between PM2.5 and mortality should be interpreted with caution. Second, we did not find an official definition of rural areas in China and alternatively employed the urbanization ratio to define urban cities and rural areas. Nevertheless, the results of sensitivity analyses showed the robustness of our findings to the cutoffs of the urbanization ratio. Third, as we discussed above, people in rural areas of China usually have higher rates of indoor air pollution than urban residents.19,20 Unfortunately, the present study cannot adjust for indoor pollution, which may lead to bias in our findings.
Conclusion
We observed slightly stronger associations of PM2.5 with CVD and CED mortality risks in urban cities than in rural areas and slightly greater associations with RESP mortality in rural areas than in urban cities. Our findings suggest that the disparities in PM2.5-mortality associations between urban cities and rural areas should be considered in the assessment of mortality burden attributable to air pollution. Spatially targeted measures are needed to reduce PM2.5-related mortality in China.
Materials and methods
Study locations
The present study included 215 locations covering Guangdong, Zhejiang, Jilin, and Yunnan provinces (Figure 1). We selected these locations from the provincial mortality surveillance system, which was administered by the corresponding provincial Center for Disease Control and Prevention (CDC) following the same protocol as China's Disease Surveillance Points System.35 At each surveillance point, all deaths certified by clinical doctors or local CDC professionals are reported to the CDC using an Internet-based reporting system. To ensure adequate statistical power, only the surveillance points with population sizes exceeding 200,000 or annual mortality rates >4‰ were included in our study, which has been described in previous studies.36, 37, 38 We further divided these locations into urban areas (n = 106 locations) and rural regions (n = 109 locations) according to whether the urbanization ratio exceeds 50% because the history of urbanization development worldwide showed that 50% was an important turning point, which not only indicates that the economy would continue to develop rapidly but also may cause changes in disease patterns.39 The urbanization ratio reflects the ratio of the urban population to the total population size.40 The urbanization ratios for the urban and rural areas are 0.71 (standard deviation [SD] = 0.16) and 0.36 (SD = 0.10), respectively.
Data collection
Daily mortality data from January 1, 2014, to December 31, 2017, in every included location were obtained from the corresponding provincial CDC. Based on the codes of the 10th revision of the International Classification of Diseases (ICD-10), we extracted daily mortality data from all nonaccidental causes (codes A00-R99), RESP (codes J00-J99), CVD (codes I00-I99), and CED (codes I60-I69). We then classified daily death counts into several subgroups by sex and age (0–74 and ≥75 years).
Because some selected locations were not covered by the air quality monitoring system, we collected daily average air pollution data at national air pollutant monitoring stations from the National Urban Air Quality Real-time Publishing Platform (http://106.37.208.233:20035/), and then a random forest model was applied to simulate the daily average air pollution data at each study location.41,42 We input predictors including type of land use, road density, population density, meteorological factors, and gross domestic product (GDP) per capita in the model to reduce misclassification bias.41,42 The coefficient of determination (R2) from a linear fitting of predictions and observations of ground monitors was 0.83, and the root mean squared prediction error (RMSE) of daily PM2.5 was 10.61 μg/m3. Information on other air pollutant estimations can be found in the supplemental information (Supplemental section 1.1 and Figures S1 and S2).
Daily meteorological data, including the mean temperature (TM, °C) and relative humidity (RH, %), of 698 weather stations across China were derived from the China Meteorological Data Sharing Service System (http://data.cma.cn/). We employed Australian National University Splines thin plate smoothing software to interpolate the daily TM and RH at a 0.01 ° × 0.01 ° resolution for all of China.37 The results of 10-fold cross-validation show good prediction accuracy of the interpolation method for daily TM (R2 = 0.96, RMSE = 2.37°C) and RH (R2 = 0.81, RMSE = 7.70%) (see Supplemental text section 1.2 and Figure S3 in supplemental information). Daily TM and RH of 215 locations were extracted from the interpolated grid.
Population data (from 2014 to 2017) and GDP per capita (in 2015) for each study location were obtained from the Statistical Yearbook.43 Socioeconomic characteristics, including average years of education and urban population size, were obtained from the 2010 Population Census in China.43 The data source of predictors (raster data) in the random forest model can be seen in Supplemental text section 1.1 of the supplemental information.
Statistical analyses
We applied a two-stage approach, which has been widely applied in previous studies.37,44 In the first stage, we estimated the location-specific nonlinear PM2.5-mortality associations using a distributed lag nonlinear model (DLNM) combined with a quasi-Poisson distribution function. A quadratic B-spline (bs) function was employed to estimate the nonlinear and lag effects of PM2.5. A bs function was used to estimate and control for nonlinear and lag effects of contemporaneous daily TM. A natural cubic spline (ns) with 3 degrees of freedom (df) was used to control for RH, a ns with seven df per year to control for the seasonal and long-term trends in mortality, and a categorical variable to control for the day of the week.
In the second stage, we pooled the location-specific overall exposure-response curves using a multivariate meta-analysis with random effects models. The minimum mortality pollution was taken as a reference in the pooled exposure-response curve. To avoid the potential impacts of extreme PM2.5 concentrations on model fitting, days with PM2.5 concentrations below the 0.5% centile or above the 99.5% centile in the distribution of PM2.5 concentrations were removed from the DLNM modeling.
The pooled exposure-response curves between PM2.5 and mortality showed approximately linear relationships. Therefore, in the first stage, we also applied a distributed lag model (DLM) to estimate the location-specific linear PM2.5-mortality associations, in which a linear function and a bs function were employed to estimate the linear and lag effects of PM2.5, respectively. The parameters of other variables in the DLM were the same as those in the DLNM. The results of preliminary analyses showed that the greatest cumulative excess risk (ER) of mortality for each 10 μg/m3 increase in PM2.5 was observed within lag 0–3 days (Table S1 and Figure S4). Thus, we estimated the 4-day (lag 0–3 days) cumulative ER (%, (RR-1)∗100%) of all-cause and cause-specific mortality for exposure to PM2.5 concentrations in both DLNM and DLM analyses, which was consistent with previous studies.45,46 In particular, the cumulative ER (%, 95% confidence interval [CI]) of mortality risk attributable to each 10 μg/m3 increase in PM2.5 during lag 0–3 days in the DLM analyses was reported, which was the combined effect of exposure and lag dimensions (Supplemental text section 1.3 of the supplemental information).
Based on the pooled exposure-response relationships, we estimated their corresponding attributable fractions (AF) of mortality and number of deaths (/100,000) attributable to PM2.5 exposure (Supplemental text section 1.4 of the supplemental information). All of the above analyses were separately implemented in all locations, urban locations, rural locations, males, females, people <75 years old, people ≥75 years old, and mortality, including all-cause, RESP, CVD, and CED mortality. We applied 2-sample z-tests using stratification-specific point estimates and their SEs to test the potential effect modification of regions (urban versus rural).47
Sensitivity analyses
To test the robustness of our results, we changed the dfs for the time trend from 6 to 8 per year, cutoffs of urbanization ratio (0.45, 0.50, and 0.55) to define rural areas, and percentiles (<2.0% or >98.0%, <1.0% or >99.0%, <0.5% or >99.5%) to define extreme PM2.5 concentrations. Two-pollutant models were used to adjust for O3, CO, NO2, and SO2. Previous studies have shown that the exposure-response association between PM2.5 and mortality was also affected by PM2.5 concentrations.1 In this study, we found higher mean PM2.5 concentrations in urban cities than in rural areas. Therefore, we estimated the nonlinear and linear exposure-response association between PM2.5 and mortality risks in all locations and urban cities only on days with daily PM2.5 concentrations less than the maximum PM2.5 concentration (134.7 μg/m3) in rural areas.
R software version 3.6.1 (https://cran.r-project.org/bin/windows/base/old/3.6.1/) was used to conduct data analysis. A p value of less than 0.05 was considered to indicate statistical significance.
Ethical approval
This study was approved by the Ethics Committee of Guangdong Provincial CDC (No. 2019025). Data were analyzed at the aggregate level, and no participants were contacted.
Acknowledgments
This work was supported by the National Key Research and Development Program of China (2018YFA0606200), National Natural Science Foundation of China (81874276, 42075173, 42175181), Natural Science Foundation of Guangdong, China (2019A1515011264), and the Science and Technology Program of Guangzhou (201607010004). The funders were not involved in the research and preparation of the article, including study design; collection, analysis, and interpretation of data; writing of the article; or in the decision to submit it for publication.
Author contributions
W.M. and T.L. conceptualized the study; T.L., H.M., M.Y., J.H., J.X., S.C., W.Z., X.L., G.H., Z.R., and W.M. developed the methodology; H.M., S.C., W.Z., and X.L. performed the formal analysis; T.L., H.M., M.Y., and W.M. prepared the original draft; T.L., H.M., M.Y., Y.Xiao, B.H., L.L., H.Z., R.H., Z.H., Y.Xu, L.Y., M.Q., Q.Z., X.X., W.G., J.H., J.X., S.C., W.Z., X.L., G.H., Z.R., C.H., Y.D., and W.M. reviewed and edited the manuscript; W.M., T.L., and C.H. acquired the funding; M.Y., Y.Xiao, B.H., L.L., H.Z., R.H., Z.H., Y.Xu, L.Y., M.Q., Q.Z., X.X., W.G., and Y.D. acquired the resources; and W.M., T.L., L.L., and C.H. supervised the study.
Declaration of interests
The authors declare no competing interests.
Published Online: September 30, 2021
Footnotes
Supplemental information can be found online at https://doi.org/10.1016/j.xinn.2021.100171.
Lead contact website
Supplemental information
References
- 1.Liu C., Chen R., Sera F., et al. Ambient particulate air pollution and daily mortality in 652 cities. N. Engl. J. Med. 2019;381:705–715. doi: 10.1056/NEJMoa1817364. [DOI] [PMC free article] [PubMed] [Google Scholar]
- 2.Yang Y., Qi J., Ruan Z., et al. Changes in life expectancy of respiratory diseases from attaining daily PM2.5 standard in China: a nationwide observational study. Innovation. 2020;1:100064. doi: 10.1016/j.xinn.2020.100064. [DOI] [PMC free article] [PubMed] [Google Scholar]
- 3.Chen R., Yin P., Meng X., et al. Fine particulate air pollution and daily mortality. A nationwide analysis in 272 Chinese cities. Am. J. Respir. Crit. Care Med. 2017;196:73–81. doi: 10.1164/rccm.201609-1862OC. [DOI] [PubMed] [Google Scholar]
- 4.Du W., Li X., Chen Y., Shen G. Household air pollution and personal exposure to air pollutants in rural China – a review. Environ. Pollut. 2018;237:625–638. doi: 10.1016/j.envpol.2018.02.054. [DOI] [PubMed] [Google Scholar]
- 5.Wang H., Gao Z., Ren J., et al. An urban-rural and sex differences in cancer incidence and mortality and the relationship with PM2.5 exposure: an ecological study in the southeastern side of Hu line. Chemosphere. 2019;216:766–773. doi: 10.1016/j.chemosphere.2018.10.183. [DOI] [PubMed] [Google Scholar]
- 6.Liu M., Huang Y., Ma Z., et al. Spatial and temporal trends in the mortality burden of air pollution in China: 2004–2012. Environ. Int. 2017;98:75–81. doi: 10.1016/j.envint.2016.10.003. [DOI] [PMC free article] [PubMed] [Google Scholar]
- 7.Lu X., Lin C., Li W., et al. Analysis of the adverse health effects of PM2.5 from 2001 to 2017 in China and the role of urbanization in aggravating the health burden. Sci. Total Environ. 2019;652:683–695. doi: 10.1016/j.scitotenv.2018.10.140. [DOI] [PubMed] [Google Scholar]
- 8.Zhao S., Liu S., Hou X., et al. Air pollution and cause-specific mortality: a comparative study of urban and rural areas in China. Chemosphere. 2021;262:127884. doi: 10.1016/j.chemosphere.2020.127884. [DOI] [PubMed] [Google Scholar]
- 9.Karambelas A., Holloway T., Kinney P.L., et al. Urban versus rural health impacts attributable to PM2.5 and O3 in northern India. Environ. Res. Lett. 2018;13:064010. [Google Scholar]
- 10.Orellano P., Reynoso J., Quaranta N., et al. Short-term exposure to particulate matter (PM10 and PM2.5), nitrogen dioxide (NO2), and ozone (O3) and all-cause and cause-specific mortality: systematic review and meta-analysis. Environ. Int. 2020;142:105876. doi: 10.1016/j.envint.2020.105876. [DOI] [PubMed] [Google Scholar]
- 11.U.S. EPA. U.S. Environmental Protection Agency . 2019. Integrated Science Assessment (ISA) for Particulate Matter.https://cfpub.epa.gov/ncea/isa/recordisplay.cfm?deid=347534#tab-3 (Final Report, Dec 2019). (EPA/600/R-19/188) [PubMed] [Google Scholar]
- 12.Garcia C.A., Yap P.S., Park H.Y., Weller B.L. Association of long-term PM2.5 exposure with mortality using different air pollution exposure models: impacts in rural and urban California. Int. J. Environ. Health Res. 2016;26:145–157. doi: 10.1080/09603123.2015.1061113. [DOI] [PMC free article] [PubMed] [Google Scholar]
- 13.Ho H.C., Wong M.S., Yang L., et al. Spatiotemporal influence of temperature, air quality, and urban environment on cause-specific mortality during hazy days. Environ. Int. 2018;112:10–22. doi: 10.1016/j.envint.2017.12.001. [DOI] [PubMed] [Google Scholar]
- 14.Schaumann F., Borm P.J., Herbrich A., et al. Metal-rich ambient particles (particulate matter 2.5) cause airway inflammation in healthy subjects. Am. J. Respir. Crit. Care Med. 2004;170:898–903. doi: 10.1164/rccm.200403-423OC. [DOI] [PubMed] [Google Scholar]
- 15.Avogbe P., Ayi-Fanou L., Autrup H., et al. Ultrafine particulate matter and high-level benzene urban air pollution in relation to oxidative DNA damage. Carcinogenesis. 2005;26:613–620. doi: 10.1093/carcin/bgh353. [DOI] [PubMed] [Google Scholar]
- 16.Lin H., Tao J., Du Y., et al. Particle size and chemical constituents of ambient particulate pollution associated with cardiovascular mortality in Guangzhou, China. Environ. Pollut. 2016;208:758–766. doi: 10.1016/j.envpol.2015.10.056. [DOI] [PubMed] [Google Scholar]
- 17.Xu M., Sbihi H., Pan X., Brauer M. Modifiers of the effect of short-term variation in PM2.5 on mortality in Beijing, China. Environ. Res. 2020;183:109066. doi: 10.1016/j.envres.2019.109066. [DOI] [PubMed] [Google Scholar]
- 18.Liu J., Cai Y. Analysis of causes of death in Chinese mainland population in urban and rural areas from 2002 to 2009 (In Chinese) Chin. J. Health Stat. 2012;29:510–513. [Google Scholar]
- 19.Chan K.H., Lam K.B.H., Kurmi O.P., et al. Trans-generational changes and rural-urban inequality in household fuel use and cookstove ventilation in China: a multi-region study of 0.5 million adults. Int. J. Hyg. Environ. Health. 2017;220:321–328. doi: 10.1016/j.ijheh.2017.09.010. [DOI] [PMC free article] [PubMed] [Google Scholar]
- 20.Arku R.E., Birch A., Shupler M., et al. Characterizing exposure to household air pollution within the prospective urban rural epidemiology (PURE) study. Environ. Int. 2018;114:307–317. doi: 10.1016/j.envint.2018.02.033. [DOI] [PMC free article] [PubMed] [Google Scholar]
- 21.Lee K.K., Bing R., Kiang J., et al. Adverse health effects associated with household air pollution: a systematic review, meta-analysis, and burden estimation study. Lancet Glob. Health. 2020;8:e1427–e1434. doi: 10.1016/S2214-109X(20)30343-0. [DOI] [PMC free article] [PubMed] [Google Scholar]
- 22.Zhou Y., Guo J., Wang Z., et al. Levels and inhalation health risk of neonicotinoid insecticides in fine particulate matter (PM2.5) in urban and rural areas of China. Environ. Int. 2020;142:105822. doi: 10.1016/j.envint.2020.105822. [DOI] [PubMed] [Google Scholar]
- 23.Hernández A., Casado I., Pena G., et al. Low level of exposure to pesticides leads to lung dysfunction in occupationally exposed subjects. Inhal. Toxicol. 2008;20:839–849. doi: 10.1080/08958370801905524. [DOI] [PubMed] [Google Scholar]
- 24.Zhou J., Britigan D.H., Rajaram S.S., et al. Association between leisure time physical activity preference and behavior: evidence from the China Health & Nutrition Survey, 2004-2011. BMC Public Health. 2017;17:451. doi: 10.1186/s12889-017-4386-5. [DOI] [PMC free article] [PubMed] [Google Scholar]
- 25.Gao C., Yao Y., Niu H., et al. Urban-rural differences in related factors of second-hand smoke exposure: a cross-sectional study of adult non-smokers in Northeast China. J. Public Health (Oxf) 2019;41:321–328. doi: 10.1093/pubmed/fdy120. [DOI] [PubMed] [Google Scholar]
- 26.Zhu N., Z M., Yu C., et al. Prevalence of "healthy lifestyle" in Chinese adults (In Chinese) Chin. J. Epidemiol. 2019;40:136–141. doi: 10.3760/cma.j.issn.0254-6450.2019.02.003. [DOI] [PubMed] [Google Scholar]
- 27.Huang Q., Jiang H., Wang L., et al. Analysis on detection status of cardio-metabolic related risk factors in women aged 15-49 years in 15 provinces in China (In Chinese) Chin. J. Epidemiol. 2020;41:190–194. doi: 10.3760/cma.j.issn.0254-6450.2020.02.010. [DOI] [PubMed] [Google Scholar]
- 28.Di Q., Dai L., Wang Y., et al. Association of short-term exposure to air pollution with mortality in older adults. JAMA. 2017;318:2446–2456. doi: 10.1001/jama.2017.17923. [DOI] [PMC free article] [PubMed] [Google Scholar]
- 29.Yin P., Brauer M., Cohen A.J., et al. The effect of air pollution on deaths, disease burden, and life expectancy across China and its provinces, 1990–2017: an analysis for the Global Burden of Disease Study 2017. Lancet Planet. Health. 2020;4:e386–e398. doi: 10.1016/S2542-5196(20)30161-3. [DOI] [PMC free article] [PubMed] [Google Scholar]
- 30.Wang Q., Wang J., He M., et al. A county-level estimate of PM related chronic mortality risk in China based on multi-model exposure data. Environ. Int. 2018;110:105–112. doi: 10.1016/j.envint.2017.10.015. [DOI] [PMC free article] [PubMed] [Google Scholar]
- 31.GBD 2019 Risk Factors Collaborators Global burden of 87 risk factors in 204 countries and territories, 1990-2019: a systematic analysis for the Global Burden of Disease Study 2019. Lancet. 2020;396:1223–1249. doi: 10.1016/S0140-6736(20)30752-2. [DOI] [PMC free article] [PubMed] [Google Scholar]
- 32.Lelieveld J., Evans J., Fnais M., et al. The contribution of outdoor air pollution sources to premature mortality on a global scale. Nature. 2015;525:367–371. doi: 10.1038/nature15371. [DOI] [PubMed] [Google Scholar]
- 33.Saini P., Sharma M. Cause and age-specific premature mortality attributable to PM exposure: an analysis for million-plus Indian cities. Sci. Total Environ. 2020;710:135230. doi: 10.1016/j.scitotenv.2019.135230. [DOI] [PubMed] [Google Scholar]
- 34.Li T., Guo Y., Liu Y., et al. Estimating mortality burden attributable to short-term PM exposure: a national observational study in China. Environ. Int. 2019;125:245–251. doi: 10.1016/j.envint.2019.01.073. [DOI] [PMC free article] [PubMed] [Google Scholar]
- 35.Liu S., Wu X., Lopez A.D., et al. An integrated national mortality surveillance system for death registration and mortality surveillance, China. Bull. World Health Organ. 2016;94:46–57. doi: 10.2471/BLT.15.153148. [DOI] [PMC free article] [PubMed] [Google Scholar]
- 36.Ma W., Wang L., Lin H., et al. The temperature-mortality relationship in China: an analysis from 66 Chinese communities. Environ. Res. 2015;137:72–77. doi: 10.1016/j.envres.2014.11.016. [DOI] [PubMed] [Google Scholar]
- 37.Chen S., Hu J., Gong W., et al. Developing a novel indicator to estimate years of life lost attributable to temperature variability between neighboring days. Environ. Res. Lett. 2020;15:105010. [Google Scholar]
- 38.Liu T., Zhou C., Zhang H., et al. Ambient temperature and years of life lost: a national study in China. Innovation. 2021;2:100072. doi: 10.1016/j.xinn.2020.100072. [DOI] [PMC free article] [PubMed] [Google Scholar]
- 39.LI H. International phenomenon observation of urbanization rate exceeding 50% threshold: implications for China (In Chinese) Urban Plann. Forum. 2013;44:43–50. [Google Scholar]
- 40.Chen K., Zhou L., Chen X., et al. Urbanization level and vulnerability to heat-related mortality in Jiangsu province, China. Environ. Health Perspect. 2016;124:1863–1869. doi: 10.1289/EHP204. [DOI] [PMC free article] [PubMed] [Google Scholar]
- 41.Liu T., Chen X., Xu Y., et al. Gut microbiota partially mediates the effects of fine particulate matter on type 2 diabetes: evidence from a population-based epidemiological study. Environ. Int. 2019;130:104882. doi: 10.1016/j.envint.2019.05.076. [DOI] [PubMed] [Google Scholar]
- 42.Liu X., Ye Y., Chen Y., et al. Effects of prenatal exposure to air particulate matter on the risk of preterm birth and roles of maternal and cord blood LINE-1 methylation: a birth cohort study in Guangzhou, China. Environ. Int. 2019;133:105177. doi: 10.1016/j.envint.2019.105177. [DOI] [PubMed] [Google Scholar]
- 43.National Bureau of Statistics of China https://data.stats.gov.cn/english/
- 44.Gasparrini A., Armstrong B., Kenward M.G. Multivariate meta-analysis for non-linear and other multi-parameter associations. Stat. Med. 2012;31:3821–3839. doi: 10.1002/sim.5471. [DOI] [PMC free article] [PubMed] [Google Scholar]
- 45.Lin Y., Chen C., Yeh H., et al. Emergency room visits associated with particulate concentration and Asian dust storms in metropolitan Taipei. J. Expo. Sci. Environ. Epidemiol. 2016;26:189–196. doi: 10.1038/jes.2015.70. [DOI] [PubMed] [Google Scholar]
- 46.Wang X., Kindzierski W., Kaul P. Comparison of transient associations of air pollution and AMI hospitalisation in two cities of Alberta, Canada, using a case-crossover design. BMJ Open. 2015;5:e009169. doi: 10.1136/bmjopen-2015-009169. [DOI] [PMC free article] [PubMed] [Google Scholar]
- 47.Altman D., Bland J. Interaction revisited: the difference between two estimates. BMJ. 2003;326:219. doi: 10.1136/bmj.326.7382.219. [DOI] [PMC free article] [PubMed] [Google Scholar]
Associated Data
This section collects any data citations, data availability statements, or supplementary materials included in this article.