Abstract
Comprehensive integration of process steps into a miniaturised version of synthetic biology workflows remains a crucial task in automating the design of biosystems. However, each of these process steps has specific demands with respect to the environmental conditions, including in particular the composition of the surrounding fluid, which makes integration cumbersome. As a case in point, transformation, i.e. reprogramming of bacteria by delivering exogenous genetic material (such as DNA) into the cytoplasm, is a key process in molecular engineering and modern biotechnology in general. Transformation is often performed by electroporation, i.e. creating pores in the membrane using electric shocks in a low conductivity environment. However, cell preparation for electroporation can be cumbersome as it requires the exchange of growth medium (high-conductivity) for low-conductivity medium, typically performed via multiple time-intensive centrifugation steps. To simplify and miniaturise this step, we developed an acoustofluidic device capable of trapping the bacterium Escherichia coli non-invasively for subsequent exchange of medium, which is challenging in acoustofluidic devices due to detrimental acoustic streaming effects. With an improved etching process, we were able to produce a thin wall between two microfluidic channels, which, upon excitation, can generate streaming fields that complement the acoustic radiation force and therefore can be utilised for trapping of bacteria. Our novel design robustly traps Escherichia coli at a flow rate of 10 μL min−1 and has a cell recovery performance of 47 ± 3% after washing the trapped cells. To verify that the performance of the medium exchange device is sufficient, we tested the electrocompetence of the recovered cells in a standard transformation procedure and found a transformation efficiency of 8 × 10⁵ CFU per μg of plasmid DNA. Our device is a low-volume alternative to centrifugation-based methods and opens the door for miniaturisation of a plethora of microbiological and molecular engineering protocols.
Comprehensive integration of process steps into a miniaturised version of synthetic biology workflows remains a crucial task in automating the design of biosystems. We present an acoustofluidic chip, capable of automated medium exchange of bacteria.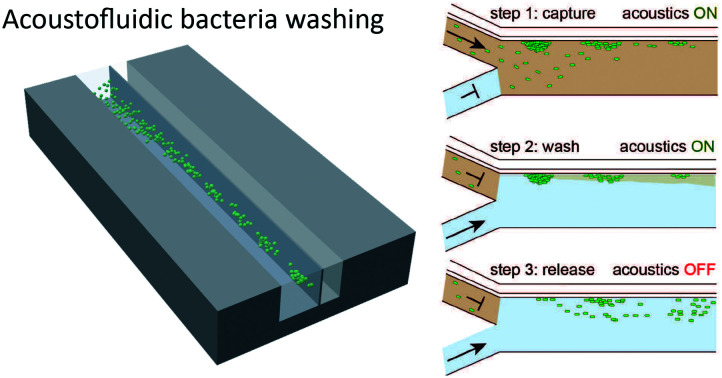
1. Introduction
Modern biosystems engineering aims to automate engineering operations required to reprogram cells1–3 to accelerate the design–build–test–learn cycle and construct efficient biosystems for applications. A prime set of target organisms are bacteria, which play a central role in crucial fields such as metabolic4 or microbiome engineering.5 However, the different single steps that make up complete engineering operations all require quite diverse environmental conditions, which makes the integration of biological engineering cumbersome. A prime example is transformation, an essential step in genetic engineering workflows, which describes the change in genetic potential of a host cell by inserting synthetic DNA into it. For genetic material to enter the bacterial cell, it must first pass the cell envelope, which in the case of the bacterial standard chassis Escherichia coli (E. coli) consists of two layers, the outer and the cytoplasmic membrane. To cross this envelope, cells need to be made ready to form holes in the envelope or “made competent”, which is typically achieved by transferring cells out of growth medium and into specific aqueous solutions, which either contain calcium ions6 or are of particularly low conductivity.7 In the latter case of “electroporation”, reversible pores form in the cell membrane during an electric shock, which leads in the absence of low conductivity media to strong currents and Joule heating that would impact cell viability. This medium requirement strongly contrasts the conditions under which the cells are produced before they are exposed to electroporation conditions, which include dissolved salts and other charged molecules. Therefore, medium exchange is an indispensable preparatory step for each form of transformation of bacteria, but there are only very few suitable microfluidic formats to conduct such a fundamental step. Nearly all previous attempts to automate large-scale biosystems engineering8–13 rely on the preparation of transformation-competent cells off-chip, which makes copious use of large-scale batch centrifugation (several rounds, scales between 200 μL and several litres), while in reality, more advanced biosystems engineering applications would require a quasi-continuous and integrated transformation activity.14 One earlier attempt at integrating medium exchange into a digital droplet-based procedure relied on the selective attachment of bacterial cells to lectins immobilized on magnetic beads to retain cells and enable transfer into a different liquid.15 However, the reversible cell immobilization efficiency depends strongly on the medium composition, which is a significant reduction of the freedom of experimental design.
Recently, several research groups have developed methods for continuous medium exchange in microfluidic systems. These methods are based on particle trapping,16–20 dragging particles through a liquid interface,21–29 continuous buffer exchange,30 droplet merging,31–33 and fluid relocation.34
The forces utilized to achieve medium exchange are manifold. The most commonly used forces are dielectric,22,35–38 magnetic,16,19,23,32,33 hydrodynamic,28,39,40 and acoustic.26,29,37,41–46 However, each of these methods exhibits fundamental limitations, such as the requirement of low flow rates or particle labelling. In this work, medium exchange is achieved by first trapping bacterial cells by acoustic forces and subsequently flushing the channel with a new medium such as ultrapure water. The contactless manipulation of particles using acoustic forces, acoustophoresis, is one of the most used techniques for particle manipulation because it is non-invasive, label-free, flexible in design, and biocompatible.47 Acoustophoresis is based on the acoustic radiation force and the drag force from acoustic streaming. The acoustic radiation force results from scattering of ultrasonic waves on the surface of a particle. Its magnitude mainly depends on the particle size, the density and compressibility difference between the particle and its surrounding medium, and the amplitude of the acoustic pressure. In bulk acoustic wave (BAW) devices, an acoustic standing wave is generated in the microfluidic channel by matching the acoustic wavelength in the fluid to the channel's dimensions. Particles with a positive acoustic contrast, which is typical for biological samples, accumulate in the pressure nodes of a 1D standing wave. There are several ways to trap particles with acoustic forces.48 One way is to adjust the shape of a microfluidic chamber such that radiation forces are generated that point against the flow direction.49–51 Further, two 1D standing fields can be generated perpendicular to each other in a square-shaped cavity.18,52,53 Finally, acoustic modes inside glass capillaries can be utilized to retain particles against a flow at a specific position.54,55
In this work, we developed a new approach to trap bacteria in a BAW device. Trapping of bacteria is particularly challenging due to the small size and thus has only been performed successfully by few groups. Bacteria trapping by optical forces enables the precise control of very small individual particles.56 However, only few particles can be trapped simultaneously, and the setup is rather complex to integrate into a lab-on-a-chip application. Mechanical methods such as bendable nanowires can be used for bacteria trapping in high velocity flows, but cannot be actively controlled and are rather complex to fabricate.57 Filtration methods such as nanopores are low cost and simple to integrate into a microfluidic setup. However, these systems are prone to clogging, which is very unlikely to happen in our system, since we do not rely on feature sizes that are in the same scale as the bacteria we want to trap.58 Devices relying on electrical forces to trap particles such as electrophoretic concentration59 or dielectrophoresis60 are simple to integrate into microfluidic setups but generally demonstrate lower throughput than acoustic setups and can damage cells due to Joule heating. Magnetophoresis also offers a promising alternative method for the trapping of bacteria, since it can be applied at high throughput and is easy to integrate. However, depending on the method used, it requires particle labelling61 or ferrofluids.62 Acoustic trapping of bacteria, as presented in our manuscript, has been shown before. However, the design presented in the literature requires seed particles,17 lowering the throughput and complicating an automated approach.
One major drawback of acoustophoresis is its limitation concerning particle size. The manipulation of particles below a critical particle radius is impeded by the drag force resulting from acoustic streaming. Acoustic streaming is a time-averaged nonlinear viscous effect that originates from the harmonic forcing of the fluid. Boundary-driven streaming affects the particles through the Stokes drag force, competing with the acoustic radiation force. The latter prevails if the particle has a radius larger than a critical radius, which is around 1 μm in prominent BAW systems.63 This complicates the acoustic manipulation of bacteria, e.g. the biotechnological model organism and workhorse E. coli, as the critical radius overlaps with the typical cell dimensions. In general, to allow for efficient focusing of small particles in BAW devices, the acoustic streaming field needs to be suppressed64,65 or exhibit a particular shape; the vortices of the acoustic streaming field have to point towards the positions at which particles should be focused. Such a desired acoustic streaming field can be achieved either by square-shaped channels66–68 or by tailoring the acoustic impedance gradient.69 In a former publication, we utilized square-shaped channels to focus E. coli revealing a major difficulty to operate at high flow rates.70 With our new design, we generate a complementary streaming field, which assists the acoustic radiation force with particle trapping, thus allowing us to manipulate particles that have sizes near the critical particle radius of around 1 μm for a biological cell. Since the performance of related works is significantly lower or demands for special precautions such as seed particles, our work is unique and opens the door to many new applications.
In our novel design, particles are pushed against the thin vibrating channel wall. In contrast to related work showing particle attraction to channel walls,43,71–74 we are able to retain cells as small as bacteria against a flow due to the constructive combination of the action of acoustic radiation force and acoustic streaming, lowering the critical particle radius. Furthermore, we demonstrated in a recent publication73 that our novel device design can also be used in PDMS microchannels and, since the position of the thin vibrating wall can be chosen arbitrarily, our design is much more flexible than state-of-the-art methods presented in the literature, opening the door for novel applications. To better understand the underlying working mechanism and to enable the direct optimisation of our design, we analysed our approach's underlying mechanisms using finite element simulations. We found that particles can only be trapped efficiently with a wall thickness below 20 μm. The fabrication of such small structures within a channel of 190 μm depth had only been achieved by wet etching, which is limited in design by the crystal orientation.75 For manufacturing using a much less restrictive method, we optimised a standard Bosch process,76 which enables us to produce devices with a wall as thin as 13 μm in 190 μm deep channels. At a flow rate of 10 μL min−1 we are able to trap ∼70% of the bacteria. In a subsequent electroporation step in a benchtop electroporator, 1% of the initial bacteria are successfully transformed with an antibiotic resistance harboring plasmid. Our new design shows significant potential for future applications of BAW devices in a variety of research fields.
2. Operating principle
The acoustofluidic device consists of a microfluidic liquid channel and an air backing chamber that are in close proximity and separated by a thin silicon wall (Fig. 1). The thin wall can be excited by a piezoelectric transducer (piezo), which leads to bending of the wall in its eigenmodes. This design approach is advantageous as it allows us to shift the pressure node inside the liquid chamber towards the thin silicon wall and by that enables medium exchange through successful trapping of particles at the wall's displacement maximum. Recently, we published a similar device design produced in polydimethylsiloxane, which is not capable of bacteria trapping but can be used for controlled single cell rotation and efficient fluid mixing.73
Fig. 1. Design and working principle of cell trapping in the acoustofluidic device. (a) Sketch of the design. (b) Micrograph series of bacteria trapping (E. coli in white, ESI† Video S1), showing the channel before (upper panel) and during acoustic trapping (lower panel). The piezo was excited at 1.7 MHz with 46 VPP, the bacteria concentration was ∼4 × 10⁸ cells per mL and the scale bar corresponds to 100 μm. (c) Photograph of the acoustofluidic device with an 8 mm scale bar.
The vibrations of the thin wall depend on its clamping and material properties, the fluid properties on both sides of the wall, and the device geometry. Due to the complexity of the boundary conditions it is difficult to analytically compute the exact vibrational modes, which nevertheless could be approximated with a two-dimensional plate model.77,78
The force responsible for attracting small (relative to the acoustic wavelength), spherical, and solid particles towards the wall is called acoustic radiation force (ARF). For an inviscid fluid, it is given by the negative gradient of the Gor'kov potential79
| Frad = −∇U, | 1 |
which can be expressed as:
 |
2 |
with the particle radius r, the incident acoustic pressure field p1, the incident acoustic velocity field v1, the fluid speed of sound c0, the density of the fluid at equilibrium ρ0, and the monopole and the dipole scattering coefficients f1 and f2, respectively. 〈□〉 denotes time averaging 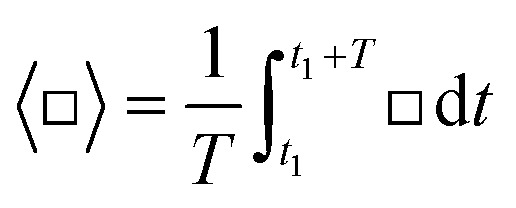 , with any point in time t1 and the period of oscillation T = 1/f. The Gor'kov potential is derived under the assumption that boundaries are far away from the region of interest, which is not the case here; however, a recent study of Baasch et al.80 showed that the validity can extend to close proximity to a boundary. In case of some cells, the Gor'kov potential is even valid, when the particle is touching the wall.
In acoustofliudics, the acoustic energy density is often used as a benchmark for the device's performance and, therefore, used in our numerical analysis. The average acoustic energy density (Ēac) is given as81
 |
3 |
with compressibility κ and volume V.
Another force that needs to be considered in our acoustofluidic device is acoustic streaming, which affects a particle through a drag force
| Fstr = 6πηr(vstr − vprt), | 4 |
with the fluid dynamic viscosity η, streaming velocity vstr, and particle velocity vprt. The magnitude of the streaming velocity can be estimated as63
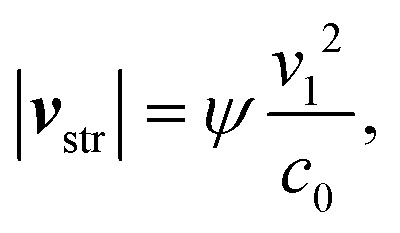 |
5 |
with the geometry dependent factor 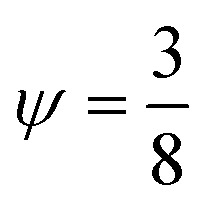 for a standing wave parallel to a planar wall.
As can be seen in eqn (2) and (4) the acoustic radiation force and the drag force scale with r3 and r respectively. The critical radius at which drag and acoustic radiation force balance each other can be estimated by63
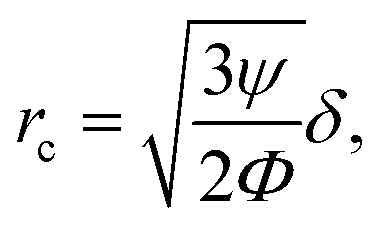 |
6 |
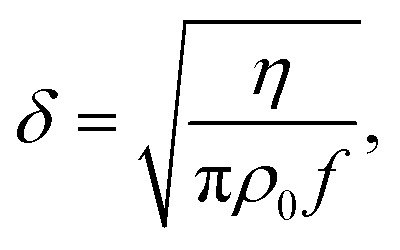
with δ as the viscous boundary layer thickness
 |
7 |
and Φ as the acoustic contrast factor
 |
8 |
in which relative compressibility 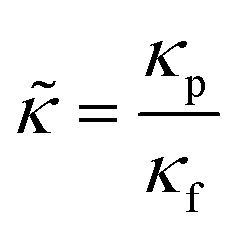 and density
 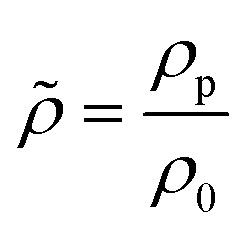 reflect the ratios between particle (□)p and fluid (□)f properties.
The resonance frequency of our device that we used for excitation was around 2 MHz, leading to a viscous boundary layer thickness of ∼0.4 μm in water. To approximate the acoustic contrast factor of E. coli, we took the buoyant density of E. coli analysed by Baldwin et al.82 and the acoustic impedance of cells derived by Olofsson et al.83 and ended up with a value of Φ ≈ 0.07. Thus, the critical radius for cells in our system is rc ≈ 0.95 μm. Since E. coli cells are very close to that critical radius (approx. 2 μm in length, 1 μm in diameter) it is essential to account for acoustic streaming effects to obtain trapping capabilities.
3. Materials and methods
3.1. Device fabrication
We produced the acoustofluidic chips utilising cleanroom processes. Microfluidic channels (192.6 ± 10 μm depth, 198.0 ± 5 μm width of the liquid channel and 100.3 ± 2 μm width of the air channel) were etched into a silicon wafer (500 ± 10 μm thickness). First, we used photolithography (resist: S1828, shipley, 4000 rpm; developer: AZ 351B, microchemicals, development time 30 s) to transfer the designs from a chrome mask onto the silicon wafer. Next, we put the wafer into an inductively coupled plasma deep reactive ion etching (ICP-DRIE) machine (Estrellas, Oxford Instruments). With a modified high rate process,76 we achieved a selectivity (ratio of etch rate between photoresist and silicon) of around 220 and straight channel walls with an angle of ∼87.7°. We increased the passivation time, decreased the pressure during the etching step and decreased the ICP and HF power allowing us to achieve significantly improved aspect ratios compared to current literature. Then, we anodically bonded a glass wafer (700 μm thickness) to the silicon wafer. Finally, we diced the wafer stack into small rectangles (16 mm × 15 mm) employing a wafer saw (DAD3221, Disco Corporation). Fused silica capillaries (164 ± 6 μm outer diameter, 100 ± 6 μm inner diameter, Molex) were inserted into the sides of the chip and fixed with a two-component glue (5 minute epoxy, Devcon). A piezoelectric transducer (10 mm length, 2 mm width, 1 mm thickness, Pz26, Meggitt Ferroperm) was glued to the backside of the devices using conductive epoxy (H20E, EPO-TEK). Copper cables (0.15 mm diameter) were attached to the piezo with conductive silver paste and glued to the chip with instant glue to increase mechanical stability.
3.2. Experimental setup
Acoustic waves in the BAW device are coupled into the system by exciting the piezo with a high-frequency amplified (High Wave 3.2, Digitum Elektronik) AC signal from a wave generator (AFG-2225, GW INSTEK). The impedance of the piezo varies with its excitation frequency. Since the voltage at the piezo is dependent on its impedance, it is verified using an oscilloscope (UTD2025CL, Uni-Trend Technology). Flows inside the microfluidic channels are controlled by pressure pumps and flow sensors (Flow EZ, Fluigent). We studied the movement of green fluorescent polystyrene (PS) particles (5.19 ± 0.14 μm diameter, microParticles GmbH) with a standard microscope (Axioscope, Zeiss). We used a high-speed camera (HiSpec 1, Fastec) to visualize the fast particle motions. Depending on the input power, we used frame rates between 20–200 fps.
3.3. Bacterial growth and maintenance
To visualise the bacteria, we used an E. coli MG1655 strain that constitutively expresses the gene for green fluorescent protein mNeonGreen. The gene was inserted into the ydgH gene locus of the chromosome resulting in strain bBPL227. We examined fluorescent E. coli cells under a fluorescence microscope with 470/40 nm excitation and 525/50 nm emission bandpass filters. To prepare bacteria for experiments, 3 mL of lysogeny broth (LB) (Becton Dickinson) was inoculated with bBPL227 from a cryostock and grown overnight in a shaking incubator (Multitron Pro, INFORS HT) at 37 °C and 200 rpm, until the culture reached the stationary phase. We added glycerol to a final concentration of 15% (vol/vol), split the culture into 100 μL aliquots and stored them at −80 °C. For each experiment, an aliquot of stock solution was thawed and transferred to 25 mL of LB in a 250 mL Erlenmeyer flask and incubated in a shaking incubator at 37 °C and 200 rpm. The cell culture was grown for 2–3 hours until mid-exponential phase (typically at an optical density at 600 nm of 0.5). The cells are then harvested and put onto ice for the experiments.
3.4. Numerical model
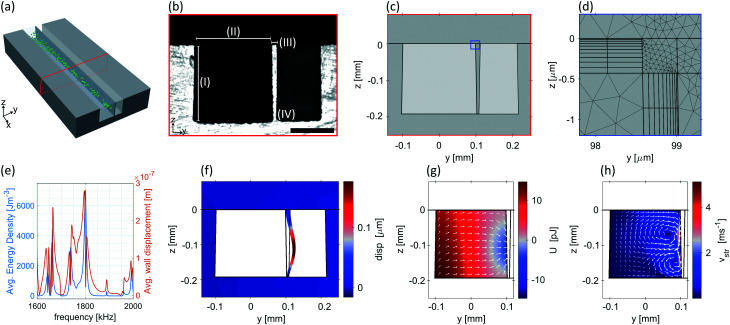
We built a 2D numerical model of the yz-section-plane (Fig. 2(c)) of the chip and evaluated it in COMSOL Multiphysics (version 5.4) to analyse the device's frequency response. At resonance frequencies, we investigated the wall displacement as well as the Gor'kov potential and streaming velocity. First, a mesh study was conducted to determine the converged mesh parameters (ESI† Fig. S1). After the initial frequency-domain study of the thermoviscous acoustics and solid mechanics interface, a stationary study of the creeping flow interface at the resonance frequency was carried out using the solutions of the initial study as inputs. With this study, we were able to derive the streaming velocity. A detailed description of the numerical model is provided in the ESI.†
Fig. 2. Numerical modelling of the acoustofluidic device. (a) Sketch of the device. (b) Optical microscopy image of the device cross-section. (I) Channel depth = 192.6 ± 0.4 μm, (II) channel width = 198.0 ± 0.3 μm, (III) wall top thickness = 13.0 ± 0.15 μm, (IV) wall bottom thickness = 6.15 ± 0.15 μm. The scale bar corresponds to 100 μm. (c) Simulated geometry and (d) typical mesh near a corner (see blue rectangle in (c)). Please refer to ESI† Fig. S1 for the mesh study. At 2 MHz the model attained 631′961 degrees of freedom and had a computation time of 25 s and 22 s for the acoustic and streaming simulations, respectively, on a PC with 32 GB RAM and Intel Xeon E 2186G processor. (e) Frequency spectrum of acoustic energy density and wall displacement. A strong resonance is clearly visible at 1.8 MHz. (f) Displacement of the wall (disp), (g) Gor'kov potential (U) with acoustic radiation force (white arrows) and (h) streaming velocity (vstr) at fres = 1.8 MHz.
3.5. Medium exchange protocol
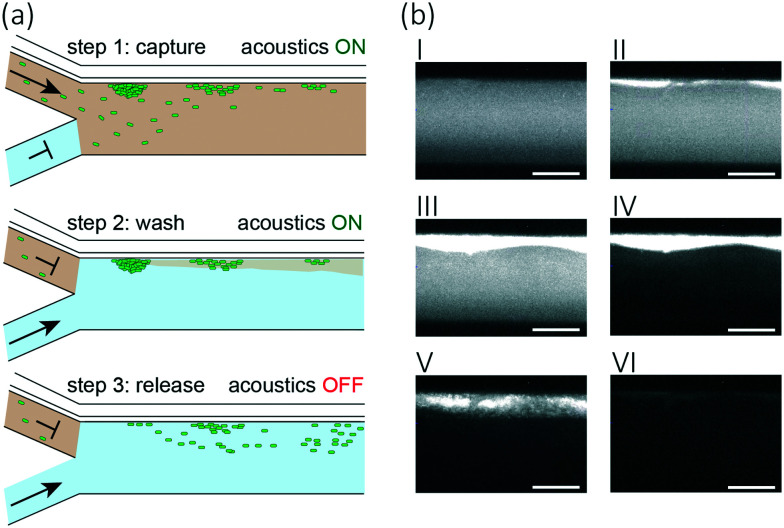
Our medium exchange protocol expands the functionality of our acoustofluidic device from bacteria trapping to medium exchange. The protocol consists of three steps, namely: capture, wash, and release. In the first step, we filled the channel with cell solution at a flow rate of 10 μL min−1 and activated the acoustic trapping of the cells through wall vibration. After two minutes, we stopped the flow of cell solution and flushed the channel with ultrapure water at a flow rate of 10 μL min−1 for 30 seconds to wash the cells and remove remaining cell suspension liquid. Finally, we turned off the acoustic excitation and increased the flow rate of ultrapure water to 20 μL min−1 for 60 seconds, which, given lack of acoustic forces during this step, allowed to remove the cells from the chamber while being suspended in the new medium.
The medium exchange protocol's execution is computer controlled by a custom-written Python script to synchronise the acoustics and regulation of flows.
3.6. Determination of bacteria capturing and release efficiency
The device should capture and release as many bacteria as possible while replacing the original medium with ultrapure water for electroporation. We collected the liquid leaving the chip during each step in tubes. The collected bacteria solution was then weighed and diluted with LB to a suitable concentration (2000–50 000×), and 40 μL of each diluted sample was plated on OmniTray™ plates (Nunc, Thermo Fisher Scientific Inc.) with eight virtual wells by a liquid handling robot (EVO200, Tecan). After incubating the plates overnight at 37 °C, we counted the number of colonies (colony forming units or CFUs). Each of these CFUs originates from a single bacterium that was plated the day before, making the counting of CFU a representative count for viable cells. We calculated the fraction of bacteria that were not captured or lost during washing, as well as the fraction of successfully released bacteria as
 |
9 |
with the collected fluid volume V, the concentration of bacteria C, the number of bacteria n, the concentration of bacteria before entering the device Cculture and the fraction of bacteria leaving the device during the indicated step f. The protocol step is denoted by (□)step,
3.7. Electroporation
To provide a functional measure to evaluate the efficiency of the medium exchange, we performed electroporation on released cells in a micropulser. Electroporation efficiency is very sensitive to high conductivities of the liquid phase of the cell suspension. For example, remaining growth medium drastically increases the conductivity and leads to a low time-constant in the micropulser (ESI† eqn (S2)). For performing electroporation experiments, we transferred 20 μL of the sample into a 0.1 cm electroporation cuvette (Cell Projects Ltd) that had been pre-chilled on ice. For the acoustofluidic medium exchange experiments, the whole volume collected in a tube during the release phase (20 μL) was transferred into the cuvette. An aliquot of 1 μL plasmid pUC19 (dissolved in 10 mM Tris-HCl (pH 7.6) and 1 mM aqueous ethylenediaminetetraacetic acid (EDTA, Thermo Scientific)) was added to the cell solution for a final concentration of 2.0 ng μL−1. After inserting the cuvette into an electroporator (MicroPulser, Bio-Rad), we applied a 1.8 kV pulse with a discharge time constant of about 6 ms. The time constant from the electroporator is a function of the sample conductivity and was used as a measure of success of the medium exchange. Immediately after the pulse, 980 μL of room temperature SOC medium6 was added to the cuvette for cell recovery. The complete volume was transferred into a tube and placed in a shaking incubator (37 °C, 200 rpm) for one hour to allow expression of the antibiotic resistance gene on the plasmid without allowing for growth to resume. Afterwards, we plated 40 μL of the cell suspension on LB agar plates containing 50 μg mL−1 of the antibiotic carbenicillin. The plates were incubated overnight at 37 °C and CFUs were determined the next day.
4. Results & discussion
4.1. Numerical analysis of the particle attraction
We carried out numerical studies to get insight into the physical phenomena of the initial design that lead to particle attraction at the thin silicon wall between the water and the air channel. To obtain the accurate channel dimensions required for the numerical simulation, the device was diced perpendicularly to the channel, and the cross-section was evaluated using optical microscopy. The measured dimensions were then implemented in our numerical model (Fig. 2(c)). As can be seen in Fig. 2(b), we were able to etch straight channel walls enabling us to produce nominally walls as thin as 13 μm with an etch depth of 192 μm. At the bottom of the channel, the silicon wall still had a width of 6 μm, which is thick enough to prevent the whole structure from collapsing during the acoustic excitation.
Given that the effect of acoustic streaming cannot be neglected in BAW systems for manipulating bacteria, we considered this by refining our mesh at the water-silicon interfaces and, by that, account for the viscous boundary layer (Fig. 2(d)). Subsequently, a study in the frequency domain was performed with excitation frequencies ranging from 1.6 to 2 MHz, as for this spectrum, the strongest particle attractions had been suggested in preliminary experimental investigations. As a measure for the device efficiency, we chose the average acoustic energy density, i.e. acoustic energy density (eqn (3)) integrated over the cross-section of the liquid channel and divided by its area. Similarly, we computed the average wall displacement. Simulation results show a global maximum in the average acoustic energy density and the average wall displacement at 1801 kHz with additional minor resonances being visible at slightly higher and lower frequencies (Fig. 2(e)). The subsequent detailed experimental analysis confirmed the initial observations as well as the results of the numerical simulation by demonstrating strong particle attraction in the investigated frequency range. However, we were unable to experimentally reproduce the exact relative strength of the resonances, which might be caused by the idealized material parameters used as inputs for our 2D simulations.
We performed the second stationary study at the resonance frequency that revealed the highest average acoustic energy density (1801 kHz). Taking both studies into account, we generated plots for the wall displacement (Fig. 2(f)), Gor'kov potential with acoustic radiation force as white arrows (Fig. 2(g)) and streaming velocity (Fig. 2(h)). The displacement plot shows that the maximal displacement of the wall is at half its height. At this point, a minimum of the Gor'kov potential (eqn (2)) is located. Thus, the acoustic radiation force (eqn (1)) is directed in positive y-direction throughout the entirety of the channel. Close to the wall, the direction of the force changes slightly towards the absolute minimum of the Gor'kov potential, which leads to an acoustic radiation force that pushes particles towards the thin wall.
Particles at the Gor'kov potential minimum that are larger in radius than rc (eqn (6)) remain there due to the Acoustic Radiation Force. However, if the particle radius is close to or below rc as it is the case for E. coli, streaming effects need to be considered. The streaming velocity plot reveals that particles are also dragged towards the thin wall by acoustic streaming with two counter-rotating vortices forming close to the silicon wall. Both vortices coalesce at the position of minimal Gor'kov potential. Therefore, even when the particles reach the point of minimal Gor'kov potential and thus are no longer subjected to the acoustic radiation force, they will still be trapped in the acoustic streaming vortices nearby the thin wall. Our recent publication73 and similar ones from other groups71,72 demonstrate that a single streaming vortex close to the wall can be utilised to attract particles but is not sufficient to retain particles against a fluid flow.
4.2. Capturing and release of bacteria
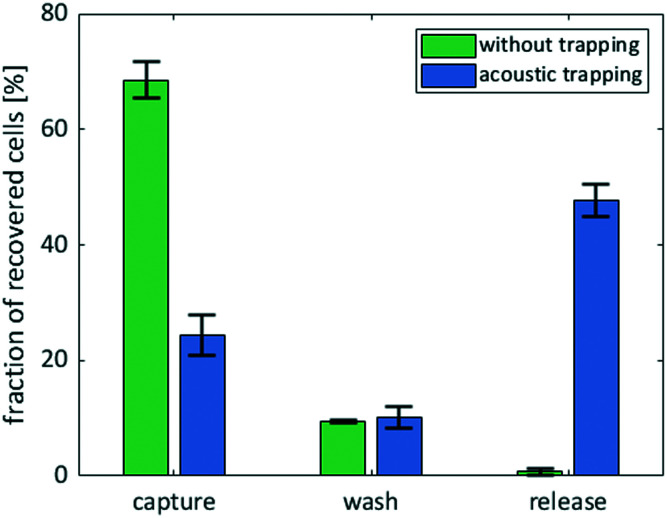
We performed experiments without flow to observe the forces acting on the bacteria and determine suitable excitation frequencies. We changed the frequency in steps of 1 kHz in a range from 1 to 4 MHz to experimentally determine resonance frequencies that lead to bacteria attraction. As the strongest observable particle attraction occurred at a frequency of 1.89 MHz, this parameter was applied for all subsequent experimental procedures. Using particle trajectory velocimetry analysis and by balancing the Stokes drag and acoustic radiation force, we were able to estimate the acoustic radiation force in our setup.84 The Stokes drag force is given as Fdrag = 6πηrvy, with the particle velocity vy, the particle radius r, the fluid's dynamic viscosity η. Given the approximate particle speed of 160 μm s−1 at an excitation voltage of 46 VPP (ESI† Video S1), particle radius r ≈ 2 μm, and fluid dynamic viscosity η ≈ 1 × 10⁻³ Pa s, we attain an approximate value for the acoustic radiation force of 6pN, which is in the range of the values reported in the literature.85 To perform medium exchange with the device, we operated it while applying a flow of cells. Specifically, we implemented a three-step protocol including a capture step during which the bacterial cells are trapped at the wall by the acoustic forces, resulting from the ARF, and the drag forces, resulting from the acoustic streaming, followed by a wash step in which the surrounding medium is exchanged while the acoustic and drag forces still trap the cells, and finally, a release step in which the forces are no longer applied and cells can re-suspend into the surrounding liquid (Fig. 3(a)). We ran the protocol and determined the efficiency of each step (ESI† Video S2). We observed accumulation of cells at the acoustic pressure nodes at the vibrating wall (Fig. 3(b)). Over three experiments, on average, we were able to capture 70% of the cells that passed through the corresponding channel section during the time of application of acoustics. An additional 20% of the captured cells were lost in the washing step, indicating that wash duration and flow rate require further optimization. Finally, up to 52% and on average 47 ± 3% of the cells that entered the chip initially were successfully washed and released into the new medium (Fig. 4).
Fig. 3. Overview of automated semi-continuous medium exchange. (a) Sketch of the acoustofluidic device: cell suspension is fed through the top inlet and ultrapure water through the bottom inlet. In step 1 (capture), acoustic forces trap the bacteria at the thin vibrating wall. In step 2 (wash) a flow of ultrapure water flushes the channel, leading to the desired medium exchange for the cells that remain trapped by the acoustic forces. Finally, in step 3 (release), the acoustics is turned off, bacteria are suspended into the new medium and leave the device with the flow. (b) Fluorescence microscopy pictures of the channel section in which the capturing of the E. coli (white) is performed. I) We flush the channel with cell solution before the start of the experiment while the acoustics are off. II) We turn on the acoustics leading to cell accumulation at the vibrating wall. III) End of capturing step. IV) End of washing step: cells are retained at the vibrating wall and channel is flushed with ultrapure water. V) Release step: we turn off the acoustics; thus, cells detach from the vibrating wall. VI) End of release step: cells left the device. The scale bars correspond to 100 μm.
Fig. 4. Graph of fraction of initial cells recovered at the outlet during each step of the medium exchange protocol with and without acoustics at a capturing flow rate of 10 μL min−1. We calculated the cell concentrations from CFUs on non-selective plates according to eqn (9). Green: Experiments without acoustics as a control. Blue: Experiments with an excitation frequency of 1.89 MHz at 40 VPP. Capture: Cells that are not trapped and leave the device during the capture step. Wash: Cells that leave the device during the wash step. Release: Cells that leave the device during the release step suspended in the new medium. All experiments were performed in triplicates to verify the reproducibility of our method.
Next, we performed the assay without acoustics to verify that the released bacteria stem from the trapping and not from side effects such as leakage between the cell suspension inlets or unspecific retention of bacteria in the channel. In contrast to the experiment with acoustics, we observed no cell accumulation at the wall and found the cell concentration at the outlet and inlet were nearly identical at 1 × 10⁸ cells mL−1 during the first step (“capturing”, but due to the absence of acoustic forces effectively just flushing of the tubing and chip with cell suspension). This suggests that no cells were actively trapped in the channel. Furthermore, during washing with ultrapure water, we still measured a bacteria concentration of 1.5 × 10⁷ cells mL−1 in a total volume of 5 μL, which is in agreement with the assumption that at the beginning of the wash step the inner chamber of the device (approx. 1 μL of volume) was still filled with cell suspension. At the same time, this suggests no substantial leakage of cells from the cell suspension channel into the main channel during the wash step. Finally, during the third step of the protocol without acoustics, the cell concentration is 60-fold lower than during the capturing step. The strongly reduced cell number during the third step confirmed that the washing time and flow rate was sufficient to exchange close to all the residual volume in the chip and thus avoid cross-contamination between the cell suspension and the released cells in the new medium. As these numbers were obtained by counting CFUs, it only includes viable cells with the ability to reproduce and form colonies on plates. Further, we can exclude a negative influence of the acoustic particle manipulation on the cell's viability, since the difference in overall recovery rate of bacteria without (78.7 ± 2%) and with (82.4 ± 2%) acoustics is in the range of the standard deviation. In summary, the protocol allows the medium exchange for ∼4 × 10⁶ cells in a volume of 20 μL per round. The protocol takes only 210 seconds and is thus much quicker than repetitive centrifugation with durations of up to 20 minutes per step.86
4.3. Functional analysis of medium exchange
After capturing, washing and releasing bacterial cells, we determined whether the cells are electrocompetent. Electrocompetence implies that the growth medium was sufficiently exchanged by ultrapure water and that the acoustic treatment had no negative impact on the cells viability. Therefore, we mixed the released cells in the liquid in which we had recovered them with the DNA of a 2.7 kbp reference plasmid, pUC1987 and electroporated them using a micropulser. Cells released from the acoustofluidic device exhibited a time constant of between 5.6 and 5.8 ms. In general, a time constant above 5 ms is a strong indicator for high transformation efficiency88 and indicates that the media was, in fact, exchanged very effectively. We performed electroporation in the micropulser on a dilution series of LB in ultrapure water to estimate the achieved grade of medium exchange. The time constant of around 5.7 ms reached by our sample corresponds to a dilution of 1 : 256 of LB in ultrapure water. We next examined successful transformation by plating the electropulsed cells on selective media. We measured around 40′000 successfully transformed colonies (around 1% of the initial cells) per electroporation of our acoustically washed cells, resulting in a transformation efficiency of 106 transformations per microgram of plasmid. Further, we performed a control experiment with the same parameters as described before, except that we used a centrifuge for the medium exchange and larger volumes (see ESI†). The control experiment revealed an order of magnitude higher transformation efficiency (13 ± 1%), demonstrating that our acoustofluidic device still needs to be developed further. However, we would like to highlight that the aim of the manuscript at hand is not to improve the performance of standard lab protocols, but to develop an automated alternative for microliter volumes that could potentially save manual labour. The cells released without acoustics as well as those without medium exchange yielded fewer than 250 CFUs per run on selective plates. The significantly higher transformation efficiency of cells washed with our device highlights that the presented acoustofluidic device is highly beneficial for medium exchange and in particular for the preparation of cells for electroporation, as often required in biotechnology. With our new device and our simplified protocol, we present a quick and viable alternative to centrifugation which allows us to also handle small sample volumes.
5. Conclusion & outlook
In this work, we presented a new acoustofluidic device design with a novel trapping principle that outperforms similar approaches in terms of throughput and particle size. We then successfully demonstrated the device's capabilities by semi-continuous medium exchange for the model bacterial workhorse E. coli from growth medium to ultrapure water. As an example of successful medium exchange, we electroporated the cells prepared with our acoustic device and showed successful transformation with plasmid DNA. In contrast to centrifugation, our device works well for microliter volumes, is automated and can be integrated into microfluidic systems. It presents a crucial step towards automating transformation. Furthermore, we carried out numerical studies to get an insight into the physical phenomena that lead to particle trapping at the thin vibrating silicon wall. The simulations revealed that at a frequency close to the experimental resonance frequency, the thin silicon wall located between the water and the air channel has its maximal displacement, while the liquid channel exhibits a maximum in average acoustic energy density. A Gor'kov potential minimum forms at half of the wall's height, leading to strong particle attraction towards this point. Additionally, counter-rotating streaming vortices are generated, which limit the movement of particles close to the wall. Both effects lead to trapping of particles even in the range of the critical particle radius. In contrast to other designs, we can utilise straight channel walls for the particle trapping, thus preventing contamination with bubbles.
The device's performance has been determined through experimental medium exchange. At a flow rate of 10 μL min−1 we successfully trapped 70 ± 5% of the bacteria. After a washing step, 47 ± 3% of the total bacteria were released into the new medium – ultrapure water. From these released bacteria, 40′000 were successfully transformed after electroporation with a pUC19 plasmid in a micropulser, leading to a high transformation efficiency of approximately 106 μg DNA−1. The proposed protocol is thus sufficient to perform genetic engineering.
In the future, we will try to improve the device performance by using thinner walls, for which the etch process needs to be further optimised. Furthermore, we will test new innovative designs to increase the trapping efficiency.
Our device demonstrated the capability to transfer complex biological protocols into miniaturized dimensions. We believe that our novel approach is useful for a wide range of applications, including medium exchange, particle coating, and cell concentration.
Conflicts of interest
The authors declare no competing financial interest.
Supplementary Material
Acknowledgments
The authors would like to express their gratitude for funding by ETH Zurich. This work was supported by the Swiss National Science Foundation as part of the NCCR Molecular Systems Engineering. We thank Dr. Nino Läubli, Dr. Jaime Garcia Guirado, Alen Pavlic and Dr. Tania Roberts for their valuable feedback and inputs.
Electronic supplementary information (ESI) available: 1) Experimental video of E. coli trapping corresponding to Fig. 1(c). 2) Video of medium exchange experiment corresponding to Fig. 3(b). See DOI: 10.1039/d1lc00406a
References
- Appleton E. Densmore D. Madsen C. Roehner N. Curr. Opin. Chem. Biol. 2017;40:111–118. doi: 10.1016/j.cbpa.2017.08.005. [DOI] [PubMed] [Google Scholar]
- Brophy J. A. N. Voigt C. A. Nat. Methods. 2014;11:508–520. doi: 10.1038/nmeth.2926. [DOI] [PMC free article] [PubMed] [Google Scholar]
- Slusarczyk A. L. Lin A. Weiss R. Nat. Rev. Genet. 2012;13:406–420. doi: 10.1038/nrg3227. [DOI] [PubMed] [Google Scholar]
- Woolston B. M. Edgar S. Stephanopoulos G. Annu. Rev. Chem. Biomol. Eng. 2013;4:259–288. doi: 10.1146/annurev-chembioeng-061312-103312. [DOI] [PubMed] [Google Scholar]
- Pham H. L. Ho C. L. Wong A. Lee Y. S. Chang M. W. Curr. Opin. Biotechnol. 2017;48:85–93. doi: 10.1016/j.copbio.2017.03.021. [DOI] [PubMed] [Google Scholar]
- Hanahan D. J. Mol. Biol. 1983;166:557–580. doi: 10.1016/S0022-2836(83)80284-8. [DOI] [PubMed] [Google Scholar]
- Dower W. J. Miller J. F. Ragsdale C. W. Nucleic Acids Res. 1988;16:6127–6145. doi: 10.1093/nar/16.13.6127. [DOI] [PMC free article] [PubMed] [Google Scholar]
- Gach P. C. Iwai K. Kim P. W. Hillson N. J. Singh A. K. Lab Chip. 2017;17:3388–3400. doi: 10.1039/C7LC00576H. [DOI] [PubMed] [Google Scholar]
- Linshiz G. Jensen E. Stawski N. Bi C. Elsbree N. Jiao H. Kim J. Mathies R. Keasling J. D. Hillson N. J. J. Biol. Eng. 2016;10:3. doi: 10.1186/s13036-016-0024-5. [DOI] [PMC free article] [PubMed] [Google Scholar]
- Perry J. M. Soffer G. Jain R. Shih S. C. C. Lab Chip. 2021;21:3730–3741. doi: 10.1039/D1LC00415H. [DOI] [PubMed] [Google Scholar]
- Shih S. C. C. Goyal G. Kim P. W. Koutsoubelis N. Keasling J. D. Adams P. D. Hillson N. J. Singh A. K. ACS Synth. Biol. 2015;4:1151–1164. doi: 10.1021/acssynbio.5b00062. [DOI] [PubMed] [Google Scholar]
- Moazami E. Perry J. M. Soffer G. Husser M. C. Shih S. C. C. Anal. Chem. 2019;91:5159–5168. doi: 10.1021/acs.analchem.8b05754. [DOI] [PubMed] [Google Scholar]
- Madison A. C. Royal M. W. Vigneault F. Chen L. Griffin P. B. Horowitz M. Church G. M. Fair R. B. ACS Synth. Biol. 2017;6:1701–1709. doi: 10.1021/acssynbio.7b00007. [DOI] [PubMed] [Google Scholar]
- Wang H. H. Isaacs F. J. Carr P. A. Sun Z. Z. Xu G. Forest C. R. Church G. M. Nature. 2009;460:894–898. doi: 10.1038/nature08187. [DOI] [PMC free article] [PubMed] [Google Scholar]
- Moore J. A. Nemat-Gorgani M. Madison A. C. Sandahl M. A. Punnamaraju S. Eckhardt A. E. Pollack M. G. Vigneault F. Church G. M. Fair R. B. Horowitz M. A. Griffin P. B. Biomicrofluidics. 2017;11:014110. doi: 10.1063/1.4975391. [DOI] [PMC free article] [PubMed] [Google Scholar]
- Ramadan Q. Lau T. T. Ho S. B. Anal. Bioanal. Chem. 2010;396:707–714. doi: 10.1007/s00216-009-3276-9. [DOI] [PubMed] [Google Scholar]
- Hammarström B. Laurell T. Nilsson J. Lab Chip. 2012;12:4296. doi: 10.1039/C2LC40697G. [DOI] [PubMed] [Google Scholar]
- Leibacher I. Dietze W. Hahn P. Wang J. Schmitt S. Dual J. Microfluid. Nanofluid. 2013;16:513–524. doi: 10.1007/s10404-013-1240-7. [DOI] [Google Scholar]
- Phurimsak C. Tarn M. Pamme N. Micromachines. 2016;7:77. doi: 10.3390/mi7050077. [DOI] [PMC free article] [PubMed] [Google Scholar]
- Ku A. Lim H. C. Evander M. Lilja H. Laurell T. Scheding S. Ceder Y. Anal. Chem. 2018;90:8011–8019. doi: 10.1021/acs.analchem.8b00914. [DOI] [PMC free article] [PubMed] [Google Scholar]
- Petersson F. Nilsson A. Jönsson H. Laurell T. Anal. Chem. 2005;77:1216–1221. doi: 10.1021/ac048394q. [DOI] [PubMed] [Google Scholar]
- Tornay R. Braschler T. Demierre N. Steitz B. Finka A. Hofmann H. Hubbell J. A. Renaud P. Lab Chip. 2008;8:267–273. doi: 10.1039/B713776A. [DOI] [PubMed] [Google Scholar]
- Lee S. H. S. Hatton T. A. Khan S. A. Microfluid. Nanofluid. 2011;11:429–438. doi: 10.1007/s10404-011-0808-3. [DOI] [Google Scholar]
- Li S. Ding X. Mao Z. Chen Y. Nama N. Guo F. Li P. Wang L. Cameron C. E. Huang T. J. Lab Chip. 2015;15:331–338. doi: 10.1039/C4LC00903G. [DOI] [PMC free article] [PubMed] [Google Scholar]
- González I. Fernández L. J. Gómez T. E. Berganzo J. Soto J. L. Carrato A. Sens. Actuators, B. 2010;144:310–317. doi: 10.1016/j.snb.2009.10.042. [DOI] [Google Scholar]
- Hsi P. Christianson R. J. Dubay R. A. Lissandrello C. A. Fiering J. Balestrini J. L. Tandon V. Lab Chip. 2019;19:2978–2992. doi: 10.1039/C9LC00458K. [DOI] [PubMed] [Google Scholar]
- Ohlsson P. Petersson K. Augustsson P. Laurell T. Sci. Rep. 2018;8:9156. doi: 10.1038/s41598-018-25551-0. [DOI] [PMC free article] [PubMed] [Google Scholar]
- Momi A. D. Lead J. R. Environ. Sci. Technol. 2006;40:6738–6743. doi: 10.1021/es061181t. [DOI] [PubMed] [Google Scholar]
- Lissandrello C. A. Santos J. A. Hsi P. Welch M. Mott V. L. Kim E. S. Chesin J. Haroutunian N. J. Stoddard A. G. Czarnecki A. Coppeta J. R. Freeman D. K. Flusberg D. A. Balestrini J. L. Tandon V. Sci. Rep. 2020;10:18045. doi: 10.1038/s41598-020-73755-0. [DOI] [PMC free article] [PubMed] [Google Scholar]
- Augustsson P. Åberg L. B. Swärd-Nilsson A.-M. K. Laurell T. Microchim. Acta. 2008;164:269–277. doi: 10.1007/s00604-008-0084-4. [DOI] [Google Scholar]
- Park J. Destgeer G. Kim H. Cho Y. Sung H. J. Lab Chip. 2018;18:2936–2945. doi: 10.1039/C8LC00733K. [DOI] [PubMed] [Google Scholar]
- Lee H. Xu L. Oh K. W. Biomicrofluidics. 2014;8:044113. doi: 10.1063/1.4892495. [DOI] [PMC free article] [PubMed] [Google Scholar]
- Stephenson W. Micro Nano Syst. Lett. 2018;6:1–10. doi: 10.1186/s40486-018-0063-4. [DOI] [Google Scholar]
- Gautam G. P. Gurung R. Fencl F. A. Piyasena M. E. Anal. Bioanal. Chem. 2018;410:6561–6571. doi: 10.1007/s00216-018-1261-x. [DOI] [PMC free article] [PubMed] [Google Scholar]
- Park S. Zhang Y. Wang T. H. Yang S. Lab Chip. 2011;11:2893–2900. doi: 10.1039/C1LC20307J. [DOI] [PubMed] [Google Scholar]
- Kong T. F. Shen X. Marcos M. Yang C. Ibrahim I. H. Biomicrofluidics. 2020;14:054105. doi: 10.1063/5.0024826. [DOI] [PMC free article] [PubMed] [Google Scholar]
- Çetin B. Özer M. B. Çağatay E. Büyükkoçak S. Biomicrofluidics. 2016;10:014112. doi: 10.1063/1.4940431. [DOI] [PMC free article] [PubMed] [Google Scholar]
- Sonnenberg A. Marciniak J. Y. Krishnan R. Heller M. J. Electrophoresis. 2012;33:2482–2490. doi: 10.1002/elps.201100700. [DOI] [PubMed] [Google Scholar]
- Yuan D. Tan S. H. Sluyter R. Zhao Q. Yan S. Nguyen N. T. Guo J. Zhang J. Li W. Anal. Chem. 2017;89:9574–9582. doi: 10.1021/acs.analchem.7b02671. [DOI] [PubMed] [Google Scholar]
- DAvino G. Greco F. Maffettone P. L. Annu. Rev. Fluid Mech. 2017;49:341–360. doi: 10.1146/annurev-fluid-010816-060150. [DOI] [Google Scholar]
- Glynne-Jones P. Boltryk R. J. Hill M. Harris N. R. Baclet P. J. Acoust. Soc. Am. 2009;126:EL75–EL79. doi: 10.1121/1.3186800. [DOI] [PubMed] [Google Scholar]
- Augustsson P. Laurell T. Lab Chip. 2012;12:1742–1752. doi: 10.1039/C2LC40200A. [DOI] [PubMed] [Google Scholar]
- Carugo D. Octon T. Messaoudi W. Fisher A. L. Carboni M. Harris N. R. Hill M. Glynne-Jones P. Lab Chip. 2014;14:3830–3842. doi: 10.1039/C4LC00577E. [DOI] [PubMed] [Google Scholar]
- Gao Y. Wu M. Lin Y. Xu J. Micromachines. 2020;11:921. doi: 10.3390/mi11100921. [DOI] [PMC free article] [PubMed] [Google Scholar]
- Evander M. Johansson L. Lilliehorn T. Piskur J. Lindvall M. Johansson S. Almqvist M. Laurell T. Nilsson J. Anal. Chem. 2007;79:2984–2991. doi: 10.1021/ac061576v. [DOI] [PubMed] [Google Scholar]
- Spengler J. F. Coakley W. T. Langmuir. 2003;19:3635–3642. doi: 10.1021/la026798c. [DOI] [Google Scholar]
- Microscale Acoustofluidics, ed. T. Laurell and A. Lenshof, The Royal Society of Chemistry, 2015, pp. P001–574 [Google Scholar]
- Evander M. Nilsson J. Lab Chip. 2012;12:4667. doi: 10.1039/C2LC40999B. [DOI] [PubMed] [Google Scholar]
- Hagsäter S. M. Jensen T. G. Bruus H. Kutter J. P. Lab Chip. 2007;7:1336. doi: 10.1039/B704864E. [DOI] [PubMed] [Google Scholar]
- Manneberg O. Vanherberghen B. Svennebring J. Hertz H. M. Önfelt B. Wiklund M. Appl. Phys. Lett. 2008;93:063901. doi: 10.1063/1.2971030. [DOI] [Google Scholar]
- Svennebring J. Manneberg O. Skafte-Pedersen P. Bruus H. Wiklund M. Biotechnol. Bioeng. 2009;103:323–328. doi: 10.1002/bit.22255. [DOI] [PubMed] [Google Scholar]
- Oberti S. Neild A. Dual J. J. Acoust. Soc. Am. 2007;121:778–785. doi: 10.1121/1.2404920. [DOI] [PubMed] [Google Scholar]
- Collins D. J. Morahan B. Garcia-Bustos J. Doerig C. Plebanski M. Neild A. Nat. Commun. 2015;6:8686. doi: 10.1038/ncomms9686. [DOI] [PMC free article] [PubMed] [Google Scholar]
- Hammarström B. Evander M. Barbeau H. Bruzelius M. Larsson J. Laurell T. Nilsson J. Lab Chip. 2010;10:2251. doi: 10.1039/C004504G. [DOI] [PubMed] [Google Scholar]
- Gralinski I. Raymond S. Alan T. Neild A. J. Appl. Phys. 2014;115:054505. doi: 10.1063/1.4863645. [DOI] [Google Scholar]
- Righini M. Ghenuche P. Cherukulappurath S. Myroshnychenko V. de Abajo F. J. G. Quidant R. Nano Lett. 2009;9:3387–3391. doi: 10.1021/nl803677x. [DOI] [PubMed] [Google Scholar]
- Liu L. Chen S. Xue Z. Zhang Z. Qiao X. Nie Z. Han D. Wang J. Wang T. Nat. Commun. 2018;9:444. doi: 10.1038/s41467-018-02879-9. [DOI] [PMC free article] [PubMed] [Google Scholar]
- Guo P. Hall E. W. Schirhagl R. Mukaibo H. Martin C. R. Zare R. N. Lab Chip. 2012;12:558–561. doi: 10.1039/C2LC21092D. [DOI] [PubMed] [Google Scholar]
- Islam M. Shahid A. Kuryllo K. Li Y. Deen M. Selvaganapathy P. Micromachines. 2017;8:45. doi: 10.3390/mi8020045. [DOI] [Google Scholar]
- He X. Hu C. Guo Q. Wang K. Li Y. Shangguan J. Biosens. Bioelectron. 2013;42:460–466. doi: 10.1016/j.bios.2012.11.020. [DOI] [PubMed] [Google Scholar]
- Lee J.-J. Jeong K. J. Hashimoto M. Kwon A. H. Rwei A. Shankarappa S. A. Tsui J. H. Kohane D. S. Nano Lett. 2013;14:1–5. doi: 10.1021/nl3047305. [DOI] [PubMed] [Google Scholar]
- Wang Z. M. Wu R. G. Wang Z. P. Ramanujan R. V. Sci. Rep. 2016;6:26945. doi: 10.1038/srep26945. [DOI] [PMC free article] [PubMed] [Google Scholar]
- Bruus H. Lab Chip. 2012;12:1578. doi: 10.1039/C2LC21261G. [DOI] [PubMed] [Google Scholar]
- Hoyos M. Castro A. Ultrasonics. 2013;53:70–76. doi: 10.1016/j.ultras.2012.03.015. [DOI] [PubMed] [Google Scholar]
- Karlsen J. T. Qiu W. Augustsson P. Bruus H. Phys. Rev. Lett. 2018;120:054501. doi: 10.1103/PhysRevLett.120.054501. [DOI] [PubMed] [Google Scholar]
- Antfolk M. Muller P. B. Augustsson P. Bruus H. Laurell T. Lab Chip. 2014;14:2791–2799. doi: 10.1039/C4LC00202D. [DOI] [PubMed] [Google Scholar]
- Mao Z. Li P. Wu M. Bachman H. Mesyngier N. Guo X. Liu S. Costanzo F. Huang T. J. ACS Nano. 2017;11:603–612. doi: 10.1021/acsnano.6b06784. [DOI] [PMC free article] [PubMed] [Google Scholar]
- Hao N. Pei Z. Liu P. Bachman H. Naquin T. D. Zhang P. Zhang J. Shen L. Yang S. Yang K. Zhao S. Huang T. J. Small. 2020;16:2005179. doi: 10.1002/smll.202005179. [DOI] [PMC free article] [PubMed] [Google Scholar]
- Assche D. V. Reithuber E. Qiu W. Laurell T. Henriques-Normark B. Mellroth P. Ohlsson P. Augustsson P. Sci. Rep. 2020;10:3670. doi: 10.1038/s41598-020-60338-2. [DOI] [PMC free article] [PubMed] [Google Scholar]
- Gerlt M. S. Haidas D. Ratschat A. Suter P. Dittrich P. S. Dual J. Biomicrofluidics. 2020;14:064112. doi: 10.1063/5.0036407. [DOI] [PMC free article] [PubMed] [Google Scholar]
- Aghakhani A. Cetin H. Erkoc P. Tombak G. I. Sitti M. Lab Chip. 2021;21:582–596. doi: 10.1039/D0LC00865F. [DOI] [PMC free article] [PubMed] [Google Scholar]
- Leibacher I. Schatzer S. Dual J. Lab Chip. 2014;14:463–470. doi: 10.1039/C3LC51109J. [DOI] [PubMed] [Google Scholar]
- Läubli N. F. Gerlt M. S. Wüthrich A. Lewis R. T. M. Shamsudhin N. Kutay U. Ahmed D. Dual J. Nelson B. J. Anal. Chem. 2021;93(28):9760–9770. doi: 10.1021/acs.analchem.1c01209. [DOI] [PMC free article] [PubMed] [Google Scholar]
- Fong E. J. Johnston A. C. Notton T. Jung S.-Y. Rose K. A. Weinberger L. S. Shusteff M. Analyst. 2014;139:1192–1200. doi: 10.1039/C4AN00034J. [DOI] [PubMed] [Google Scholar]
- Laurell T. Petersson F. Nilsson A. Chem. Soc. Rev. 2007;36:492–506. doi: 10.1039/B601326K. [DOI] [PubMed] [Google Scholar]
- Gerlt M. S. Läubli N. F. Manser M. Nelson B. J. Dual J. Micromachines. 2021;12:542. doi: 10.3390/mi12050542. [DOI] [PMC free article] [PubMed] [Google Scholar]
- Gross D., Wriggers P. and Werner H., Technische Mechanik 4, Springer Link, 2009 [Google Scholar]
- Graff K. F., Wave motion in elastic solids, Dover Publications, 1975 [Google Scholar]
- Gor'kov L. P. Soviet Physics - Doklady. 1962;6:773–775. [Google Scholar]
- Baasch T. Dual J. Phys. Rev. Appl. 2020;14:024052. doi: 10.1103/PhysRevApplied.14.024052. [DOI] [Google Scholar]
- Pierce A. D., Acoustics : an introduction to its physical principles and applications, Springer International Publishing, Woodbury, 3rd edn, 1991 [Google Scholar]
- Baldwin W. W. Myer R. Anderson E. Koch A. L. Powell N. Arch. Microbiol. 1995;164:155–157. doi: 10.1007/s002030050248. [DOI] [PubMed] [Google Scholar]
- Olofsson K. Hammarström B. Wiklund M. Lab Chip. 2020;20:1981–1990. doi: 10.1039/D0LC00175A. [DOI] [PubMed] [Google Scholar]
- Bruus H. Lab Chip. 2012;12:1014. doi: 10.1039/C2LC21068A. [DOI] [PubMed] [Google Scholar]
- Lakämper S. Lamprecht A. Schaap I. A. T. Dual J. Lab Chip. 2015;15:290–300. doi: 10.1039/C4LC01144A. [DOI] [PubMed] [Google Scholar]
- Sambrook J., Fritsch E. F. and Maniatis T., Molecular cloning: a laboratory manual, Cold spring harbor laboratory press, 1989 [Google Scholar]
- Norrander J. Kempe T. Messing J. Gene. 1983;26:101–106. doi: 10.1016/0378-1119(83)90040-9. [DOI] [PubMed] [Google Scholar]
- Bio-Rad, MicroPulser™ Electroporation Apparatus Operating Instructions and Applications Guide
Associated Data
This section collects any data citations, data availability statements, or supplementary materials included in this article.


