Abstract
With increasing use of in vitro fertilization and intracytoplasmic sperm injection (IVF-ICSI) almost 2% of all babies born in the United States each year are now conceived with these technologies, making outcomes of IVF-ICSI extremely important not only to patients and families but to public health. Twin pregnancy rates after IVF-ICSI in the United States have declined since their peak in 2013 but remain at approximately 1 in 10 to 1 in 20 pregnancies. A review of the current international literature on twin versus singleton pregnancy outcomes after IVF-ICSI treatment confirms statistically significantly higher risks to maternal and perinatal health and statistically significantly higher health care costs. The field of infertility care should continue to work to develop practices that lower twin pregnancy rates to an absolute minimum to maximize the safety of these medical treatments.
Keywords: Health care costs, infertility, in vitro fertilization, maternal outcomes, multiple gestation pregnancy, perinatal outcomes, twins
In spontaneously conceived pregnancies, monozygous twining happens about 0.4% of the time and dizygous twinning 1.2% of the time (1). The former rate is relatively stable across populations while the latter rate varies by maternal age and parity, race, sex of the embryos, and season. In addition, and most remarkably, the rate of dizygous twin pregnancies can be increased iatrogenically when ovarian hyperstimulation or multiple embryo transfer after in vitro fertilization (IVF) is used to increase the efficiency of fertility treatment (2). Such treatments also increase the rates of triplet and higher order multiple gestation pregnancies.
For the first two decades after such fertility treatments were introduced in the United States in the early 1980s, the rate of twin pregnancies nearly doubled, and the rate of triplet and higher order multiple gestation pregnancies quadrupled in the United States. Triplet and higher order multiple gestation birth rates began to fall in 1998, but twin rates continued to climb during the new millennium (3). Although a trend in increasing maternal age was responsible for a small part of these increases, practices in fertility treatment and the increasing rate of use of these treatments were the biggest factors responsible (4). Indeed, fertility treatment was the reason for one-third of all twin pregnancies and three quarters of all triplet and higher order multiple gestation pregnancies in the United States by 2013, when the percentage of twin live births from IVF ranged from 8.2% for women older than 42 years to 28.3% for women younger than 35 years (5, 6).
Thanks to an increasing awareness of the risks of multiple gestation pregnancies and efforts from leadership in the field of infertility care to encourage practice changes, twin rates have begun to decline slowly but steadily since that time. Preliminary 2018 data (pregnancy rates per procedure performed) from the Society for Assisted Reproductive Technology (SART) show a range of twin live-birth rates from 5.1% for women older than 42 years to 10.4% for women younger than 35 years (7). While laudable, the goal of our fertility treatments is to return our patients to normal health and well-being with one healthy baby per pregnancy. With that goal in mind, it is valuable to review the full scope of available international data on the risks of twin, triplet, and higher order multiple pregnancies for women, their pregnancies, their offspring, and their families, and to consider the increased costs to families and health care system.
MATERIALS AND METHODS
Literature search
We performed a review to identify studies of maternal and fetal outcomes for twin and multiple pregnancies compared with singleton pregnancies. The electronic databases OVID Medline and OVID EMBASE were searched for primary articles published from inception until February 2020. We performed a search using the MeSH terms “assisted reproductive techniques” AND “multiple pregnancy.” We subsequently supplemented the search with text words to include different outcomes associated with maternal morbidity and mortality; fetal morbidity and mortality; and social and societal outcomes. The different maternal and fetal outcomes covered within the scope of this review are listed in the data extraction section. The search strategy (search terms and corresponding MeSH terms) is detailed in Supplemental Tables 1 and 2 (available online). The reference lists of all eligible studies were hand-searched to identify any additional studies.
Study selection
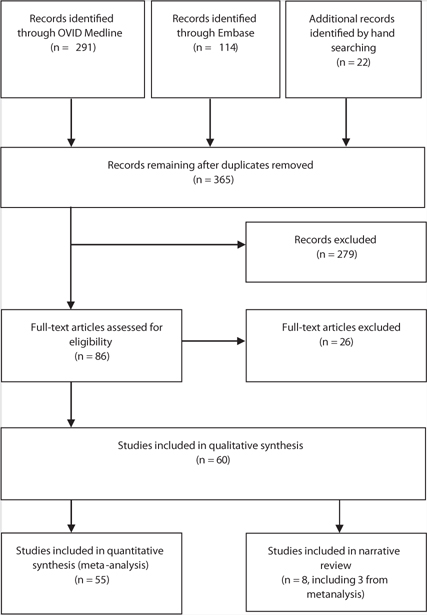
An overview of study inclusion is detailed in Figure 1. We included studies that met the following criteria: all studies where women achieved a pregnancy after assisted reproductive technology (ART) treatment; the pregnancy resulted in twins, triplets, or a higher order pregnancy; the outcome variable specifically related to maternal or fetal aspects (morbidity or mortality); and the respective studies (registry and cohort studies) had categorical data that distinguished singleton pregnancy outcomes from twin pregnancy outcomes (for comparison) because the health outcomes of twins and not triplets or higher order multiple pregnancies are the focus of this review.
FIGURE 1:
Preferred Reporting Items for Systematic Reviews and Meta-Analyses (PRISMA) flowchart for study inclusion and exclusion.
Any study that reported data from ART treatments other than IVF and intracytoplasmic sperm injection (ICSI) was excluded. Studies reporting outcomes or comparisons exclusive to naturally conceived singleton pregnancy or multiple order pregnancy were excluded. Letters, case reports, case series, expert reviews, and data that were presented as an abstract or oral presentation were also excluded from analysis. After removing the duplicates, two reviewers (A.E. and G.R.) independently screened the search results and assessed the eligibility of studies for inclusion by scanning the titles and abstracts. Any disagreements were resolved by a third reviewer (B.J.V.) during the team meeting every 2 weeks. No institutional board review approval was needed for this study because no patient-identifiable data was used for the review.
Data extraction
The following data were extracted for the included studies: first author, year, study design, patient demographics, and maternal and fetal outcomes. Categorical data were collected for both maternal and fetal outcomes. The data extraction was checked by a second reviewer. The studies that assessed maternal outcomes are presented in Table 1. The maternal outcomes we assessed included maternal hospitalization, cesarean delivery, gestational diabetes mellitus (GDM), antepartum hemorrhage, including placental abruption and placenta previa, pregnancy-induced hypertension, postpartum hemorrhage, preterm labor, and preeclampsia.
TABLE 1.
List of studies with maternal and fetal outcomes associated with multiple pregnancies after in vitro fertilization/intracytoplasmic sperm injection.
| Author, year (ref), geographical area | Study design | Study period | Study characteristics | Data collection and adjustments | Outcome variables of interest | Comments |
|---|---|---|---|---|---|---|
| Mouzon et al., 2010 (8), Europe | Multinational registry | 2006 | 32 European countries, 998 clinics, 458,759 ART cycles; IVF-ICSI singletons: 29,811; IVF-ICSI twins: 7,105 | Data from 17 countries, unadjusted data, combined for autologous and donor cycles | EPTBR (<28 wk), VPTBR (<32 wk), PTBR (<37 wk) | Data split by country, no maternal obstetric outcomes |
| Mouzon et al., 2012 (9), Europe | Multinational registry | 2007 | 33 European countries, 1,029 clinics, 493,184 ART cycles; IVF-ICSI singletons: 35,150; IVF-ICSI twins: 9,003 | Data from 15 countries, unadjusted data, combined for autologous and donor cycles | EPTBR (<28 wk), VPTBR (<32 wk), PTBR (<37 wk) | Data split by country, no maternal obstetric outcomes |
| Ferraretti et al., 2012 (10), Europe | Multinational registry | 2008 | 36 European countries, 1,051 clinics, 532,260 ART cycles; IVF-ICSI singletons: 39,054; IVF-ICSI twins: 9,839 | Data from 17 countries, unadjusted data, combined for autologous and donor cycles | EPTBR (<28 wk), VPTBR (<32 wk), PTBR (<37 wk) | Data split by country, no maternal obstetric outcomes |
| Ferraretti et al., 2013 (11), Europe | Multinational registry | 2009 | 34 European countries, 1,005 clinics, 537,463 ART cycles; IVF-ICSI singletons: 49,527; IVF-ICSI twins: 12,128 | Data from 19 countries, unadjusted data, combined for autologous and donor cycles | EPTBR (<28 wk), VPTBR (<32 wk), PTBR (<37 wk) | Data split by country, no maternal obstetric outcomes |
| Kupka et al., 2014 (12), Europe | Multinational registry | 2010 | 31 European countries, 991 clinics, 550,296 ART cycles; IVF-ICSI singletons: 41,433; IVF-ICSI twins: 9,521 | Data from 18 countries, unadjusted data, combined for autologous and donor cycles | EPTBR (<28 wk), VPTBR (<32 wk), PTBR (<37 wk) | Data split by country, no maternal obstetric outcomes |
| Kupka et al., 2016 (13), Europe | Multinational registry | 2011 | 33 European countries, 1,064 clinics, 609,973 ART cycles; IVF-ICSI singletons: 54,961; IVF-ICSI twins: 12,656 | Data from 17 countries, unadjusted data, combined for autologous and donor cycles | EPTBR (<28 wk), VPTBR (<32 wk), PTBR (<37 wk) | Data split by country, no maternal obstetric outcomes |
| Calhaz-Jorge et al., 2016 (14), Europe | Multinational registry | 2012 | 34 European countries, 1,111 clinics, 640,144 ART cycles; IVF-ICSI singletons: 55,370; IVF-ICSI twins: 12,399 | Data from 19 countries, unadjusted data, combined for autologous and donor cycles | EPTBR (<28 wk), VPTBR (<32 wk), PTBR (<37 wk) | Data split by country, no maternal obstetric outcomes |
| Calhaz-Jorge et al., 2017 (15), Europe | Multinational registry | 2013 | 38 European countries, 1,169 clinics, 686,271 ART cycles; IVF-ICSI singletons: 58,414; IVF-ICSI twins: 12,897 | Data from 18 countries, unadjusted data, combined for autologous and donor cycles | EPTBR (<28 wk), VPTBR (<32 wk), PTBR (<37 wk) | Data split by country, no maternal obstetric outcomes |
| De Geyter et al., 2018 (16), Europe | Multinational registry | 2014 | 39 European countries, 1,279 clinics, 776,556 ART cycles; IVF-ICSI singletons: 80,036; IVF-ICSI twins: 17,269 | Data from 20 countries, unadjusted data, combined for autologous and donor cycles | EPTBR (<28 wk), VPTBR (<32 wk), PTBR (<37 wk) | Data split by country, no maternal obstetric outcomes |
| Gunby et al., 2005 (17), Canada | National registry | 2001 | 22 clinics, 7,884 ART cycles; IVF-ICSI singletons: 1,141; IVF-ICSI twins: 958 | Unadjusted data for all autologous and donor cycles | PNMR, MGA, PTBR (<37 wk), VPTBR (<34 wk), BW, CA | Mean BW not documented (only in %), limited information on CA |
| Gunby et al., 2006 (18), Canada | National registry | 2002 | 21 clinics, 9,188 ART cycles; IVF-ICSI singletons: 1,359; IVF-ICSI twins: 1,228 | Unadjusted data for all autologous and donor cycles | PNMR, MGA, PTBR (<37 wk), VPTBR (<34wk), BW, CA | Mean BW not documented (only in %), limited information on CA |
| Gunby et al., 2007 (19), Canada | National registry | 2003 | 24 clinics, 10,656 ART cycles; IVF-ICSI singletons: 1,621; IVF-ICSI twins: 1,378 | Unadjusted data for all autologous and donor cycles | PNMR, MGA, PTBR (<37 wk), VPTBR (<34wk), BW, CA | Mean BW not documented (only in %), limited information on CA |
| Gunby et al., 2008 (20), Canada | National registry | 2004 | 26 clinics, 11,068 ART cycles; IVF-ICSI singletons: 1,804; IVF-ICSI twins: 1,286 | Unadjusted data for all autologous and donor cycles | PNMR, MGA, PTBR (<37 wk), VPTBR (<34wk), BW, CA | Mean BW not documented (only in %), limited information on CA |
| Gunby et al., 2009 (21), Canada | National registry | 2005 | 25 clinics, 11,414 ART cycles; IVF-ICSI singletons: 1,909; IVF-ICSI twins: 1,534 | Unadjusted data for all autologous and donor cycles | PNMR, MGA, PTBR (<37 wk), VPTBR (<34wk), BW, CA | Mean BW not documented (only in %), limited information on CA |
| Gunby et al., 2010 (22), Canada | National registry | 2006 | 25 clinics, 12,052 ART cycles; IVF-ICSI singletons: 2,123; IVF-ICSI twins: 1,692 | Unadjusted data for all autologous and donor cycles | PNMR, MGA, PTBR (<37 wk), VPTBR (<34wk), BW, CA | Mean BW not documented (only in %), limited information on CA |
| Gunby et al., 2011 (23), Canada | National registry | 2007 | 26 clinics, 13,482 ART cycles; IVF-ICSI singletons: 2,461; IVF-ICSI twins: 1,948 | Unadjusted data for all autologous and donor cycles | PNMR, MGA, PTBR (<37 wk), VPTBR (<34wk), BW, CA | Mean BW not documented (only in %), limited information on CA |
| Zegers-Hochschild et al., 2019 (24), Latin America | Latin American IVF registry | 2016 | 15 countries, 85,474 ART cycles; IVF-ICSI singletons: 11,959; IVF-ICSI twins: 5,727 | Unadjusted data for all autologous and donor cycles | PNM, MGA, PTB, VPTB, BW | Data from 178 clinics |
| Zegers-Hochschild et al., 2018 (25), Latin America | Latin American IVF registry | 2015 | 15 countries, 75,121 ART cycles; IVF-ICSI singletons: 11,627; IVF-ICSI twins: 6,326 | Unadjusted data for all autologous and donor cycles | PNM, MGA, PTB, VPTB, BW | Data from 175 clinics |
| Zegers-Hochschild et al., 2017 (26), Latin America | Latin American IVF registry | 2014 | 15 countries; IVF-ICSI singletons: 11,373; IVF-ICSI twins: 6,398 | Unadjusted data for all autologous and donor cycles | PNM, PTB, VPTB | Data from 159 clinics |
| Zegers-Hochschild et al., 2015 (27), Latin America | Latin American IVF registry | 2013 | 15 countries, 85,474 ART cycles; IVF-ICSI singletons: 8,385; IVF-ICSI twins: 5,649 | Unadjusted data for all autologous and donor cycles | PNM, MGA, PTB, RR for PM and VPTB | Data from 158 clinics |
| Sunderam et al., 2018 (28), U.S. | ART surveillance data, U.S. | 2015 | 52 reporting areas, total of 182,111 ART procedures; ART twins: 22,491 | Unadjusted data for all autologous and donor cycles | LBW, PTB, PTBR | Data from 464 clinics |
| Sunderam et al., 2017 (29), U.S. | ART surveillance data, U.S. | 2014 | 52 reporting areas, total of 169,568 ART procedures; ART twins: 24,514 | Unadjusted data for all autologous and donor cycles | LBW, PTB, PTBR | Data from 458 clinics |
| Sunderam et al., 2015 (30), U.S. | ART surveillance data, U.S. | 2013 | 52 reporting areas, total of 160,521 ART procedures; ART twins: 24,607 | Unadjusted data for all autologous and donor cycles | LBW, PTB, PTBR, HCC | Data from 467 clinics |
| Chambers et al., 2007 (31), Australia | Retrospective population cohort study | 1993–2003 | Cohort of 5,005 mothers; cohort of 5,886 infants conceived after ART | ART treatment compared with general population | CD, MBAC, CHCC, BW, MBAC | Birth-admission costs calculated using Australian Refined Diagnosis Related Groups and weighted national average costs (2003–2004 Euros) |
| Felberbaum et al., 2007 (32), Germany | National registry study | 2001 | Data from Deutsches IVF-Register | Unadjusted data for all autologous and donor cycles | MGA, MBW, and PTBR | Data compared with ART rates in Europe |
| Makhseed et al., 1998 (33), Kuwait | Retrospective cohort study | 1994–1996 | Single center; IVF-ICSI singletons: 58; IVF-ICSI twins: 31 | Autologous, fresh IVF-ICSI cycles | GDM, PIH,PP, PA, CD, MGA, PTBR, EPTBR, VPTBR, MBW, NICU admission | Small cohort study |
| Callahan et al., 1994 (34), U.S. | Retrospective cohort study | 1986–1991 | Single center university program; IVF-ICSI singletons: 11,986; IVF-ICSI twins: 1,135 | Unadjusted data for all ART treatment | Charges for mother, infants, and total family | Included GIFT, review of medical and billing records, telephone survey for follow up |
| Goldfarb et al., 1996 (35), U.S. | Retrospective cohort study | 1991–1992 | Single center university program; IVF-ICSI singletons: 36; IVF-ICSI twins: 28 | Autologous, fresh IVF-ICSI cycles | MHA, NICU, HCC for infants | 1991–1992 equivalent US$ |
| Rizk et al., 1991 (36), U.K. | Retrospective cohort study | 1978–1987 | Single center; IVF-ICSI singletons: 527; IVF-ICSI twins: 262 | Unadjusted data for all IVF-ICSI treatments | PTBR, LBW, SBR | Data compared with national register |
| Merritt et al., 2014 (37), U.S. | Retrospective cohort study | 2009–2011 | NA | Combined data for IVF-ICSI | SBR, PTB, ANH | In-patient admission data sets, may include small number of AI cycles |
| Luke et al., 2019 (38), U.S. | National data | 2004–2013 | 13 States; IVF-ICSI singletons: 97,852; IVF-ICSI twins: 40,406 | Data for fresh IVF cycles using autologous oocytes | GDM, PIH,PP, PA, CD, MGA, PTBR, EPTBR, VPTBR, MBW, NICU admission | Data linkage through infant birth and death certificates, retrieved data only for ART group |
| Luke et al., 2019 (38), U.S. | National data | 2004–2013 | 13 States; IVF-ICSI singletons: 27,930; IVF-ICSI twins: 8,127 | Data for frozen IVF cycles using autologous oocytes | GDM, PIH, PP, PA, CD, MGA, PTBR, EPTBR, VPTBR, MBW, NICU admission | Data linkage through infant birth and death certificates, retrieved data only for ART group |
| Luke et al., 2019 (38), U.S. | National data | 2004–2013 | 13 States; IVF-ICSI singletons: 13,875; IVF-ICSI twins: 8,586 | Data for fresh IVF cycles using donor oocytes | GDM, PIH, PP, PA, CD, MGA, PTBR, EPTBR, VPTBR, MBW, NICU admission | Data linkage through infant birth and death certificates, retrieved data only for ART group |
| Luke et al., 2019 (38), U.S. | National data | 2004–2013 | 13 States; IVF-ICSI singletons: 5,965; IVF-ICSI twins: 1,801 | Data for frozen IVF cycles using donor oocytes | GDM, PIH, PP, PA, CD, MGA, PTBR, EPTBR, VPTBR, MBW, NICU admission | Data linkage through infant birth and death certificates, retrieved data only for ART group |
| Dhont et al., 1999 (39), Belgium | Retrospective cohort study | 1992–1997 | 13 States; IVF-ICSI singletons: 3,057; IVF-ICSI twins: 1,241 | Data for IVF and ICSI | MGA, MBW, PND, PNM, CA, CD | Data extracted from tables compared with controls |
| Pinborg et al., 2004 (40), Denmark | National cohort study | 1997 | IVF-ICSI singleton mothers: 764; non-IVF-ICSI twin mothers: 739; IVF-ICSI singletons: 634; IVF-ICSI twins: 472 | Data for all IVF-ICSI treatment cycles | MHA, PE, Sick leave, MBW, MGA | Data collected through questionnaire study of mothers of IVF-ICSI singletons and twins |
| Gerris et al., 2004 (41), Belgium | Prospective cohort study | 2000–2001 | IVF-ICSI singletons: 33; IVF-ICSI twins: 12 | Data for women who had DET | MHA, MGA, PTB, LBW, CD, MBW, NICU admission | Data for women who had DET |
| FIVNAT register 1996 (42), France | National registry data | 1986–1993 | IVF-ICSI singletons: 7,650; IVF-ICSI twins: 2,470 | Data for all IVF-ICSI treatment cycles | MHA, MGA, PTB, LBW, CD, MBW, NICU admission | Data extracted from tables from ESHRE Capri workshop group manuscript |
| Stoop et al., 2012 (43), Belgium | Matched-pair analysis | 1999–2008 | IVF-ICSI singletons: 148; IVF-ICSI twins: 57 | IVF with oocyte donation | GDM, PIH, PP, PA, CD, MGA, PTBR, EPTBR, VPTBR, MBW, NICU admission | Individual data for singleton versus twins captured, variables defined |
| Stoop et al., 2012 (43), Belgium | Matched-pair analysis | 1999–2008 | IVF-ICSI singletons: 148; IVF-ICSI twins: 157 | IVF with autologous oocyte | GDM, PIH, PP, PA, CD, MGA, PTBR, EPTBR, VPTBR, MBW, NICU admission | Individual data for singleton versus twins captured, variables defined |
| Han et al., 2018 (44), People’s Republic of China | Register-based cohort study | 2004–2014 | NA | IVF and FET groups | CA | CA associated with individual system but no separate data for singletons and twins |
| Ombelet et al., 2005 (45), Belgium | Retrospective cohort study | 1993–2003 | IVF singletons: 3,974 IVF twins: 2,901 | Data for IVF cycles | MGA, MBW, CD, PTBR, VPTBR, LBW, CA, NICU | CA combined for minor and major aspects |
| Ombelet et al., 2005 (45), Belgium | Retrospective cohort study | 1993–2003 | ICSI singletons: 1,655; ICSI twins: 1,102 | Data for ICSI cycles | MGA, MBW, CD, PTBR, VPTBR, LBW, CA, NICU | CA combined for minor and major aspects |
| Koivurova et al., 2002 (46), Finland (data) | Population-based cohort study | 1990–1995 | IVF-ICSI singletons: 152; IVF-ICSI twins: 103 | Data for all IVF-ICSI treatment cycles | Prematurity, CA | Linkage to national hospital discharge register, Finnish data |
| Van Dorp et al., 2014 (47), the Netherlands | Nationwide perinatal registry | 1992–2009 | IVF singletons: 61; IVF twins: 49 | IVF with oocyte donation | MGA, CD, FM, MBW, CA, PP, PA, PIH, GDM | Univariate analysis data |
| Van Dorp et al., 2014 (47), the Netherlands | Nationwide perinatal registry | 1992–2009 | IVF singletons: 192; IVF twins: 119 | IVF fresh cycles | MGA, CD, FM, MBW, CA, PP, PA, PIH, GDM | Univariate analysis data |
| Ricciarelli et al., 2013 (48), Spain | Prospective cohort study | 2008–2009 | IVF-ICSI singletons: 5830 IVF ICSI twins: 4175 | Data for IVF-ICSI, FET, and PGD cycles | CA and prematurity | SB significantly lower in singletons |
| D’Souza et al., 1997 (49), U.K. | Retrospective cohort study | 1984–1991 | IVF-ICSI singletons: 150; IVF ICSI twins: 100 | Data for fresh IVF cycles using autologous oocytes | MGA, MBW, CD, CA | Minor and major CA combined |
| Farhi et al., 2013 (50), Israel | Retrospective cohort study | 1997–2004 | IVF singletons: 1,680; IVF twins: 1,621 | Data for frozen IVF cycles | MGA, CA | Minor and major CA combined |
| Farhi et al., 2013 (50), Israel | Retrospective cohort study | 1997–2004 | ICSI singletons: 2,646; ICSI twins: 3,095 | Data for fresh ICSI cycles | MGA, CA | Minor and major CA combined |
| Goldsmith et al., 2017 (51), Australia | Retrospective cohort study | 1994–2002 | IVF-ICSI singletons: 3,233; IVF-ICSI twins: 1,726 | Data for IVF and ICSI | CD, MGA, MBW | Emergency and elective cesarean deliveries combined |
| Belva et al., 2008 (52), Belgium | Retrospective cohort study | NA | IVF singletons: 1,523; IVF twins: 1,251 | Data for fresh IVF cycles | MBW, LBW, NICU admissions | Questionnaire data and physical examination of children |
| Belva et al., 2008 (52), Belgium | Retrospective cohort study | NA | IVF singletons: 281; IVF twins: 98 | Data for frozen IVF cycles | MBW, LBW, NICU admissions | Questionnaire data and physical examination of children |
| Belva et al., 2008 (52), Belgium | Retrospective cohort study | NA | ICSI singletons: 1,476; ICSI twins: 1,211 | Data for fresh ICSI cycles | MBW, LBW, NICU admissions | Questionnaire data and physical examination of children |
| Belva et al., 2008 (52), Belgium | Retrospective cohort study | NA | ICSI singletons: 381; ICSI twins: 155 | Data for frozen ICSI cycles | MBW, LBW, NICU admissions | Questionnaire data and physical examination of children |
| Belva et al., 2016 (53), Belgium | Retrospective cohort study | 2008–2013 | IVF singletons: 827; IVF twins: 234 | Data for FET | MBW, LBW, PTBR, VPTBR, EPTBR, NICU admissions, CA | Total CA taken |
| Belva et al., 2016 (53), Belgium | Retrospective cohort study | 2008–2013 | IVF singletons: 874; IVF twins: 464 | Data for fresh transfers | MBW, LBW, PTBR, VPTBR, EPTBR, NICU admissions | Total CA taken |
| Declercq et al., 2015 (54), U.S. | Longitudinal cohort study | 2004–2008 | IVF singletons: 6,480; IVF twins: 4,774 | Data for ART cycles | PTB, LBW, PND, GDM, PIH, CD | Massachusetts Outcomes Study of Assisted Reproductive Technologies (MOSART) |
| Tandberg et al., 2010 (55), Norway | Population-based cohort study | 1967–2006 | IVF singleton: 8,501; IVF twins: 5,341 | Data for ART cycles | CD, MGA, MBW | Birth registry of Norway |
| Sullivan et al., 2010 (56), Australia | Retrospective population-based study | 2003–2005 | IVF singletons: 14,014; IVF twins: 2,847 | Data for fresh IVF cycles using autologous oocytes | CD, PTBR | Crude CD rates, elective and emergency combined |
| Pereira et al., 2016 (57), U.S. | Retrospective cohort study | 2010–2013 | ART singletons: 116; ART twins: 32 | Data for natural cycle FET | CD, MBW, PTB | Fresh and frozen-thawed blastocyst transfers |
| Pereira et al., 2016 (57), U.S. | Retrospective cohort study | 2010–2013 | ART singletons: 241; ART twins: 58 | Data for HT-FET | CD, MBW, PTB | Fresh and frozen-thawed blastocyst transfers |
| Zhu et al., 2016 (58), People’s Republic of China | Retrospective cohort study | 2006–2014 | ART singleton: 1,659; ART twins: 982 | Data for IVF and ICSI | GDM, PE, PP, PA, PPHPTL, LBW | Incidence rates for respective groups |
| Lei et al., 2019 (59), People’s Republic of China | Retrospective cohort study | 2013–2015 | ART singletons: 1,453; ART twins: 803 | Data for IVF-ICSI and FET cycles | PIH, PE, GDM, PA, PP, PROM, PPH, PTL, LBW | PROM combined with PPROM data |
| Spangmose et al., 2019 (60), Denmark | National registry-based cohort | 1995–1998 | ART singletons: 2,836; ART twins: 1,930 | Data for IVF-ICSI | MBW, LBW, PTBR, VPTBR, EPTBR, and school test scores | Included in narrative review also |
| Marino et al., 2014 (61), Australia | Retrospective cohort study | 1986–2002 | IVF singletons: 961; IVF twins: 558 | Data for fresh IVF cycles | SBR, BW, PTB, VPTBR | Incidence rates in individual treatment group |
| Marino et al., 2014 (61), Australia | Retrospective cohort study | 1986–2002 | IVF singletons: 454; IVF twins: 150 | Data for frozen IVF cycles | SBR, BW, PTB, VPTBR | Incidence rates in individual treatment group |
| Marino et al., 2014 (61), Australia | Retrospective cohort study | 1986–2002 | ICSI singletons: 703; ICSI twins: 386 | Data for fresh ICSI cycles | SBR, BW, PTB, VPTBR | Incidence rates in individual treatment group |
| Marino et al., 2014 (61), Australia | Retrospective cohort study | 1986–2002 | ICSI singletons: 220; ICSI twins:65 | Data for frozen ICSI cycles | SBR, BW, PTB, VPTBR | Incidence rates in individual treatment group |
| Setti et al., 2016 (62), Italy | Retrospective cohort study | 1996–2009 | ART singletons: 1,426; ART twins: 796 | Data after fresh cleavage-stage ET for IVF and ICSI cycle | MGA, MBW | No breakdown on CA in singletons and twins |
Note: AI = artificial insemination; ANH = antenatal hospitalization; ART = assisted reproductive technology; BW = birth weight; CA = congenital anomaly; CD = cesarean delivery; CHCC = combined maternal and fetal health care costs; CI = confidence interval; DET = double-embryo transfer; EPTBR = early preterm birth rate; ESHRE = European Society of Human Reproduction and Embryology; ET = embryo transfer; FET = frozen embryo transfer; FM = fetal malpresentation; GDM = gestational diabetes mellitus; GIFT = gamete intrafallopian transfer; HCC = health care cost; HELLPS = hemolysis, elevated liver enzymes, low platelet count syndrome; HT = hormone treatment; ICSI = intracytoplasmic sperm injection; IVF = in vitro fertilization; LBW = low birth weight; MBAC = mean birth admission cost; MBW = mean birth weight; MGA = mean gestational age; MHA = mean hospital admissions; MHS = maternal hospital stay; NA = not available; NICU = neonatal intensive care unit; PA = placental abruption; PE = preeclampsia; PGD = preimplantation genetic diagnosis; PIH = pregnancy-induced hypertension; PM = prematurity; PND = perinatal death; PNMR = perinatal mortality rate; PP = placenta previa; PPH = postpartum hemorrhage; PROM = premature rupture of membranes; PPROM = preterm premature rupture of membranes; PTB = preterm birth; PTBR = preterm birth rate; PTL = preterm labor; RR = relative risk; SBR = stillbirth rate; SCBU = special care baby unit; VPTB = very preterm birth; VPTBR = very preterm birth rate.
The studies that assessed fetal outcomes are presented in Table 1. The fetal outcomes assessed included congenital anomalies, preterm birth rate (<37 weeks of gestation), early preterm birth rate (<32 weeks of gestation), very preterm birth rate (<28 weeks of gestation), low birth weight (<2,500 grams), neonatal intensive care unit (NICU)/special care baby unit (SCBU) admission rate, mean gestational age in weeks, mean birth weight in grams, perinatal mortality rate, and stillbirth rate. All data are expressed in percentages except mean gestational age (in weeks) and mean birth weight (in grams). Other social and societal outcomes included (for which a direct comparison was not possible) are presented in Table 2: hospital admission charges (maternal and neonatal or combined costs) and maternal stress and depression.
TABLE 2.
List of studies with social and societal outcomes associated with multiple pregnancies after in vitro fertilization/intracytoplasmic sperm injection.
| Author, year (ref), geographical area | Study design | Study period | Study characteristics | Data collection and adjustments | Outcome variables of interest | Comments |
|---|---|---|---|---|---|---|
| Chambers et al., 2007 (31), Australia | Retrospective cohort study | 2003 | 5,005 mothers and 5,886 live births; IVF-ICSI singletons: 4,087; IVF-ICSI twins: 1,774 | Maternal age adjusted data | Average (combined) in patient birth episode costs | Equivalent of 2003 Euros |
| Motohashi et al., 2004 (63), Japan | Retrospective cohort study | 1997–2002 | Women with IVF singletons: 58; with IVF twins: 21 | Control group in the study | Maternal costs, infant costs, and combined costs | USD equivalent of 2003 Japanese yen ($1 = 120¥) |
| Pinborg et al., 2004 (40), Denmark | National cohort study | 1997 | IVF-ICSI singletons: 634; IVF-ICSI twins: 472 | Stratified for maternal age and parity | Sick leave | Rate comparison and average number of weeks |
| Koivurova et al., 2007 (46), Finland | Population-based cohort study | 1990–1995 | IVF-ICSI singletons: 152; IVF-ICSI twins: 103 | 7-Year follow-up study | Postneonatal medical conditions and admission costs | Equivalent of 2004 Euros |
| Chambers et al., 2014 (64), Australia | Retrospective cohort study | 1993–2003 | IVF singletons: 2,266; IVF twins: 1,067 | Follow up until 2008 | Comprehensive economic and health services assessment of the frequency, duration, and cost of hospital admissions during the first 5 years of life for singleton, twin, and HOM children | Australian dollars converted to US$ |
| Lemos et al., 2013 (65), US | Retrospective cohort study | 2005–2010 | NA | Adjusted data | Health care costs | Equivalent of 2013 US$ |
| Gerris et al., 2004 (41), Belgium | Prospective study | 2000–2001 | IVF-ICSI singletons: 33; IVF-ICSI twins: 12 | Data for women who had DET | Health care costs for mother and infants | Equivalent of 2004 Euros |
| Oliveness et al., 2005 (66), France | Questionnaire-based cohort study | 1998–2001 | Families with 2- to 5-year-old singletons 344; Families with 2- to 5-year-old twins 344 | Standardized measurement techniques used | Maternal psychological well-being and child psychological development | Children followed up until 2003 |
Note: DET = double-embryo transfer; HOM = higher-order multiple; NA = not available.
Statistical analysis
For each maternal and fetal outcome, data was extracted as a 2 × 2 table in an Excel file. For analytic purposes, we categorized outcome data (where available) separately based on different treatment interventions (e.g., autologous oocytes, donor oocytes, and frozen embryo transfer). The study statistician (P.T.) performed meta-analysis as appropriate for the relevant data.
Meta-analyses for comparisons of means and proportions were performed using the R functions metacont and metabin, respectively, from the meta package (https://cran.r-project.org/web/packages/meta/index.html). Mean differences or odds ratios (OR) and their 95% confidence intervals (CI) were calculated for each study within a set and used the random effects weights for calculating the aggregate statistics. This information is expressed numerically and visually using forest plots constructed with the forest function in R. Statistics for the heterogeneity of each set of studies are included in each plot. Statistical heterogeneity and impact of heterogeneity on meta-analysis were performed. We used I2 statistics to assess the impact of heterogeneity on the meta-analysis.
RESULTS
A total of 60 studies were included in the review. The initial search of the Medline and EMBASE databases identified 432 potentially relevant articles. After screening the titles and abstracts, 86 full texts were obtained for detailed review. A total of 26 full articles were excluded where studies did not have any primary data on singleton pregnancy outcomes (for comparison). An additional 22 studies were identified through examination of reference list of full articles. The identification of study selection is shown in Figure 1.
We divided the selected manuscripts to studies with maternal and fetal outcomes (Table 1) for the meta-analysis; and studies with societal outcomes (financial aspects, maternal stress and depression, fetal and child development) for a narrative review (Table 2). The 60 studies that met the inclusion criteria were all published in English up to February 2020. Even though there were no language restrictions applied in the study identification phase, only articles with a full English translation were included in the final analysis. Out of the studies identified, 17 were from North America, four from South America, 28 from Europe, six from Asia, and five from Australia.
Maternal outcomes
Maternal outcomes were assessed based on the proportion of occurrence per pregnancy episode. See Table 3 for a summary of effect sizes and heterogeneity for each maternal outcome.
TABLE 3.
Summary table of maternal outcomes for effect and heterogeneity: twins compared with singleton pregnancies after in vitro fertilization/intracytoplasmic sperm injection treatment.
| Outcome | Heterogeneity I2 % (P value) | OR (95% CI) |
|---|---|---|
| Antenatal hospitalization | 52 (.05) | 2.6 (1.9–3.5) |
| Cesarean delivery | 93 (<.01) | 3.7 (3.3–4.1) |
| Gestational diabetes mellitus | 58 (<.01) | 1.2 (1.1–1.3) |
| Placental abruption | 0 (.82) | 1.3 (1.2–1.5) |
| Placenta previa | 66 (.02) | 0.8 (0.7–0.9) |
| Pregnancy-induced hypertension | 78 (<.01) | 2.0 (1.9–2.3) |
| Postpartum hemorrhage | 91 (<.01) | 2.2 (1.2–4.1) |
| Preterm labor | 91 (<.01) | 6.3 (3.6–11.0) |
| Preeclampsia | 40 (.12) | 1.9 (1.4–2.6) |
Note: CI = confidence interval; OR = odds ratio.
Antenatal hospitalization.
Six studies reported outcomes of antenatal hospitalization: one registry-based study (FIVNAT register) along with five cohort studies (Fig. 2). The outcomes data for Gerris et al. (41) were for singleton and twin pregnancies resulting from a double-embryo transfer. Indications for hospitalization in these studies included secondary ovarian hyperstimulation syndrome, heterotopic pregnancies, hyperemesis gravidarum, antepartum hemorrhage, and cholestasis of pregnancy. Goldfarb et al. (35) included multiple episodes of hospital admissions in some women due to threatened preterm labor. The OR of antenatal hospitalization was 2.6 (95% CI) 1.9–3.5) in IVF-ICSI twin gestations when compared with singleton IVF-ICSI gestations. There was a moderate level of heterogeneity (I2 = 52%, P=.05) within the studies included.
FIGURE 2:
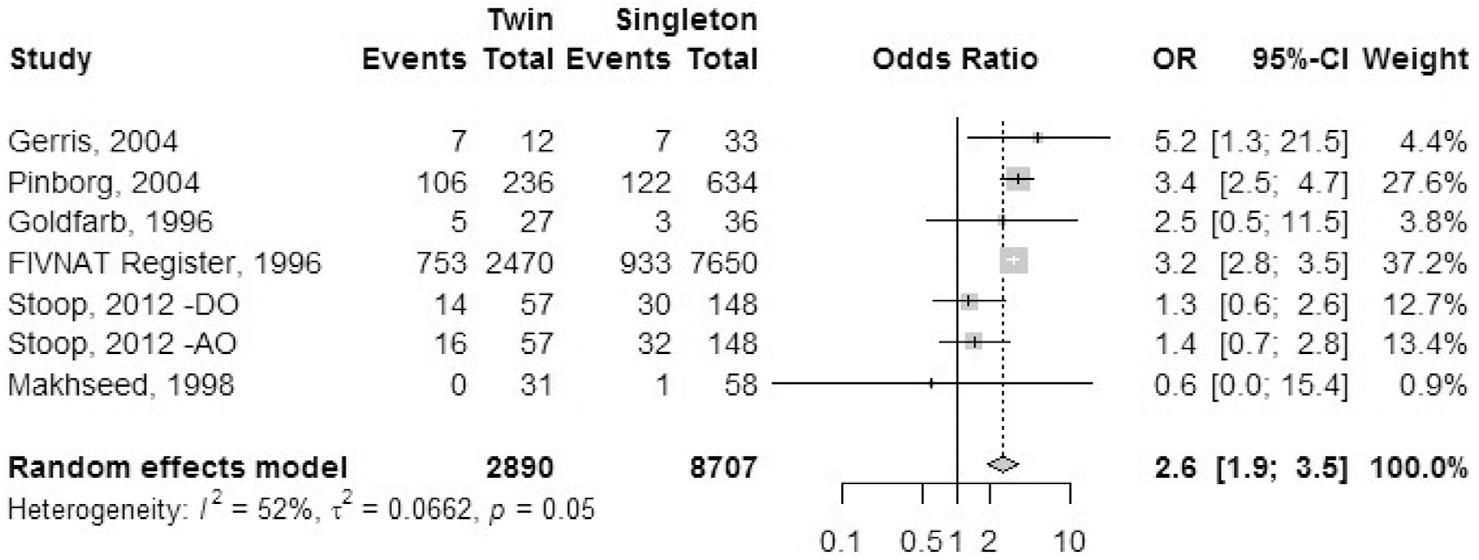
Antenatal hospitalization.
Cesarean delivery.
Sixteen studies reported the outcome of cesarean delivery: one registry study (FIVNAT, 1996) and 15 cohort studies (Fig. 3). We combined data for elective and emergency cesarean delivery together for this analysis. Only primary cesarean delivery rates were analyzed. Ombelet et al. (45) reported data for IVF treatment cycles and ICSI treatment cycles separately. Stoop et al. (43) and Van Dorp et al. (47) reported data separately for autologous cycles and oocyte donor cycles. Luke et al. (38) mentioned separate data sets for fresh and frozen autologous cycles and fresh and frozen oocyte donor treatment cycles. Pereira et al. (57) reported data for natural cycle frozen embryo transfers separately from frozen embryo transfers after hormone treatment. The OR of cesarean delivery was 3.7 (95% CI, 3.3–4.1) in IVF-ICSI twin gestations when compared with singleton IVF-ICSI gestations. There was a statistically significant heterogeneity (I2 = 93%, P<.01) within the studies included.
FIGURE 3:
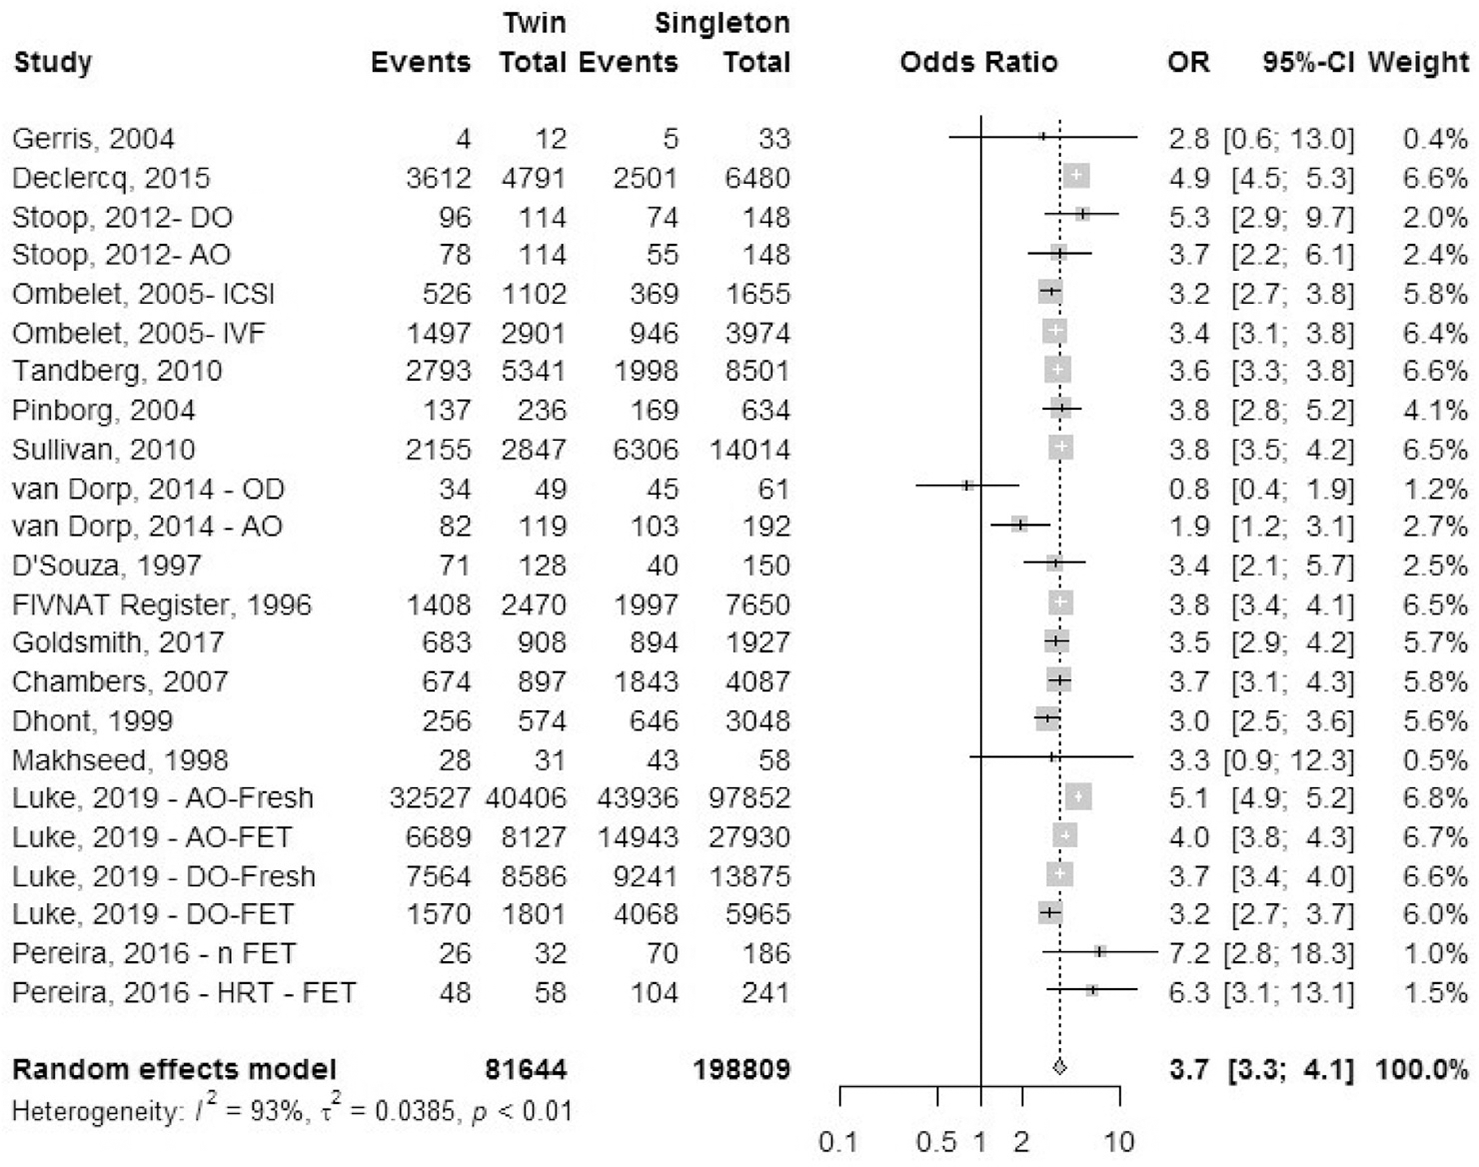
Cesarean delivery.
Gestational diabetes mellitus.
Seven cohort studies reported outcomes of GDM, although the definition and diagnostic criteria for GDM were unclear from the studies (Fig. 4). Data for pregestational diabetes were excluded. The OR of GDM was 1.2 (95% CI, 1.1–1.3) in IVF-ICSI twin gestations when compared with singleton IVF-ICSI gestation. There was a moderate heterogeneity (I2 = 58%, P<.01) in the included studies.
FIGURE 4:
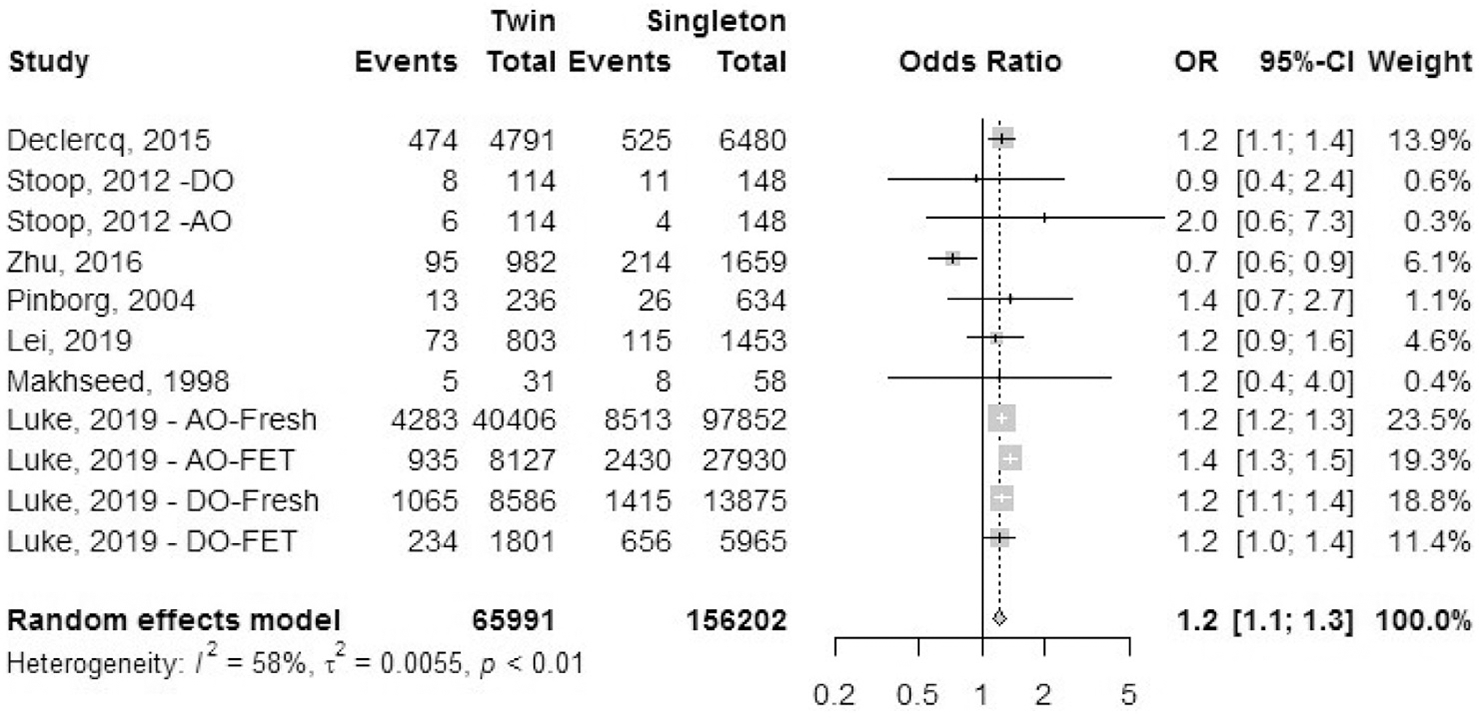
Gestational diabetes mellitus.
Antepartum hemorrhage: placental abruption.
Four cohort studies reported the outcome of placental abruption (Fig. 5). We excluded studies that reported combined data on multiple reasons for antepartum hemorrhage (e.g., all cases of placental abruption, placenta previa, and other causes of hemorrhage reported together). The OR of placental abruption was 1.3 (95% CI, 1.2–1.5) in IVF-ICSI twin gestations when compared with singleton IVF-ICSI gestations. There was a minimal heterogeneity (I2 = 0%, P=.82) in the included studies.
FIGURE 5:
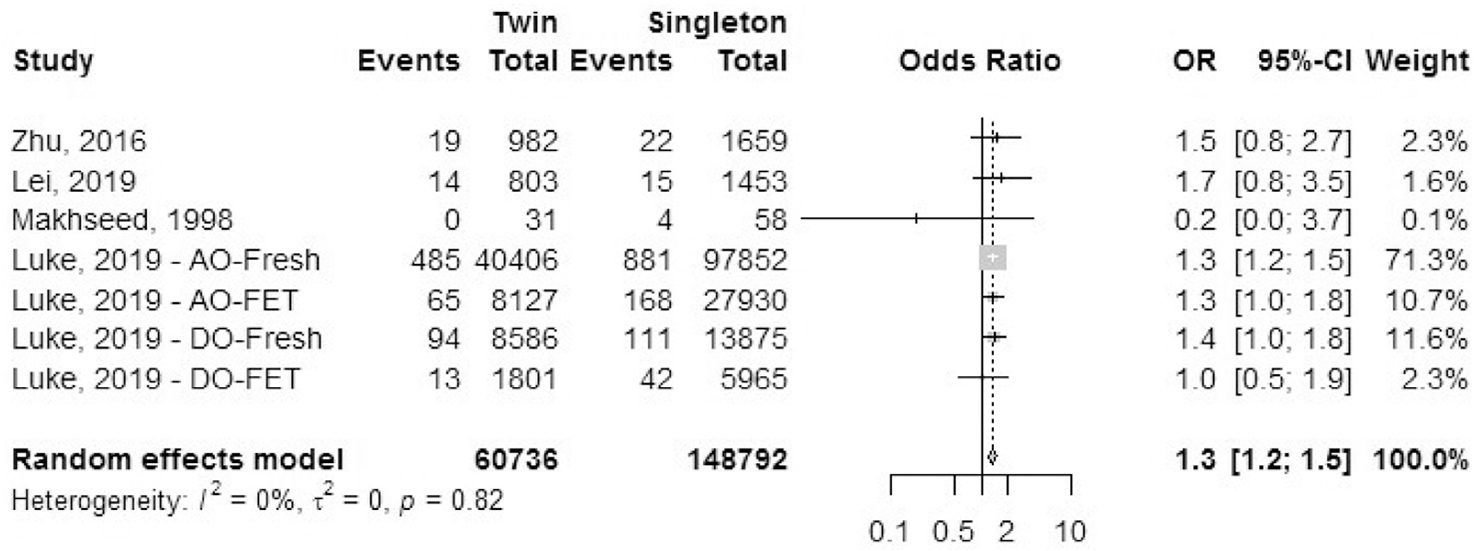
Antepartum hemorrhage: placental abruption.
Antepartum hemorrhage: placenta previa.
Four cohort studies reported the outcome of placenta previa (Fig. 6). We excluded studies that reported combined data on multiple reasons for antepartum hemorrhage (e.g., all cases of placental abruption, placenta previa, and other causes of hemorrhage reported together). The grade of severity of placenta previa was unclear from the studies. The OR of placental abruption was 0.8 (95% CI, 0.7–0.9) in IVF-ICSI twin gestations when compared with singleton IVF-ICSI gestations. There was a moderate heterogeneity (I2 = 66%, P=.01) in the included studies.
FIGURE 6:
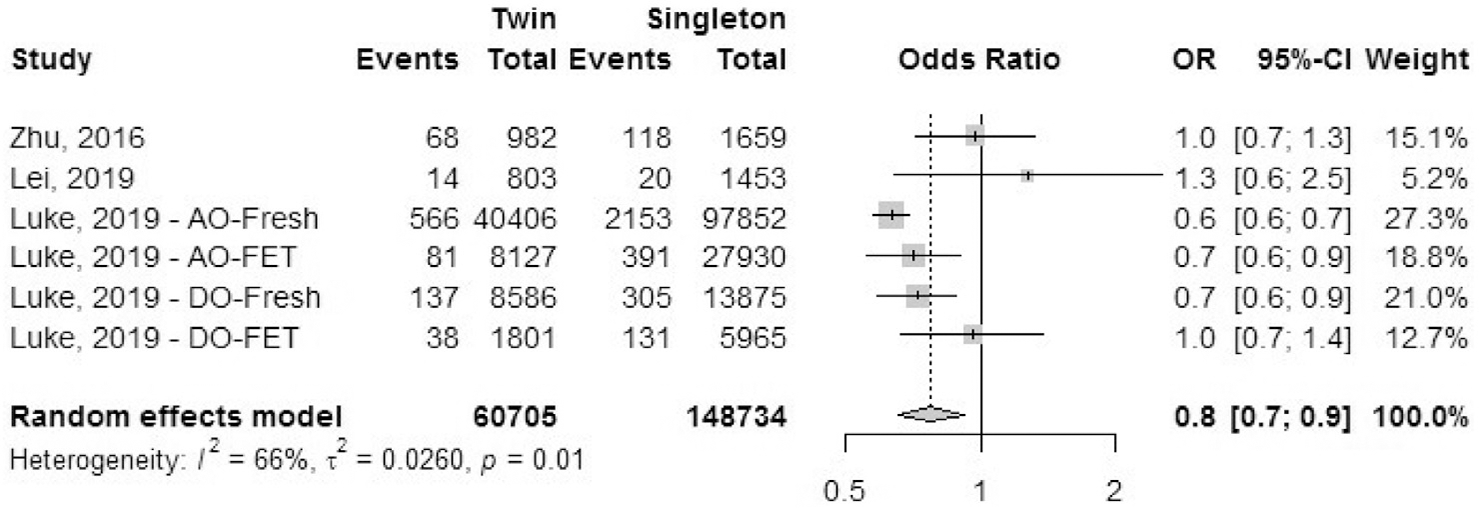
Antepartum hemorrhage: placenta previa.
Pregnancy-induced hypertension.
Seven cohort studies reported the outcome of pregnancy-induced hypertension (Fig. 7). Stoop et al. (43) defined pregnancy-induced hypertension as blood pressure levels >140/90 mm Hg on two or more occasions at least 6 hours apart, without proteinuria, after 20 weeks. Data for pregestational hypertension was excluded. The odds ratio of having pregnancy-induced hypertension was 2.0 (95% CI, 1.9–2.3) in IVF-ICSI twin gestations when compared with singleton IVF-ICSI gestation. There was a moderate heterogeneity (I2 = 78%, P<.01) in the included studies.
FIGURE 7:
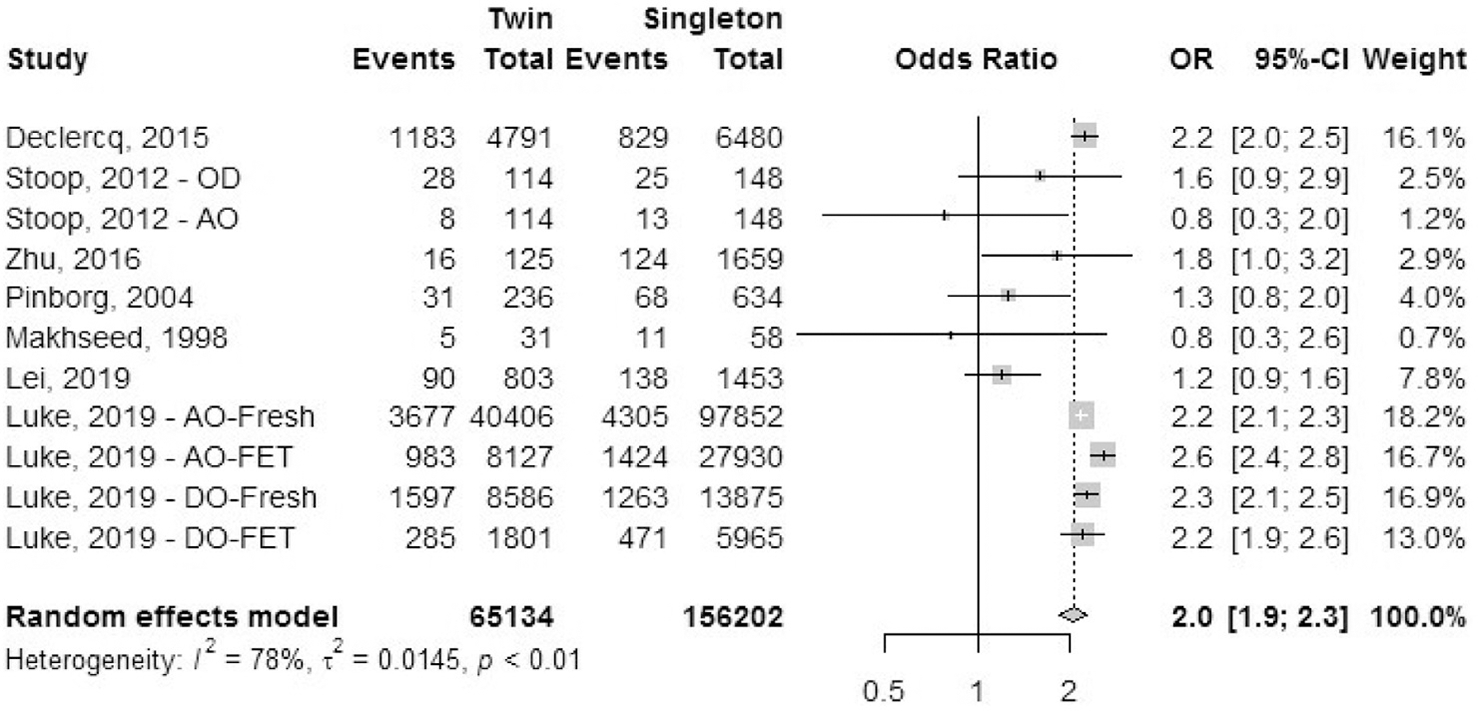
Pregnancy-induced hypertension.
Postpartum hemorrhage.
Five studies reported the outcome of postpartum hemorrhage: one registry study (FIVNAT) and four cohort studies (Fig. 8). The odds ratio of having postpartum hemorrhage was 2.2 (95% CI, 1.2–4.1) in IVF-ICSI twin gestations when compared with singleton IVF-ICSI gestations. There was a statistically significant heterogeneity (I2 = 91%, P<.01) in the included studies.
FIGURE 8:
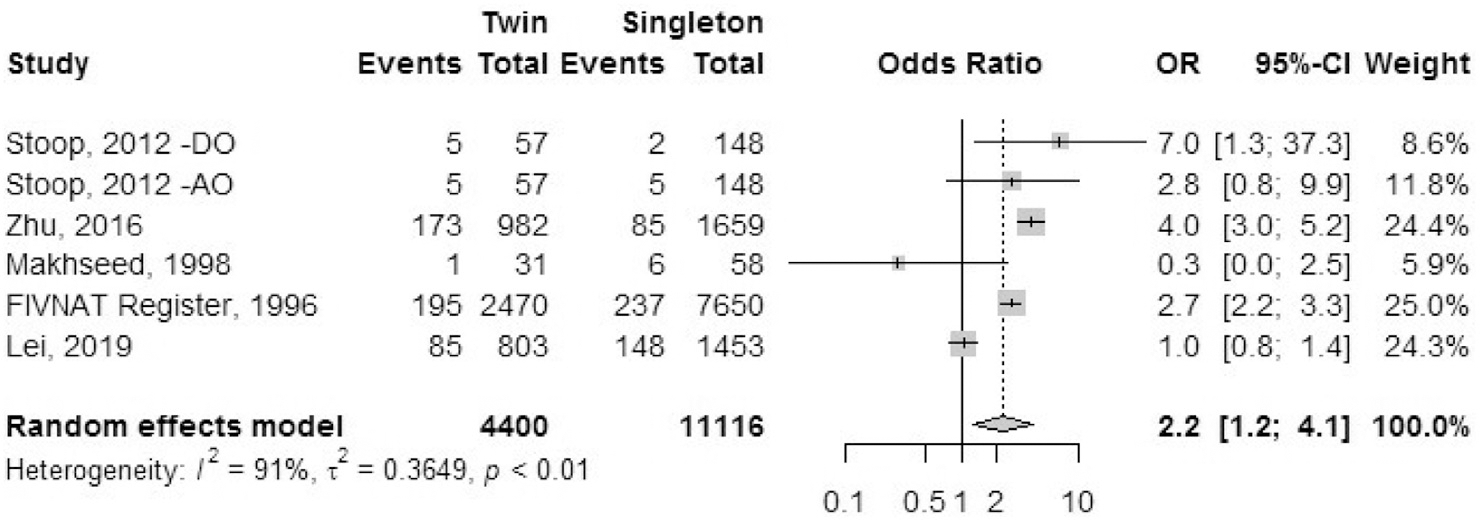
Postpartum hemorrhage.
Preterm labor.
Five cohort studies reported the outcome of preterm labor (Fig. 9). The diagnostic criteria for preterm labor were not mentioned in any of the studies. Goldfarb et al. (35) reported multiple episodes of hospital admission for some patients with preterm labor. The odds ratio of having preterm labor was 6.3 (95% CI, 3.6–11.0) in IVF-ICSI twin gestations when compared with singleton IVF-ICSI gestations. There was statistically significant heterogeneity (I2 = 91%, P<.01) in the included studies.
FIGURE 9:
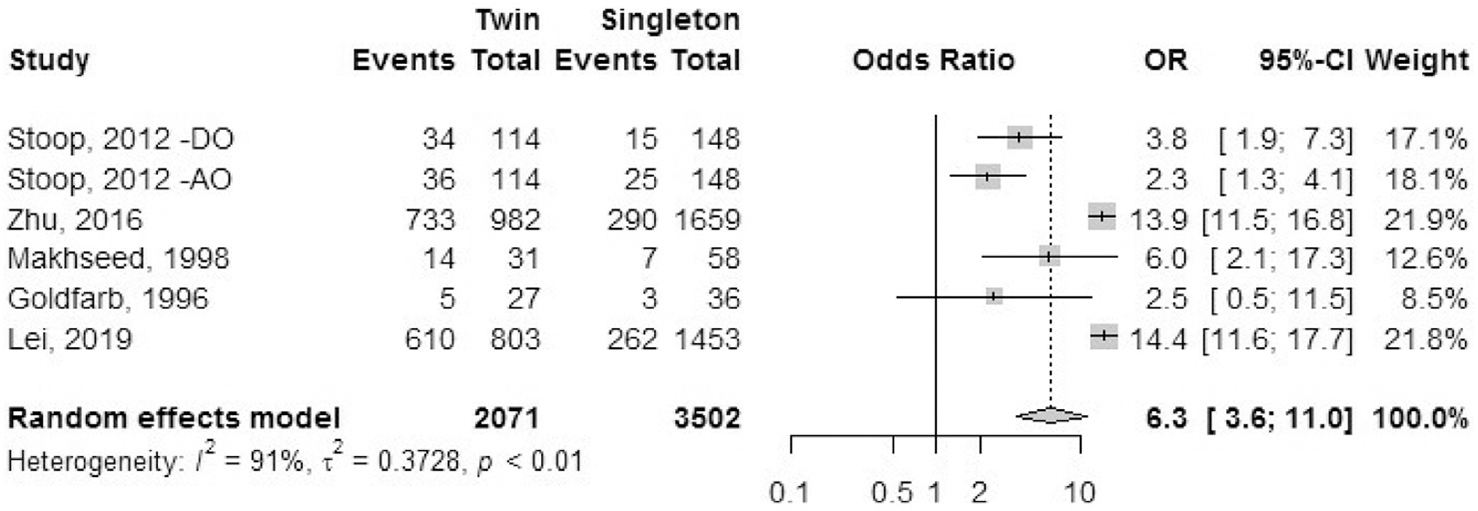
Preterm labor.
Preeclampsia.
Five cohort studies reported the outcome of preeclampsia (Fig. 10). This was defined as repeated blood pressure levels over 140/90 mm Hg with proteinuria more than 0.3 g/day after 20 weeks of gestation. The odds ratio of having preeclampsia was 1.9 (95% CI, 1.4–2.6) in IVF-ICSI twin gestations when compared with singleton IVF-ICSI gestations. There was statistically significant heterogeneity (I2 = 40%, P=.12) in the included studies.
FIGURE 10:
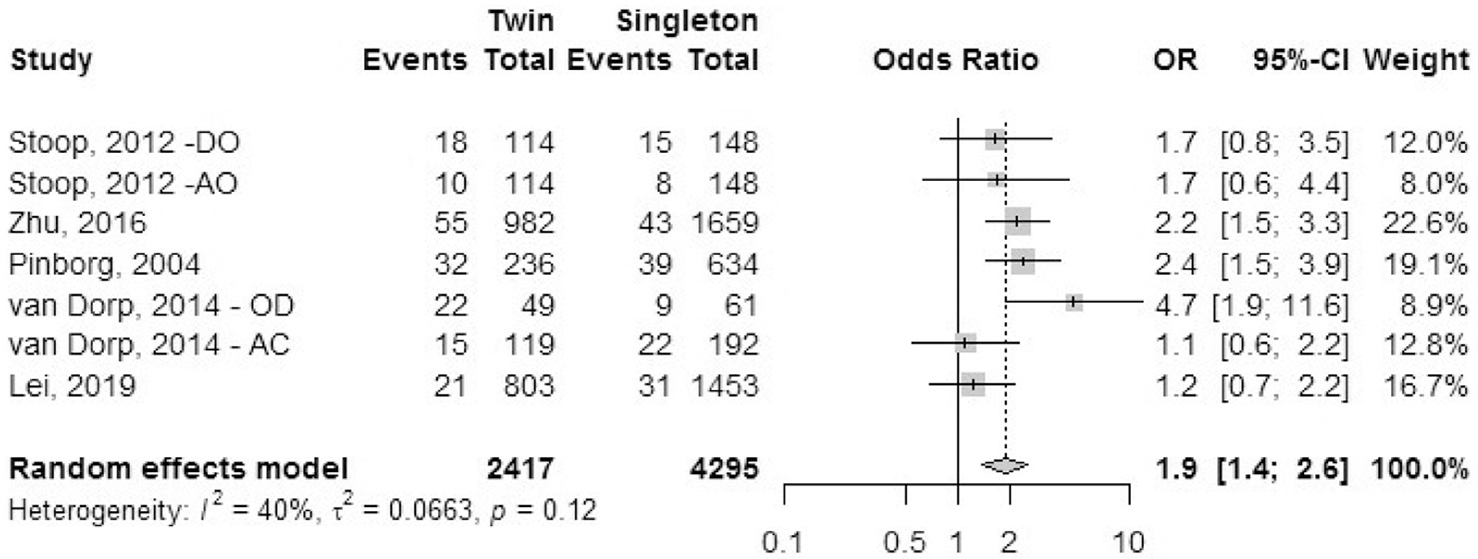
Preeclampsia.
Fetal outcomes
Fetal outcomes were assessed based on proportion of occurrence calculated per infant. See Table 4 for a summary of effect sizes and heterogeneity for each fetal and neonatal outcome.
TABLE 4.
Summary table of fetal and neonatal outcomes for effect and heterogeneity: twin compared with singleton pregnancies after in vitro fertilization/intracytoplasmic sperm injection treatment.
| Outcome | Heterogeneity, I2 % (P value) | OR (95% CI) |
|---|---|---|
| Congenital anomaly | 0 (.84) | 1.1 (1.0–1.2) |
| Preterm birth rate (<37 wk) | 97 (<.01) | 8.3 (7.8–8.9) |
| Early preterm birth rate (<32 wk) | 88 (<.01) | 3.5 (3.1–3.9) |
| Very preterm birth rate (<28 wk) | 82 (<.01) | 5.5 (5.2–5.9) |
| Low birth weight (<2,500 g) | 89 (<.01) | 10.6 (9.9–11.4) |
| NICU/SCBU admission rate | 91 (<.01) | 6.5 (5.8–7.3) |
| Perinatal mortality rate | 0 (.49) | 2.4 (2.1–2.8) |
| Stillbirth rate | 36 (.09) | 2.2 (1.8–2.6) |
| Mean birth weight (g) | 95 (<.01) | −856 (880–832)a |
| Mean gestational age (wk) | 95 (<.01) | −2.9 (−3.0 to −2.8)a |
Note: CI = confidence interval; NICU = neonatal intensive care unit; OR = odds ratio; SCBU = special care baby unit.
Mean difference (95% CI).
Congenital anomalies.
A total of 19 studies reported outcomes of congenital anomalies: eight registry studies and 11 cohort studies (Fig. 11). The majority of the non-European studies classified congenital anomalies based on the International Classification of Disease and Related Health Problems, 10th edition (ICD-10) code each malformation. Congenital anomalies or malformation included a single disorder or multiple disorders, and we combined the available primary data for this analysis. Studies from Europe reported congenital anomalies according to the European Registration of Congenital Anomalies and Twins (EUROCAT) guidelines. The odds ratio of having a congenital anomaly was 1.1 (95% CI, 1.0–1.2) in IVF-ICSI twin gestations when compared with singleton IVF-ICSI gestations. There was minimal heterogeneity (I2 = 0; P=.84) within the studies included.
FIGURE 11:
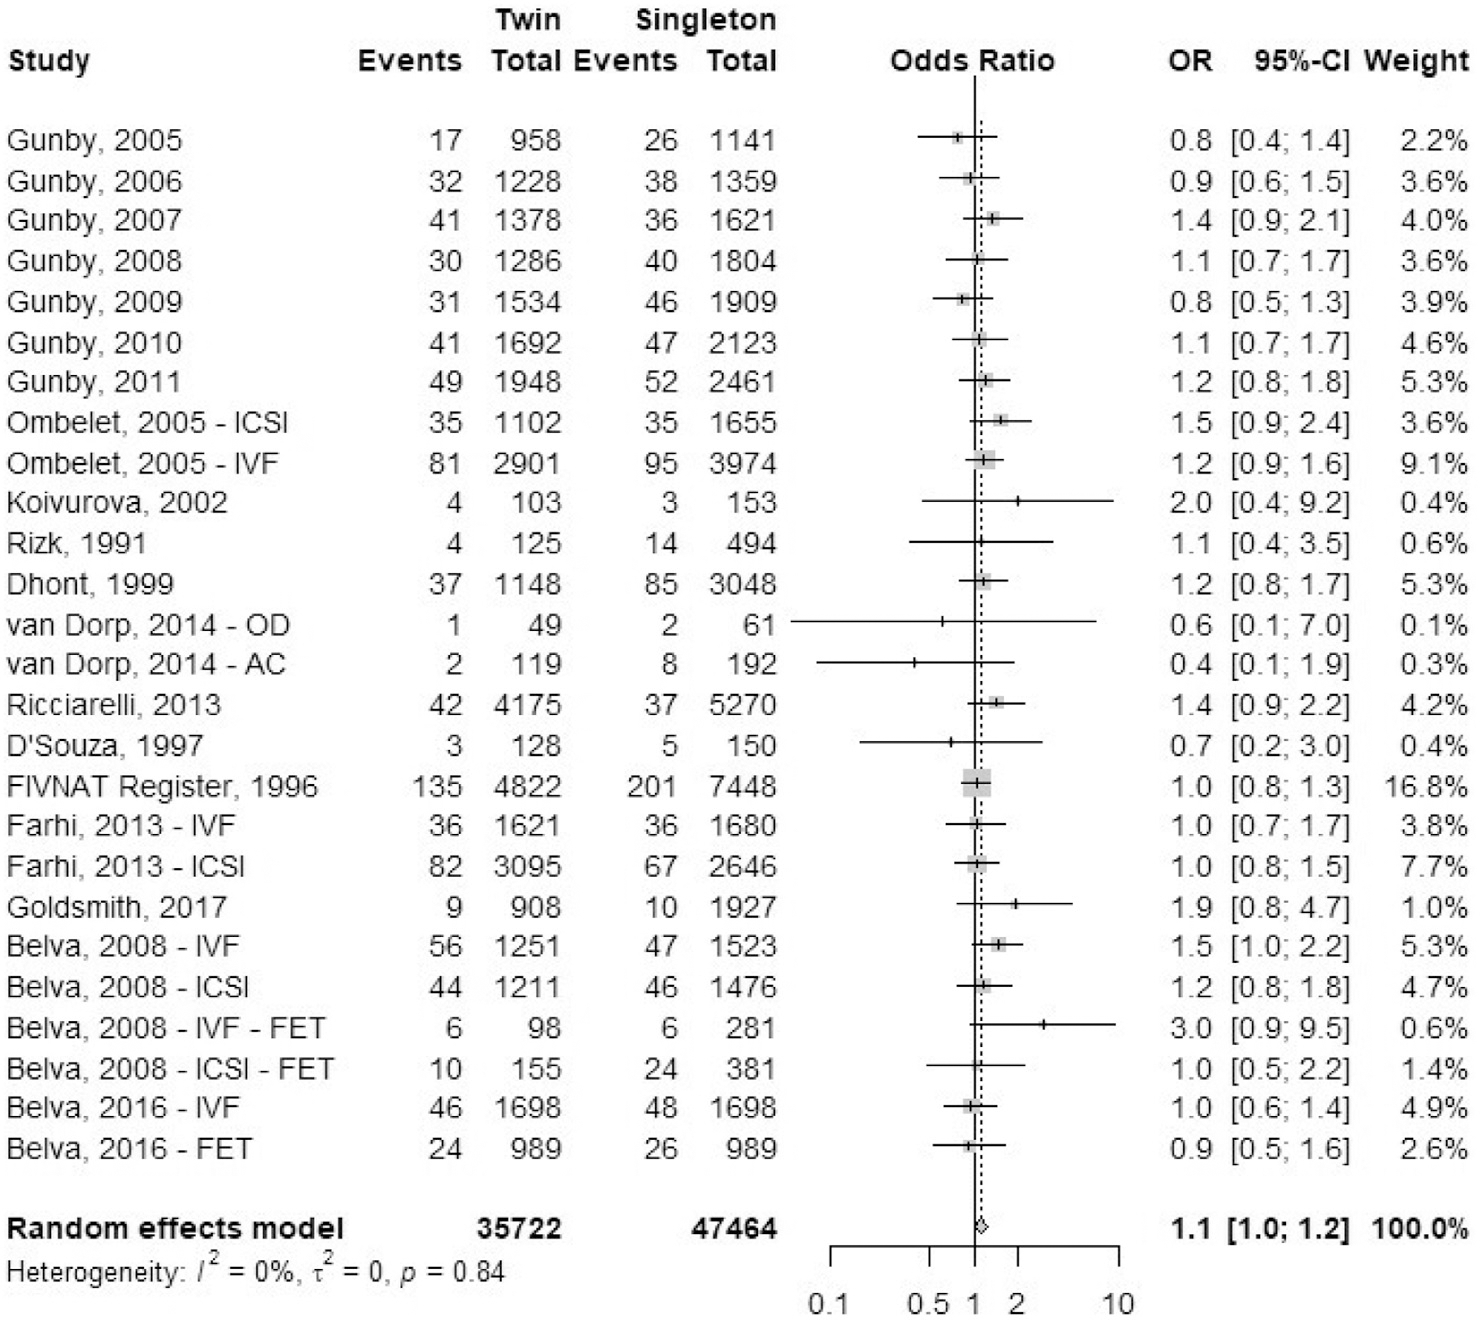
Congenital anomalies.
Preterm birth rate.
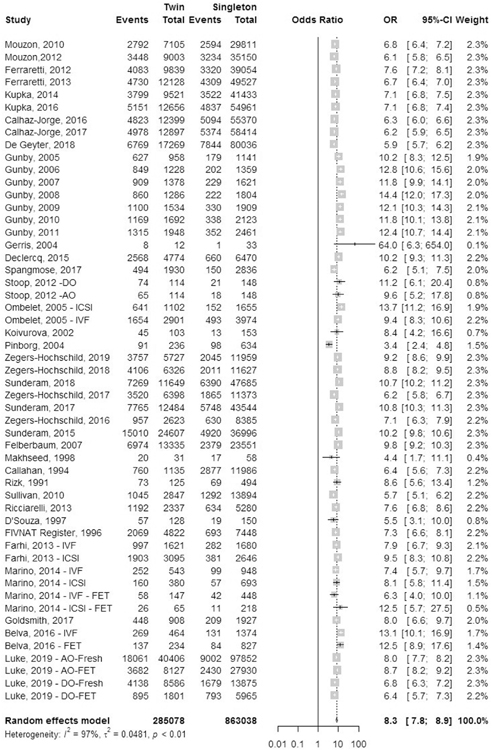
A total of 43 studies reported outcomes of preterm birth: 23 registry studies and 20 cohort studies (Fig. 12). Preterm birth was defined as delivery before 37 completed weeks of gestation. The odds ratio of preterm birth was 8.3 (95% CI, 7.8–8.9) in IVF-ICSI twin gestations when compared to singleton IVF-ICSI gestations. There was statistically significant heterogeneity (I2 = 97%, P<.01) within the studies included.
FIGURE 12:
Preterm birth rate.
Early preterm birth rate.
A total of 14 studies reported outcomes for early preterm birth (EPTB), defined as birth before 32 completed weeks of gestation, which included 13 registry studies and one cohort studies (Fig. 13). Luke et al. (38) included separate data sets for fresh and frozen autologous cycles and fresh and frozen oocyte donor treatment cycles. The odds ratio of EPTB was 3.5 (95% CI, 3.1–3.9) in IVF-ICSI twin gestations when compared with singleton IVF-ICSI gestations. There was statistically significant heterogeneity (I2 = 88%, P<.01) within the studies included.
FIGURE 13:
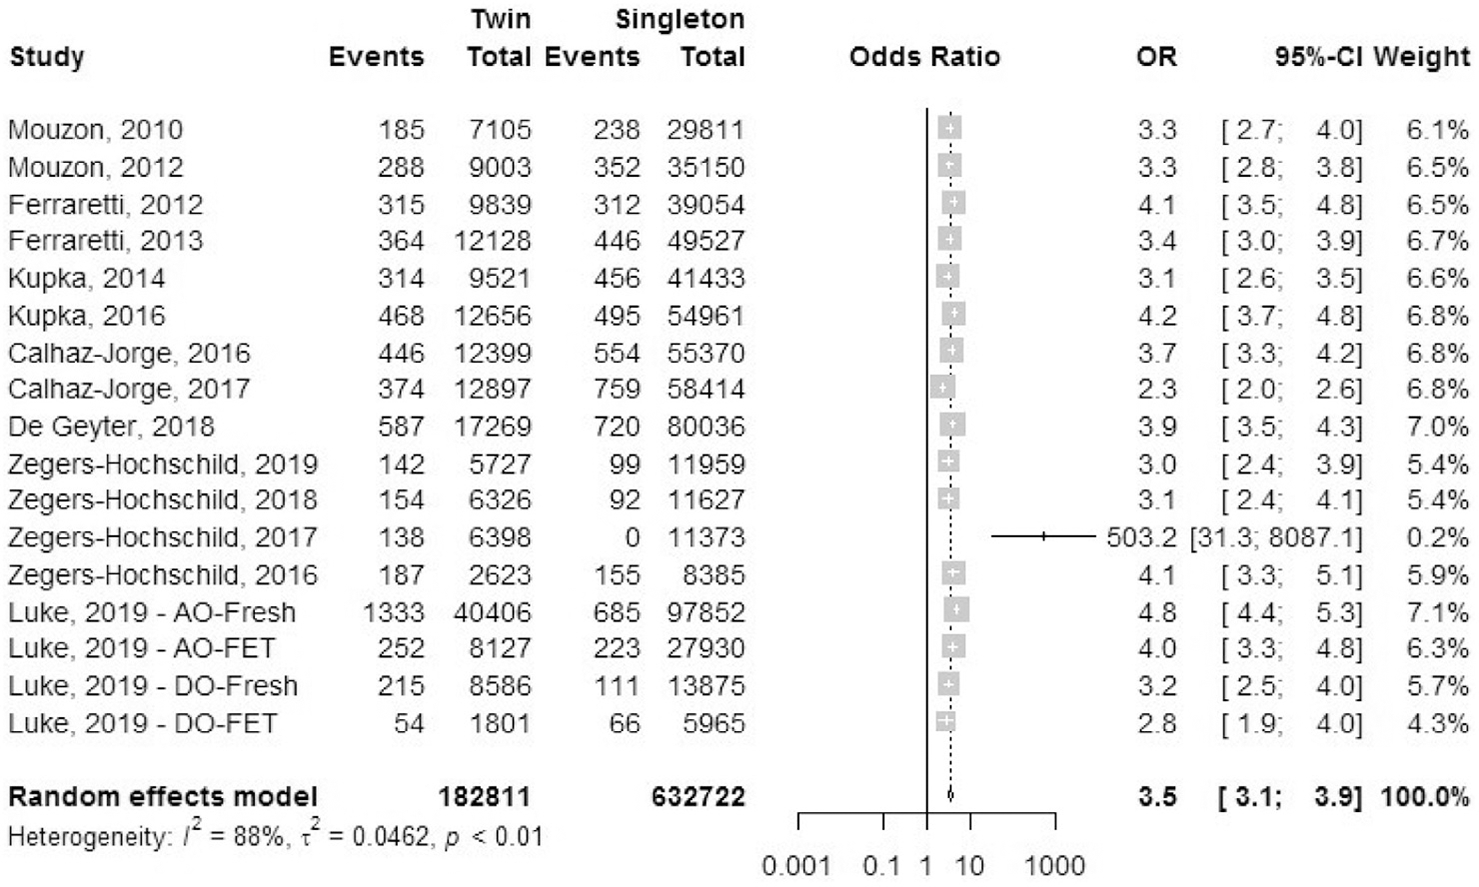
Early preterm birth rate.
Very preterm birth rate.
A total of 30 studies reported outcomes for very preterm birth rate (VPTBR), defined as birth before 28 completed weeks of gestation, which included 17 registry studies and 13 cohort studies (Fig. 14). The odds ratio of VPTBR was 5.5 (95% CI, 5.2–5.9) in IVF-ICSI twin gestations when compared with singleton IVF-ICSI gestations. There was statistically significant heterogeneity (I2 = 82%, P<.01) within the studies included.
FIGURE 14:
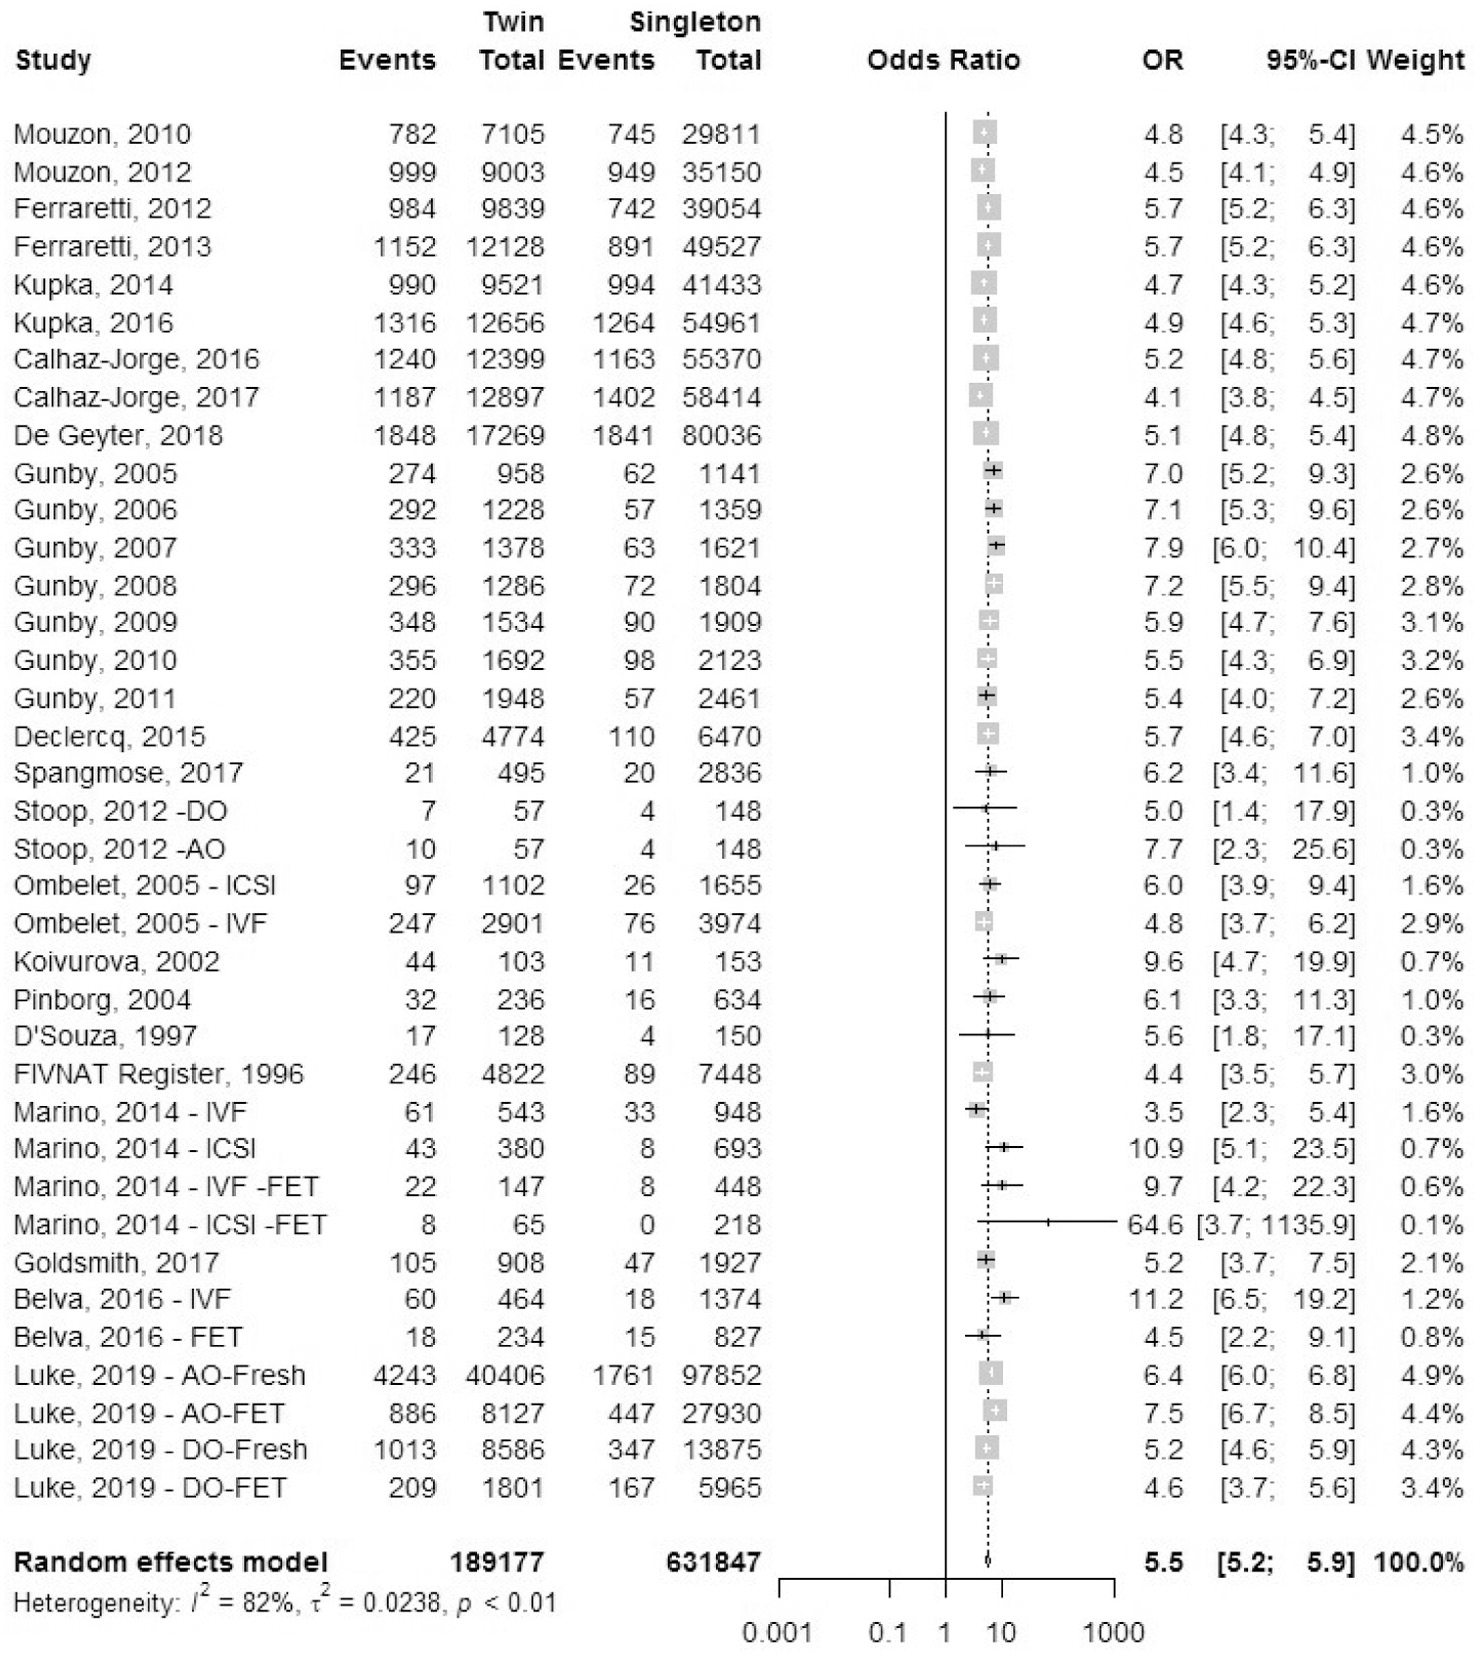
Very preterm birth rate.
Low birth weight.
A total of 29 studies reported outcomes for low birth weight (LBW), defined as birth weight <2,500 grams, which included 11 registry studies and 18 cohort studies (Fig. 15). The odds ratio of LBW was 10.6 (95% CI, 9.9–11.4) in IVF-ICSI twin gestations when compared with singleton IVF-ICSI gestations. There was statistically significant heterogeneity (I2 = 89%, P<.01) within the studies included.
FIGURE 15:
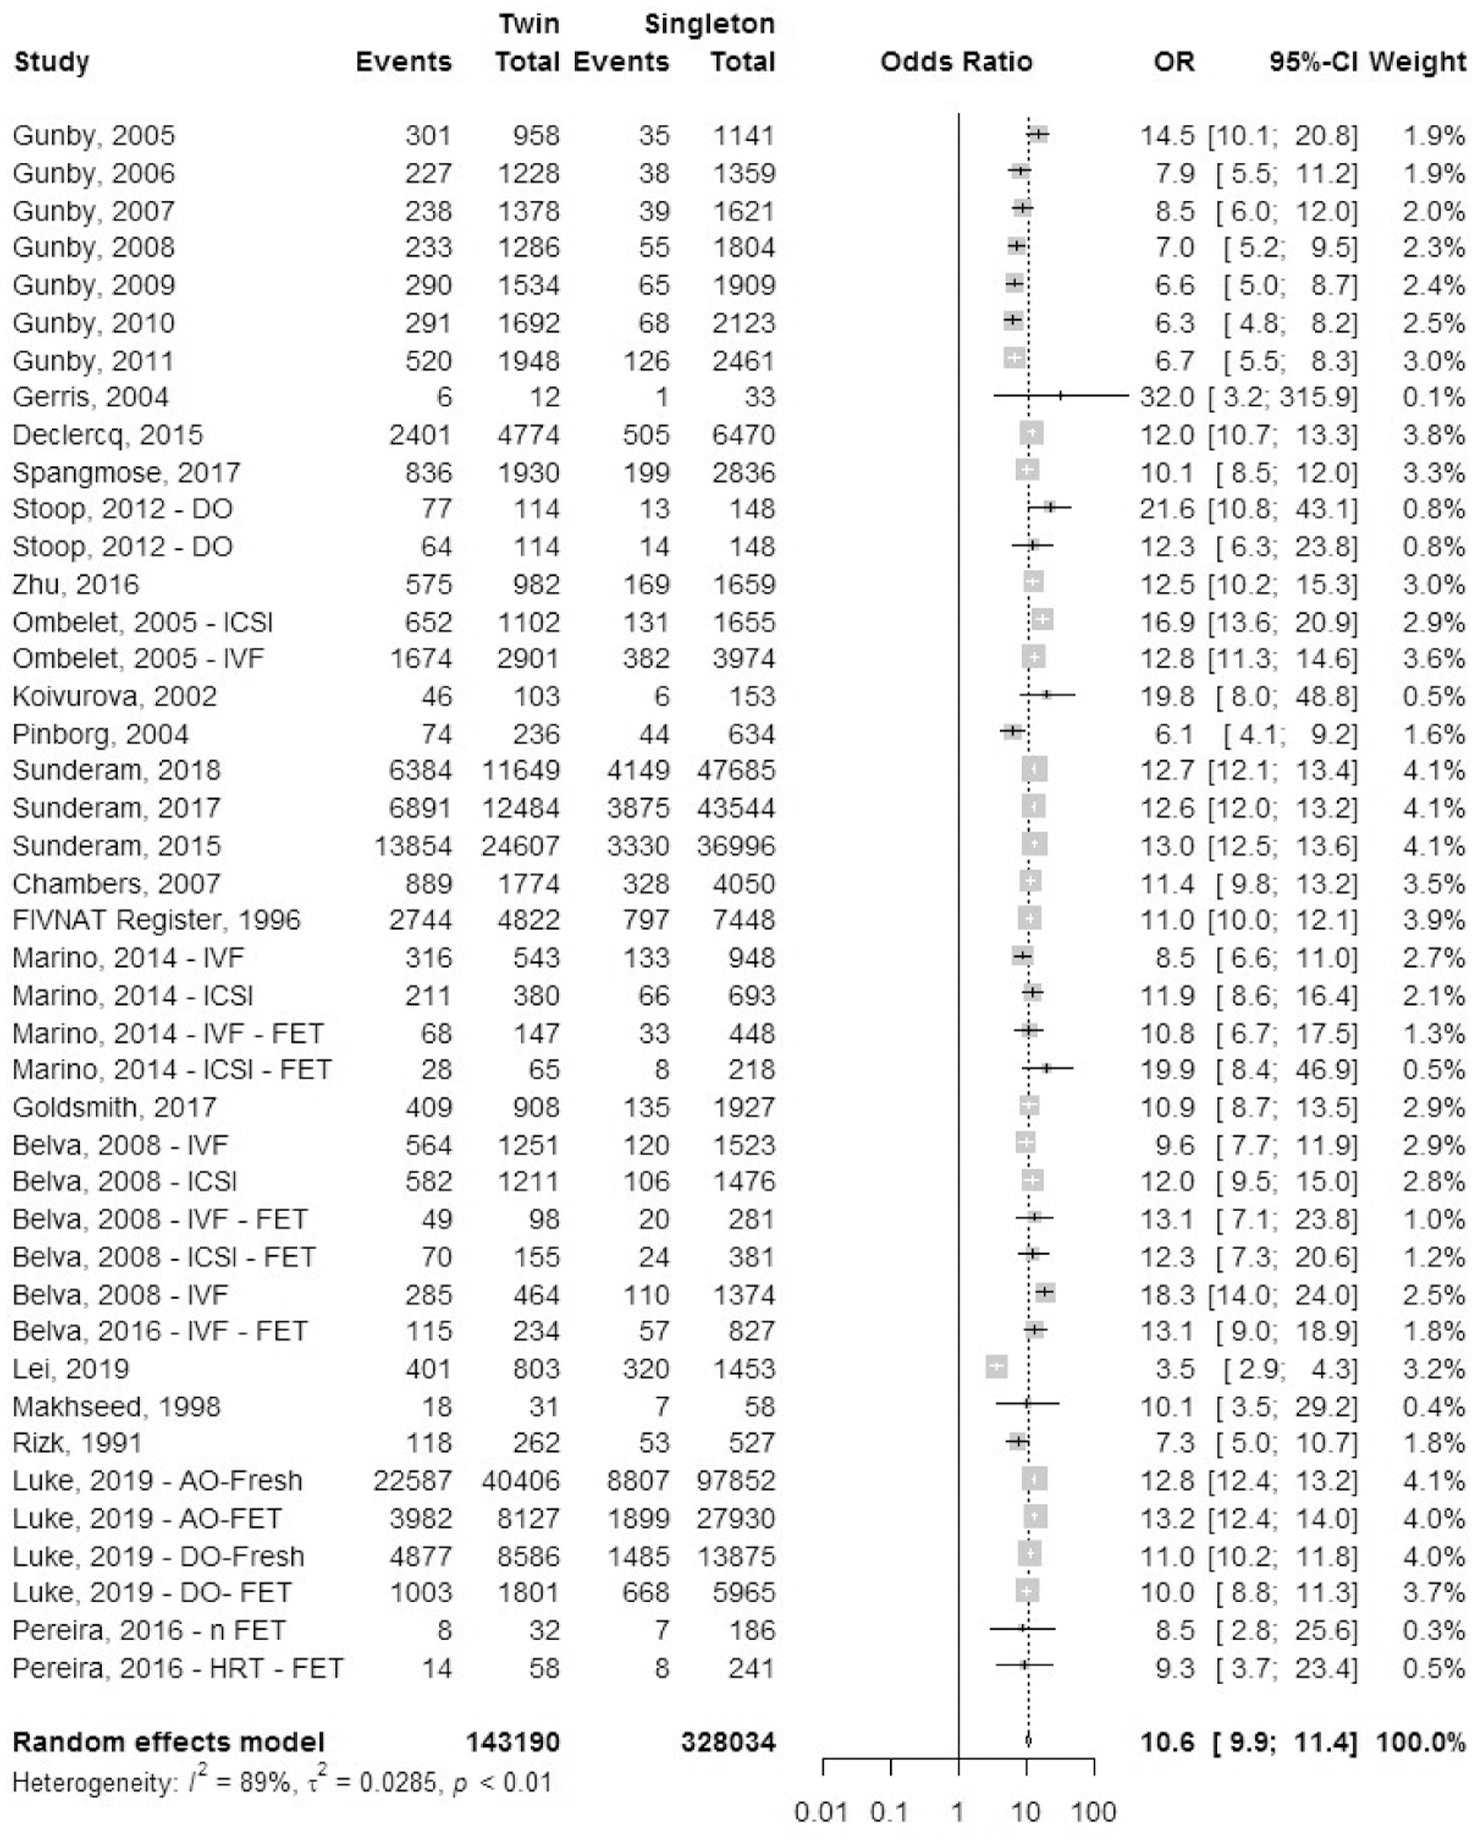
Low birth weight.
Mean birth weight.
A total of 22 studies reported mean birth weight (MBW) for infants, which included one registry study and 21 cohort studies (Fig. 16). Data for mean birth weight were collected. The mean difference in birth weight was 856 grams (± −880; −832 grams standard deviation [SD]) lower in IVF-ICSI twin gestations when compared to singleton IVF-ICSI gestation. There was statistically significant heterogeneity (I2 = 95%, P<.01) within the studies included.
FIGURE 16:
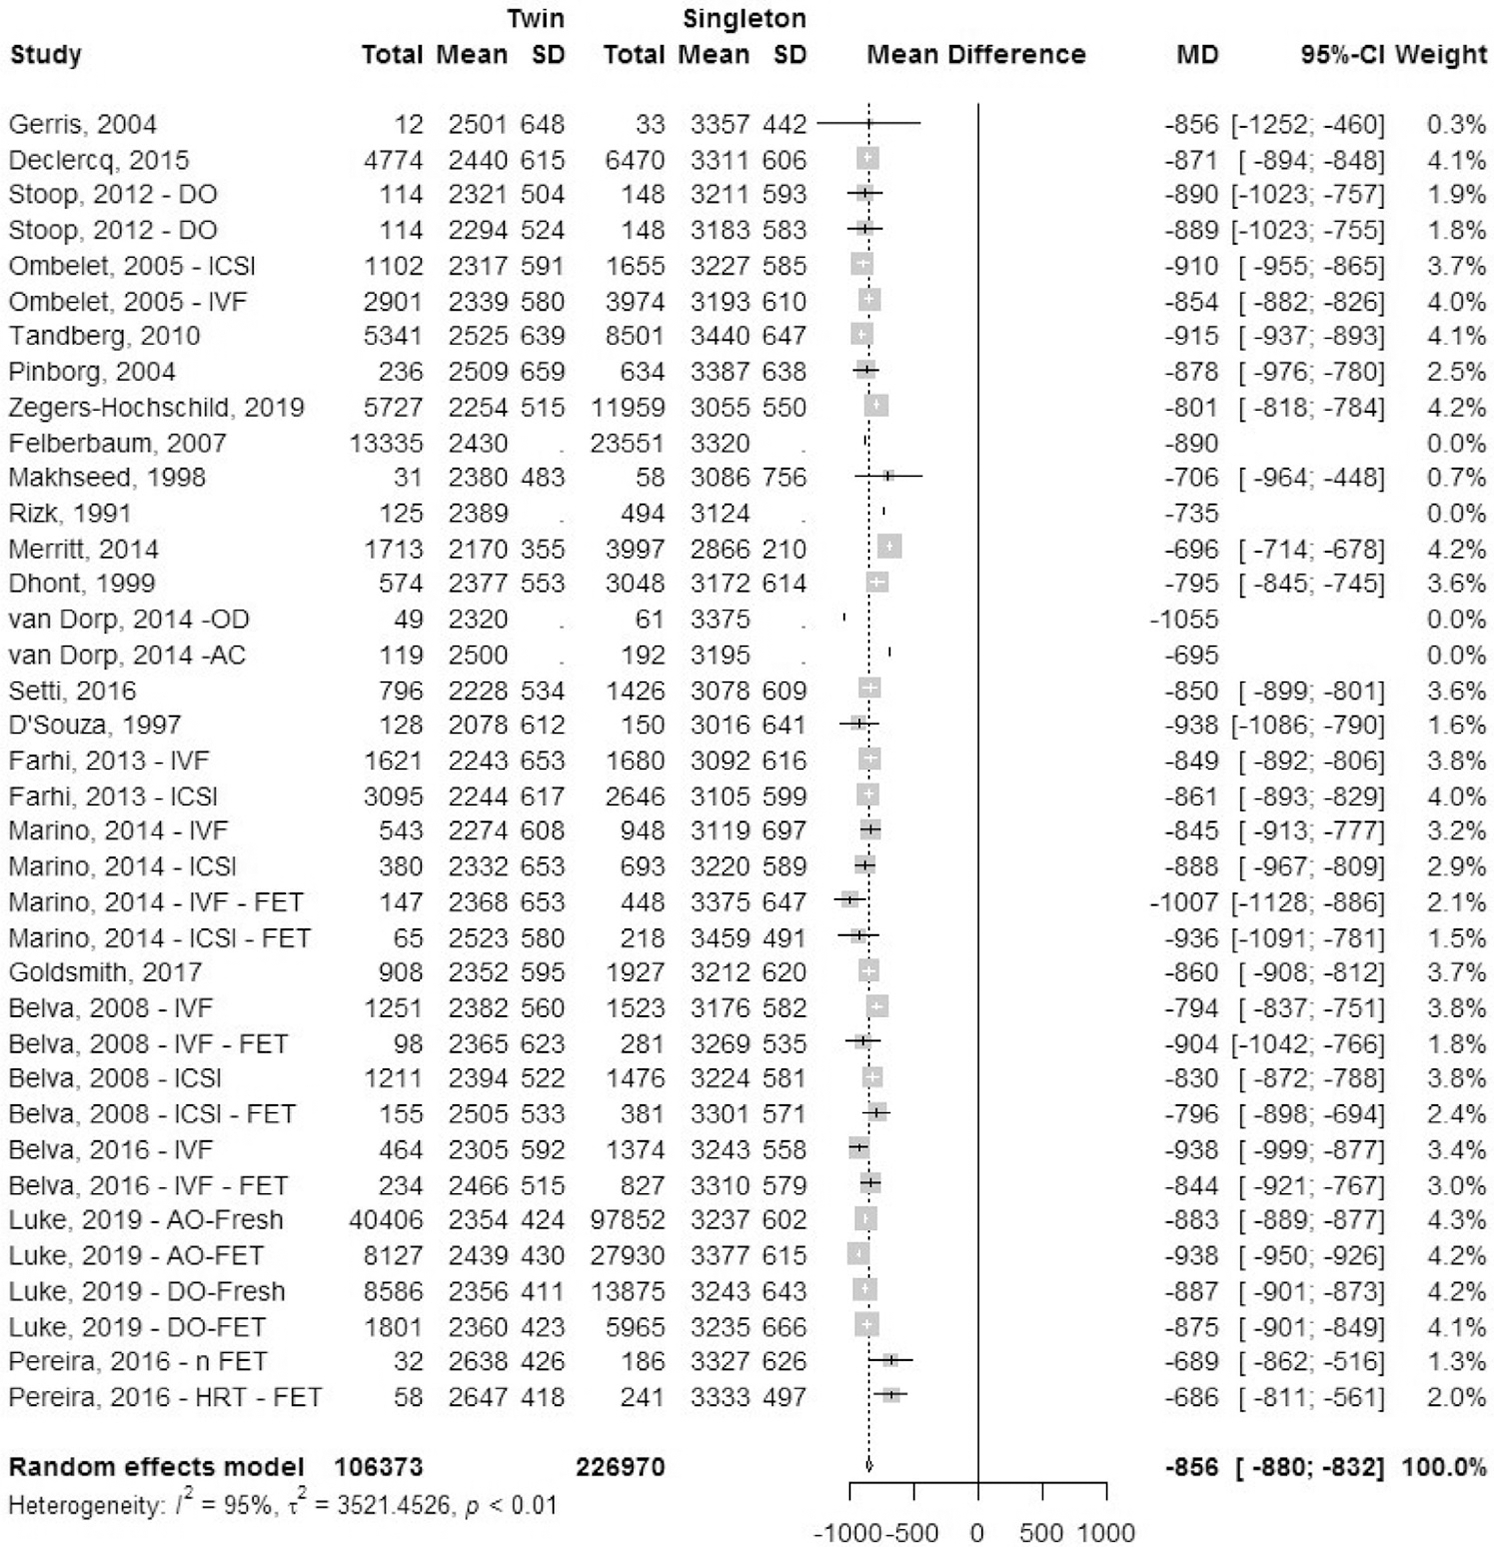
Mean birth weight.
Mean gestational age.
A total of 27 studies reported mean gestational age (MGA): 10 registry studies and 17 cohort studies (Fig. 17). Data for mean gestational age in weeks (SD) was collected. The mean difference in gestational age in weeks was 2.9 (±−3.0; −2.8 SD) lower in IVF-ICSI twin gestations when compared with singleton IVF-ICSI gestations. There was statistically significant heterogeneity (I2 = 95%, P<.01) within the studies included.
FIGURE 17:
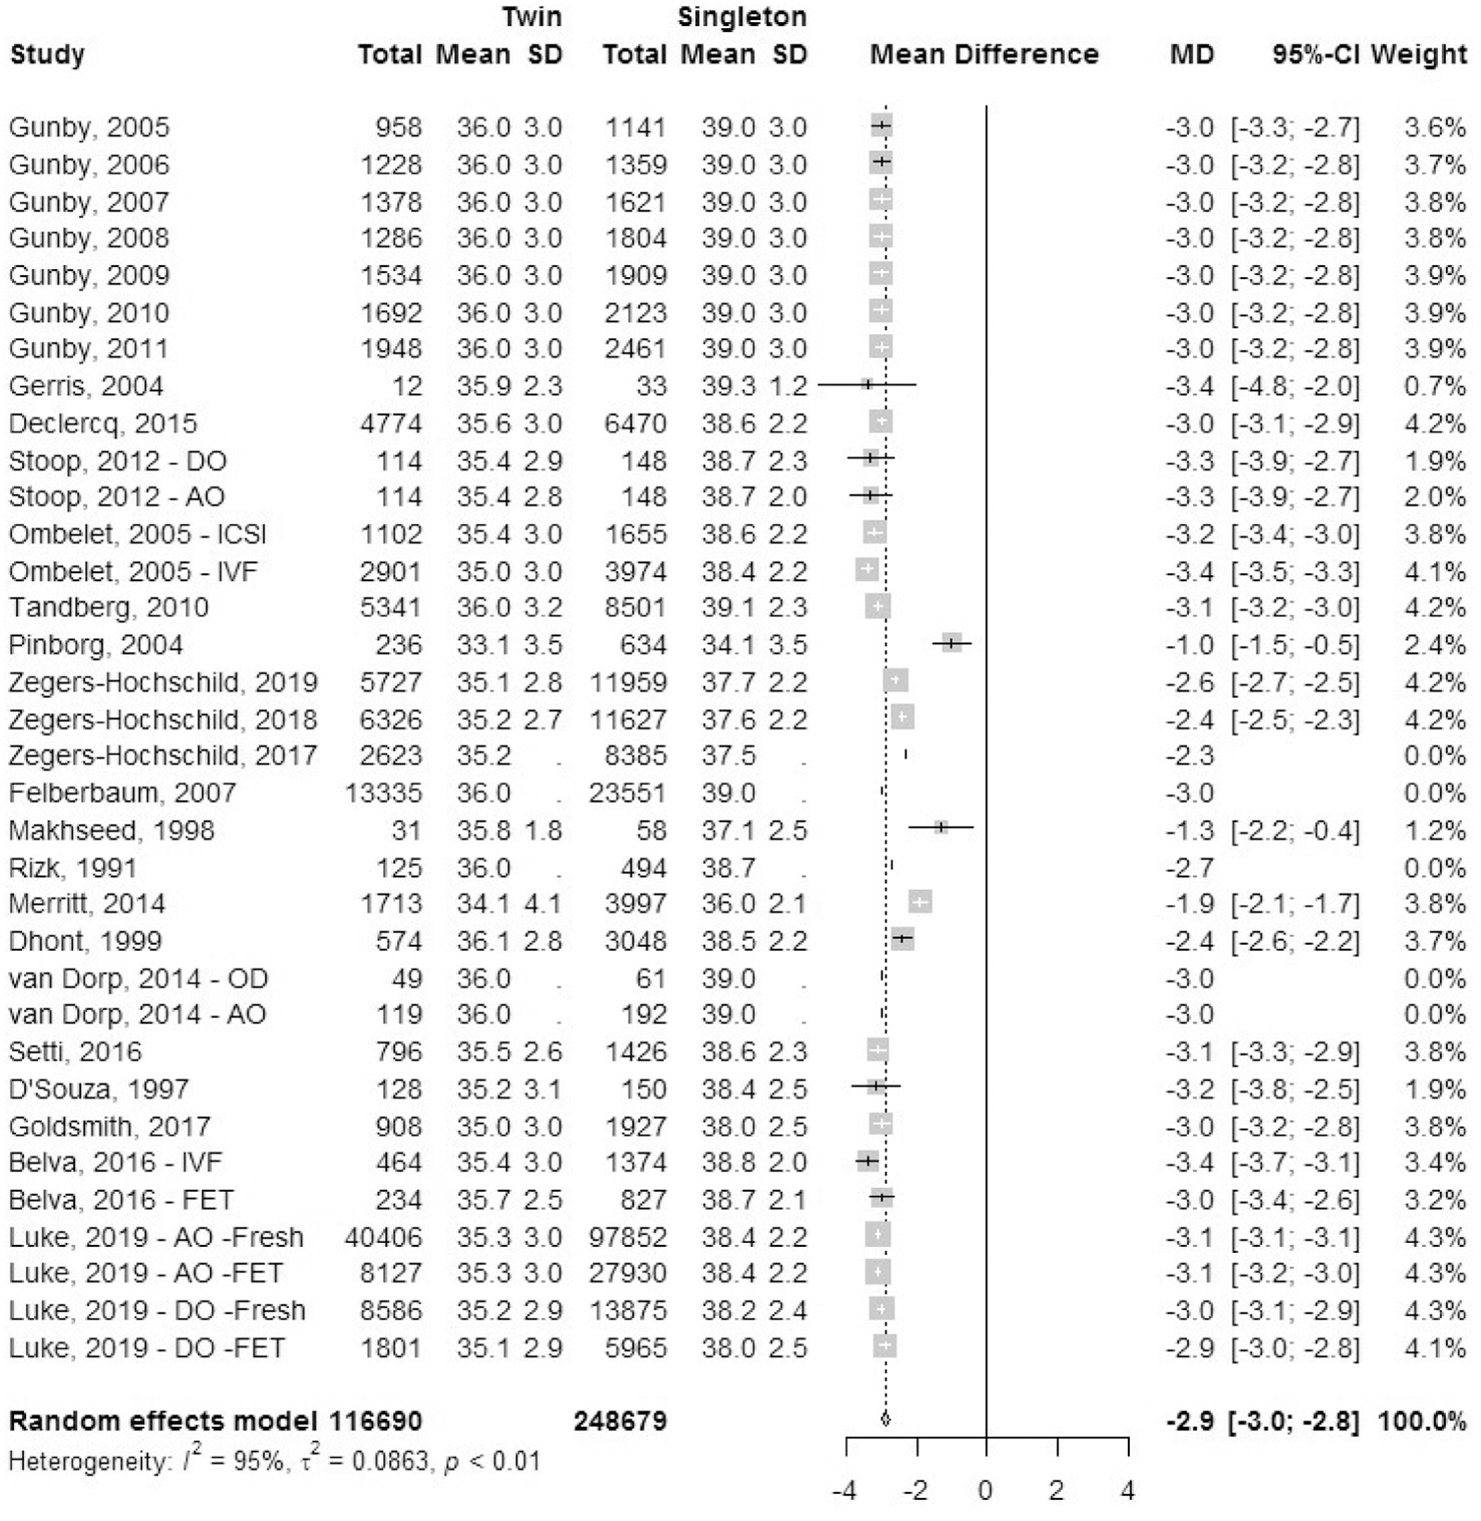
Mean gestational age.
Neonatal intensive care unit admission rate.
A total of 11 cohort studies reported outcomes for NICU/SCBU admission rate (Fig. 18). The odds ratio of NICU/SCBU admissions was 6.5 (95% CI, 5.8–7.3) in IVF-ICSI twin gestations when compared with singleton IVF-ICSI gestation. There was statistically significant heterogeneity (I2 = 91%, P<.01) within the studies included.
FIGURE 18:
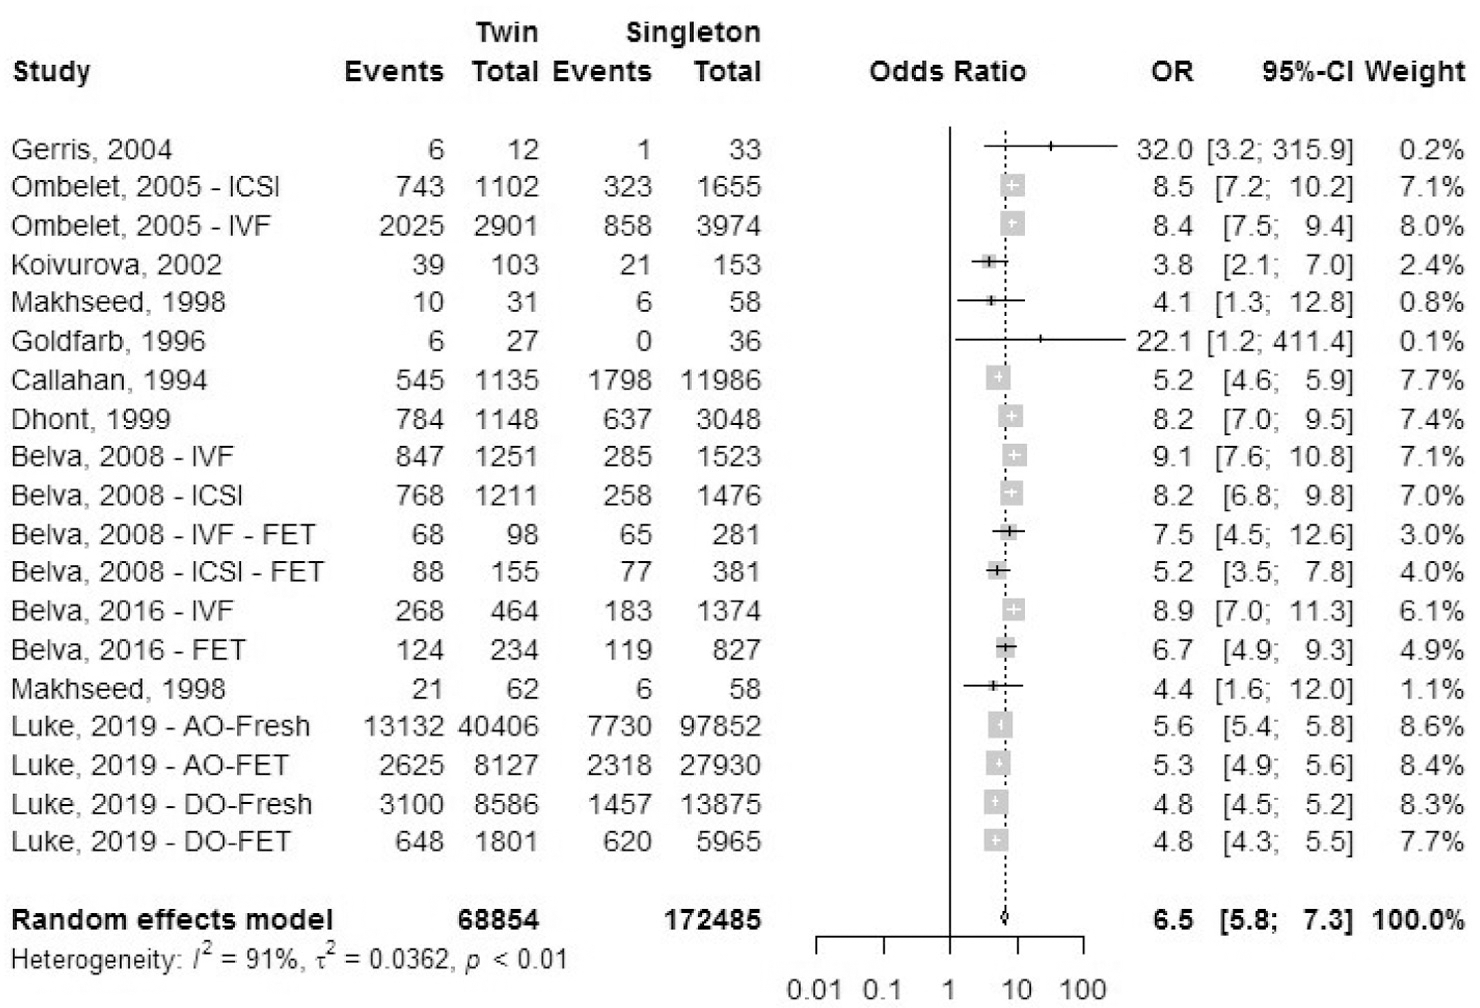
Neonatal intensive care unit admission rate.
Perinatal mortality rate.
A total of nine studies reported outcomes of perinatal mortality (PNM) rate: seven registry studies and two cohort studies (Fig. 19). Perinatal mortality data in Gunby et al. (17–23) included stillbirth and neonatal deaths whereas, Tandberg et al. (55) defined perinatal mortality as death of the fetus from ≥22 weeks until ≤7 days after birth, stillbirths included. The odds ratio of perinatal mortality was 2.4 (95% CI, 2.1–2.8) in IVF-ICSI twin gestations when compared with singleton IVF-ICSI gestations. Heterogeneity was attributed to chance (I2 = 0%, P=.49) within the studies included.
FIGURE 19:
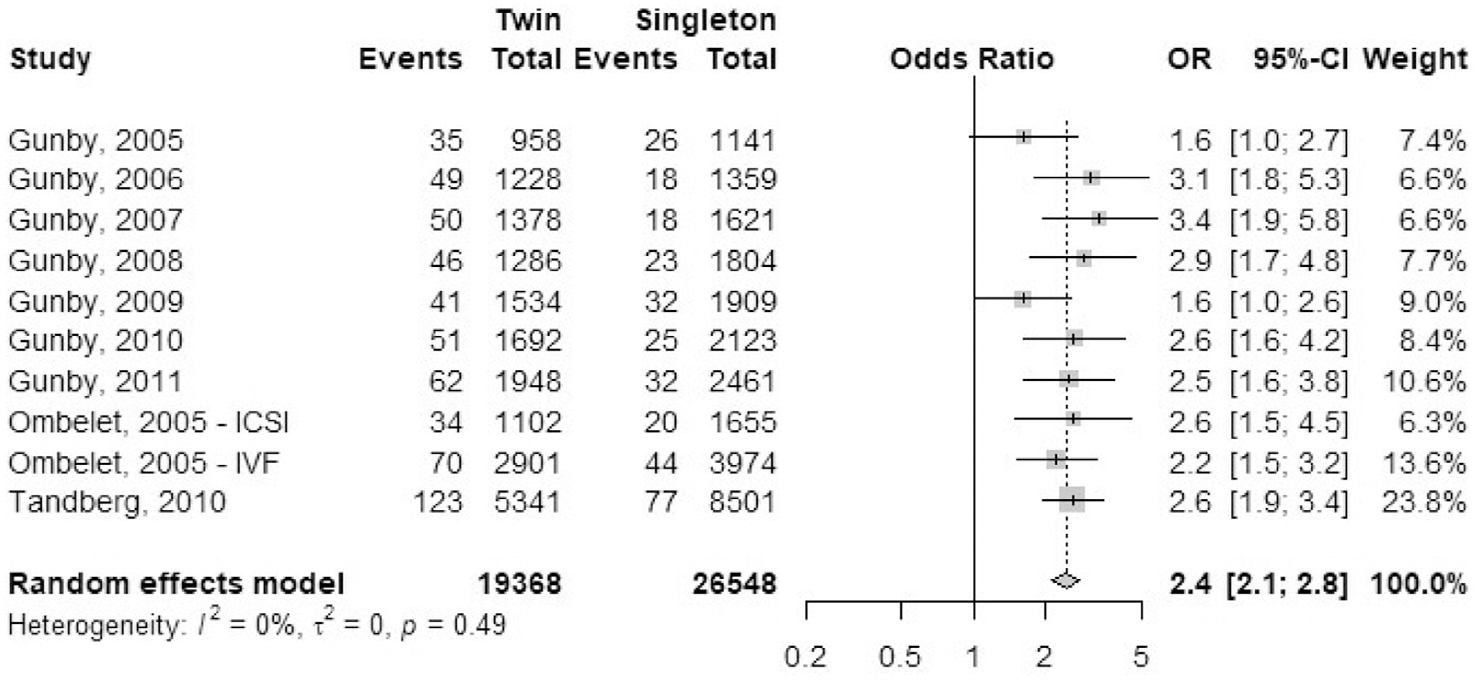
Perinatal mortality rate.
Stillbirth rate.
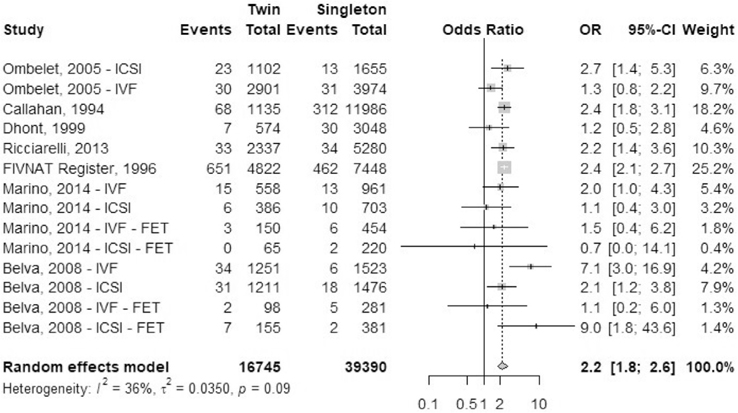
A total of eight studies reported outcomes for stillbirth rate: one registry study and seven cohort studies (Fig. 20). The odds ratio (95% CI) of stillbirth rate for at least one of the twins was 2.2(1.8–2.6) in IVF-ICSI twin gestations when compared with singleton IVF-ICSI gestation. There was minimal heterogeneity (I2 = 36%, P=.09) within the studies included.
FIGURE 20:
Stillbirth rate.
Studies included in narrative review
Studies with health care cost outcomes.
Chambers et al. (31) combined three national data sets to develop an economic costing model using birth outcomes from 2003. Data for 5,005 mothers and 5,886 live-born infants were used. After adjusting for maternal age, the average cost (combined for infant and mother) per in-patient birth episode was three times higher for birth episodes of ART twins than ART singletons (14,114 Euros vs. 4,624 Euros). It was estimated that multiple pregnancy reduction strategies would have saved 9.2 million Euros (year 2003–2004 Euros) in birth admission costs alone.
Motohashi et al. (63) performed a costs analysis of maternal and fetal medical care for triplets and higher-order multiples in Japan. The authors examined a control group that included 58 ART singletons and 21 twins born no earlier than 22 weeks of gestation. Data included maternal admissions after 12 weeks of gestation until discharge. It was estimated that the maternal costs (×1,000¥) for singletons was 530 ± 467 compared with 1,124 ± 709 in twins. Infant costs (×1,000¥) estimated from birth until discharge from hospital were 173 ± 410 for singleton infants compared with 1,889 ± 3,061 for twins (per neonate). The combined cost (×1,000¥) for a family was estimated to be 703 ± 680 for a singleton delivery compared with 4,903 ± 6,199 for a twin delivery.
Lemos et al. (65) examined adjusted all-cause health care costs for IVF-ICSI singletons and IVF-ICSI twins in a subgroup analysis. The mean cost in US$ for an IVF-ICSI singleton infant was 11,358 (95% CI, 10,959–11,772) compared with 81,757 (95% CI, 77,785–85,932) in twins. The mean cost in US$ for a mother with singleton pregnancy was 15,542 (95% CI, 15,322–15,765) compared with 33,729 (95% CI, 33,066–34,405) a mother with twins. The mean total cost in US$ for IVF-ICSI singleton pregnancy was 26,922 (95% CI, 10,959–11,772) compared with 115,238 (95% CI, 111,875–118,702) in a twin pregnancy.
Gerris et al. (41) conducted a cost analysis of single-embryo transfer versus a double-embryo transfer in women undergoing their first IVF-ICSI cycle. In women who had a double-embryo transfer, the costs were analyzed for singleton pregnancies and twin pregnancies. The total cost for antenatal care for mothers was US$ 5,160 (±4,106 SD) for a singleton pregnancy and US$ 7,477 (±3,009 SD) for twins. The total cost per infant was US$ 3,453 (±8,154 SD) for singleton infants and US$ 12,728 (±12,361 SD) for twins. Maternal hospitalization cost for delivery was US$ 4,232 (±4,244 SD) for singletons and US$ 6,814 (±3,029 SD) for twins.
Koivurova et al. (46) performed a 7-year follow-up study of IVF children and analyzed medical diagnoses associated with postneonatal hospital admissions and costs per hospital admission. The Diagnosis Related Groups (DRGS) included brain damage, central nervous system disorder, seizure and headaches, psychiatric disorders, upper respiratory infection, asthma, esophagitis, juvenile rheumatoid arthritis, and prematurity. As the hospital costs were calculated per neonate, the investigators did not find any admission-related cost differences per episode between IVF singletons and IVF twins.
A population cohort study from Western Australia evaluated hospital costs for multiple birth and singleton infants from birth through 5 years of age. In this study, 1.0% of singletons and 15.4% of twins were the result of ART. The mean hospital costs (in US$) of a singleton or twin child to age 5 years was 2,730 and 8,993, respectively (in 2009–2010 US$). Most of the cost increase was seen from birth to 1 year of age mostly due to prematurity. Higher costs for twins were also seen in the second year of life, but in years 3 to 5 the health care costs were similar.
Studies with social outcomes.
Pinborg et al. (40) conducted a national survey using a questionnaire-based study and found that 87.3% of mothers with IVF-ICSI twin were on sick leave compared with 50.1% of mothers with singletons. Sick leave was defined as leave of absence from work owing to illness except for obligatory maternity leave. Mothers with IVF-ICSI twins spend an average of 10.7 weeks on sick leave compared to 8.5 weeks for mothers with singletons (P<.001). The odds ratio for sick leave stratified for maternal age and parity for IVF-ICSI twins versus IVF-ICSI singleton was 6.8 (95% CI, 4.4–10.5).
Olivennes et al. (66) studied in behavioral and cognitive functioning as well as family functioning in 344 families with IVF-ICSI twins compared with 344 families with IVF-ICSI singletons, all between the ages of 2 and 5 years. Using standardized questionnaires and screening tests, they found that mothers of twins showed statistically significantly higher levels of parenting stress and depression than mothers of singletons, and they found parenting to be more difficult and less pleasurable. Frequency of sexual intercourse was also less among couples with twins. In the children there were no differences in emotional or behavioral issues although twins showed statistically significantly lower levels of cognitive functioning.
DISCUSSION
This up-to-date review and meta-analysis comparing maternal, fetal, and societal outcomes for twin pregnancy and singleton pregnancy after IVF-ICSI demonstrates clear evidence for the adverse effects of twin pregnancies. With twin pregnancies, the higher maternal risks, the greatly increased risk of premature delivery for infants, and the higher health care costs that result are consistent among studies throughout the world. The data are compelling that a strategy of one healthy baby at a time should be the objective of every IVF-ICSI treatment cycle.
For women with a twin pregnancy after IVF-ICSI, the most statistically significant risks are higher rates of antenatal hospitalization, preterm labor, need for cesarean delivery, and postpartum hemorrhage. Compared with a singleton pregnancy, twin pregnancies are at higher risk for other complications including gestational diabetes, hypertensive disorders, and placental abruption. Although these latter complications are statistically significantly higher in a given pregnancy event, with odds ratios of less than 2.0 one could argue that a woman who desires at least two children from IVF-ICSI might incur similar risks with two singletons as with a twin pregnancy. We found limited evidence that women with twin gestations required more hospitalizations and more time away from work, and experienced greater stress, more depressive symptoms, and less satisfaction with parenting than mothers of singletons, at least while their children are very young.
Twins after IVF-ICSI are at statistically significantly higher risk for premature delivery, on average 2.9 weeks earlier than singletons leading to a lower average birth weight of 850 grams. For twins, the odds of very preterm birth less than 28 weeks are increased over fivefold and the risk of needing newborn intensive care after delivery is increased over sixfold compared with singletons. The odds of stillbirth and the perinatal mortality rate of twin gestations/newborns are over twofold higher than with singletons.
Health care cost studies have consistently shown that twins after IVF-ICSI are statistically significantly more costly to the health care system than a singleton. Studies that differed by country of origin, currency, time frame, and cost were included in the analysis, which precluded direct comparisons by meta-analysis. Nevertheless, the studies consistently found a twin pregnancy and delivery to be approximately 4.5-fold (range: 2.9- to 6.9-fold) more costly than a singleton pregnancy and delivery. When calculated on a per-baby basis, a twin infant is associated with an approximately 2.5-fold (range: 1.45- to 3.6-fold) increase in health care costs as compared with a singleton.
More studies comparing the early childhood health and development of IVF-ICSI twins compared with singletons are needed. There are limited data of some delay in early childhood growth and development in twins, but the limited data on academic achievement beyond childhood are reassuring.
Spangmose et al. (60) assessed academic performance in a Danish cohort of IVF singletons and IVF twins and concluded that the ART singletons and twins had similarly adjusted mean test scores for Danish, English, and mathematics. Nakajo et al. (67) assessed mental and physical development for 2 years after birth in IVF-ICSI singletons and twins and found no difference in mean physical growth (height and weight) between IVF-ICSI singletons and IVF-ICSI twins. There was also no difference in development related to movements, reactions, and understanding commands (67).
Kuiper et al. (68) studied neurodevelopmental and cardiometabolic outcomes in 4-year-old twins (n = 48) and singletons (n = 103) conceived by IVF. The investigators found similar neurologic outcomes although the total IQ score in twins was slightly lower (−5.4 points) than in singletons. The IVF twins had a lower body weight and were shorter than the singletons, but all other developmental and cardiometabolic parameters were similar (68). Strömberg et al. (69), in a cohort study included children born after IVF aged 18 months or older, and found a 0.7% incidence of cerebral palsy in IVF twins compared with 0.37% in IVF singletons. The increased incidence of cerebral palsy in twins, however, was attributed to low birth weight and prematurity (69).
The limitations of our study includes the inherent limitations of a review of observational studies. The included studies had many fundamental differences, including their retrospective design and nonstandardized data collection. There also were differences in study design and the definition of study variables. Maternal morbidity depends on non-modifiable factors such as age and modifiable factors like body mass index. Fetal morbidity and mortality may be associated with different demographic variables and the cause of infertility in the couple. Studies included in our review did not report outcomes based on maternal age or cause of infertility. This limitation in data collection did not allow us to perform adjustment of confounding factors such as maternal age, sociodemographic aspects, infertility diagnosis, specifics of IVF treatment protocols, embryo quality, or embryo culture media. However, assessment of maternal and fetal outcomes in oocyte recipient models suggest suboptimal outcomes in twin pregnancies compared with singleton pregnancies. Based on this, we may assume that it is the plurality of pregnancy rather than maternal age that causes suboptimal maternal and fetal outcomes.
Only clinically relevant maternal and fetal outcomes were assessed within the scope of this review. Some manuscripts included in this study contained data for cholestasis during pregnancy, nausea/vomiting, and/or hyperemesis gravidarum. We did not include these subjective symptoms associated with most pregnancies. Further, registry studies had the disadvantage of underreporting (e.g., approximately 7% of clinics in the United States did not report outcome data to SART in 2015). Multiple cohort studies had a smaller sample size and other biases, including treatment bias (the mixed-model of obstetric care: private and state funded health care system), reporting bias, and ascertainment bias. We performed metanalysis of proportions and mean differences when possible for applicable variables in these different studies; nevertheless, there is substantial heterogeneity between studies pooled in the meta-analyses. Finally, this is a descriptive review based on crude outcomes (i.e., outcomes were not based on comparing the intervention of a single-embryo transfer versus a double- or multiple-embryo transfer).
Notwithstanding the limitations, the large number of studies, number of events included in the registry studies, and narrow confidence intervals support the validity of the conclusions in this review. It is imperative that professionals who are working to help patients with infertility build healthy families understand the short- and long-term impacts of their treatment practices. These potentially life-changing impacts are felt by colleagues in obstetrics and pediatrics, by hospital systems and insurers, and most importantly by the patients and their families. To mitigate these risks, work at the level of quality assurance, advocacy, policy and practice change, and patient education must continue.
Supplementary Material
Acknowledgments
Supported in part by the University of Iowa Institute for Clinical and Translational Science, which receives Clinical and Translational Science Award funds from the National Institutes of Health (UL1TR002537).
Footnotes
A.E. has nothing to disclose. G.L.R. has nothing to disclose. P.T. has nothing to disclose. B.J.V. has nothing to disclose.
Discuss: You can discuss this article with its authors and other readers at https://www.fertstertdialog.com/users/16110-fertility-and-sterility/posts/30602
REFERENCES
- 1.ESHRE Capri Workshop Group. Multiple gestation pregnancy. Hum Reprod 2000;15:1856–64. [PubMed] [Google Scholar]
- 2.Whitford HM, Wallis SK, Dowswell T, West HM, Renfrew MJ. Breastfeeding education and support for women with twins or higher order multiples. Cochrane Database Syst Rev 2017;2:CD012003. [DOI] [PMC free article] [PubMed] [Google Scholar]
- 3.Hamilton BE, Martin JA, Osterman MJK, Curtin SC, Mathews TJ. Births: Final data for 2014. National Vital Statistics Reports; vol 64 no 12. Hyattsville, MD: National Center for Health Statistics. 2015. Available from: https://www.cdc.gov/nchs/data/nvsr/nvsr64/nvsr64_12.pdf. Centers for Disease Control and Prevention – National Center for Health Statistics. Accessed April 28, 2020. [PubMed] [Google Scholar]
- 4.Kulkarni AD, Jamieson DJ, Jones HW Jr, Kissin DM, Gallo MF, Macaluso M, Adashi EY. Fertility treatments and multiple births in the United States. N Engl J Med 2013;369:2218–25. [DOI] [PubMed] [Google Scholar]
- 5.Kissin DM, Kulkarni AD, Kushnir VA, Jamieson DJ. National ART Surveillance System Group. Number of embryos transferred after in vitro fertilization and good perinatal outcome. Obstet Gynecol 2014;123:239–47. [DOI] [PMC free article] [PubMed] [Google Scholar]
- 6.Kissin DM, Kulkarni AD, Mneimneh A, Warner L, Boulet SL, Crawford S, Jamieson DJ. National ART Surveillance System (NASS) Group. Embryo transfer practices and multiple births resulting from assisted reproductive technology: an opportunity for prevention. Fertil Steril 2015;103:954–61. [DOI] [PMC free article] [PubMed] [Google Scholar]
- 7.https://www.sartcorsonline.com/rptCSR_PublicMultYear.aspx?reportingYear=2018 (2018. preliminary data). Accessed April 28, 2020.
- 8.De Mouzon J, Goossens V, Bhattacharya S, Castilla JA, Ferraretti AP, Korsak V, et al. European IVF-Monitoring (EIM) Consortium, for the European Society of Human Reproduction and Embryology (ESHRE). Assisted reproductive technology in Europe, 2006: results generated from European registers by ESHRE. Hum Reprod 2010;25:1851–62. [DOI] [PubMed] [Google Scholar]
- 9.De Mouzon J, Goossens V, Bhattacharya S, Castilla JA, Ferraretti AP, Korsak V, et al. European IVF-Monitoring (EIM); Consortium for the European Society on Human Reproduction and Embryology (ESHRE). Assisted reproductive technology in Europe, 2007: results generated from European registers by ESHRE. Hum Reprod 2012;27:954–66. [DOI] [PMC free article] [PubMed] [Google Scholar]
- 10.Ferraretti AP, Goossens V, de Mouzon J, Bhattacharya S, Castilla JA, Korsak V, et al. European IVF-Monitoring (EIM), Consortium, for the European Society of Human Reproduction and Embryology (ESHRE). Assisted reproductive technology in Europe, 2008: results generated from European registers by ESHRE. Hum Reprod 2012;27:2571–84. [DOI] [PubMed] [Google Scholar]
- 11.Ferraretti AP, Ferraretti V, Goossens M, Kupka S, Bhattacharya J, de Mouzon JA, et al. European IVF-monitoring (EIM), Consortium, for the European Society of Human Reproduction and Embryology (ESHRE). Assisted reproductive technology in Europe, 2009: results generated from European registers by ESHRE. Hum Reprod 2013;28:2318–31. [DOI] [PubMed] [Google Scholar]
- 12.Kupka MS, Ferraretti AP, de Mouzon J, Erb K, D’Hooghe T, Castilla JA, et al. European IVF-Monitoring (EIM). Assisted reproductive technology in Europe, 2010: results generated from European registers by ESHRE. Hum Reprod 2014;29:2099–113. [DOI] [PubMed] [Google Scholar]
- 13.Kupka MS, D’Hooghe T, Ferraretti AP, de Mouzon J, Erb K, Castilla JA, et al. European IVF-Monitoring Consortium (EIM), for the European Society of Human Reproduction and Embryology (ESHRE). Assisted reproductive technology in Europe, 2011: results generated from European registers by ESHRE. Hum Reprod 2016;31:233–48. [DOI] [PubMed] [Google Scholar]
- 14.Calhaz-Jorge C, de Geyter C, Kupka MS, de Mouzon J, Erb K, Mocanu E, et al. European IVF-Monitoring Consortium (EIM) for the European Society of Human Reproduction and Embryology (ESHRE). Assisted reproductive technology in Europe, 2012: results generated from European registers by ESHRE. Hum Reprod 2016;31:1638–52. [DOI] [PubMed] [Google Scholar]
- 15.Calhaz-Jorge C, De Geyter C, Kupka MS, de Mouzon J, Erb K, Mocanu E, et al. European Society of Human Reproduction and Embryology (ESHRE). Assisted reproductive technology in Europe, 2013: results generated from European registers by ESHRE. Hum Reprod 2017;32:1957–73. [DOI] [PubMed] [Google Scholar]
- 16.De Geyter Ch, Calhaz-Jorge C, Kupka MS, Wyns C, Mocanu E, Motrenko T, et al. European IVF-Monitoring Consortium (EIM) for the European Society of Human Reproduction and Embryology (ESHRE). ART in Europe, 2014: results generated from European registries by ESHRE: the European IVF-monitoring Consortium (EIM) for the European Society of Human Reproduction and Embryology (ESHRE). Hum Reprod 2018;33:1586–601. [DOI] [PubMed] [Google Scholar]
- 17.Gunby J, Daya S. IVF Directors Group of the Canadian Fertility and Andrology Society. Assisted reproductive technologies (ART) in Canada: 2001 results from the Canadian ART Register. Fertil Steril 2005;84:590–9. [DOI] [PubMed] [Google Scholar]
- 18.Gunby J, Daya S. IVF Directors Group of the Canadian Fertility and Andrology Society. Assisted reproductive technologies (ART) in Canada: 2002 results from the Canadian ART Register. Fertil Steril 2006;86:1356–64. [DOI] [PubMed] [Google Scholar]
- 19.Gunby J, Daya S. IVF Directors Group of the Canadian Fertility and Andrology Society. Assisted reproductive technologies (ART) in Canada: 2003 results from the Canadian ART Register. Fertil Steril 2007;88:550–9. [DOI] [PubMed] [Google Scholar]
- 20.Gunby J, Bissonnette F, Librach C, Cowan L. IVF Directors Group of the Canadian Fertility and Andrology Society. Assisted reproductive technologies (ART) in Canada: 2004 results from the Canadian ART Register. Fertil Steril 2008;89:1123–32. [DOI] [PubMed] [Google Scholar]
- 21.Gunby J, Bissonnette F, Librach C, Cowan L. IVF Directors Group of the Canadian Fertility and Andrology Society. Assisted reproductive technologies in Canada: 2005 results from the Canadian Assisted Reproductive Technologies Register. Fertil Steril 2009;91:1721–30. [DOI] [PubMed] [Google Scholar]
- 22.Gunby J, Bissonnette F, Librach C, Cowan L. IVF Directors Group of the Canadian Fertility and Andrology Society. Assisted reproductive technologies (ART) in Canada: 2006 results from the Canadian ART Register. Fertil Steril 2010;93:2189–201. [DOI] [PubMed] [Google Scholar]
- 23.Gunby J, Bissonnette F, Librach C, Cowan L. IVF Directors Group of the Canadian Fertility and Andrology Society. Assisted reproductive technologies (ART) in Canada: 2007 results from the Canadian ART Register. Fertil Steril 2011;95:542–7.e10. [DOI] [PubMed] [Google Scholar]
- 24.Zegers-Hochschild F, Schwarze JE, Crosby JA, Musri C, Urbina MT. Latin American Network of Assisted Reproduction (REDLARA). Assisted reproductive techniques in Latin America: the Latin American Registry 2016. Reprod Biomed Online 2019;39:452–60. [DOI] [PubMed] [Google Scholar]
- 25.Zegers-Hochschild F, Schwarze JE, Crosby JA, Musri C, Urbina MT. Latin American Network of Assisted Reproduction (REDLARA). Assisted reproductive techniques in Latin America: the Latin American Registry 2015. Reprod Biomed Online 2018;37:685–92. [DOI] [PubMed] [Google Scholar]
- 26.Zegers-Hochschild F, Schwarze JE, Crosby JA, Musri C, Urbina MT. Latin American Network of Assisted Reproduction (REDLARA). Assisted reproductive techniques in Latin America: the Latin American Registry 2014. JBRA Assist Reprod 2017;21:164–75. [DOI] [PMC free article] [PubMed] [Google Scholar]
- 27.Zegers-Hochschild F, Schwarze JE, Crosby JA, Musri C, Urbina MT. Latin American Network of Assisted Reproduction (REDLARA). Assisted reproductive techniques in Latin America: the Latin American Registry 2013. Reprod Biomed Online 2016;32:614–25. [DOI] [PubMed] [Google Scholar]
- 28.Sunderam S, Kissin DM, Crawford SB, Folger SG, Boulet SL, Warner L, Barfield WD. Assisted Reproductive Technology Surveillance—United States, 2015. MMWR Surveill Summ 2018;67:1–28. [DOI] [PMC free article] [PubMed] [Google Scholar]
- 29.Sunderam S, Kissin DM, Crawford SB, Folger SG, Boulet SL, Warner L, Barfield WD. Assisted reproductive technology surveillance—United States, 2014. MMWR Surveill Summ 2017;66:1–24. [DOI] [PMC free article] [PubMed] [Google Scholar]
- 30.Sunderam S, Kissin DM, Crawford SB, Folger SG, Boulet SL, Warner L, Barfield WD. Assisted reproductive technology surveillance—United States, 2013. MMWR Surveill Summ 2015;64:1–25. [DOI] [PubMed] [Google Scholar]
- 31.Chambers GM, Chapman MG, Grayson N, Shanahan M, Sullivan EA. Babies born after ART treatment cost more than non-ART babies: a cost analysis of inpatient birth-admission costs of singleton and multiple gestation pregnancies. Hum Reprod 2007;22:3108–15. [DOI] [PubMed] [Google Scholar]
- 32.Felberbaum RE. Multiple pregnancies after assisted reproduction–international comparison. Reprod Biomed Online 2007;15(Suppl 3):53–60. [DOI] [PubMed] [Google Scholar]
- 33.Makhseed M, Al-Sharhan M, Egbase P, Al-Essa M, Grudzinskas JG. Maternal and perinatal outcomes of multiple pregnancy following IVF-ET. Int J Gynaecol Obstet 1998;61:155–63. [DOI] [PubMed] [Google Scholar]
- 34.Callahan TL, Hall JE, Ettner SL, Christiansen CL, Greene MF, Crowley WF Jr. The economic impact of multiple-gestation pregnancies and the contribution of assisted-reproduction techniques to their incidence. N Engl J Med 1994;331:244–9. [DOI] [PubMed] [Google Scholar]
- 35.Goldfarb JM, Austin C, Lisbona H, Peskin B, Clapp M. Cost-effectiveness of in vitro fertilization. Obstet Gynecol 1996;87:18–21. [DOI] [PubMed] [Google Scholar]
- 36.Rizk B, Doyle P, Tan SL, Rainsbury P, Betts J, Brinsden P, Edwards R. Perinatal outcome and congenital malformations in in-vitro fertilization babies from the Bourn–Hallam group. Hum Reprod 1991;6:1259–64. [DOI] [PubMed] [Google Scholar]
- 37.Merritt T, Goldstein M, Philips R, Peverini R, Iwakoshi J, Rodriguez A, Oshiro B. Impact of ART on pregnancies in California: an analysis of maternity outcomes and insights into the added burden of neonatal intensive care. J Perinatol 2014;34:345–50. [DOI] [PubMed] [Google Scholar]
- 38.Luke B, Brown MB, Wantman E, Seifer DB, Sparks AT, Lin PC, et al. Risk of prematurity and infant morbidity and mortality by maternal fertility status and plurality. J Assist Reprod Genet 2019;36:121–38. [DOI] [PMC free article] [PubMed] [Google Scholar]
- 39.Dhont M, De Sutter P, Ruyssinck G, Martens G, Bekaert A. Perinatal outcome of pregnancies after assisted reproduction: a case-control study. Am J Obstet Gynecol 1999;181:688–95. [DOI] [PubMed] [Google Scholar]
- 40.Pinborg A, Loft A, Rasmussen S, Schmidt L, Langhoff-Roos J, Greisen G, Andersen AN. Neonatal outcome in a Danish national cohort of 3438 IVF/ICSI and 10 362 non-IVF/ICSI twins born between 1995 and 2000. Hum Reprod 2004;19:435–41. [DOI] [PubMed] [Google Scholar]
- 41.Gerris J, De Sutter P, De Neubourg D, Van Royen E, Vander Elst J, Mangelschots K, et al. A real-life prospective health economic study of elective single embryo transfer versus two-embryo transfer in first IVF/ICSI cycles. Hum Reprod 2004;19:917–23. [DOI] [PubMed] [Google Scholar]
- 42.FIVNAT 1996 report. French national register on in vitro fertilization (article in French). Contracept Fertil Sex 1997;25:499–502. [PubMed] [Google Scholar]
- 43.Stoop D, Baumgarten M, Haentjens P, Polyos NP, De Vos M, Verheyen G, et al. Obstetric outcome in donor oocyte pregnancies: a matched-pair analysis. Reprod Biol Endocrinol 2012;10:42. [DOI] [PMC free article] [PubMed] [Google Scholar]
- 44.Han Y, Luo H, Zhang Y. Congenital anomalies in infants conceived by infertile women through assisted reproductive technology: a cohort study 2004–2014. Exp Ther Med 2018;16:3179–85. [DOI] [PMC free article] [PubMed] [Google Scholar]
- 45.Ombelet W, Cadron I, Gerris J, De Sutter P, Bosmans E, Martens G, et al. Obstetric and perinatal outcome of 1655 ICSI and 3974 IVF singleton and 1102 ICSI and 2901 IVF twin births: a comparative analysis. Reprod Biomed Online 2005;11:76–85. [DOI] [PubMed] [Google Scholar]
- 46.Koivurova S, Hartikainen AL, Gissler M, Hemminki E, Sovio U, Järvelin MR. Neonatal outcome and congenital malformations in children born after in-vitro fertilization. Hum Reprod 2002;17:1391–8. [DOI] [PubMed] [Google Scholar]
- 47.Van Dorp W, Rietveld AM, Laven JS, van den Heuvel-Eibrink MM, Hukkelhoven CW, Schipper I. Pregnancy outcome of non-anonymous oocyte donation: a case-control study. Eur J Obstet Gynecol Reprod Biol 2014;182:107–12. [DOI] [PubMed] [Google Scholar]
- 48.Ricciarelli E, Bruna I, Verdú V, Torrelló MJ, Herrer R, Gris JM, et al. Impact of assisted reproduction treatments on Spanish newborns: report of 14,119 pregnancies. J Assist Reprod Genet 2013;30:897–905. [DOI] [PMC free article] [PubMed] [Google Scholar]
- 49.D’Souza SW, Rivlin E, Cadman J, Richards B, Buck P, Lieberman BA. Children conceived by in vitro fertilisation after fresh embryo transfer. Arch Dis Child Fetal Neonatal Ed 1997;76:F70–4. [DOI] [PMC free article] [PubMed] [Google Scholar]
- 50.Farhi A, Reichman B, Boyko V, Mashiach S, Hourvitz A, Margalioth EJ, et al. Congenital malformations in infants conceived following assisted reproductive technology in comparison with spontaneously conceived infants. J Matern Fetal Neonatal Med 2013;26:1171–9. [DOI] [PubMed] [Google Scholar]
- 51.Goldsmith S, Mcintyre S, Badawi N, Hansen M. Cerebral palsy after assisted reproductive technology: a cohort study. Dev Med Child Neurol 2018;60: 73–80. [DOI] [PubMed] [Google Scholar]
- 52.Belva F, Henriet S, Van den Abbeel E, Camus M, Devroey P, Van der Elst J, et al. Neonatal outcome of 937 children born after transfer of cryopreserved embryos obtained by ICSI and IVF and comparison with outcome data of fresh ICSI and IVF cycles. Hum Reprod 2008;23:2227–38. [DOI] [PubMed] [Google Scholar]
- 53.Belva F, Bonduelle M, Roelants M, Verheyen G, Van Landuyt L. Neonatal health including congenital malformation risk of 1072 children born after vitrified embryo transfer. Hum Reprod 2016;31:1610–20. [DOI] [PubMed] [Google Scholar]
- 54.Declercq E, Luke B, Belanoff C, Cabral H, Diop H, Gopal D, et al. Perinatal outcomes associated with assisted reproductive technology: the Massachusetts Outcomes Study of Assisted Reproductive Technologies (MOSART). Fertil Steril 2015;103:888–95. [DOI] [PMC free article] [PubMed] [Google Scholar]
- 55.Tandberg A, Bjørge T, Nygård O, Børdahl P, Skjaerven R. Trends in incidence and mortality for triplets in Norway 1967–2006: the influence of assisted reproductive technologies. BJOG 2010;117:667–75. [DOI] [PubMed] [Google Scholar]
- 56.Sullivan EA, Chapman MG, Wang YA, Adamson GD. Population-based study of cesarean section after in vitro fertilization in Australia. Birth 2010; 37:184–91. [DOI] [PubMed] [Google Scholar]
- 57.Pereira N, Petrini AC, Lekovich JP, Schattman GL, Rosenwaks Z. Comparison of perinatal outcomes following fresh and frozen-thawed blastocyst transfers. Int J Gynaecol Obstet 2016;135:96–100. [DOI] [PubMed] [Google Scholar]
- 58.Zhu L, Zhang Y, Liu Y, Zhang R, Wu Y, Huang Y, et al. Maternal and live-birth outcomes of pregnancies following assisted reproductive technology: a retrospective cohort study. Sci Rep 2016;6:35141. [DOI] [PMC free article] [PubMed] [Google Scholar]
- 59.Lei LL, Lan YL, Wang SY, Feng W, Zhai ZJ. Perinatal complications and live-birth outcomes following assisted reproductive technology: a retrospective cohort study. Chin Med J (Engl) 2019;132:2408–16. [DOI] [PMC free article] [PubMed] [Google Scholar]
- 60.Spangmose AL, Malchau SS, Henningsen AA, Forman JL, Rasmussen S, Loft A, et al. Academic performance in adolescents aged 15–16 years born after frozen embryo transfer compared with fresh embryo transfer: a nationwide registry–based cohort study. BJOG 2019;126:261–9. [DOI] [PubMed] [Google Scholar]
- 61.Marino JL, Moore VM, Willson KJ, Rumbold A, Whitrow MJ, Giles LC, Davies MJ. Perinatal outcomes by mode of assisted conception and sub-fertility in an Australian data linkage cohort. PLoS One 2014;9: e80398. [DOI] [PMC free article] [PubMed] [Google Scholar]
- 62.Setti PE, Moioli M, Smeraldi A, Cesaratto E, Menduni F, Livio S, et al. Obstetric outcome and incidence of congenital anomalies in 2351 IVF/ICSI babies. J Assist Reprod Genet 2016;33:711–7. [DOI] [PMC free article] [PubMed] [Google Scholar]
- 63.Motohashi T, Honda T, Hasegawa M, Uchida T, Kanamoto N, Koizumi K, et al. Costs of maternal and neonatal medical care for triplet and quadruplet pregnancies in Japan. Reprod Med Biol 2004;3:159–64. [DOI] [PMC free article] [PubMed] [Google Scholar]
- 64.Chambers GM, Hoang VP, Lee E, Hansen M, Sullivan EA, Bower C, Chapman M. Hospital costs of multiple-birth and singleton-birth children during the first 5 years of life and the role of assisted reproductive technology. JAMA Pediatr 2014;168:1045–53. [DOI] [PubMed] [Google Scholar]
- 65.Lemos EV, Zhang D, Van Voorhis BJ, Hu XH. Healthcare expenses associated with multiple vs singleton pregnancies in the United States. Am J Obstet Gynecol 2013;209:586.e1–11. [DOI] [PubMed] [Google Scholar]
- 66.Olivennes F, Golombok S, Ramogida C, Rust J. Behavioral and cognitive development as well as family functioning of twins conceived by assisted reproduction: findings from a large population study. Fertil Steril 2005;84: 725–33. [DOI] [PubMed] [Google Scholar]
- 67.Nakajo Y, Fukunaga N, Fuchinoue K, Yagi A, Chiba S, Takeda M, et al. Physical and mental development of children after in vitro fertilization and embryo transfer. Reprod Med Biol 2004;3:63–7. [DOI] [PMC free article] [PubMed] [Google Scholar]
- 68.Kuiper D, Bennema A, la Bastide-van Gemert S, Seggers J, Schendelaar P, Haadsma M, et al. Neurodevelopmental and cardiometabolic outcome in 4-year-old twins and singletons born after IVF. Reprod Biomed Online 2017;34:659–67. [DOI] [PubMed] [Google Scholar]
- 69.Strömberg B, Dahlquist G, Ericson A, Finnström O, Köster M, Stjernqvist K. Neurological sequelae in children born after in-vitro fertilisation: a population-based study. Lancet 2002;359:461–5. [DOI] [PubMed] [Google Scholar]
Associated Data
This section collects any data citations, data availability statements, or supplementary materials included in this article.


