Abstract
Retinal progenitor cells (RPCs) divide in limited numbers to generate the cells comprising vertebrate retina. The molecular mechanism that leads RPC to the division limit, however, remains elusive. Here, we find that the hyperactivation of mechanistic target of rapamycin complex 1 (mTORC1) in an RPC subset by deletion of tuberous sclerosis complex 1 (Tsc1) makes the RPCs arrive at the division limit precociously and produce Müller glia (MG) that degenerate from senescence-associated cell death. We further show the hyperproliferation of Tsc1-deficient RPCs and the degeneration of MG in the mouse retina disappear by concomitant deletion of hypoxia-induced factor 1-alpha (Hif1a), which induces glycolytic gene expression to support mTORC1-induced RPC proliferation. Collectively, our results suggest that, by having mTORC1 constitutively active, an RPC divides and exhausts mitotic capacity faster than neighboring RPCs, and thus produces retinal cells that degenerate with aging-related changes.
Research organism: Mouse
Introduction
Neural progenitor cells (NPCs) divide repeatedly during development to generate the cells of vertebrate neural tissues (Homem et al., 2015; Obernier and Alvarez-Buylla, 2019). NPCs are present for a limited period before entering a final cell division for the differentiation to neurons and glia. Consequently, NPCs are not seen in the majority of adult neural tissues, except for sub-brain areas that exhibit continued neurogenesis.
The factors that determine when an NPC enters the final division and how long it keeps division capacity, however, still remain elusive. It has been identified that the mitotic characteristics of NPCs change continually in the development of neural tissues. Most NPCs divide symmetrically to expand themselves during early development; thereafter, the asymmetrically dividing NPCs increase to preserve the NPC population while actively generating the various types of neurons and glia (Homem et al., 2015; Obernier and Alvarez-Buylla, 2019). The length of the NPC cell cycle also increases with development, while the NPC division capacity decreases (Alexiades and Cepko, 1996; Ohnuma and Harris, 2003). Given the heterogeneity of the NPC division mode and cell cycle length, it is believed that cumulative division numbers might be diversified among NPCs even within the same neural tissues in development. Consequently, some NPCs might have already reached their mitotic division limits while neighboring NPCs are still able to divide further. However, the division capacity of an NPC in developing neural tissue has not been empirically quantified to date.
The mouse retina has been used as a model system in studies aiming to identify general features of mammalian NPC proliferation and differentiation (Cepko, 2014). Two retinal progenitor cell (RPC) populations have been identified in mouse retina (Clark et al., 2019). The early RPC population produces retinal ganglion cells (RGCs), amacrine cells (ACs), horizontal cells (HCs), cone photoreceptors (cPRs), and some rod photoreceptors (rPRs), whereas the late RPC population mainly produces bipolar cells (BCs), Müller glia (MG), and some rPRs (Cepko, 2014; Clark et al., 2019). Given the temporal-specific development of retinal cell types, cumulative division numbers of RPCs producing MG, which is the last-born retinal cell type, are likely different from those of RPCs generating RGCs, which is the first-born retinal cell type.
The decision of an RPC to exit the cell cycle and undergo differentiation is regulated by various factors. For example, RPCs extended division capacity in mice deficient of the cell cycle-dependent kinase inhibitor 1b (Cdkn1b/p27) (Levine et al., 2000), whereas they prematurely exited the cell cycle and were extinguished precociously in mice lacking cyclin D1 (Ccnd1) (Das et al., 2012). Consequently, the production of MG is decreased in Ccnd1-deficient mouse retina, whereas it is extended in Cdkn1-deficient mouse retina. Therefore, cumulative division numbers of Cdkn1-deficient RPCs are likely to be greater than those of Ccnd1-deficient RPCs when these cells undertake the production of MG in the postnatal retina.
The speed of the cell cycle could also affect the cumulative division number of RPCs as well. Tuberous sclerosis complex 1 (Tsc1)-deficient mouse RPCs, which have hyperactive mechanistic target of rapamycin complex 1 (mTORC1), were found to complete a cell cycle more quickly than wild-type mouse RPCs (Choi et al., 2018). This resulted in faster accumulation of newborn cells in the Tsc1-deficient mouse retinas than in wild-type retinas. Here, we also found faster accumulation of cells in the mouse retina where Tsc1 was deleted in the minor RPC population derived from the ciliary margin (CM). This made the CM RPC-derived Tsc1-deficient clones invade into neighboring areas, where wild-type clones grow slowly, and occupy almost entire territory of the mature mouse retina. However, later, the retinal cells, especially the MG, produced from Tsc1-deficient CM RPCs take on senescent characteristics and degenerate to form rosette structures in the retinas. The Tsc1-deficient retinal cells were found to be mitotically older than those derived from neighboring wild-type RPC clones. The precocious aging phenotypes of the Tsc1 conditional knock-out (cko) mouse retina were rescued by concomitant deletion of hypoxia-induced factor 1-alpha (Hif1a), which supports RPC proliferation by inducing the expression of glycolytic enzymes that can supply ATP in Tsc1-deficient RPCs. These results suggest that there are limits to RPC mitotic division that can be reached precociously by hyperexpansion of an RPC clone in the developing retina.
Results
Degeneration of MG derived from Tsc1-deficient CM RPCs
mTORC1 activity, which leads to the phosphorylation of ribosomal protein S6 (pS6) via the activation of S6 kinase 1 (S6K1), was detectable in developing mouse retina but was absent in the neighboring retinal pigment epithelium (RPE) and CM (Figure 1—figure supplement 1). However, it is unknown why mTORC1 activity is diversified in the optic neuroepithelial continuum of the retina-CM-RPE, which were shown to exhibit differential proliferation rates (Moon et al., 2018). To understand the physiological importance of the spatially differentiated mTORC1 activation, we ectopically increased mTORC1 activity in the RPE and CM by deleting Tsc1, which is a negative upstream regulator of mTORC1 (Gao et al., 2002; Saxton and Sabatini, 2017). To this end, we bred Tsc1flox/flox (Tsc1fl/fl) mice with tyrosinase-related protein 1-Cre (Tyrp1-Cre) mice, which express Cre recombinase in both the RPE and the CM cells that have a potential to become RPCs in the peripheral retina (Fischer et al., 2013; Mori et al., 2002; Figure 1A). As expected, Cre-affected cells, which were visualized by a fluorescent Cre reporter ROSA26EYFP (R26EYFP), were detectable in the RPE, CM, and peripheral retina of Tsc1fl/+;Tyrp1-Cre mice (Figure 1B, top row). The R26EYFP-positive cells were found farther in the central part of Tsc1fl/fl;Tyrp1-Cre mouse retinas, suggesting that the CM-derived Tsc1-deficient cell populations were expanded more centrally in the retinas.
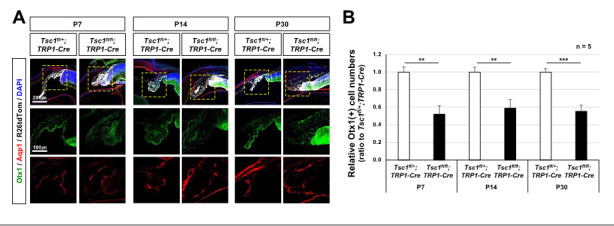
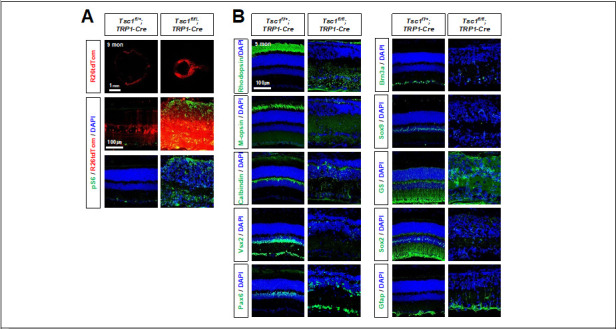
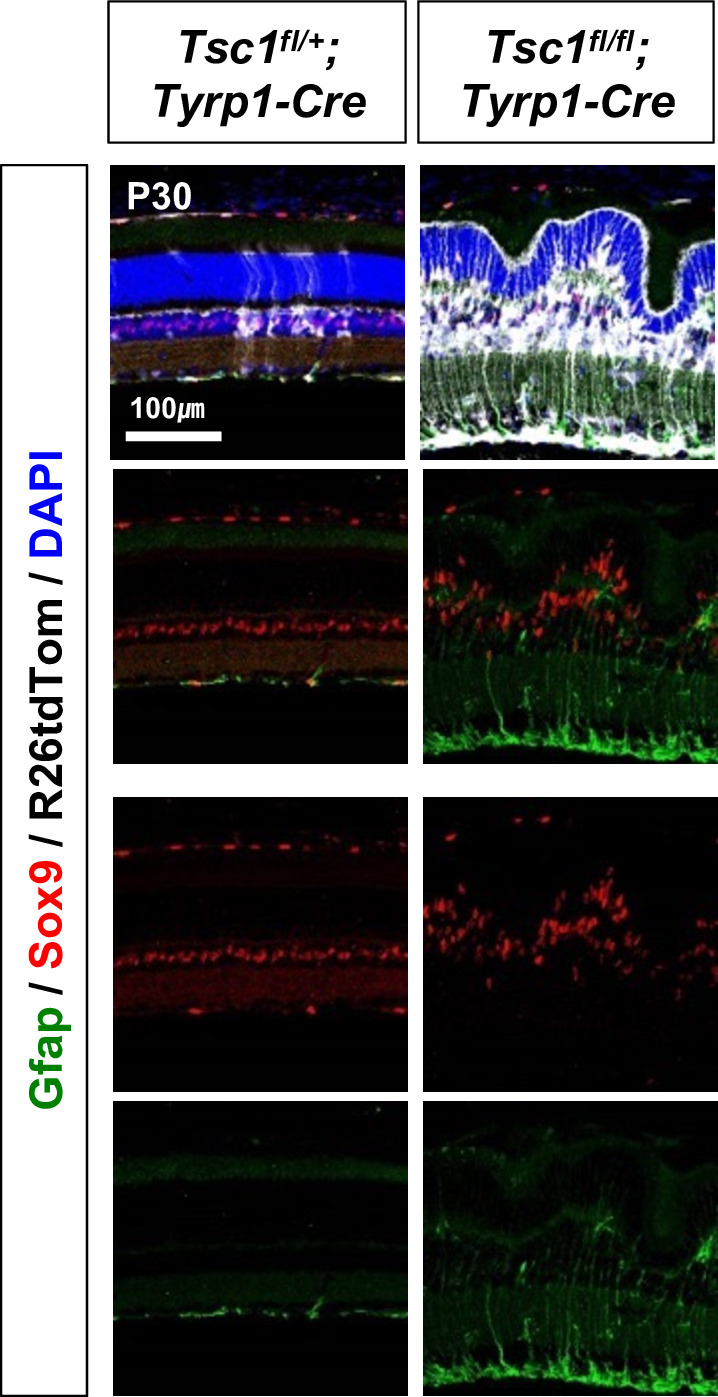
Figure 1. MG degeneration and rosette formation in Tsc1fl/fl;Tyrp1-Cre mouse retina.
(A) Developmental changes of eye and retinal structures in Tsc1fl/+;Tyrp1-Cre and Tsc1fl/fl;Tyrp1-Cre littermate mice were examined by hematoxylin and eosin (H&E) staining of the eye sections. ONL, outer nuclear layer; OPL, outer plexiform layer; INL, inner nuclear layer; IPL, inner plexiform layer; GCL, ganglion cell layer. (B) The Cre-affected cells in the mouse retinas were visualized by R26EYFP Cre reporter, and mTORC1 activation of the cells was determined by immunostaining of pS6. Nuclei of the cells were visualized by DAPI staining. (C) Distributions of MG in the mouse retinas were examined by immunostaining of the MG markers, Sox9 and glutamine synthetase (GS). (D) Retinal cell type-specific marker-positive cells among DAPI-positive total retinal cells in 350 μm × 350 μm areas were counted and shown their relative values against those of Tsc1fl/+;Tyrp1-Cre mouse retinas in the graph. Representative staining images of retinal markers are provided in (C) and Figure 1—figure supplement 2A. Error bars denote standard deviations (SD). The numbers of samples are 5 from five independent litters. **p < 0.01; ***p < 0.001; ****p < 0.0001.

Figure 1—figure supplement 1. Spatially restricted mTORC1 activation in developing mouse eyes.

Figure 1—figure supplement 2. Cell composition of Tsc1fl/+;Tyrp1-Cre and Tsc1fl/fl;Tyrp1-Cre mouse retinas.

Figure 1—figure supplement 3. Apoptotic cell death of tuberous sclerosis complex 1 (Tsc1)-deficient MG.

Figure 1—figure supplement 4. MG degeneration and rosette formation in Tsc2fl/fl;Tyrp1-Cre mouse retinas.

We found that the eyes of Tsc1fl/fl;Tyrp1-Cre mice at P14 and P30 were significantly smaller than those of Tsc1fl/+;Tyrp1-Cre littermates (Figure 1A and B, top rows), and their ciliary body (CB) and iris were malformed (arrows in Figure 1A, middle row). Moreover, the Tsc1fl/fl;Tyrp1-Cre mouse retinas exhibited multiple rosette structures (arrowheads in Figure 1A, bottom row). However, these phenotypes were not observed in P7 Tsc1fl/+;Tyrp1-Cre and Tsc1fl/fl;Tyrp1-Cre littermate mouse eyes (Figure 1A and B, two leftmost columns). The results suggest that the structural alterations in Tsc1fl/fl;Tyrp1-Cre mouse retinas began after the first postnatal week.
It is known that the loss of MG is a major cause of retinal rosette formation (Willbold et al., 2000). We found that the cells expressing the MG markers, including p27, SRY-box transcription factors 2 and 9 (Sox2 and Sox9), and glutamine synthetase, were decreased significantly in P14 and P30 Tsc1fl/fl;Tyrp1-Cre mouse retinas compared with Tsc1fl/+;Tyrp1-Cre littermate retinas, whereas the numbers of other retinal cell types were not significantly different in those two retinas (Figure 1C and D; Figure 1—figure supplement 2A and B). However, the numbers of MG were rather increased in P7 Tsc1fl/fl;Tyrp1-Cre mouse retina (Figure 1D; Figure 1—figure supplement 2B); this is likely due to the developmental acceleration of MG production, as it was reported previously (Choi et al., 2018). The numbers of apoptotic cells, which were assessed by TUNEL (terminal deoxynucleotidyl transferase dUTP nick end labeling) and immunostaining of cleaved active caspase-3 (Casp-3), were also elevated in the MG population of Tsc1fl/fl;Tyrp1-Cre mouse retinas (Figure 1—figure supplement 3A,B,C,D,E,F,G). Furthermore, the apoptotic cells were enriched in the Tsc1-deficient cell population positive for the Cre reporter, ROSA26tdTomato (R26tdTom) (Figure 1—figure supplement 3A and C), suggesting that Tsc1 deletion had autonomous effects on MG degeneration. These findings suggest that the number of MG in Tsc1fl/fl;Tyrp1-Cre mice might decrease below a critical level needed to maintain an intact retinal structure, due to the enhanced degeneration of MG.
Retinal rosettes and degeneration of MG were also observed in Tsc2fl/fl;Tyrp1-Cre mice, in which the other TSC component, Tsc2 (Inoki et al., 2002; Saxton and Sabatini, 2017), was deleted in the RPE and CM cells (Figure 1—figure supplement 4A and C). However, eyes of Tsc2fl/fl;Tyrp1-Cre mice were not significantly different in size compared to those of Tsc2fl/+;Tyrp1-Cre mice, and their CB and iris were intact (Figure 1—figure supplement 4A and B). These results suggest that the microphthalmia and CB/iris malformation of Tsc1fl/fl;Tyrp1-Cre mice is not due to mTORC1 hyperactivation; instead, they might be caused by cellular events that are regulated by Tsc1.
MG degeneration and retinal rosette formation are not caused by the hyperactivation of mTORC1 in mature retina
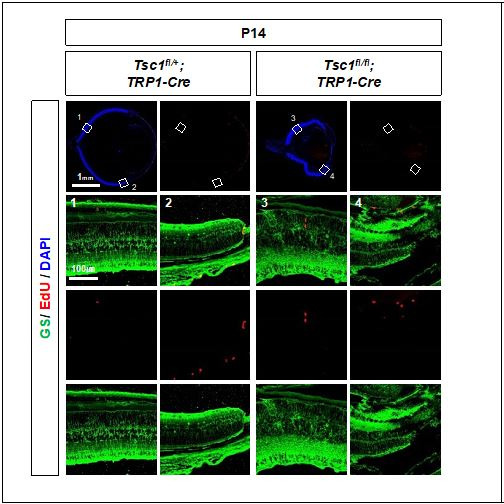
To examine whether the MG degeneration and retinal rosette formation were due to mTORC1 hyperactivation in MG, we deleted Tsc1 using the MG-specific solute carrier family 1 member 3-CreERT2 (Slc1a3-CreERT2), which is active in the presence of estrogen analog, tamoxifen (Tam) (de Melo et al., 2012). However, we could not observe MG degeneration or retinal rosettes in P30 Tsc1fl/fl;Slc1a3-CreERT2 mice, from which Tsc1 was deleted in MG beginning at P10 by Tam injection (Figure 2A).
Figure 2. Inhibition of mTORC1 cannot suppress MG degeneration in the mature mouse retina.

(A) The Tsc1fl/+;Slc1a3-CreERT2 and Tsc1fl/fl;Slc1a3-CreERT2 littermate mice were injected with tamoxifen (Tam) at P10 before the isolation of the eyes for cryosection at P30. The eye sections were stained with hematoxylin and eosin (H&E) to investigate the eye and retinal structures. Distributions of the cells expressing R26tdTom Cre reporter, mTORC1 activitation marker pS6, and MG marker Sox9 in the eye sections were examined by immunostaining. Nuclei of the cells in the sections were visualized by DAPI staining. (B) Tsc1fl/+;Tyrp1-Cre and Tsc1fl/fl;Tyrp1-Cre littermate mice were injected with rapamycin (2 mg/kg) daily from P7 to P13 to inhibit mTORC1. Alternatively, the mice were injected with same volume of the vehicle (5% poly-ethylene glycol and 5% Tween 80 in PBS). Retinal structures of the injected mice were investigated at P14 by H&E staining of their eye sections. Distribution of Cre-affected cells and mTORC1 activation of the cells were examined by co-immunostaining of R26EYFP and pS6. Distributions of MG in the mouse retinas were examined by immunostaining of Sox9.
We also found that the retinal rosettes of Tsc1fl/fl;Tyrp1-Cre mice were still evident when mTORC1 was inhibited by daily injection of a chemical inhibitor, rapamycin, during the second postnatal week (Figure 2B). The numbers of MG in Tsc1fl/fl;Tyrp1-Cre mouse retinas were also not recovered by rapamycin treatment, whereas pS6 was completely absent from the rapamycin-treated mouse retinas. Collectively, these results suggest that the degenerative phenotypes are not due to mTORC1 activation in the MG; instead, they likely arise from mTORC1 activation in the developing mouse retina.
MG degeneration and retinal rosette formation cannot be induced by Tsc1 deletion in the majority of RPC and RPE populations
Interestingly, in contrast to Tsc1fl/fl;Tyrp1-Cre mice, retinal rosettes were not seen in Tsc1fl/fl;Chx10-Cre and Tsc1fl/fl;Mlana-Cre mice (Figure 3A, third and fifth columns from left), in which Tsc1 was deleted from most of the RPCs by Chx10-EGFP/cre (Chx10-Cre) and from the RPE by Mlana-Cre, respectively (Aydin and Beermann, 2011; Rowan and Cepko, 2004). The embryonic and early postnatal mouse RPE was shown to make direct contact with adjacent RPCs to regulate neurogenic capacity of the RPCs (Ha et al., 2017). Therefore, we speculated that the phenotypes of Tsc1fl/fl;Tyrp1-Cre mice might be induced only when Tsc1 was lost commonly in the RPE and RPC. However, we failed to find the decrease of MG as well as retinal rosettes in Tsc1fl/fl;Chx10-Cre;Mlana-Cre mouse eyes, in which Tsc1 was deleted in RPC and RPE together (Figure 3A [rightmost column] and 3B). The numbers of RPE were also unchanged in the eyes of the double Cre-expressing mice (Figure 3A and C).
Figure 3. Normal eye and retinal structures in the mice lacking tuberous sclerosis complex 1 (Tsc1) in majority retina and retinal pigment epithelium (RPE) populations.

(A) Retinal structures of P30 mice deleted of Tsc1 in majority retinal progenitor cells (RPCs) by Chx10-Cre or in the RPE by Mlana-Cre were investigated by hematoxylin and eosin (H&E) staining of the eye sections. Distribution of Cre-affected cells and mTORC1 activitation of the cells were examined by co-immunostaining of R26EYFP and pS6. Distributions of MG in the mouse retinas were examined by immunostaining of Sox9. RPE in whole-mount eye cups was visualized by immunostaining of Otx2, which locates in the RPE nuclei, and F-actin, which marks RPE cell boundary. Numbers of Sox9-positive MG in the retinal sections (B) and Otx2-postive RPE in the whole-mount eye cups (C) were counted and shown in the graphs. Error bars denote SD and numbers of samples are 6 from four independent litters.
Given the absence of Cre activity in the CM area of Tsc1fl/fl;Chx10-Cre;Mlana-Cre mice (see R26EYFP Cre reporter signals in Figure 3A), we then questioned whether the MG degeneration and rosette formation could be caused by Tsc1 deletion in the CM population. To explore this, we deleted Tsc1 from RPCs in the peripheral retina and the inner CM cell population using Pax6-cre,GFP (Pax6-aCre) (Marquardt et al., 2001). However, the eyes and retinas appeared normal in Tsc1fl/fl;Pax6-aCre mice, and their MG cell numbers were not greatly different from those in Tsc1fl/+;Pax6-aCre littermate mice (Figure 4A, third and fourth columns from left). Given the absence of Pax6-aCre activity in the pigmented outer CM cells, we next deleted Tsc1 from the entire optic neuroepithelia-derived cell population, including the retina, the inner and outer CM, and the RPE, using Rax-cre (Klimova et al., 2013), and tested whether Tsc1 deletion in the outer CM population is necessary for the observed phenotypes. However, Tsc1fl/fl;Rax-Cre mice also exhibited normal retinal morphologies and MG cell numbers (Figure 4A, rightmost column).
Figure 4. MG degeneration is caused by clonal hyperexpansion of tuberous sclerosis complex 1 (Tsc1)-deficient cells in developing mouse retina.
(A) Eye and retinal structures of P30 mice with the indicated genotypes were examined by hematoxylin and eosin (H&E) staining. Distribution of Cre-affected cells and mTORC1 activation of the cells were examined by co-immunostaining of R26tdTom and pS6. (B) Cre-affected Tsc1-heterozygote (Tsc1fl/+;Cre) and Tsc1-deficient (Tsc1fl/fl;Cre) cells, which emitted red fluorescence of R26tdTom Cre reporter, are isolated from Cre-unaffected wild-type cells in same retinas by FACS and the histograms are presented. (C) Relative composition of R26tdTom-positive and -negative cell populations in the retinas are shown in the graph. Error bars denote SD. Numbers of samples analyzed are shown in the graph columns. ***p < 0.001; n.s., not significant. (D) Distributions of the Cre-affected cells in the corresponding E14.5 and P30 mouse retinas are summarized in the drawings. (E) Developmental changes of R26tdTom-positive Cre-affected population in Tsc1fl/+;Tyrp1-Cre and Tsc1fl/fl;Tyrp1-Cre littermate mouse retinas were determined by FACS and shown in the graph. Error bars denote SD. Numbers of samples analyzed are shown in the graph (four independent litters). **p < 0.01; ****p < 0.0001. (F) Tsc1+/- and Tsc1-/- retinal progenitor cells (RPCs) were isolated from E13 Tsc1fl/+;Chx10-Cre and Tsc1fl/fl;Chx10-Cre and were cultured to form the neurospheres. Representative images of the neurospheres at the indicated post-culture days are provided. (G) Sizes of neurospheres in culture were counted at the indicated post-culture days and their average values are shown in the graph. (H) Average numbers of neurosphere in the indicated area are also shown in the graph. Numbers of samples analyzed are shown in the graphs (± independent culture batches). *p < 0.05; ***p < 0.001; ****p < 0.0001; n.s., not significant.

Figure 4—figure supplement 1. Distributions of tuberous sclerosis complex 1 (Tsc1)-deficient cells in E14.5 Tsc1-conditional knock-out (cko) mouse retinas.

Figure 4—figure supplement 2. MG degeneration and retinal rosette formation upon the deletion of tuberous sclerosis complex 1 (Tsc1) in ciliary margin (CM)-derived minor retinal progenitor cell (RPC) clones by tyrosinase-related protein 1-Cre (Tyrp1-Cre)ERT2.

Figure 4—figure supplement 3. Autonomous effects of tuberous sclerosis complex 1 (Tsc1) deletion on mitotic aging of mouse retinal progenitor cells (RPCs) in neurosphere culture.

Figure 4—figure supplement 4. Hypothetical model depicts the clonal hyperexpansion of tuberous sclerosis complex 1 (Tsc1)-deficient.

MG degeneration is correlated with the clonal expansion of Tsc1-deficient RPCs in the retina
The Tsc1-deficient RPCs can complete a cell cycle faster than wild-type RPCs (Choi et al., 2018), therefore the time necessary to double the population is likely shorter for a Tsc1-deficient RPC than for a wild-type RPC in the same retina. This, therefore, could enable the small Tsc1-deficient population in the peripheral retina to expand into the central retina where wild-type populations expand slowly in Tsc1fl/fl;Tyrp1-Cre mice (Figure 1B, top row). However, a Tsc1-deficient RPC in Tsc1fl/fl;Rax-Cre and Tsc1fl/fl;Chx10-Cre mouse retinas might not have this competitive advantage over their neighboring RPCs for clonal expansion, since the neighboring RPCs also lose Tsc1 and expand as quickly as the Tsc1-deficient RPC.
To confirm the differential clonal expansion of Tsc1-deficient cells in each Tsc1-cko mouse retina, we collected R26tdTom-positive Cre-affected cells, which are potential Tsc1-heterozygous and Tsc1-deficient cells in Tsc1fl/+;Cre and Tsc1fl/fl;Cre mouse retinas, respectively, using fluorescence-activated cell sorting (FACS). Our FACS results showed that the percentages of retinal cells affected by the Cre recombinases in Tsc1fl/+ mouse retinas were approximately 48% for Tyrp1-cre, 65% for Pax6-aCre, 81% for Chx10-Cre, and 92% by Rax-Cre. The cells were increased to about 85% in Tsc1fl/fl;Tyrp1-Cre mouse retinas; 89% in Tsc1fl/fl;Pax6-aCre mouse retinas; 93% in Tsc1fl/fl;Chx10-Cre mouse retinas; and 95% in Tsc1fl/fl;Rax-Cre mouse retinas (Figure 4B and C). This resulted in 1.77-, 1.36-, 1.16-, and 1.03-fold increases, respectively, of Cre-affected cells in the Tsc1fl/fl;Cre mouse retinas comparing with their littermate Tsc1fl/+;Cre mouse retinas (Figure 4C). These results can also be translated to overproduction of Tsc1-deficient cells by 77%, 35.9%, 16.3%, and 3.2% relative to the levels expected based on the penetrance of each Cre driver. This clonal expansion had begun during the embryonic stages and continued until P14, when retinal histogenesis was completed (Figure 4D and E; Figure 4—figure supplement 1). These results suggest the clonal expansion power of a Tsc1-deficient RPC is inversely correlated with the population of Tsc1-deficient RPCs in developing mouse retina.
Further, we deleted Tsc1 in smaller retinal population than those affected by Tyrp1-Cre using Tyrp1-CreERT2, which can be activated in the CM and RPE subpopulation by Tam. As we expected, the R26EYFP-positive CreER-affected cells were detected sparsely in P30 Tyrp1-CreERT2 mouse retina (Figure 1A), when Tam was injected by E9.5 (Figure 4—figure supplement 2A). We could also find retinal rosettes in the Tsc1f/f;Tyrp1-CreERT2 mice, which were injected with Tam at E9.5, but not in those injected with Tam at P0 (Figure 4—figure supplement 2B). The rosette areas showed the decrease of MG and the increase of apoptotic cells (Figure 4—figure supplement 2C–E ). These results suggest the degeneration of MG derived from Tsc1-deficient CM RPCs given rise from early mouse embryos, which have greater division capacity than those from later stages.
Earlier arrival of Tsc1-deficent mouse RPCs at the division limit
Given the positive relationship between the clonal expansion power of Tsc1-deficient cells and MG degeneration in the Tsc1-cko mouse retinas, we hypothesized that the Tsc1-deficient RPCs in Tsc1fl/fl;Tyrp1-Cre mouse retinas were likely to be too old, in mitotic terms, to preserve the survival program intact in their descendent MG. In the other words, the Tsc1-deficient RPCs were close to or had exceeded their mitotic division limit when they produced MG in Tsc1fl/fl;Tyrp1-Cre mouse retinas, whereas the RPCs in the other Tsc1-cko mice had not yet reached that limit.
To test this hypothesis, we compared the division capacities of Tsc1-heterozygote and Tsc1-deficient mouse RPCs in vitro. The RPCs were isolated from E13 Tsc1fl/+;Chx10-Cre and Tsc1fl/fl;Chx10-Cre littermate mouse embryo retinas, respectively, and cultured to form neurospheres. We found that Tsc1-deficient RPCs divided faster to form larger neurospheres than those derived from Tsc1-heterozygote RPCs at one post-culture week (Figure 4F). However, the Tsc1-deficient neurospheres stopped expanding and the cells comprising the neurospheres started to degenerate after 3 post-culture weeks, while the Tsc1-heterozygote neurospheres expanded slowly and maintained in relative intact forms by 5 post-culture weeks (Figure 4F and G). Consequently, the numbers of Tsc1-deficient neurospheres became less than those of Tsc1-heterozygote neurospheres after 4 post-culture weeks (Figure 4F and H). The fast expansion and precocious degeneration of Tsc1-deficient neurospheres were not affected by the presence of wild-type neurospheres in the neighbor, suggesting that overproliferation is an intrinsic property of Tsc1-deficient RPCs (Figure 4—figure supplement 3A – D). These results suggest that the RPC has a limited division capacity that can be reachable earlier when the cells divide faster, as seen in the Tsc1-deficient RPCs (Figure 4—figure supplement 4).
Accelerated mitotic aging of Tsc1-deficient mouse RPCs
To further validate the idea that the Tsc1-deficient RPCs in Tsc1fl/fl;Tyrp1-Cre mice overproliferated to produce MG after exceeding their division limits, we explored the relative division numbers of retinal cells comprising various Tsc1-cko mouse retinas. Telomeric DNA sequences are shortened after every cell division unless they are recovered by telomerase (Calado and Dumitriu, 2013; Shay, 2016). Given the absence of telomerase reverse transcriptase (Tert) and telomerase RNA component (Terc) mRNA expression in embryonic and postnatal mouse retinas (data not shown), we expected that the telomeric sequences would be shortened constantly in mouse RPCs after each division. In support of this, we found that the average telomere length in mouse retina cells decreased with age (Figure 5—figure supplement 1). We further found that the telomere shortening was faster in Tsc1fl/fl;Tyrp1-Cre mouse retinas compared to Tsc1fl/+;Tyrp1-Cre littermate mouse retinas (Figure 5A; Figure 5—figure supplement 1). However, there was no significant difference in telomere length between other Tsc1fl/+;Cre and Tsc1fl/fl;Cre littermate mouse retinas (Figure 5A). These results suggest the ability of Tsc1-deficient RPCs to overproliferate is inversely related with their frequencies in the retina.
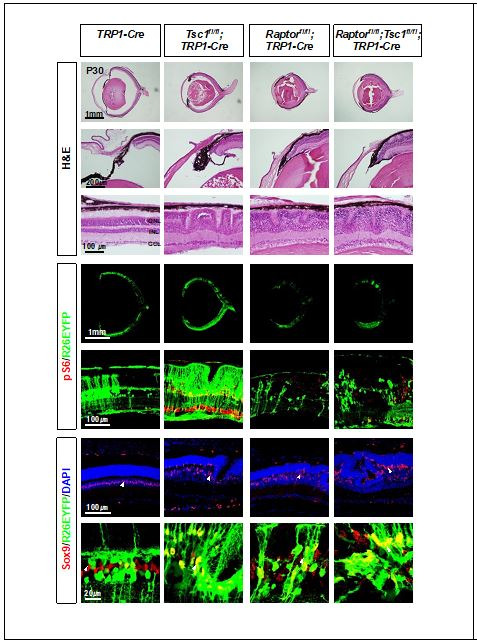
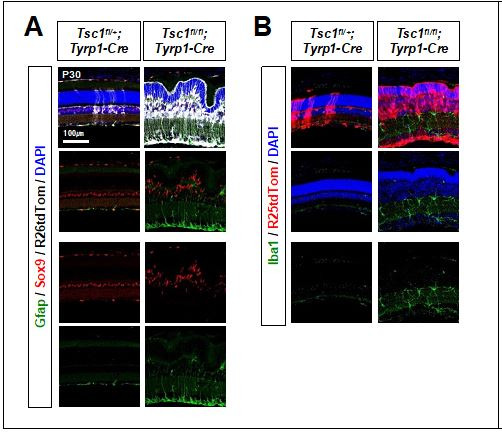
Figure 5. Mitotic aging and senescence of tuberous sclerosis complex 1 (Tsc1)-deficient retinal cells.
(A) Telomere lengths of the retinal cells, which were isolated from P30 Tsc1fl/+ and Tsc1fl/fl mice with the indicated Cre drivers, were compared with that of control sample, and relative values are shown in the graph. Error bars denote SD. Numbers of samples analyzed are shown in the graph. All samples were obtained from independent litters. **p < 0.01; n.s., not significant. (B) Telomere lengths of the FACS-isolated retinal cells from P14 Tsc1fl/+;Tyrp1-Cre and Tsc1fl/fl;Tyrp1-Cre littermate mice were compared with that of control sample, and their relative values are shown in the graph. *p < 0.05; ***p < 0.001. (C) Senescence markers (β-gal, p53, p21, and c-Myc) expressed in the corresponding P30 Tsc1fl/+;Cre and Tsc1fl/fl;Cre mouse retinas were detected by Western blot (WB). Relative amounts of the proteins used in each sample were determined by WB detection of β-actin. (D) Expression of senescence markers (β-gal and p53) in the MG was determined by co-immunostaining with an MG marker, Sox9. The cells experienced Cre-mediated recombination were also visualized by R26tdTom reporter. Images in the right columns are the magnified versions of the boxed areas indicated by corresponding numbers in the low magnification images. (E) Sox9-positive MG, Pax6-positive amacrine cell (AC), and Vsx2-positive bipolar cell (BC) populations that express the senescence markers were determined and shown in the graph (Pax6 and Vsx2 staining images are provided in Figure 5—figure supplement 4). Number of samples analyzed are shown in the graph (five independent litters). n.d., not detected. (F) Eye and retinal structures of P30 Rptorfl/+;Tyrp1-Cre and Rptorfl/fl;Tyrp1-Cre mice were investigated by hematoxylin and eosin (H&E) staining of the eye sections. Distribution of the Cre-affected cells and mTORC1 activation of the cells were examined by the immunostaining of R26tdTom and pS6, respectively. (G) R26tdTom-positive Cre-affected cell population in the mouse retinas were quantified by FACS and shown in the graph. ****p < 0.0001. (H) Telomere lengths of unsorted (whole retina) and the FACS-isolated retinal cells from P14 Rptorfl/+;Tyrp1-Cre and Rptorfl/fl;Tyrp1-Cre mice were compared with that of control sample and their relative values are shown in the graph. Number of samples analyzed are shown in the graph. *p < 0.05. (I) Relative levels of senescence markers and mTORC1 pathway components of the mouse retinas were analyzed by WB. (J) Distribution of the cells expressing senescence markers and R26tdTom Cre reporter in the retinas was also examined by immunostaining.

Figure 5—figure supplement 1. Telomere shortening in developing mouse retina.

Figure 5—figure supplement 2. Telomerase overexpression could not rescue the phenotypes in Tsc1fl/fl;Tyrp1-Cre mouse retinas.

Figure 5—figure supplement 3. Expression of senescence markers in the postnatal tuberous sclerosis complex 1 (Tsc1)- and Tsc2-conditional knock-out (cko) mouse retinas.

Figure 5—figure supplement 4. Senescence is not evident in amacrine cells (ACs) and bipolar cells (BCs) of Tsc1fl/fl;Tyrp1-Cre mouse retina.

To examine whether telomere shortening was an autonomous event of Tsc1-deficient cells, we next compared the telomere lengths of FACS-isolated wild-type and Tsc1-deficent cells in the same Tsc1fl/fl;Tyrp1-Cre mouse retinas. We found that the telomeres in R26tdTom-positive Tsc1-deficient cells of P14 Tsc1fl/fl;Tyrp1-Cre mouse retinas were significantly shorter than those in R26tdTom-negative neighboring wild-type cells (Figure 5B). The accelerated telomere shortening was also observed in the neurospheres derived from Tsc1-deficent RPCs, which were cultured homogenously or together with wild-type neurospheres (Figure 4—figure supplement 3F). These results suggest that Tsc1 deletion had autonomous effects on telomere shortening.
Senescence-associated cell death of MG in hyperexpanded Tsc1-deficient retinal clones
Extensive telomere shortening can cause mitotic catastrophe and subsequent cell death (Calado and Dumitriu, 2013; Shay, 2016), suggesting that the degeneration of MG in Tsc1fl/fl;Tyrp1-Cre mouse retina could be caused by telomere shortening beyond a critical length. To test this possibility, we bred Tsc1fl/fl;Tyrp1-Cre mice with Cre-d-Tert (dTert) transgenic mice, which express mouse Tert cDNA in Cre-affected cells (Hidema et al., 2016), to recover telomeres in Tsc1-deficient retinal cells (Figure 5—figure supplement 2C). However, MG degeneration and retinal rosettes were still observed in Tsc1fl/fl;Tyrp1-cre;dTert mouse retinas (Figure 5—figure supplement 2A and B). This suggests that telomere shortening is unlikely a direct cause of MG degeneration in Tsc1fl/fl;Tyrp1-Cre mice.
The more cells divide the more damage accumulates, resulting in senescence-associated cell death (Shay, 2016). We found that markers of senescence, including β-galactosidase (β-gal), transformation-related protein 53 (Trp53, p53), p21 cyclin-dependent kinase inhibitor 1 A (p21Cip1, p21), and c-Myc (Kuilman et al., 2010), were detected in P30 Tsc1fl/fl;Tyrp1-Cre mouse retinas but not in Tsc1fl/+;Tyrp1-Cre littermate mouse retinas (Figure 5C; Figure 5—figure supplement 3A). Furthermore, β-gal and p53 were enriched more in R26tdTom-positive Tsc1-deficient MG (Figure 5; Figure 5—figure supplement 4), which degenerated to form the retinal rosettes (Figure 1C,D), than in R26tdTomato-positive Tsc1-deficient AC (Pax6-positive) and BC (Vsx2-positive) populations, which remained intact in the retinas (Figure 1D; Figure 1—figure supplement 2A). The senescence markers were also increased in Tsc2fl/fl;Tyrp1-Cre mouse retinas (Figure 5—figure supplement 3B), suggesting that the retinal senescence occurred in an mTORC1-dependent manner. In contrast, the senescence markers were not detectable in Tsc1fl/fl;Rax-Cre, Tsc1fl/fl;Chx10-Cre, and Tsc1fl/fl;Pax6-aCre mouse retinas (Figure 5C), suggesting a positive relationship between RPC clonal expansion power and senescence.
In contrast to the accelerated cell cycle progression of Tsc1-deficient RPCs, mouse RPCs lacking Rptor (regulatory-associated protein of mTOR), a key component of mTORC1 (Kim et al., 2002), were found to exit the cell cycle precociously (Choi et al., 2018). Consequently, the Rptor-deficient RPCs failed to expand, resulting in the compression of R26tdTom-positive Rptor-deficient clones in Rptorfl/fl;Tyrp1-Cre mouse retinas compared to those in Rptorfl/+;Tyrp1-Cre littermate mouse retinas (Figure 5F and G). These results suggest that retinal cells derived from the Rptor-deficient RPCs might be mitotically younger than neighboring wild-type cells in the Rptorfl/fl;Tyrp1-Cre mouse retinas.
Thus, we compared the relative telomere lengths of FACS-isolated Rptor-deficient cells and wild-type cells in the same retinas. We found that R26tdTom-positive Rptor-deficient cells of P14 Rptorfl/fl;Tyrp1-Cre mouse retinas had longer telomeres than R26tdTom-negative wild-type neighbors and R26tdTom-positive Rptor-heterozygote cells of Rptorfl/+;Tyrp1-Cre littermate mouse retinas (Figure 5H). However, we did not observe a significant difference in the telomere lengths of R26tdTom-negative wild-type cells in Rptorfl/fl;Tyrp1-Cre and Rptorfl/+;Tyrp1-Cre littermate mouse retinas, suggesting that there was no compensatory overproliferation of wild-type RPCs after the depletion of Rptor-deficient RPCs in Rptorfl/fl;Tyrp1-Cre mouse retinas. There was also no increase in the senescence markers in Rptorfl/fl;Tyrp1-Cre mouse retinas, either (Figure 5I and J). Together, our results suggest that senescence occurs in retinas where RPCs have exceeded their division limits, as seen in Tsc1fl/fl;Tyrp1-Cre mice, but not in retinas where RPCs have not reached the limits, as seen in the other Tsc1-cko and Rptorfl/fl;Tyrp1-Cre mice.
Hif1a is necessary for the hyperexpansion of Tsc1-deficient retinal clones
We next sought for the strategies to suppress the RPC overproliferation that led to the clonal hyperexpansion of Tsc1-deficient cells and consequent degeneration of MG in Tsc1fl/fl;Tyrp1-Cre mouse retinas. We previously showed that mTORC1 induces immunoproteasomes to increase the turnover of cyclins and thereby accelerate RPC cell cycle progression (Choi et al., 2018). We thus deleted the three catalytic subunit genes, proteasome subunit beta 8, 9, and 10 (Psmb8,9,10), to eliminate the contribution of immunoproteasomes to the mTORC1-induced mitotic acceleration of Tsc1-deficient mouse RPCs (Figure 6—figure supplements 1 and 2B). We found that retinal rosettes were absent from approximately a quarter of in Psmb8-/-,9-/-,10-/- (Psmb-tko);Tsc1fl/fl;Tyrp1-Cre mouse retinas, and R26tdTom-positive Tsc1-deficient retinal clone size was decreased in comparison with that of Tsc1fl/fl;Tyrp1-Cre mouse retinas (Figure 6—figure supplement 2A [rightmost column] and 2C). However, retinal rosettes and Tsc1-deficient retinal clonal expansion were still observed in about three-quarters of Psmb-tko;Tsc1fl/fl;Tyrp1-Cre mouse retinas (Figure 6—figure supplement 2A [second rightmost column] and 2C). These results suggest that there are additional regulator(s) of mTORC1-induced RPC clonal expansion, in addition to the immunoproteasomes.
In parallel to promoting protein degradation via the immunoproteasomes, mTORC1 also enhances the synthesis of many cellular proteins by activating S6 via S6K1 and by directly inactivating eukaryotic translation initiation factor 4E-binding protein 1 (Ben-Sahra and Manning, 2017; Saxton and Sabatini, 2017). Hif1a is among the proteins subjected to mTORC1-induced translational upregulation (Bernardi et al., 2006); it, in turn, induces the expression of various target genes to support mTORC1-induced cell proliferation, growth, and survival (Keith et al., 2011). We also found that the level of Hif1a, but not the level of its homolog, Hif2a, was significantly increased in Tsc1fl/fl;Tyrp1-Cre mouse retinas (Figure 6A). To investigate whether mTORC1 mediated Hif1a to generate the observed phenotypes, we deleted Hif1a concomitantly with Tsc1 in Tsc1fl/fl;Hif1afl/fl;Tyrp1-Cre mice. We found that 96% of Tsc1fl/fl;Hif1afl/fl;Tyrp1-Cre mouse retinas did not have rosette structures and MG cell loss (Figure 6B [third row] and C). R26tdTom-positive Cre-affected cell population was also decreased significantly in Tsc1fl/fl;Hif1afl/fl;Tyrp1-Cre mouse retinas compared to Tsc1fl/fl;Tyrp1-Cre littermate mouse retinas (Figure 6B [second row] and D), suggesting that the hyperexpansion of Tsc1-deficient cell clones was suppressed in these retinas. Furthermore, the telomere lengths of Tsc1fl/fl;Hif1afl/fl;Tyrp1-Cre mouse retinal cells were increased relative to those of Tsc1fl/fl;Tyrp1-Cre littermate mouse retinal cells (Figure 6E). The levels of the senescence markers induced in degenerating Tsc1fl/fl;Tyrp1-Cre mouse retinas were also decreased significantly in Tsc1fl/fl;Hif1afl/fl;Tyrp1-Cre mouse retinas (Figure 6A and B [two bottom rows]). These results suggest that Hif1a is necessary for the clonal hyperexpansion of Tsc1-deficient cells and the subsequent mitotic aging and senescence-associated degeneration of MG in Tsc1fl/fl;Tyrp1-Cre mouse retina.
Figure 6. Rescue of Tsc1fl/fl;Tyrp1-Cre mouse retinal phenotypes by concomitant deletion of hypoxia-induced factor 1-alpha (Hif1a).
(A) Levels of senescence markers in P30 mouse retinas with indicated genotypes were analyzed by Western blot (WB). Relative amounts of proteins used in each sample were determined by WB detection of β-actin. (B) Distributions of mTORC1-active cells, which are positive to pS6, MG, which are positive to Sox9, and senescent cells, which are positive to β-gal and p53, were examined by immunostaining of the eye sections. Expression of those markers in the Cre-affected cells were determined by comparing the expression of the Cre reporter R26tdTom. (C) Numbers of Sox9-positive MG in the mouse retinas were counted and the relative numbers are shown in the graph. (D) R26tdTom-negative wild-type cells and R26tdTom-positive Cre-affected cells in the retinas were determined byFACS and shown in the graph. (E) The lengths of telomeres of the cells isolated from P30 mouse retinas with the indicated genotypes were compared with that of control sample, and their relative values are shown in the graph. Error bars denote SD. Numbers of samples analyzed are shown in the graphs. n.s., not significant; *p < 0.05; **p < 0.01; ***p < 0.001.

Figure 6—figure supplement 1. CRISPR/Cas9 gene targeting of mouse proteasome subunit beta 8, 9, and 10 (Psmb8,9,10) genes.

Figure 6—figure supplement 2. Immunoproteasome deficiency rescues the retinal phenotypes of Tsc1fl/fl;Tyrp1-Cre mice incompletely.

Hif1a supports the accelerated cell cycle progression of Tsc1-deficient RPCs
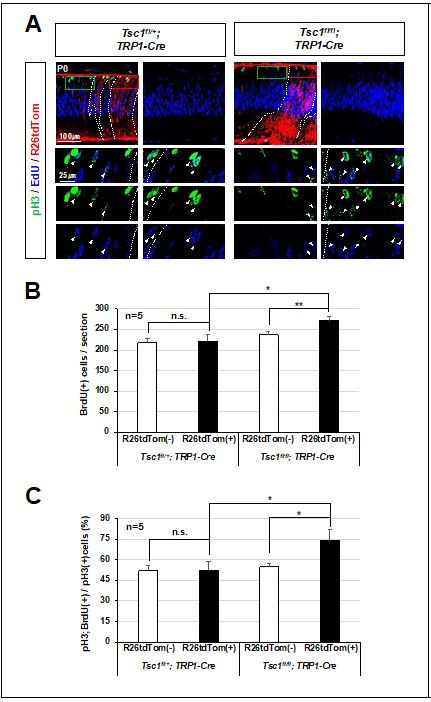
We next investigated whether Hif1a supports the overproliferation of Tsc1-deficient RPCs and thus the hyperexpansion of Tsc1-deficient retinal clones. We measured the numbers of proliferating cells that incorporated a thymidine analog 5-ethynyl-2′-deoxyuridine (EdU) during S-phase of the cell cycle and then progressed to G2/M-phases by accumulating phosphorylated histone H3 (pH3) or incorporated two thymidine analogs, 5-chloro-2'-deoxyuridine (CldU) and 5-iodo-2'-deoxyuridine (IdU), serially in their first and second S-phases (Figure 7A). We found that the numbers of EdU;pH3-positive and CldU;IdU-positive RPCs were significantly elevated in P0 Tsc1fl/fl;Tyrp1-Cre mouse retinas in comparison to those in Tsc1fl/+;Tyrp1-Cre littermate mouse retinas (Figure 7A [third and seventh rows] and C). The numbers of EdU;Otx2-positive cells, which exited the cell cycle for differentiation to PRs in 12 hr, were also increased in the Tsc1fl/fl;Tyrp1-Cre mouse retinas (Figure 7A [fifth row] and C). Consequently, the sizes of R26tdTom-positive Tsc1-deficient cells in P0 Tsc1fl/fl;Tyrp1-Cre mouse retinas were significantly increased compared to those of R26tdTom-positive Tsc1-heterozygous retinal cells in Tsc1fl/+;Tyrp1-Cre littermates (Figure 7A [top row] and B). However, the numbers of proliferating cells and the sizes of R26tdTom-positive Tsc1-deficient clones were decreased significantly in P0 Tsc1fl/fl;Hif1afl/fl;Tyrp1-Cre littermate mouse retinas (Figure 7A [right most columns] - C). These results therefore suggest that Hif1a is necessary for the accelerated cell cycle progression of Tsc1-deficient mouse RPCs and consequent expansion of Tsc1-deficient retinal clones.
Figure 7. Hif1a supports mTORC1-induced retinal progenitor cell (RPC) proliferation through the expression of glycolytic enzymes.
(A) The Cre-affected cells in P0 mouse retinas with the indicated genotypes were visualized by R26tdTom Cre reporter. Distribution of mTORC1-active cells in the boxed areas was also examined by immunostaining of pS6 and shown in the second row. Proliferation and cell cycle progression of RPCs in the mouse retinas were also examined by 5-ethynyl-2′-deoxyuridine (EdU)/5-chloro-2'-deoxyuridine (CldU) labeling and chasing experiments as described in Materials and methods. (B) R26tdTom-positive Cre-affected cell population in the mouse retinas were quantified by FACS and shown in the graph. Error bars, SD. Numbers of samples analyzed are shown in the graph (four independent litters). (C) RPCs that had progressed from S-phase to G2/M-phase for 3 hr (EdU;pH3-positive); PRs that had been born for 12 hr (EdU;Otx2-positive); and RPCs that had reentered cell cycle for 15 hr (CldU;IdU-positive) in the mouse retinas were counted and shown in the graph. Error bars denote SD (n = 5, five independent litters). *p < 0.05; **p < 0.01; ***p < 0.001; ****p < 0.0001. (D) Relative mRNA levels of Hif1a, hexokinase 2 (Hk2), and pyruvate kinase M2 (Pkm2) in P0 mouse retinas with the indicated genotypes were examined by real-time quantitative polymerase chain reaction (RT-qPCR). The y-axis values are relative 2-ΔCt values against those of Tsc1fl/+;Tyrp1-Cre mouse retinas. Error bars, SD (n = 4, three independent litters). (E) Expressions of the indicated proteins in the mouse retinas were examined by Western blot (WB). Relative amounts of the proteins used in each sample were determined by WB detection of β-actin. (F) Relative WB band intensities of the proteins are determined by the ImageJ software and shown in the graph. Error bars, SD (n = 3, three independent litters). (G) Distributions of Pkm2, Tom20, and hypoxyprobe-labeled proteins in the mouse retinas were examined by immunostaining. (H) P0 Tsc1fl/fl;Tyrp1-Cre littermate mice were injected with a chemical inhibitor of glycolysis (2DG) or mitochondrial oxidative phosphorylation (Metformin), and the eye sections of the mice were obtained at 12 hr post-injection for the immunodetection of RPCs that had proliferated (CldU-positive) and/or reentered second cell cycle (CldU;IdU-positive) for 15 hr. Relative numbers of those cells in the mouse retinas were shown in the graphs in (I) and (J), respectively. Error bars, SD (n = 5, four independent litters). (K) Schematic diagram depicts the mTORC1-Hif1a-glycolysis cascade in developmental RPC clonal hyperexpansion, which leads to senescence-associated degeneration of MG in the mature retina.

Figure 7—figure supplement 1. Enhanced glycolytic ATP synthesis in Tsc1fl/fl;Tyrp1-Cre mouse retinas.

Hypoxia and induction of Hif1a in Tsc1fl/fl;Tyrp1-Cre mouse retinas
We found that the level of Hif1a protein, but not that of Hif1a mRNA, was increased significantly in P0 Tsc1fl/fl;Tyrp1-Cre mouse retinas (Figure 7D and E). Hif1a is known to be accumulated under hypoxia by being resistant from proteasomal degradation (Ivan et al., 2001; Jaakkola et al., 2001). Therefore, Hif1a elevation could result from mTORC1-induced translational upregulation and/or hypoxia. We, thus, examined whether a hypoxic condition was established in the mouse retinas using the hypoxyprobe (Varghese et al., 1976), and found that P0 Tsc1fl/fl;Tyrp1-Cre mouse retinas were more hypoxic than Tsc1fl/+;Tyrp1-Cre littermate retinas (Figure 7E and G [bottom row images]). Interestingly, although hypoxia can compromise mitochondrial ATP synthesis (Vander Heiden et al., 2009), the level of ATP was significantly elevated in P0 Tsc1fl/fl;Tyrp1-Cre mouse retinas compared to that in Tsc1fl/+;Tyrp1-Cre littermate control retinas, and it returned to the control level in P0 Hif1afl/fl;Tsc1fl/fl;Tyrp1-Cre mouse retinas (Figure 7—figure supplement 1A). These results suggest that Tsc1-deficient RPCs mediate Hif1a to supply the ATP, which is necessary for their accelerated cell cycle progression and cell growth under the hypoxic condition of Tsc1fl/fl;Tyrp1-Cre mouse retinas.
Hif1a-induced glycolytic gene expression is necessary for the proliferation of Tsc1-deficient RPCs
It is known that glycolysis plays important roles in cellular ATP synthesis under hypoxia (Cerychova and Pavlinkova, 2018). Consistent with this, the level of lactate, which accumulates when glycolysis occurs in a condition of inefficient mitochondrial respiration (Cerychova and Pavlinkova, 2018), was significantly elevated in P0 Tsc1fl/fl;Tyrp1-Cre mouse retinas compared to Tsc1fl/+;Tyrp1-Cre littermate mouse retinas, but not in Hif1afl/fl;Tsc1fl/fl;Tyrp1-Cre littermate mouse retinas (Figure 7—figure supplement 1B). This suggests that Hif1a is necessary for the enhanced glycolysis observed in Tsc1fl/fl;Tyrp1-Cre mouse retinas.
We further examined whether Hif1a contributes to glycolytic ATP synthesis in Tsc1-deficient cells by inducing the expression of the glycolytic enzymes, such as hexokinase 2 (Hk2) and pyruvate kinase M2 (Pkm2), which are transcriptional targets of Hif1a (Düvel et al., 2010). We found that the mRNA and protein levels of those glycolytic enzymes were significantly elevated in P0 Tsc1fl/fl;Tyrp1-Cre mouse retinas compared to Tsc1fl/+;Tyrp1-Cre littermate retinas (Figure 7D-F). The enzyme levels in P0 Tsc1fl/fl;Hif1afl/fl;Tyrp1-Cre mouse retinas were decreased and became similar to those in P0 Tsc1fl/+;Tyrp1-Cre mouse retinas. Our findings suggest that Hif1a plays a critical role in elevating these glycolytic enzymes in Tsc1fl/fl;Tyrp1-Cre mouse retinas.
Next, to delineate the causal relationship between glycolysis and the hyperproliferation of Tsc1-deficient RPCs, we injected 2-deoxy-D-glucose (2DG), a chemical inhibitor of glycolysis (Wick et al., 1957), or metformin, a chemical inhibitor of the mitochondrial respiratory chain I (Owen et al., 2000) and/or glycerophosphate dehydrogenase in the mitochondrial electron transport chain (Madiraju et al., 2014), to P0 Tsc1fl/+;Tyrp1-Cre and Tsc1fl/fl;Tyrp1-Cre mice. We found that 2DG treatment decreased the lactate level in Tsc1fl/+;Tyrp1-Cre mouse retinas while metformin increased this parameter (Figure 7—figure supplement 1C). Moreover, the lactate level in 2DG-treated Tsc1fl/fl;Tyrp1-Cre became similar to that of PBS-treated Tsc1fl/+;Tyrp1-Cre mouse retinas, suggesting that the lactate accumulation in Tsc1fl/fl;Tyrp1-Cre was caused by enhanced glycolysis. We also found that not only total numbers of CldU-labeled proliferating RPCs but also those that had reentered the cell cycle (assessed by monitoring the incorporation of IdU, such that the cells were CldU;IdU-positive) were decreased significantly in 2DG-treated Tsc1fl/fl;Tyrp1-Cre mouse retinas in comparison to the numbers in the PBS- and metformin-injected groups and became similar numbers observed in Tsc1fl/+;Tyrp1-Cre littermate mouse retinas (Figure 7H-J). These results suggest that Tsc1-deficient RPCs depend on glycolysis for their accelerated cell cycle progression.
Collectively, our results suggest that mTORC1 increases the cellular Hif1a protein level through both translational and post-translational mechanisms in the RPCs of Tsc1fl/fl;Tyrp1-Cre mouse retinas by generating a hypoxic condition. This elevated Hif1a facilitates the expression of glycolytic enzymes to supply the ATP necessary for RPC proliferation (Figure 7K). This enables the RPCs to expand rapidly to exceed their mitotic division limit prior to producing the MG, which degenerate from senescence-associated cell death in mature Tsc1fl/fl;Tyrp1-Cre mouse retina.
Discussion
The growth and differentiation of vertebrate nervous tissues are tightly controlled in specific spatial and temporal manners to ensure the proper formation of their unique three-dimensional structures. During the growth of the double-layered optic cup of vertebrates, cell proliferation is significantly faster at the inner cup layer compared to the outer cup layer (Moon et al., 2018). Here, we detected mTORC1 activity only in the inner optic cup layer (Figure 1—figure supplement 1), suggesting that mTORC1 may involve in the spatially differentiated growth of the optic neuroepithelial continuum. In support of this, hamartomatous malformation of the CB and iris were reported in human TSC patients and in mice lacking Tsc1 throughout the optic cup (Eagle et al., 2000; Hägglund et al., 2017; Milea and Burillon, 1997). We also found CB/iris malformation in Tsc1fl/fl;Rax-Cre mice, in which Tsc1 was lost throughout the optic neuroepithelium, and in Tsc1fl/fl;Tyrp1-Cre mice, in which Tsc1 was lost in the RPE, CM, and peripheral retinal clones. In contrast, we did not observe CB/iris defects in mice lacking Tsc1 only in the retina (i.e., Tsc1fl/fl;Chx10-Cre mice) and RPE (i.e., Tsc1fl/fl;Mlana-Cre mice) (Figure 3A). This suggests that TSC plays an essential role in the CM to generate the CB and iris by suppressing the growth of the areas. However, the deletion of Tsc2 from the RPE and CM of Tsc2fl/fl;Tyrp1-Cre mice did not cause CB/iris malformations, although the mice shared the retinal phenotypes of Tsc1fl/fl;Tyrp1-Cre mice (Figure 1—figure supplement 4). These results suggest that Tsc1 regulates CB and iris development independent of the mTORC1 pathway. Given reported findings that Tsc1 functions in the tumor growth factor β (TGFβ)-Smad pathway (Thien et al., 2015) and the activation of this pathway in mouse CB (Srinivasan et al., 1998), we speculate that Tsc1 might contribute to CB and iris development via the TGFβ-Smad pathway. In parallel, we show Tsc1 also cooperates with Tsc2 to suppress mTORC1 in CM RPCs, whose cell division rate should be maintained at low to avoid of precocious arrival of the RPCs to the division limit. Collectively, these results suggest that Tsc1 is a multifunctional regulator of vertebrate eye development.
Our data suggest that the deletion of Tsc1 in a small RPC subset derived from the CM can cause the degenerative phenotypes in the mature retina (Figure 1). The CM RPCs in mouse retina were found to proliferate less robustly than the majority RPCs in the central retina (Belanger et al., 2017; Marcucci et al., 2016), so did the RPCs in lower vertebrate CMZ (Harris and Perron, 1998). However, the CM RPCs could have a competitive advantage for clonal expansion over the majority wild-type RPCs, which divide and expand slowly, when their cell cycle progression is accelerated by losing Tsc1 (Figure 4—figure supplement 4). This made the Tsc1-deficient RPCs divide exceeding the division limit and cause the degenerative phenotypes in Tsc1fl/fl;Tyrp1-Cre mouse retinas. The competitive hyperexpansion of a Tsc1-deficient RPC exceeding the division limit did not occur in Tsc1fl/fl;Rax-Cre and Tsc1fl/fl;Chx10-Cre mouse retinas, since its neighboring RPCs also lose Tsc1 and expand as fast as the RPC (Figures 4C and 5A; Figure 4—figure supplement 4). Therefore, Tsc1-deficient RPCs should be present in a minor population to have a competitive advantage in the clonal expansion.
The competitive clonal expansion could also occur in other conditions, where two RPC populations expand at different speeds. The Rptorfl/fl;Tyrp1-Cre mouse retina, which is composed of relatively fast dividing wild-type RPCs and slowly dividing (or cell cycle arrested) Rptor-deficient RPCs, could be an example. However, wild-type RPCs in the Rptorfl/fl;Tyrp1-Cre mouse retina did not overproliferate even though their neighboring Rptor-deficient RPCs stopped expanding their clones (Figure 5F–J). Therefore, the overproliferation might be a specific feature of Tsc1-deficient RPC but not a relative property obtained by the division differences.
The MG are among the last-born retinal cell types, arising around the first postnatal week in mice (Cepko, 2014; Hoang et al., 2020). Therefore, given the specific temporal sequence of retinal histogenesis, RPCs producing MG are likely to be mitotically older than those producing other retinal cell types. Since Tsc1-deficient RPCs overproliferate during the embryonic and early postnatal periods (Figure 4E), the mitotic ages of Tsc1-deficient RPCs in Tsc1fl/fl;Tyrp1-Cre mice should be far greater than those of wild-type RPCs when they are producing MG. Consequently, the MG born from Tsc1-deficient RPCs might be degenerated due to aging-related changes (Figure 5D and E). However, we found little MG degeneration or rosette formation in the retinas of old (2 years) wild-type C57BL/6J mice (data not shown), suggesting that the phenotypes of Tsc1fl/fl;Tyrp1-Cre and Tsc2fl/fl;Tyrp1-Cre mouse retinas are not simple aging-related changes.
Among the last-born retinal cell types, only MG exhibited significant degeneration in Tsc1fl/fl;Tyrp1-Cre mouse retina (Figure 1D). The MG might be in less terminal stage than the other last-born types (i.e., rPR and BC) in terms of differentiation, since they can resume cell cycle to regenerate neurons in the injured cold-blooded vertebrate retinas (Lahne et al., 2020). Mouse MG could also divide after the injury, if histone deacetylase inhibitor is provided after viral expression of a proneural transcription factor achaete-scute homolog 1 (Jorstad et al., 2017). Furthermore, given the fact that developing cells are more sensitive than terminally differentiated cells to cell death (Fuchs and Steller, 2011; Vaux and Korsmeyer, 1999), MG are likely more sensitive to the cell death than rPR and BC. However, the mechanisms underlying the differential apoptotic sensitivity of these last-born retinal cell types should be investigated in future studies.
The factors responsible for inducing the death of Tsc1-deficient RPCs and/or MG in Tsc1fl/fl;Tyrp1-Cre mouse retinas remain unclear. The repetitive division of RPCs might exploit telomeres beyond the critical limit and result in mitotic catastrophe, leading to senescence-associated cell death (Cleal and Baird, 2020). However, telomere shortening did not appear to be a direct cause of MG degeneration in the mouse retinas, since it was not suppressed by Tert overexpression (Figure 5—figure supplement 2). Furthermore, unlike the strong relationship between telomere shortening and senescence in human cells, telomere shortening in mouse cells is rarely associated with deleterious effects because the mouse telomere is 5–10 times longer than the human telomere (Calado and Dumitriu, 2013). Therefore, the senescence observed in Tsc1fl/fl;Tyrp1-Cre mouse retina might be caused by other cellular alterations associated with the RPC overproliferation.
The activation of mTORC1 by Tsc1 deletion was also shown to cause premature aging in mouse intestinal stem cells (ISCs) (He et al., 2020). The aging of Tsc1-deficient ISCs was reported to mediate the stress-induced p38 mitogen-activated protein kinase (MAPK) pathway, which activates p53 to block ISC proliferation. We also observed the activation (i.e., phosphorylation) of p38 MAPK in all four Tsc1-cko mouse retinas (data not shown), whereas senescence occurred only in Tsc1fl/fl;Tyrp1-Cre mouse retinas (Figure 5C). The activation of p53 did not likely cause degeneration of Tsc1-deficient RPCs and/or MG, either, since Trp53fl/fl;Tsc1fl/fl;Tyrp1-Cre mice still exhibited MG degeneration and retinal rosette formation (data not shown). Therefore, the activations of p38 MAPK and p53 may represent a cellular stress condition induced by mTORC1 hyperactivation, which increases cellular metabolism to elevate reactive oxygen species as byproducts (Ben-Sahra and Manning, 2017), but do not appear to trigger the senescence-associated cell death in Tsc1fl/fl;Tyrp1-Cre mouse retinas. A previous study further showed that intestinal epithelial cells (IECs) derived from Tsc1-deficient ISCs were degenerated via receptor interacting protein kinase 3 (Ripk3)-mediated necroptosis (Xie et al., 2020). However, in contrast to the critical roles of Ripk3 in the degeneration of Tsc1-deficient IECs, the MG degeneration in Tsc1fl/fl;Tyrp1-Cre mice was not blocked by concomitant deletion of Ripk3 (data not shown). These results suggest that the mechanism of MG degeneration in Tsc1fl/fl;Tyrp1-Cre mice might be different from the stress-induced aging and degeneration of IECs, and thus further investigation is warranted.
Embryonic and neonatal mouse retinas receive oxygen that diffuses from the distant hyaloid vessels in the vitreous and the choroid vessels across the RPE, whereas the mature mouse retina has close access to the oxygen released from intraretinal blood vessels (Lutty and McLeod, 2018; Saint-Geniez and D’amore, 2004). RPCs in the inner embryonic mouse retinas are farthest from the vessels, and are likely to exist under more hypoxic conditions than cells adjacent to the vitreous and RPE. The inner RPCs therefore might adapt to use glycolysis ATP synthesis than oxygen-dependent mitochondrial ATP synthesis for proper proliferation, as has been suggested for Xenopus retina (Agathocleous et al., 2012). Furthermore, Tsc1-deficient RPCs might spend more ATP for fast growth and division, compared to wild-type RPCs (Figure 7—figure supplement 1A), making their mitochondria utilize more oxygen to supply ATP. This is expected to worsen the hypoxia of Tsc1fl/fl;Tyrp1-Cre mouse RPCs and thereby compromise their mitochondrial ATP production eventually. In this situation, glycolytic ATP synthesis compensates for the ATP shortage in hypoxic Tsc1-deficient RPCs through the mTORC1-induced enhanced translation and stabilization of Hif1a, which, in turn, increases the expression of glycolytic enzymes (Figure 7D–F). The glycolytic gene expression is therefore decreased in the absence of Hif1a, such that ATP cannot be produced at a level sufficient to support mTORC1-induced cell proliferation and growth. This might decelerate the growth and proliferation of Tsc1-deficient RPCs and normalize the speed of retinal development.
Materials and methods
Key resources table.
| Reagent type (species) or resource | Designation | Source or reference | Identifiers | Additional information |
|---|---|---|---|---|
| Antibody | Anti-Aquaporin(AQP1)(Mouse monoclonal) | Novus Biologicals | NB600-749 | IHC (1:200) |
| Antibody | Anti-beta-actin(Rabbit polyclonal) | Santa Cruz Biotechnology | sc-1616 | WB (1:1000) |
| Antibody | Anti-beta-catenin(Rabbit polyclonal) | Cell Signaling Technology | 9562 | IHC (1:200) |
| Antibody | Anti-beta-galactosidase(Mouse monoclonal) | Developmental Studies Hybridoma Bank (DSHB) | JIE7 | WB (1:500)IHC (1:100) |
| Antibody | Anti-BrdU(CldU)(Rat monoclonal) | Novus Biologicals | NB500-169 | IHC (1:200) |
| Antibody | Anti-BrdU(IdU)(Mouse monoclonal) | EXBIO | 11–286 C100 | IHC (1:200) |
| Antibody | Anti-Brn3b(Rabbit polyclonal) | Santa Cruz Biotechnology | sc-31989 | IHC (1:200) |
| Antibody | Anti-Calbindin(Rabbit polyclonal) | Swant Inc. | CB-38 | IHC (1:200) |
| Antibody | Anti-Cdo(Goat polyclonal) | R&D Systems | AF2429 | IHC (1:200) |
| Antibody | Anti-c-myc(Mouse monoclonal) | Santa Cruz Biotechnology | sc40 | WB (1:1000) |
| Antibody | Anti-Cleaved caspase-3(Rabbit polyclonal) | Cell Signaling Technology | 9661 | IHC (1:200) |
| Antibody | Anti-Ezrin(Mouse monoclonal) | Invitrogen Biotechnology | 35–7300 | IHC (1:200) |
| Antibody | Anti-GFAP(Rabbit polyclonal) | Abcam | ab48050 | IHC (1:200) |
| Antibody | Anti-GFP(Chicken polyclonal) | Abcam | ab13970 | IHC (1:2000) |
| Antibody | Anti-Glutamine synthase (Rabbit polyclonal) | Sigma-Aldrich | G-2781 | IHC (1:200) |
| Antibody | Anti-Hif1a(Mouse monoclonal) | R&D Systems | MAB1536 | WB (1:1000) |
| Antibody | Anti-Hif2α/Epas1(Rabbit polyclonal) | Novus Biologicals | NB100-122 | WB (1:1000) |
| Antibody | Anti-Hk2(Rabbit polyclonal) | Cell Signaling Technology | 2867 | WB 1:1,000IHC (1:200) |
| Antibody | Anti-Hydroxy-Hif1alpha(Rabbit polyclonal) | Cell Signaling Technology | 3434 | WB (1:1000) |
| Antibody | Anti-M-opsin | Merck Millipore | AB5405 | IHC (1:200) |
| Antibody | Anti-Otx2(Rabbit polyclonal) | Abcam | ab25985 | IHC (1:200) |
| Antibody | Anti-Otx2(Rabbit polyclonal) | Abcam | ab183951 | IHC (1:200) |
| Antibody | Anti-Otx2(Goat polyclonal) | R&D Systems | AF1979-SP | IHC (1:200) |
| Antibody | Anti-p21/Cip1(Mouse monoclonal) | Santa Cruz Biotechnology | SC817 | WB (1:1000)IHC (1:200) |
| Antibody | Anti-p53(Mouse monoclonal) | Merck Millipore | OP03-100 | WB (1:1000)IHC (1:200) |
| Antibody | Anti-Pax6(Rabbit polyclonal) | Covance | PRB-278P | IHC (1:200) |
| Antibody | Anti-Phospho Smad1/5(S463/465)(Rabbit polyclonal) | Invitrogen Biotechnology | 700047 | IHC (1:200) |
| Antibody | Anti-phospho Smad2(ser465/467)(Rabbit polyclonal) - | Cell Signaling Technology | 18338 | IHC (1:200) |
| Antibody | Anti-phospho-Histone H3(S10) (pH3; Rabbit polyclonal) | Merck Millipore | 04–1093 | IHC (1:200) |
| Antibody | Anti-phospho-S6(S235/236) (pS6; Rabbit polyclonal) | Cell Signaling Technology | 2211 | WB (1:1000)IHC (1:200) |
| Antibody | Anti-Psmb8(Mouse monoclonal) | Enzo Life Science | BML-PW8845 | WB (1:1000) |
| Antibody | Anti-Psmb9(Mouse monoclonal) | Santa Cruz Biotechnology | sc-373996 | WB (1:1000) |
| Antibody | Anti-Psmb10(Rabbit polyclonal) | Abcam | ab1183506 | WB (1:1000) |
| Antibody | Anti-Raptor(Rabbit polyclonal) | Cell Signaling Technology | 2280 | WB (1:1000) |
| Antibody | Anti-PKM2(Rabbit polyclonal) | Abgent | ap7173d | WB (1:1000) |
| Antibody | Anti-PKM2(Rabbit polyclonal) | Cell Signaling Technology | 4053 | IHC (1:200) |
| Antibody | Anti-Recoverin(Rabbit polyclonal) | Chemicon | AB5585 | WB (1:1000) |
| Antibody | Anti-RPE65(Mouse monoclonal) | Abcam | ab13826 | WB (1:1000) |
| Antibody | Anti-Rhodopsin(Mouse monoclonal) | Chemicon | MAB5356 | IHC (1:200) |
| Antibody | Anti-S6(Mouse monoclonal) | Cell Signaling Technology | 2317 | WB (1:1000) |
| Antibody | Anti-Tom20(Rabbit polyclonal) | Santa Cruz Biotechnology | sc-11415 | WB (1:1000) |
| Antibody | Anti-Tsc1(Rabbit polyclonal) | Cell Signaling Technology | 4906 | WB (1:1000) |
| Antibody | Anti-Tsc2(Rabbit polyclonal) | Cell Signaling Technology | 3612 | WB (1:1000) |
| Antibody | Anti-Tubulin-ßIII (Tuj1; Mouse monoclonal) | Covance | MMS-435P | IHC (1:200) |
| Antibody | Anti-Vsx2(Mouse monoclonal) | Santa Cruz Biotechnology | sc365519 | WB (1:1000)IHC (1:200) |
| Genetic reagent (Mus musculus) | B6.129-Hif1atm3Rsjo/J | Jackson Laboratory | 007561 | Hif1аfl/fl |
| Genetic reagent (Mus musculus) | B6.Cg-Rptortm1.1Dmsa/J | Jackson Laboratory | 013188 | Rptorfl/fl |
| Genetic reagent (Mus musculus) | Tsc1tm1Djk/J | Jackson Laboratory | 005680 | Tsc1fl/fl |
| Genetic reagent (Mus musculus) | Tsc2tm2.1Djk/Mmjax | Jackson Laboratory | 37154-JAX | Tsc2fl/fl |
| Genetic reagent (Mus musculus) | CAG-loxP-3xpolyA-loxP-mTERT-IRES-Hygro-r | Hidema et al., 2016 | dTert | |
| Genetic reagent (Mus musculus) | Tg(Tyrp1-cre)1Ipc | Mori et al., 2002 | Tyrp1-Cre | |
| Genetic reagent (Mus musculus) | Tg(Mlana-cre)5Bee | Aydin and Beermann, 2011 | Mlana-Cre | |
| Genetic reagent (Mus musculus) | Tg(Chx10-EGFP/cre,-ALPP)2Clc | Rowan and Cepko, 2004 | Chx10-Cre | |
| Genetic reagent (Mus musculus) | Tg(Pax6-cre,GFP)2Pgr | Marquardt et al., 2001 | Pax6-аCre | |
| Genetic reagent (Mus musculus) | Tg(Rax-cre)1Zkoz | Klimova et al., 2013 | Rax-Cre | |
| Genetic reagent (Mus musculus) | Tg(Slc1a3-cre/ERT)1Nat/J | Jackson Laboratory | 012586 | Slc1a3-CreERT2 |
| Genetic reagent (Mus musculus) | B6.129 × 1-Gt(ROSA)26Sortm1(EYFP)Cos/J | Jackson Laboratory | 006148 | R26EYFP |
| Genetic reagent (Mus musculus) | B6.Cg-Gt(ROSA)26Sortm14(CAG-tdTomato)Hze/J | Jackson Laboratory | 007914 | R26tdTomato |
| Genetic reagent (Mus musculus) | Tg(Tyrp1-cre/ERT2)1Jwk | This paper | Tyrp1-CreERT2 | |
| Genetic reagent (Mus musculus) | B6-Psmb8em1hwl Psmb9em1hwl/Korl | This paper | Psmb8-/-,9-/- | |
| Genetic reagent (Mus musculus) | B6-Psmb10em1Jwk | This paper | Psmb10-/- | |
| Chemical compound, drug | Phalloidin-AlexaFluor 647 | Abcam | ab176759 | 1:200 |
| Chemical compound, drug | Hoechst 33,342 | Invitrogen | H1399 | 1:1,000 |
| Chemical compound, drug | Click-iT EdU Cell Proliferation Kit for Imaging, Alexa Fluor 647 dye | Invitrogen | C10340 | |
| Chemical compound, drug | 2-Deoxy-D-glucose | Sigma-Aldrich | D6134 | |
| Chemical compound, drug | Metformin hydrochloride | Sigma-Aldrich | PHR1084 | |
| Chemical compound, drug | 2-Chloro-5-deoxyuridine (CldU) | Sigma-Aldrich | C6891 | |
| Chemical compound, drug | 5-Iodo-2′-deoxyuridine | Sigma-Aldrich | I7125 | |
| Chemical compound, drug | Methyl cellulose | Sigma-Aldrich | M7140 | |
| Chemical compound, drug | L-Glutamine | GIBCO | 25030–081 | |
| Chemical compound, drug | B27 supplement | GIBCO | 17504–044 | |
| Chemical compound, drug | N2 supplement | GIBCO | 17502–048 | |
| Chemical compound, drug | Heparin | Millipore | M535142 | |
| Chemical compound, drug | Protease inhibitor | Millipore | M535142 | |
| Peptide, recombinant protein | Dnase I | Sigma-Aldrich | DN25-100mg | |
| Peptide, recombinant protein | Epidermal growth factor (EGF) | Sigma-Aldrich | E4127 | |
| Peptide, recombinant protein | Fibroblast growth factor 2(hBFGF) | Sigma-Aldrich | F0291 | |
| Commercial assay or kit | ENLITEN ATP Assay System | Promega | FF2000 | |
| Commercial assay or kit | Lactate-Glo Assay | Promega | J5021 | |
| Commercial assay or kit | SuperSignal West Pico plus chemiluminescent substrate | Thermo Scientific | 34580 | |
| Commercial assay or kit | SuperSignal West Femto plus chemiluminescent substrate | Thermo Scientific | 34095 | |
| Commercial assay or kit | In situ Cell death Detection Kit, TMR-red | Roche | 12156792910 | |
| Commercial assay or kit | In situ Cell Death Detection Kit, Fluorescein (TUNEL green) | Roche | 11684 795910 | |
| Commercial assay or kit | Hypoxyprobe Kit | Hypoxyprobe | HP1-100kit | |
| Software, algorithm | Fluoview 4.0 | Olympus Corporation | N/A | |
| Software, algorithm | Imaris 9.3 | Bitplane | N/A | |
| Software, algorithm | GraphPad Prism v7.0 | GraphPad software | N/A | |
| Sequence-based reagent | Actinß1-forward | Bioneer | RT-qPCR primer | CTGGCTCCTAGCACCATGAAGAT |
| Sequence-based reagent | Actinß1-reverse | Bioneer | RT-qPCR primer | GGTGGACAGTGAGGCCAGGAT |
| Sequence-based reagent | Pkm2-forward | Bioneer | RT-qPCR primer | TCGCATGCAGCACCTGATT |
| Sequence-based reagent | Pkm2-reverse | Bioneer | RT-qPCR primer | CCTCGAATAGCTGCAAGTGGTA |
| Sequence-based reagent | Hk2-forward | Bioneer | RT-qPCR primer | TGATCGCCTGCTTATTCACGG |
| Sequence-based reagent | Hk2-reverse | Bioneer | RT-qPCR primer | AACCGCCTAGAAATCTCCAGA |
| Sequence-based reagent | Hif1a-forward | Bioneer | RT-qPCR primer | ACCTTCATCGGAAACTCCAAAG |
| Sequence-based reagent | Hif1a-reverse | Bioneer | RT-qPCR primer | CTGTTAGGCTGGGAAAAGTTAGG |
| Sequence-based reagent | Psmb8-forward | Bioneer | Genotyping primer | TTGGTACTGTGGCTTTCGCTTTC |
| Sequence-based reagent | Psmb8-reverse | Bioneer | Genotyping primer | ACACTCCTTCCTCTGTGCCACC |
| Sequence-based reagent | Psmb9-forward | Bioneer | Genotyping primer | GACCTTGAGTCGGTCACCTCC |
| Sequence-based reagent | Psmb9-reverse | Bioneer | Genotyping primer | CACTTAGGGCCACCAGCTTCC |
| Sequence-based reagent | Psmb10-forward | Bioneer | Genotyping primer | ACGCGAGTCACCCCA ATGTTT |
| Sequence-based reagent | Psmb10-reverse | Bioneer | Genotyping primer | CGCCACAACCGAATCGTTAGT |
| Sequence-based reagent | Psmb8-gRNA forward | Bioneer | CRISPR/Cas9 | TCGGGGGCAGCGGCCCGAGTGGG |
| Sequence-based reagent | Psmb8-gRNA reverse | Bioneer | CRISPR/Cas9 | CCAGGGCAGCCCACTCGGGCCGC |
| Sequence-based reagent | Psmb9-gRNA forward | Bioneer | CRISPR/Cas9 | GGAGTTTGACGGGGGTGTCGTGG |
| Sequence-based reagent | Psmb9-gRNA reverse | Bioneer | CRISPR/Cas9 | CCCACCACGACACCCCCGTCAAA |
| Sequence-based reagent | Psmb10-gRNA #3 forward | Bioneer | CRISPR/Cas9 | CACCGAACACGTCCTTCCGGGACTT |
| Sequence-based reagent | Psmb10-gRNA #3 reverse | Bioneer | CRISPR/Cas9 | AAACAAGTCCCGGAAGGACGTGTTC |
| Sequence-based reagent | Psmb10-gRNA #5 forward | Bioneer | CRISPR/Cas9 | CACCGCTGCCAGAGGAATGCGTCCT |
| Sequence-based reagent | Psmb10-gRNA #5 reverse | Bioneer | CRISPR/Cas9 | AAACAGGACGCATTCCTCTGGCAGC |
Mice
Information of mouse strains used in the experiments is listed in Key resources table. Psmb8-/-,9-/-,10-/- triple knock-out (Psmb-tko) and Tyrp1-CreERT2 mice were generated in this study. The Psmb-tko mice were generated using the CRISPR/Cas9 system, as it was described in a previous report (Kim et al., 2017). The genetic manipulations resulted in 25, 8, and 22 nucleotide (nt) deletions in mouse Psmb8, Psmb9, and Psmb10 genes, respectively (Figure 6—figure supplement 2). The sequences of guide RNAs used for introducing the deletions are provided in Key resources table. The Tyrp1-CreERT2 mice were generated following the same procedure reported previously (Mori et al., 2002). The transgenic mice were established by microinjection of the 7.3 kb NotI DNA segment of Tyrp1-CreERT2 into C57BL/6 J mouse embryos (two-cell stage). These injected embryonic cells were then injected into the inner cell mass of ICR mouse embryos. The tails of mice born from the surrogate mice were isolated for the genotyping with the primers listed in Key resources table. Two resulting F1 chimeric male mice carrying the transgene were crossed to C57BL6/J female mice to obtain an F2 generation with the heterozygous Tyrp1-CreERT2 mice.
To generate the cko mice, the mice having the floxed (fl) target gene alleles were bred with the mice expressing various Cre recombinases. To tracing of the cells experienced the Cre-dependent recombination at target gene loci, the mice were crossed with the R26EYFP and R26tdTom mice, and the cells experienced the Cre-dependent recombination of target sites were visualized by the fluorescence of the reporters. Experiments using the mice were carried out according to the guidance of Institutional Animal Care and Use Committee (IACUC) of KAIST (KA-2014–20). All mice used in this study were maintained in a specific pathogen-free facility of KAIST Laboratory Animal Resource Center.
Cryosections and immunohistochemistry
Pregnant and postnatal mice were euthanized after the anesthesia by intraperitoneal injection of tribromoethanol (Avertin, Sigma). The euthanized postnatal mice were perfused with phosphate buffered saline (PBS, pH7.5) containing 0.1% heparin (Millipore) and then with 4% paraformaldehyde (PFA, Sigma) in PBS. The eyes were isolated from the mice for further fixation in 4% PFA/PBS solution at 4°C for 2 hr. The embryos were isolated from the pregnant mice and fixed in 4% PFA/PBS solution at 4°C for 4 hr. The eyes and embryonic heads were then transferred to 20% sucrose/PBS solution for the incubation at 4°C for 16 hr before embedding in the Tissue-Tek OCT compound (Sakura). Cryosections (10–14 μm) of the frozen embryonic heads and postnatal mouse retinas were obtained and stained with hematoxylin and eosin (H&E) solutions for histologic examinations.
For immunohistochemistry, the sections were incubated for 1 hr in a blocking solution containing 10% normal donkey serum in PBS containing 0.2% Triton X-100. The sections were incubated with the primary antibodies at 4°C for 16 hr, and further stained with Alexa488-, Cy3-, or Alexa647-conjugated secondary antibodies (Jackson ImmunoResearch Laboratories) at room temperature (RT) for 1 hr. The antibodies are listed in Key resources table. Fluorescent images were obtained by confocal microscope (Fluoview FV1000 and FV3000; Olympus).
For the detection of proliferating cells in the embryos or neonatal mouse retinas, pregnant and neonatal mice were injected with 5-bromo-2′-deoxyuridine (EdU; 50 mg/kg, ThermoFisher). EdU was detected by incubating in Click-iT EdU Alexa Fluor 647 (Thermo Fisher Scientific) according to manufacturer’s instructions. Alternatively, the mice were injected with 5-chloro-2′-deoxyuridine (CldU; 30 mg/kg, Sigma) and 5-iodo-2′-deoxyuridine (IdU; 30 mg/kg, Sigma) into their peritoneal cavity for the indicated time periods prior to sample collection. The eyes were isolated from the mice and the eye sections were post-fixed in 4% PFA/PBS for 5 min, and washed three times with PBS with Triton X-100 0.2%. The sections were then incubated with 2 N HCl for 30 min, neutralized with borate buffer (pH 8.0) for 5 min (three times, 10 min) at room, followed by rinses with PBS (three times, 10 min). The sections were then subjected to the immunohistochemistry procedures described above.
Reverse transcription-quantitative polymerase chain reaction analysis
Total RNA from mouse retinas were isolated using easy-BLUE Total RNA Extraction Kit (iNtRON). About 1 μg of total RNA was reverse transcribed using SuperiorScript III Master Mix (Enzynomics) according to the manufacturer’s protocol. Real-time quantitative polymerase chain reaction (PCR) (RT-qPCR) was performed with TOPreal qPCR 2 X PreMIX (Enzynomics). The RT-qPCR was performed at 95°C for 10 min, followed by 50 cycles of 95°C for 15 s and 60°C for 15 s. Relative expression levels of gene of interest were calculated according to the 2−ΔΔCt method against β-actin mRNA. Primer sequences are listed in Key resources table.
Quantification of relative telomere lengths
Genomic DNA (gDNA) were extracted from mouse retinas by lysing the cells in DirectPCR Lysis Reagent (Viagen Biotech) supplemented with RNaseA (2 mg/ml, Bioneer) and proteinase-K (2 mg/ml, Roche), and then were purified further by the extraction with phenol-chloroform-isoamyl alcohol (25:24:1 (v/v); Sigma) followed by precipitation with 0.3 M (final) sodium acetate (pH 5.2) and 0.7 volume isopropanol. The lengths of telomeres in the gDNA dissolved in Tris-EDTA (pH 8.0) solution were then assessed by Relative mouse Telomere Length quantification qPCR assay kit (ScienCell Research Laboratories) according to the manufacturer’s protocol.
Western blot analysis
Total protein was extracted from mouse retinas with RIPA buffer (50 mM Tris [pH 8.0], 150 mM NaCl, 1.0% NP40, 0.5% sodium deoxycholate, 0.1% sodium dodecyl sulfate [SDS]) supplemented with the protease and phosphatase inhibitor cocktail (Roche). For separation of proteins, the cell lysates containing 30 μg proteins were analyzed by 8–15% SDS-polyacrylamide gel electrophoresis (SDS-PAGE) prior to the transfer onto polyvinylidene difluoride membranes. The membranes were blocked with 5% skim milk in Tris-buffered saline containing 0.1% Tween-20 (TBST, pH 7.4) at RT for 1 hr. The membranes were incubated at 4°C for 16 hr with primary antibodies listed in Key resources table, washed with the TBST at RT three times (10 min each), and incubated with the horseradish peroxidase-conjugated secondary antibodies at RT for 1 hr. Reactive bands were detected using SuperSignal West Pico Chemiluminescent Substrate or SuperSignal West Femto Maximum Sensitivity Substrate (Thermo Fisher Scientific).
FACS analysis
Mouse retinas were collected in 1 ml Hank’s Balanced Salt Solution (HBSS; Life Technologies) after enucleating the lens from the eyes, and transferred into HBSS containing 0.1% Trypsin and DNase I (100 μg/ml; Sigma) followed by the incubation at 37°C for 30 min. Dissociated retinal cells were gently triturated in HBSS with 2% FCS, filtered through a 70 μm strainer before FACS analysis. The R26tdTom-positive cells were then analyzed by the BD Fortessa analyzer (BD Biosciences) or collected by the BD FACSAria cell sorter (BD Biosciences).
RPC neurosphere culture
The retinas of E13 mouse embryos were isolated and incubated in a dissociation solution (DMEM containing 0.1% Trypsin and DNase I [100 μg/ml; Sigma]) at 37°C for 30 min. The aggregates were further dissociated into single cells using Accutase and passed through a 70 μm cell strainer. The R26tdTom-positive cells were then collected by FACS for subsequent culture in DMEM/F12 medium containing 0.9% (w/v) methylcellulose matrix (Sigma), N2 supplement (GIBCO), B27(GIBCO), 2 mM L-glutamine (GIBCO), 100 U/ml penicillin, and 100 μg/ml streptomycin (GIBCO) supplemented with 10 ng/ml fibroblast growth factor 2 (Sigma) and 20 ng/ml epidermal growth factor (Sigma). Then the cells were cultured for 1–4 weeks and the number of primary neurospheres was counted every 3 days with microscopic observation.
ATP assay
ATP concentration was measured using the ENLIGHTEN ATP assay system (Promega). In brief, mouse retinas were homogenized in a buffer (0.25 M sucrose and 10 mM HEPES-NaOH, pH 7.4) and centrifuged at 3000 rpm at 4°C for 10 min. The supernatant (200 μl) was added to an equal volume of 10% trichloroacetic acid (Sigma) and centrifuged at 10,000 rpm at 4°C for 10 min. After centrifugation, 300 μl of the supernatant was added with 200 μl of neutralization buffer (1 M Tris-acetate buffer, pH 7.5) and then was diluted 30-folds in deionized water prior to the measurement of luminescence using the MICROLUMAT LB96P Reader (Berthold).
Lactate assay
Lactate concentration was measured using the Lactate-Glo Assay Kit (Promega) according to the manufacturer’s protocol. Briefly, 1 mg of the retina were homogenized in 400 μl of homogenization buffer (50 mM Tris, pH 7.5) with 50 μl of inactivation solution (0.6 N HCL) and immediately added to 50 μl of neutralization buffer. Before recording luminescence, 50 μl of samples were transferred into a white 96-well plate and added 50 μl of lactate detection reagent to the well, mix for 60 s, and incubate at RT for 1 hr. Luminescence was recorded with the MICROLUMAT LB96P Reader (Berthold).
Statistical analysis
Statistical analysis was performed by Prism Software (GraphPad) measurement tools. Data from statistical analysis are presented as the mean ± SD. Student’s t test was used to determine the significant difference between two genotypes and one-way ANOVA with Tukey’s post-test used to determine the significant differences among multiple groups. p-Values were calculated using a two-tailed unpaired t-test. p < 0.05 was considered statistically significant. *p < 0.05; **p < 0.01; ***p < 0.005; ****p < 0.001.
Acknowledgements
This work was supported by the National Research Foundation of Korea (NRF) grants funded by Korean Ministry of Science and ICT (MSIT) (2017R1A2B3002862 and 2018R1A5A1024261; JWK); the grant funded by Samsung Foundation of Science and Technology (SSTF-BA1802-10; JWK); and the grant of Czech Science Foundation (21–27364S).
Funding Statement
The funders had no role in study design, data collection and interpretation, or the decision to submit the work for publication.
Contributor Information
Jin Woo Kim, Email: jinwookim@kaist.ac.kr.
Paola Bovolenta, CSIC-UAM, Spain.
Carlos Isales, Medical College of Georgia at Augusta University, United States.
Funding Information
This paper was supported by the following grants:
National Research Foundation of Korea 2017R1A2B3002862 to Jin Woo Kim.
National Research Foundation of Korea 2018R1A5A1024261 to Jin Woo Kim.
Samsung Science and Technology Foundation SSTF-BA1802-10 to Jin Woo Kim.
Czech Science Foundation 21-27364S to Zbynek Kozmik.
Additional information
Competing interests
No competing interests declared.
No competing interests declared.
Author contributions
Conceptualization, Data curation, Formal analysis, Investigation, Methodology, Writing – original draft.
Formal analysis, Investigation, Methodology.
Methodology, Resources.
Methodology, Resources.
Methodology, Resources.
Resources.
Resources.
Methodology, Resources.
Conceptualization, Data curation, Funding acquisition, Project administration, Supervision, Writing – original draft, Writing – review and editing.
Ethics
Experiments using the mice were carried out according to the guidance of Institutional Animal Care and Use Committee (IACUC) of KAIST (KA-2014-20).
Additional files
Data availability
All data generated or analysed during this study are included in the manuscript and supporting file; Source Data files have been provided for Figures 1 and 2.
References
- Agathocleous M, Love NK, Randlett O, Harris JJ, Liu J, Murray AJ, Harris WA. Metabolic differentiation in the embryonic retina. Nature Cell Biology. 2012;14:859–864. doi: 10.1038/ncb2531. [DOI] [PMC free article] [PubMed] [Google Scholar]
- Alexiades MR, Cepko C. Quantitative analysis of proliferation and cell cycle length during development of the rat retina. Developmental Dynamics. 1996;205:293–307. doi: 10.1002/(SICI)1097-0177(199603)205:3<293::AID-AJA9>3.0.CO;2-D. [DOI] [PubMed] [Google Scholar]
- Aydin IT, Beermann F. A mart-1::Cre transgenic line induces recombination in melanocytes and retinal pigment epithelium. Genesis. 2011;49:403–409. doi: 10.1002/dvg.20725. [DOI] [PubMed] [Google Scholar]
- Belanger MC, Robert B, Cayouette M. Msx1-Positive Progenitors in the Retinal Ciliary Margin Give Rise to Both Neural and Non-neural Progenies in Mammals. Developmental Cell. 2017;40:137–150. doi: 10.1016/j.devcel.2016.11.020. [DOI] [PubMed] [Google Scholar]
- Ben-Sahra I, Manning BD. mTORC1 signaling and the metabolic control of cell growth. Current Opinion in Cell Biology. 2017;45:72–82. doi: 10.1016/j.ceb.2017.02.012. [DOI] [PMC free article] [PubMed] [Google Scholar]
- Bernardi R, Guernah I, Jin D, Grisendi S, Alimonti A, Teruya-Feldstein J, Cordon-Cardo C, Simon MC, Rafii S, Pandolfi PP. PML inhibits HIF-1alpha translation and neoangiogenesis through repression of mTOR. Nature. 2006;442:779–785. doi: 10.1038/nature05029. [DOI] [PubMed] [Google Scholar]
- Calado RT, Dumitriu B. Telomere dynamics in mice and humans. Seminars in Hematology. 2013;50:165–174. doi: 10.1053/j.seminhematol.2013.03.030. [DOI] [PMC free article] [PubMed] [Google Scholar]
- Cepko C. Intrinsically different retinal progenitor cells produce specific types of progeny. Nature Reviews. Neuroscience. 2014;15:615–627. doi: 10.1038/nrn3767. [DOI] [PubMed] [Google Scholar]
- Cerychova R, Pavlinkova G. HIF-1, Metabolism, and Diabetes in the Embryonic and Adult Heart. Frontiers in Endocrinology. 2018;9:460. doi: 10.3389/fendo.2018.00460. [DOI] [PMC free article] [PubMed] [Google Scholar]
- Choi J-H, Jo HS, Lim S, Kim H-T, Lee KW, Moon KH, Ha T, Kwak SS, Kim Y, Lee EJ, Joe CO, Kim JW. mTORC1 accelerates retinal development via the immunoproteasome. Nature Communications. 2018;9:2502. doi: 10.1038/s41467-018-04774-9. [DOI] [PMC free article] [PubMed] [Google Scholar]
- Clark BS, Stein-O’Brien GL, Shiau F, Cannon GH, Davis-Marcisak E, Sherman T, Santiago CP, Hoang TV, Rajaii F, James-Esposito RE, Gronostajski RM, Fertig EJ, Goff LA, Blackshaw S. Single-Cell RNA-Seq Analysis of Retinal Development Identifies NFI Factors as Regulating Mitotic Exit and Late-Born Cell Specification. Neuron. 2019;102:1111–1126. doi: 10.1016/j.neuron.2019.04.010. [DOI] [PMC free article] [PubMed] [Google Scholar]
- Cleal K, Baird DM. Catastrophic Endgames: Emerging Mechanisms of Telomere-Driven Genomic Instability. Trends in Genetics. 2020;36:347–359. doi: 10.1016/j.tig.2020.02.001. [DOI] [PubMed] [Google Scholar]
- Das G, Clark AM, Levine EM. Cyclin D1 inactivation extends proliferation and alters histogenesis in the postnatal mouse retina. Developmental Dynamics. 2012;241:941–952. doi: 10.1002/dvdy.23782. [DOI] [PMC free article] [PubMed] [Google Scholar]
- de Melo J, Miki K, Rattner A, Smallwood P, Zibetti C, Hirokawa K, Monuki ES, Campochiaro PA, Blackshaw S. Injury-independent induction of reactive gliosis in retina by loss of function of the LIM homeodomain transcription factor Lhx2. PNAS. 2012;109:4657–4662. doi: 10.1073/pnas.1107488109. [DOI] [PMC free article] [PubMed] [Google Scholar]
- Düvel K, Yecies JL, Menon S, Raman P, Lipovsky AI, Souza AL, Triantafellow E, Ma Q, Gorski R, Cleaver S, Vander Heiden MG, MacKeigan JP, Finan PM, Clish CB, Murphy LO, Manning BD. Activation of a metabolic gene regulatory network downstream of mTOR complex 1. Molecular Cell. 2010;39:171–183. doi: 10.1016/j.molcel.2010.06.022. [DOI] [PMC free article] [PubMed] [Google Scholar]
- Eagle RC, Shields JA, Shields CL, Wood MG. Hamartomas of the iris and ciliary epithelium in tuberous sclerosis complex. Archives of Ophthalmology. 2000;118:711–715. doi: 10.1001/archopht.118.5.711. [DOI] [PubMed] [Google Scholar]
- Fischer AJ, Bosse JL, El-Hodiri HM. The ciliary marginal zone (CMZ) in development and regeneration of the vertebrate eye. Experimental Eye Research. 2013;116:199–204. doi: 10.1016/j.exer.2013.08.018. [DOI] [PubMed] [Google Scholar]
- Fuchs Y, Steller H. Programmed cell death in animal development and disease. Cell. 2011;147:742–758. doi: 10.1016/j.cell.2011.10.033. [DOI] [PMC free article] [PubMed] [Google Scholar]
- Gao X, Zhang Y, Arrazola P, Hino O, Kobayashi T, Yeung RS, Ru B, Pan D. Tsc tumour suppressor proteins antagonize amino-acid-TOR signalling. Nature Cell Biology. 2002;4:699–704. doi: 10.1038/ncb847. [DOI] [PubMed] [Google Scholar]
- Ha T, Moon KH, Dai L, Hatakeyama J, Yoon K, Park HS, Kong YY, Shimamura K, Kim JW. The Retinal Pigment Epithelium Is a Notch Signaling Niche in the Mouse Retina. Cell Reports. 2017;19:351–363. doi: 10.1016/j.celrep.2017.03.040. [DOI] [PubMed] [Google Scholar]
- Hägglund A-C, Jones I, Carlsson L. A novel mouse model of anterior segment dysgenesis (ASD): conditional deletion of Tsc1 disrupts ciliary body and iris development. Disease Models & Mechanisms. 2017;10:245–257. doi: 10.1242/dmm.028605. [DOI] [PMC free article] [PubMed] [Google Scholar]
- Harris WA, Perron M. Molecular recapitulation: the growth of the vertebrate retina. Tl J Dev Biol. 1998;42:299–304. [PubMed] [Google Scholar]
- He D, Wu H, Xiang J, Ruan X, Peng P, Ruan Y, Chen Y-G, Wang Y, Yu Q, Zhang H, Habib SL, De Pinho RA, Liu H, Li B. Gut stem cell aging is driven by mTORC1 via a p38 MAPK-p53 pathway. Nature Communications. 2020;11:37. doi: 10.1038/s41467-019-13911-x. [DOI] [PMC free article] [PubMed] [Google Scholar]
- Hidema S, Fukuda T, Date S, Tokitake Y, Matsui Y, Sasaki H, Nishimori K. Transgenic expression of Telomerase reverse transcriptase (Tert) improves cell proliferation of primary cells and enhances reprogramming efficiency into the induced pluripotent stem cell. Bioscience, Biotechnology, and Biochemistry. 2016;80:1925–1933. doi: 10.1080/09168451.2016.1191330. [DOI] [PubMed] [Google Scholar]
- Hoang T, Wang J, Boyd P, Wang F, Santiago C, Jiang L, Yoo S, Lahne M, Todd LJ, Jia M, Saez C, Keuthan C, Palazzo I, Squires N, Campbell WA, Rajaii F, Parayil T, Trinh V, Kim DW, Wang G, Campbell LJ, Ash J, Fischer AJ, Hyde DR, Qian J, Blackshaw S. Gene regulatory networks controlling vertebrate retinal regeneration. Science. 2020;370:eabb8598. doi: 10.1126/science.abb8598. [DOI] [PMC free article] [PubMed] [Google Scholar]
- Homem CCF, Repic M, Knoblich JA. Proliferation control in neural stem and progenitor cells. Nature Reviews. Neuroscience. 2015;16:647–659. doi: 10.1038/nrn4021. [DOI] [PMC free article] [PubMed] [Google Scholar]
- Inoki K, Li Y, Zhu T, Wu J, Guan KL. TSC2 is phosphorylated and inhibited by Akt and suppresses mTOR signalling. Nature Cell Biology. 2002;4:648–657. doi: 10.1038/ncb839. [DOI] [PubMed] [Google Scholar]
- Ivan M, Kondo K, Yang H, Kim W, Valiando J, Ohh M, Salic A, Asara JM, Lane WS, Kaelin WG., Jr HIFalpha targeted for VHL-mediated destruction by proline hydroxylation: implications for O2 sensing. Science. 2001;292:464–468. doi: 10.1126/science.1059817. [DOI] [PubMed] [Google Scholar]
- Jaakkola P, Mole DR, Tian YM, Wilson MI, Gielbert J, Gaskell SJ, von Kriegsheim A, Hebestreit HF, Mukherji M, Schofield CJ, Maxwell PH, Pugh CW, Ratcliffe PJ. Targeting of HIF-alpha to the von Hippel-Lindau ubiquitylation complex by O2-regulated prolyl hydroxylation. Science. 2001;292:468–472. doi: 10.1126/science.1059796. [DOI] [PubMed] [Google Scholar]
- Jorstad NL, Wilken MS, Grimes WN, Wohl SG, VandenBosch LS, Yoshimatsu T, Wong RO, Rieke F, Reh TA. Stimulation of functional neuronal regeneration from Müller glia in adult mice. Nature. 2017;548:103–107. doi: 10.1038/nature23283. [DOI] [PMC free article] [PubMed] [Google Scholar]
- Keith B, Johnson RS, Simon MC. HIF1α and HIF2α: sibling rivalry in hypoxic tumour growth and progression. Nature Reviews. Cancer. 2011;12:9–22. doi: 10.1038/nrc3183. [DOI] [PMC free article] [PubMed] [Google Scholar]
- Kim DH, Sarbassov DD, Ali SM, King JE, Latek RR, Erdjument-Bromage H, Tempst P, Sabatini DM. mTOR interacts with raptor to form a nutrient-sensitive complex that signals to the cell growth machinery. Cell. 2002;110:163–175. doi: 10.1016/s0092-8674(02)00808-5. [DOI] [PubMed] [Google Scholar]
- Kim Y, Lim S, Ha T, Song Y-H, Sohn Y-I, Park D-J, Paik S-S, Kim-Kaneyama J-R, Song M-R, Leung A, Levine EM, Kim I-B, Goo YS, Lee S-H, Kang KH, Kim JW. The LIM protein complex establishes a retinal circuitry of visual adaptation by regulating Pax6 α-enhancer activity. eLife. 2017;6:e21303. doi: 10.7554/eLife.21303. [DOI] [PMC free article] [PubMed] [Google Scholar]
- Klimova L, Lachova J, Machon O, Sedlacek R, Kozmik Z. Generation of mRx-Cre transgenic mouse line for efficient conditional gene deletion in early retinal progenitors. PLOS ONE. 2013;8:e63029. doi: 10.1371/journal.pone.0063029. [DOI] [PMC free article] [PubMed] [Google Scholar]
- Kuilman T, Michaloglou C, Mooi WJ, Peeper DS. The essence of senescence. Genes & Development. 2010;24:2463–2479. doi: 10.1101/gad.1971610. [DOI] [PMC free article] [PubMed] [Google Scholar]
- Lahne M, Nagashima M, Hyde DR, Hitchcock PF. Reprogramming Müller Glia to Regenerate Retinal Neurons. Annual Review of Vision Science. 2020;6:171–193. doi: 10.1146/annurev-vision-121219-081808. [DOI] [PMC free article] [PubMed] [Google Scholar]
- Levine EM, Close J, Fero M, Ostrovsky A, Reh TA. p27(Kip1) regulates cell cycle withdrawal of late multipotent progenitor cells in the mammalian retina. Developmental Biology. 2000;219:299–314. doi: 10.1006/dbio.2000.9622. [DOI] [PubMed] [Google Scholar]
- Lutty GA, McLeod DS. Development of the hyaloid, choroidal and retinal vasculatures in the fetal human eye. Progress in Retinal and Eye Research. 2018;62:58–76. doi: 10.1016/j.preteyeres.2017.10.001. [DOI] [PMC free article] [PubMed] [Google Scholar]
- Madiraju AK, Erion DM, Rahimi Y, Zhang X-M, Braddock DT, Albright RA, Prigaro BJ, Wood JL, Bhanot S, MacDonald MJ, Jurczak MJ, Camporez J-P, Lee H-Y, Cline GW, Samuel VT, Kibbey RG, Shulman GI. Metformin suppresses gluconeogenesis by inhibiting mitochondrial glycerophosphate dehydrogenase. Nature. 2014;510:542–546. doi: 10.1038/nature13270. [DOI] [PMC free article] [PubMed] [Google Scholar]
- Marcucci F, Murcia-Belmonte V, Wang Q, Coca Y, Ferreiro-Galve S, Kuwajima T, Khalid S, Ross ME, Mason C, Herrera E. The Ciliary Margin Zone of the Mammalian Retina Generates Retinal Ganglion Cells. Cell Reports. 2016;17:3135–3164. doi: 10.1016/j.celrep.2016.11.016. [DOI] [PMC free article] [PubMed] [Google Scholar]
- Marquardt T, Ashery-Padan R, Andrejewski N, Scardigli R, Guillemot F, Gruss P. Pax6 is required for the multipotent state of retinal progenitor cells. Cell. 2001;105:43–55. doi: 10.1016/S0092-8674(01)00295-1. [DOI] [PubMed] [Google Scholar]
- Milea D, Burillon C. Aniridia in a patient with tuberous sclerosis. British Journal of Ophthalmology. 1997;81:802c. doi: 10.1136/bjo.81.9.802c. [DOI] [PMC free article] [PubMed] [Google Scholar]
- Moon KH, Kim HT, Lee D, Rao MB, Levine EM, Lim DS, Kim JW. Differential Expression of NF2 in Neuroepithelial Compartments Is Necessary for Mammalian Eye Development. Developmental Cell. 2018;44:13–28. doi: 10.1016/j.devcel.2017.11.011. [DOI] [PMC free article] [PubMed] [Google Scholar]
- Mori M, Metzger D, Garnier JM, Chambon P, Mark M. Site-specific somatic mutagenesis in the retinal pigment epithelium. Vestigative Ophthalmology & Visual Science. 2002;43:1384–1388. [PubMed] [Google Scholar]
- Obernier K, Alvarez-Buylla A. Neural stem cells: origin, heterogeneity and regulation in the adult mammalian brain. Development. 2019;146:dev156059. doi: 10.1242/dev.156059. [DOI] [PMC free article] [PubMed] [Google Scholar]
- Ohnuma S, Harris WA. Neurogenesis and the cell cycle. Neuron. 2003;40:199–208. doi: 10.1016/S0896-6273(03)00632-9. [DOI] [PubMed] [Google Scholar]
- Owen MR, Doran E, Halestrap AP. Evidence that metformin exerts its anti-diabetic effects through inhibition of complex 1 of the mitochondrial respiratory chain. Biochemical Journal. 2000;348:607–614. doi: 10.1042/bj3480607. [DOI] [PMC free article] [PubMed] [Google Scholar]
- Rowan S, Cepko CL. Genetic analysis of the homeodomain transcription factor Chx10 in the retina using a novel multifunctional BAC transgenic mouse reporter. Developmental Biology. 2004;271:388–402. doi: 10.1016/j.ydbio.2004.03.039. [DOI] [PubMed] [Google Scholar]
- Saint-Geniez M, D’amore PA. Development and pathology of the hyaloid, choroidal and retinal vasculature. The International Journal of Developmental Biology. 2004;48:1045–1058. doi: 10.1387/ijdb.041895ms. [DOI] [PubMed] [Google Scholar]
- Saxton RA, Sabatini DM. mTOR Signaling in Growth, Metabolism, and Disease. Cell. 2017;169:361–371. doi: 10.1016/j.cell.2017.03.035. [DOI] [PubMed] [Google Scholar]
- Shay JW. Role of Telomeres and Telomerase in Aging and Cancer. Cancer Discovery. 2016;6:584–593. doi: 10.1158/2159-8290.CD-16-0062. [DOI] [PMC free article] [PubMed] [Google Scholar]
- Srinivasan Y, Lovicu FJ, Overbeek PA. Lens-specific expression of transforming growth factor beta1 in transgenic mice causes anterior subcapsular cataracts. The Journal of Clinical Investigation. 1998;101:625–634. doi: 10.1172/JCI1360. [DOI] [PMC free article] [PubMed] [Google Scholar]
- Thien A, Prentzell MT, Holzwarth B, Kläsener K, Kuper I, Boehlke C, Sonntag AG, Ruf S, Maerz L, Nitschke R, Grellscheid S-N, Reth M, Walz G, Baumeister R, Neumann-Haefelin E, Thedieck K. TSC1 activates TGF-β-Smad2/3 signaling in growth arrest and epithelial-to-mesenchymal transition. Developmental Cell. 2015;32:617–630. doi: 10.1016/j.devcel.2015.01.026. [DOI] [PubMed] [Google Scholar]
- Vander Heiden MG, Cantley LC, Thompson CB. Understanding the Warburg effect: the metabolic requirements of cell proliferation. Science. 2009;324:1029–1033. doi: 10.1126/science.1160809. [DOI] [PMC free article] [PubMed] [Google Scholar]
- Varghese AJ, Gulyas S, Mohindra JK. Hypoxia-dependent reduction of 1-(2-nitro-1-imidazolyl)-3-methoxy-2-propanol by Chinese hamster ovary cells and KHT tumor cells in vitro and in vivo. Cancer Research. 1976;36:3761–3765. [PubMed] [Google Scholar]
- Vaux DL, Korsmeyer SJ. Cell death in development. Cell. 1999;96:245–254. doi: 10.1016/s0092-8674(00)80564-4. [DOI] [PubMed] [Google Scholar]
- Wick AN, Drury DR, Nakada HI, Wolfe JB. Localization of the primary metabolic block produced by 2-deoxyglucose. The Journal of Biological Chemistry. 1957;224:963–969. [PubMed] [Google Scholar]
- Willbold E, Rothermel A, Tomlinson S, Layer PG. Müller glia cells reorganize reaggregating chicken retinal cells into correctly laminated in vitro retinae. Glia. 2000;29:45–57. [PubMed] [Google Scholar]
- Xie Y, Zhao Y, Shi L, Li W, Chen K, Li M, Chen X, Zhang H, Li T, Matsuzawa-Ishimoto Y, Yao X, Shao D, Ke Z, Li J, Chen Y, Zhang X, Cui J, Cui S, Leng Q, Cadwell K, Li X, Wei H, Zhang H, Li H, Xiao H. Gut epithelial TSC1/mTOR controls RIPK3-dependent necroptosis in intestinal inflammation and cancer. The Journal of Clinical Investigation. 2020;130:2111–2128. doi: 10.1172/JCI133264. [DOI] [PMC free article] [PubMed] [Google Scholar]